dedicated truck lanes investigated - thesis.eur.nl reinout polder… · web viewdedicated truck...
TRANSCRIPT
Dedicated Truck Lanes Investigated:
Discovering the potential to serve as a corridor for re-export from the Port of Rotterdam
By Reinout Polders 302678
Erasmus University Rotterdam
Master Program: Economics & Business
Specialization: Urban, Port and Transport Economics
Supervisor: dr. P.A. van Reeven
17 November 2011
Keywords: Second Maasvlakte, Dedicated Truck Lanes, Economic effects
Abstract
The expected container volume increase that will arise when the second Maasvlakte is
completed requires major investments in the transport sector. This thesis will argue that road
transport has more potential to cope with the increase in container volume than barges and rail
transport. Dedicated truck lanes can drastically increase infrastructure capacity while limiting
the external costs for society that are created by truck traffic. In order to develop the optimal
approach and methods for analyzing the effects of such an infrastructure project, a parallel
was drawn with the Betuwe-route. An extensive analysis including direct effects, indirect
effects and social costs pointed out that the proposed dedicated truck lane has a net benefit for
the Dutch economy.
I would like to thank dr. P.A. van Reeven for his useful comments regarding the structure as well as the content of this report.

Dedicated Truck Lanes Investigated
Table of contentIntroduction...........................................................................................................................................4
Chapter 1: Container flow expectations.................................................................................................61.1 Two alternatives...........................................................................................................................61.2 World economy............................................................................................................................71.3 Dutch Economy.............................................................................................................................81.4 Transport business........................................................................................................................91.5 Container Market.......................................................................................................................111.6 Summary....................................................................................................................................14
Chapter 2: Optimal infrastructure for truck transport..........................................................................15
2.1 External Costs.............................................................................................................................162.1.1 Air pollution.........................................................................................................................162.1.2 Noise pollution....................................................................................................................172.1.3 Safety...................................................................................................................................182.1.4 Congestion...........................................................................................................................19
2.2 Dedicated truck lanes.................................................................................................................202.2.3 Reduced travelling time and increased predictability..........................................................20
2.3 Proposed Highway Structure......................................................................................................212.4 Construction and Maintenance Costs.........................................................................................252.5 Summary....................................................................................................................................28
Chapter 3: Lessons from the Betuwe-route project.............................................................................303.1 The Betuwe-route: a short overview of its controversial history.................................................30
3.1.1 Introducing the Betuwe-route project.................................................................................303.1.2 The Dutch polder-model: first delays...................................................................................313.1.3 Execution of the project.......................................................................................................323.1.4 Anno 2011...........................................................................................................................32
3.2 Betuwe-route cost-benefit studies; what can be learned from these reports?...........................333.2.1 The too positive attitude towards rail transportation when compared to other modalities 333.2.2 Prediction good flows..........................................................................................................353.2.3 Arbitrary Multiplier..............................................................................................................383.2.4 Image effects.......................................................................................................................39
3.3 Conclusion..................................................................................................................................40Chapter 4: Recent methodology for evaluating infrastructure.............................................................42
4.1 Social Costs.................................................................................................................................424.2 Direct effect................................................................................................................................434.3 Indirect effects............................................................................................................................444.4 Summary....................................................................................................................................47
Chapter 5: Direct & Indirect effects......................................................................................................48
5.1 Direct effects..............................................................................................................................485.1.1 Estimating total excess demand..............................................................................................495.1.2 Predicting economic loss Zero Alternative...............................................................................50
Reinout PoldersPage 2
November 2011
Dedicated Truck Lanes Investigated
5.1.3 Summary.................................................................................................................................525.2 Indirect effects............................................................................................................................535.2.1 Description of the Model.........................................................................................................535.2.2 Test Results..............................................................................................................................57
5.2.3 Quantification of the indirect effect....................................................................................585.2.4 Summary.................................................................................................................................59
Chapter 6: Social Costs.........................................................................................................................606.1 Air pollution................................................................................................................................61
6.1.1 Empirical information..........................................................................................................626.1.2 Calculations.........................................................................................................................63
6.2 Noise pollution............................................................................................................................646.2.1 Empirical input.....................................................................................................................646.2.2 Calculations.........................................................................................................................66
6.3 Congestion for other road users.................................................................................................686.4 Safety..........................................................................................................................................706.5 Conclusion..................................................................................................................................71
Chapter 7: Synthesis and Reflection.....................................................................................................737.1 Extra alternative.........................................................................................................................737.2 Estimating social costs difference...............................................................................................75
7.2.1 Air pollution.........................................................................................................................757.2.2Congestion costs...................................................................................................................767.2.3 Safety Costs.........................................................................................................................787.3 Conclusion..............................................................................................................................80
Chapter 8: Summary.............................................................................................................................81
Chapter 9: Limitations.........................................................................................................................829.1 Direct Effects Analysis.................................................................................................................829.2 Indirect Effects Analysis..............................................................................................................839.3 Social costs Analysis....................................................................................................................83
9.3.1 Air pollution.........................................................................................................................839.3.2 Noise pollution.....................................................................................................................839.3.3 Extra congestion for other users..........................................................................................849.3.4 Accident costs......................................................................................................................84
Reference List.......................................................................................................................................85Appendix..............................................................................................................................................87
Reinout PoldersPage 3
November 2011
Dedicated Truck Lanes Investigated
Introduction
The first terminals of the long anticipated second Maasvlakte are expected to open their business
within the next three years, signaling a start of a massive increase in container handling capacity. The
current container capacity of the port of Rotterdam is far below the major ports in Asia; the second
Maasvlakte should restore the status of Rotterdam as a global port of importance. While much effort
has been put in creating this capacity, little attention has been given to the process that takes place
after receiving the containers from the ships. It can be expected that a major share of the increase in
total volume of containers handled will have to be transported to the rest of Europe. The current
transport capacity of the three most important modes for continental transport will not be sufficient
to cope with this increase in containers. While the barge sector faces inefficiency problems due to
defragmentation of the market, rail and road transport are under pressure of infrastructure capacity
constraints. The shortage in capacity for re-export is potentially very harmful for the competitive
strength of the Rotterdam port. Failure to adequately deal with the expected container growth could
mean that containers will be shipped to other European ports, which would make the investments in
the Maasvlakte 2 inefficient. Infrastructure investments will thus be necessary.
One of the main motivations for investing in rail and barges in the past two decades was the negative
perception of trucks that has primarily been created by externalities. This thesis will show that
dedicated truck lanes have the potential to overcome these externalities. Little research has been
done to assess the usefulness of the dedicated truck lane concept in the Netherlands. Empirical
studies from the United States are of low relevance for the Netherlands. The environmental
awareness is much bigger in the Netherlands than in the United States. In addition, the higher
density of Dutch economic activity is a constraint for infrastructure investments. This report
contributes to economic research by investigating the desirability of dedicated truck lanes in the
Dutch economy. The main purpose of this report is to open the discussion for road transport
investments, rather than to actually present a detailed infrastructure project. This is mainly due to
the fact that the methods that are used in this report are simplified in some cases; the scope of the
thesis not sufficiently big to include all effects.
In order to investigate the possibilities of the three main transport modes to cope with the increase
in container volume of the Maasvlakte 2, it is important to assess the growth potential of the three
main transport modes first. Chapter 1 will therefore compare the expected developments in the
container market with the growth potential of barges, rail and road transport. A detailed
argumentation behind the expected container volume increase will be given in the first paragraph.
This expectation will be compared with developments in the transport sector in two scenarios: the
Reinout PoldersPage 4
November 2011

Dedicated Truck Lanes Investigated
scenario with significant investments in road transport infrastructure and a zero alternative. As will
be made clear in this chapter, the road transport sector has the highest potential to cope with the
increase in container volume.
The second question that needs to be answered is; what is the optimal structure of the infrastructure
project? Transportation of goods is very important for the Dutch economy but unfortunately it is also
a source of external costs for society. As a result, infrastructure investments are often heavily
debated in political circles. The infrastructure project should therefore attempt to keep these social
costs as low as possible. The structure of the infrastructure project is a major determinant of the
magnitude of the external cost, hence the importance of critically assessing the optimal structure.
Developing expectations for infrastructure investments is a very complex issue; chapter three will
therefore investigate what can be learned from major infrastructure projects in the past. Given the
link with the first Maasvlakte investments, a parallel will be drawn with the Betuwe-route. The
Betuwe-route is a highly debated railway infrastructure project that stretches to the German border.
The first paragraph will summarize the controversial history of the decision making process for the
construction of the Betuwe-route shortly. After that, the chapter will continue with discussing the
most important economic reports that are concerned with predicting the effects of the Betuwe-
route. This chapter should give a clear overview of the components that are needed to create an
analysis that properly estimates the effects of major transportation infrastructure. The chapter also
provides information on the mistakes that have been made in the predictions for the Betuwe-route.
Chapter four will present how these mistakes will be avoided by this report; the methods used in the
initial studies for the Betuwe-route will be compared with up-to-date techniques to predict
infrastructure investment effects. The methodological framework of the analysis in this report will be
clear at the end of this chapter. Chapter 5 and 6 will present the actual analysis where the proposed
infrastructure investment is compared to the zero alternative. Chapter 7 continues with the synthesis
of the analysis. In addition, the obtained results will be reflected with a third alternative.
As mentioned earlier, the main purpose of this report is to open the discussion for road transport
investments, rather than to actually present a detailed infrastructure project. This is mainly due to
the fact that the methods that are used in this report are simplified in some cases; this is a result of
the scope of the thesis. Chapter 9 will present the shortcomings of the applied methods in this thesis,
and argue in which way these methods could be improved. As a whole, this thesis should serve as an
example for road transport infrastructure effects predications that are based on rationalism and logic
reasoning rather than subjective observations as was the case for the Betuwe-route.
Reinout PoldersPage 5
November 2011

Dedicated Truck Lanes Investigated
Chapter 1: Container flow expectations
The second Maasvlakte is aimed to drastically increase the total volume of containers that can be
handled by the Rotterdam port. The primary focus is to increase the container handling capacity in
the port; little attention has been given to the process afterwards. A container handling capacity
increase of this scale puts a huge pressure on the transport and logistics sector aimed to distribute
the goods around the Netherlands and the rest of Europe. It is a necessity to expand the current
infrastructure in order to make the second Maasvlakte investments worthwhile. This chapter will
give the expectation of the increase in container volume handled in the Rotterdam port up to 2040.
In addition, it will show the potential of the different modalities to cope with this increase. As will be
argued at the end of the chapter, infrastructure investments in road transport are the governments’
best bet to deal with the container increase.
1.1 Two alternativesAs is usual in most infrastructure investment projection reports, the analysis will compare the
proposed investment with a zero alternative. The zero alternative sketches the situation in which no
infrastructure investments are made. (This is not totally true for this report however. As will
explained in chapter 2, the government is already constructing some parts of the essential highway
for the port). The zero alternative in this case assumes that the full capacity of the Betuwe-route (rail
transport) is used; the remaining growth in containers is divided equally amongst barges and road
transport. This implies a relative loss for road transport compared to the other modalities. This
assumption is justified by the fact that road congestion will rise to disproportional heights in the case
there are no investments made in road capacity. The barge industry has room left to expand, yet to
cope with the full increase in container transport is too much. Both the barge industry as well as the
road transport industry will face difficulties in dealing with the container increase, leading to either a
reduced efficiency or significant higher costs due to the complexity of logistical operations. As a
result of this, it is highly likely that the Port of Rotterdam will lose competitiveness in relation to
other European ports. This has implications for the good flow analysis; total volume of goods that has
to be transported from and to the Rotterdam port is likely to be lower. For simplicity reasons, this
effect will be left out of the analysis. Predictions for a time span of 30 years are difficult as they are,
including too many effects increases the complexity to a point beyond the scope of this thesis. In
addition, it should be mentioned that this has negative implications for the road transport
infrastructure investment proposal. The zero alternative is likely to be estimated too high, which
means that the benefits of the road transport infrastructure investment alternative can be seen as a
worst case scenario estimation.
Reinout PoldersPage 6
November 2011

Dedicated Truck Lanes Investigated
For the road transport investment alternative (henceforth RTI alternative), the assumption is that the
relative shares of total volume of container transport between the different modes remain at the
same level as it is now. The capacity increase for road transport should assure competitiveness with
the other modes. This has one exception; the Betuwe-route is assumed to reach maximum capacity.
For the rest of this report, we will therefore assume that the Betuwe-route will increase its efficiency
so that rail transport can compete with road transport. Note that this is a strict assumption, with a
very cautious approach towards the road transport sector. It is much more likely that the due to the
new road transport infrastructure, the road transport sector will take containers from rail transport.
Total benefits of the road transport infrastructure investment are therefore likely to be higher than
estimated in this good flow analysis. This report is not aimed at making too positive predictions for
road transport however. The view that when increased efficiency of the Betuwe-route is assumed full
capacity will be used is consistent with literature. Beuthe et al. (2001) show that there is a strong
elasticity for rail demand with respect to costs; a cost-reduction of 5% leads to an increase of more
than 5% for rail transport demand1.
1.2 World economyAs mentioned, the World economy has a large influence on the Rotterdam Port and its transport and
logistics operations. The current economic crisis increases difficulties in predicting what
developments will take place in international trade. Two expectations are given by a report of the
CPB for the Dutch economy in 2040. The first scenario is that the trends in international trade will
continue; Europe then further develops in to a service-export oriented economy. The other scenario
predicts a break in this trend; because of international tension and increased complexity in logistics
and organization, countries will re-organize and economies will become more self-fulfilling rather
than dependent on the world economy2.
The first expectation will imply more inter-continental trade. Especially EU imports will increase
significantly, which implies more demand for deep sea ports like Rotterdam. This scenario could
therefore be described as ideal for the road transport investment alternative, the increase in
business in the Rotterdam Port will imply more throughput to Europe and thus more demand for
transport services. The second prediction has the opposite effect on the importance of the
Rotterdam port area. Inter-continental trade will decrease in this case. Intra-EU trade is expected to
increase, yet the direction of transport is much more complex in this case. Road transport investment
1 Beuthe M., Jourquin B., Geerts J-F and Koul a Ndjang' Ha C. (2001) Freight transportation demand elasticities: a geographic multimodal transportation network analysis, Transportation Research Part E: Logistics and Transportation Review, Volume 37, Issue 4, August 2001, Pages 253-2662 Centraal Planbureau (2010): The Netherlands of 2040 CPB Bijzondere Publicatie 88 22-06-2010
Reinout PoldersPage 7
November 2011

Dedicated Truck Lanes Investigated
alternative would therefore be less effective; instead of relying on big corridors the spatial pattern of
transport will become much more diverse.
The question is now which expectation is perceived as most likely. With the current information, a
combination of both should be seen as plausible. There is no reason to believe that economies will
become more self-fulfilling; the economic crises only increased dependency between countries. In
addition, there is no clear indication that production will become too complex because of higher
demands for organization and logistics. This is very important, because this implies that road
transport infrastructure will be used as an important corridor in the transport network. However, to
state that the import of the EU will grow is a very strict assumption. The Wereldhandelsmonitor of
June 20113 shows that economic growth reported in 2010 in the EU is still very fragile. Whether this
is an endogenous effect caused by the fear of EU government bankruptcies, or an exogenous
development caused by the earthquake in Japan and the US debt issues is difficult to tell at this
moment. Good flow predictions will have to be made with caution however.
Given the extremely uncertain developments in the World economy, the CPB does not give
predictions for global economic growth on the long-term. The same counts for the IMF, where
regional outlook reports’ predictions do not look further than 3 years forward. This brings extra
difficulties for this thesis with respect to the good flow analysis. There is little other option than to
assume that a steady economic growth with low growth levels is most likely. As mentioned before,
this thesis does not want to make the mistake to use all too bright predictions. There is also the
possibility that actual growth figures will be even worse and the global economy will fall in a long
sustained crisis, yet in this case no economist can properly predict what will happen to various
regions and good flows. Hence this scenario will be dropped.
1.3 Dutch EconomyDespite the big role of the World economy, expectations for the Dutch economy remain relevant for
the good flow analysis. For the predictions of the Dutch economy up to 2040, four scenarios
regarding the spatial pattern of economic activity have been created by the CPB. These are; Talent
Towns (TT), Cosmopolitan Centers (CC), Egalitarian Ecologies (EE) and Metropolitan Markets (MM)4.
The first two correspond most with a continuous trend of World trade growth, whereas the latter
two represent more centralized economies or even autarky. The MM scenario, which moves towards
autarky and predicts cities of over 10 million inhabitants is perceived as not very likely for the
Netherlands by the authors of the CPB as well as this report.
3 Centraal Planbureau (2011) Wereldhandelsmonitor: juni 2011 Wereldhandelsmonitor | 22-08-20114 Centraal Planbureau (2010): The Netherlands of 2040 CPB Bijzondere Publicatie 88 22-06-2010
Reinout PoldersPage 8
November 2011

Dedicated Truck Lanes Investigated
Of the remaining three scenarios, the TT and the CC scenario predict infrastructure to be especially
important on a European scale. The EE scenario predicts primarily relevance of infrastructure on a
national level, implying a smaller effect of the big road transport infrastructure. Between the two
scenarios that favour road transport investments, the CC should be seen as the scenario with the
highest importance of road transport infrastructure. This is due to the fact that cities are part of a
global network, which implies a higher importance of big corridors. In addition, the TT scenario
predicts a further increase in ICT-solutions for labour mobility. This makes it more easy to work at
home. As a result, congestion will decrease and the proposed dedicated truck lane will lose
relevance. Customer
Similar to the predictions for the World Economy, no clear expected growth figures for the
Netherlands are given in reports. It is therefore necessary that this report sticks to the earlier
mentioned assumption of a slow but steady growth. With missing predictions for both the global as
well as the domestic economy, this is the only option left.
1.4 Transport businessIn addition to the general developments of both the global as well as the domestic economy,
developments in the transport business can also influence the good flow analysis. In order to predict
what will happen to the shares of the different modes in total transport, special attention needs to
be given to the current trend in the transport industry. The data that is used in this analysis is taken
from the Eurostat database. It is important to take into account developments in other European
countries since the road transport infrastructure investment (referred to as RTI investment from now
on) should mainly serve as a corridor for throughput from the Rotterdam Port area to Eastern
Europe.
Table 1.1: Dutch Modal Split
Absolute Volume 2008 (million tons) Growth 2003-2008 (percentages)Road 485 9.5Rail 41 36.7Barge 345 17.7
Table 1.1 shows the main statistics for the Dutch modal split for the period 2003-2008. The effect of
the Betuwe-route is clearly visible; rail transportation has experienced the highest growth in the last
5 years before the crisis. Nevertheless, the total volume is still nowhere near the predictions of the
initial Betuwe-route studies. A major drawback is that rail transportation stops at the border,
whereas barges as well as trucks can move freely into Germany. Even if the problems were to be
Reinout PoldersPage 9
November 2011

Dedicated Truck Lanes Investigated
solved for rail transport, the possibilities of growing are small when compared to the other
modalities. In relative terms, rail transportation could still grow with 58%. At that point, the
maximum capacity of the Betuwe-route is reached; 65 million tons of goods per year.
As one of the few authorities, the Rotterdam Port has had the courage to draw expectations up to
2030. As usual, the expectations are supported by four scenarios; Low Growth (LG), European Trend
(ET), Global Economy (GE) and High Oil Price (HOP)5. All four of these scenarios predict an increase in
total goods handled in the port. A short summary of the scenarios is given in table x. With the total
volume of goods handled in the port around 430 million tons in 2010, the growth predictions vary
from 10 to 74%. As mentioned before, all too bright predictions should be approached with much
caution. The GE scenario will therefore be dropped, we do not see this scenario as very likely at this
moment. Of the three remaining scenarios, the HOP scenario is most average, plus it corresponds
with the current trend of a high oil price and a tempered economic growth combined with a more
strict environmental policy6. The good flow analysis will henceforth make use of the HOP scenario as
developed by the Rotterdam Port authority.
Table 1.2: Scenario predictions Rotterdam Port Authority
Predicted Volume 2030 Growth (%) Container Volume Container Growth (%)Low Growth 475 10.5 225 66.7European Trend 650 51.2 310 129.6Global Economy 750 74.4 360 166.7High Oil Price 575 33.7 265 96.3
In addition to the total volume of goods statistics, table 1.2 also shows developments in the total
handling of containers. As can be seen in the table, the expectations for container growth are much
higher than the predictions for total volume growth. The Rotterdam Port Authority expects that the
EU as a whole will move more towards high-end manufacturing instead of facilitating complete
industrial chains. This means that import of intermediate products will become more important at
the expense of raw materials import. Note that this view corresponds with the earlier mentioned
predictions of the CPB.
This is important information for the relevance of the RTI investment. Whereas barges and to lesser
extent trains excel in transporting dry and wet bulk, trucks are the most efficient transport mode for
5 Port Compass, de Ontwerp-Havenvisie 2030. By the Rotterdam Port Authority (2010)6 The report of the Rotterdam Port Authority does not mention at what price it considers the oil price as high. At the time of writing, the oil price is far below record heights, yet it is still twice as high as the average oil price of before the crisis and not likely to return to these low levels.
Reinout PoldersPage 10
November 2011
Dedicated Truck Lanes Investigated
transporting containers7. Even if the efficiency of the Betuwe-route was to increase dramatically, rail
transportation still would not be able to cope with the predicted increases in container handling.
From 135 million tons of goods handled in containers in 2010, the HOP scenario predicts a total
volume of containers of 265 million tons in 2030.
Table 1.3: HOP scenario goods distribution
2010 2030; HOP scenario Growth up to 2030 (%) 2040Containers 135 265 96.3 371Dry Bulk 85 85 0.0 85Wet Bulk 210 225 7.1 233
As can be seen in table 1.3, the total volume growth in the HOP scenario is almost totally the result of
the increase in containers. The growth predicted by the Rotterdam port Authority has been
extrapolated to give an overview of the various volumes in 2040. The year 2030 is somewhat too
near, especially if construction and development time is taken into account. It is a realistic
assumption that the RTI investment will not be used before 2020. In order to have a realistic time
span for measuring the effects of the truck lane, this report will take the year 2040 as an indication
point.
1.5 Container MarketThe question now arises which modality will transport what share of the increase in containers. For
rail transport this is obvious; a maximum of 24 tons of containers can be transported extra compared
to the situation right now. This is due to the fact that rail transportation is nearly completely
dependent on the Betuwe-route for its capacity8. In order to increase the capacity beyond 65 million
tons, large investments in new rail infrastructure are necessary. There are no plans for such a project
at the time of writing and given the fact that the Betuwe-route is still not profitable, it is not likely
that new plans will be developed in the near future. It could be argued that with increased efficiency
of rail transport, the mix of goods that are transported could change in the future. Rail transportation
could completely focus on containers and leave dry and liquid bulk transport to barges. Although this
is a possibility, it would not change the results of the calculations in the next chapter9. Given the
7 47% of the total volume of goods transported by train in the Netherlands consists of dry bulk; whereas 43% consists of containers. See the Port of Rotterdam website for extensive statistics. 8 This is true for the container volume in the port of Rotterdam. There are other routes for rail transport in the Netherlands, yet since these routes are not used for transport of goods from Rotterdam they are not included in the total capacity of rail transport in this analysis.9 Note that there is a cargo-switch between barges and rail transport. Dry and liquid bulk that will have to be shipped by barges, replacing the container capacity of barges. This is due to the fact that total capacity of the barge sector cannot grow infinitely. There will thus be no effect on the total volume of containers transported by the road sector, which means that there is no effect of the cargo-switch on the outcome of this analysis.
Reinout PoldersPage 11
November 2011

Dedicated Truck Lanes Investigated
latest trend for railways as shown in table 1x, this tonnage can be reached in 2020. With rail
transport taking an extra 24 million tons of goods in comparison to the situation in 2011, another 212
million tons of containers are to be divided among truck traffic and barges. In 2008, barges
transported 30 million tons of containers. Trains transported 11 million tons of containers, which
leaves 94 million tons of containers for road transport. As mentioned before, the zero alternative
assumes no changes in relative competitiveness. This implies that the shares of container transport
for the different modalities remain at the same level. Note that this has one exception; rail transport
is assumed to reach maximum capacity with 65 million tons of goods.
Table 1.4: Modal shares of container transport
share of total container transport Volume 2008 RTI Alternative
2040
Zero Alternative
2040Trucks 0.70 94 255 199,5Rail 0.08 11 35 35Barge 0.22 30 81 136,5
Table 1.4 shows the modal split as expected in 2040 for both alternatives. The difference between
the zero alternative and the RTI alternative is estimated at 55,5 million tons of containers for road
transport. The table assumes that both barges as well as trucks are able to provide the capacity to
cope with the increase in containers. This does not necessarily have to be the case. Table x showed
the growth for the period 2003-2008; a period characterized with excess demand. Transport firms
could invest where possible, because the increase in capacity was nearly sure to be filled with new
demand. Therefore, the growth figures of this period can be seen as the maximum growth rate at
which the different modalities can grow under the status quo. This explains the relatively much
higher growth of rail transport; infrastructure capacity was increased dramatically with the Betuwe-
route and therefore demand could easily be met with supply. It also shows the level of pressure
under which the road transport business operates; congestion and logistical difficulties result in only
slight capacity increases. To make this situation even more clear, table 1.5 shows the yearly growth
rates and the extrapolated container volume handled by each modality under current growth rates.
Table 1.5: Extrapolated supply based on current growth rates
Volume 2010 Yearly growth last 5 years Extrapolated capacity 2040
Reinout PoldersPage 12
November 2011

Dedicated Truck Lanes Investigated
Trucks 94 1.84 162Rail 11 6.45 67Barge 30 3.32 80
The main problem of the transport industry is immediately clear; with current growth rates the
volumes of the zero-alternative cannot be reached. Especially the barge sector falls short in supply
for the zero alternative. As explained before, without investments in road transport a big share of
container transport volume will fall in the hands of the barge sector. Although the barge sector has a
lot of potential that is primarily created by low marginal external costs and high quality
infrastructure, it is not justified to assume that the barge sector will grow faster than this
extrapolation. There is a consensus in literature that with increased coordination, increased use of
ICT and through mergers and acquisitions the barge sector can increase its efficiency dramatically.
However, these tools were already known off and assumed in the initial Knight Wendling report.
Nearly 20 years later, the market structure of the barge sector has not even changed marginally. Still
72% of all barge firms has no more than 2 employees10; a market defragmentation that is much
bigger than in other transport sectors. Given the structural aspect of these reasons behind the
lagging efficiency, this report will henceforth assume the growth rates of 2003-2008 as the maximum
growth rates for barge transport.
The growth rates as presented above give rise to questioning the current policy of the port of
Rotterdam towards the modal split. Instigated by environmental concerns, the port authority
imposes restrictions of terminal operators with respect to the share of total volume of containers
handled by trucks. Since trucks are more pollutant than other modes, the port authority hopes to
reduce attractiveness of truck traffic through these policies. Based on the presented growth
expectations, we regard these objectives of the Rotterdam port authority as unrealistic and
potentially very harmful for overall competitiveness of the port. This report will therefore not include
this policy of the port authority in the analysis and assume that forwarders are free to choose the
modality they prefer.
For the RTI alternative, the predicted demand is very close the extrapolated supply of capacity. The
RTI alternative therefore seems as a more natural development in the barge sector than the zero
alternative. On the other hand, the rail transport sector should easily meet demand. Yet since the
current growth rate of rail transport is primarily based on the capacity increase because of the
Betuwe-route, it is highly unlikely that the rail sector can actually provide this capacity. The road
10 Visie op Transport en Logistiek 2011, ABN AMRO sector research
Reinout PoldersPage 13
November 2011

Dedicated Truck Lanes Investigated
sector is not able to meet demand in both alternatives, implying a big loss of total goods flowing
through the Netherlands.
The next, rather strict, assumption is that road transport will be able to increase its capacity to meet
demand under the RTI alternative. In order to do so, growth rates have to rise from 1.84% to 4.05%11.
These are not unrealistic growth rates when compared to the current growth rates of rail and barge
transport. The RTI investment should be a major infrastructure capacity increase for road transport
and could therefore have the same effect as the Betuwe-route had on rail transport.
1.6 SummaryThis chapter has shown that without investments in the hinterland connections from the port of
Rotterdam, the different transport modes are unable to cope with the increased volume of
containers handled in the port. This is already the case for tempered predictions of the port
authority; the most optimistic expectations will cause even bigger problems. The transport mode
with the highest potential to cope with the increase when infrastructure investments take place is
the road transport sector. This capacity growth of this sector is under heavy pressure of the
congestion burden. Infrastructure investments that could reduce this burden are likely to have a very
positive influence on the hinterland connectivity of the port. The barge sector has a much lower
potential given the defragmentation of the market; even under excess demand and with sufficient
infrastructure capacity this sector cannot cope with the projected increase in containers. The rail
transportation sector primarily grows because of the major capacity increase that has been created
with the Betuwe-route. Yet due to the lack of profitability in the exploitation of this infrastructure
project, it is not very likely that a new significant railway track will be build in the coming decade.
To come up with a road transport infrastructure investment project is highly controversial; the
negative perception of the road transport sector reduces the willingness of government officials to
invest in this sector. The high external costs associated with road transport are a reason for multiple
pressure groups to put effort in blocking road infrastructure investments. The second chapter will
therefore show that with a new concept, these external costs can be kept as low as possible while
allowing for container growth at the same time.
Chapter 2: Optimal infrastructure for truck transport
11 Note that this growth rate has to hold for the period 2020-2040. For the period 2010-2019 the old growth rate of 1.84% per year was used. This is in order to avoid mistakes like made in the initial Knight Wendling report.
Reinout PoldersPage 14
November 2011

Dedicated Truck Lanes Investigated
As mentioned before, there is a high social awareness of the fact that road transportation brings
external costs to society. This was especially true for the 90s, when there were little rules and
regulation regarding the pollution of trucks. The situation nowadays is much different however. The
relatively short life-time of trucks assures that new techniques can be implemented faster than in
other modalities12. While the ‘extremely pollutant’ perception of trucks that ruled during the Betuwe-
route discussions is still present, the actual pollution levels are a lot lower than 20 years ago. This is
mainly because of the stringent regulation of truck emission by the European Union. Of all transport
modes, trucks face the most rules and regulations regarding the pollution costs13. A good overview of
the actual effect of the EU on emissions of trucks is given by a report of den Boer and Schroten
(2007). The report captures the transition from the first EU regulations (EURO-1 standard) to the last
regulations at this moment (EURO-5 standard). The average external cost for a standard truck
between 16 and 32 ton driving in a metropolitan area has been reduced from 29 cents per km under
the EURO-1 standard to 3.2 cents per km under the EURO-5 standard14.
Nevertheless, trucks prove to be much more pollutant than other modalities15. The report of den
Boer and Schroten (2007) estimated the cost per km for an electric train at 13.7 cents per km, against
a cost of 0.89 - 12.6 for barges depending on the size and type of vessel 16. This chapter will discuss
the actual pollution levels of trucks, with in addition other relevant externalities, and show in what
way the external costs can be reduced as far as possible. A very important determinant of the
pollution level turns out to be the structure of the highway. A rather new concept in this light is the
dedicated truck lane; priority lanes for trucks and other heavy good vehicles. In the US these lanes
are implemented on a significant scale, yet the Netherlands has only 2 very small dedicated truck
lanes. This chapter should provide insight in what way and to what extent dedicated truck lanes can
help reduce external costs of truck traffic. The last paragraph will present the proposed highway
structure for truck traffic investment, which will be used in forthcoming chapters.
2.1 External CostsAlthough air pollution is the most important association with negative externalities of truck traffic,
this is just one of the four external costs categories. Other categories are noise, safety and
12 See Sandvik, E.T (2005) Environmental impacts of intermodal freight transport (Molde: Moreforsking Molde)13 See Hjelle, H.M. (2010) Short Sea Shipping’s Green Label at Risk, Transport Reviews, 30:5, 617-640 for a comparison with Short Sea Shipping.14 Boer, den C.L. and Schroten, A. (2007) Traffic noise reduction in Europe: Health effects, social costs and technical and policy options to reduce road and rail traffic noise, CE Delft15 van Essen, Rijkee, Verbrakk, Quak and Wilmink (2009) Modal split and decoupling options Paper 5 produced as part of contract ENV.C.3/SER/2008/0053 between European Commission Directorate-General Environment and AEA Technology plc; see website www.eutransportghg2050.eu16 Figures are provided by HEATCO (2006a) Bickel, P. et al: Developing Harmonised European Approaches for Transport Costing and Project Assessment (HEATCO),
Reinout PoldersPage 15
November 2011

Dedicated Truck Lanes Investigated
congestion. Infrastructure investments will have specific effects on each of these categories;
therefore this paragraph will discuss the categories one by one.
2.1.1 Air pollutionAir pollution takes place when transport vehicles emit volatile organic compounds (VOC), carbon
monoxide (CO), nitrogen oxides (NOx) and particulate matters (PM10). Higher than normal
concentrations of these gasses can lead to damage to the environment and the health of population
living near the place of emission. There is a distinction to be made between two types of air
pollution; one that incurs health damage to the population living in the vicinity of a highway and one
that leads to global warming. The latter one is created by the emissions of CO2, while the first type of
air pollution is created by the emissions of VOC, NOx and PM10. The distinction between these two
types of air pollution is important for the section with the external costs quantification; whereas
health damage has a local effect, global warming is not restrained by borders.
Air pollution does have additional minor components; effects such as crop losses and loss of
biodiversity. The precise magnitude of this relationship is very hard to quantify tough. As a result,
these effects are not incorporated in this report.
The level of emissions is mainly dependant on the load weight and the speed of the vehicle. An
expected conclusion in literature is that while a heavier load per truck increases emissions, total
efficiency might be improved when making use of long truck combinations. Spielmann and Scholz
(2004) prove that total energy use per ton/kilometer for 32 ton lorries is 57% lower than for 16 ton
lorries17. This result suggests that providing infrastructure that is suited for long truck combinations
could be beneficiary for reducing total energy consumption. Dedicated truck lanes can support the
heaviest truck combinations, whereas these combinations are prohibited on normal highways. The
argument of reduced safety for other road users is not applicable for the dedicated truck lane, hence
the possibility for allowing longer truck combinations.
Not only the absolute speed of the truck is important for determining pollution levels, the steadiness
of speed proves to be affecting the pollution level significantly. Brodrick et al. (2002) conclude that
on a grams per gallon fuel basis, NOx emissions while idling were approximately twice as high as
those at 55 mph18. Gajendran and Clark (2003) confirm this view; according to their report CO2 did
17 Spielmann and Scholz (2004) Life Cycle Inventories of Transport Services, Background Data for Freight Transport. Int J LCA 10 (1) 85 – 94 (2005)18 Brodrick, C-J, Dwyer, H. A., Farschchi M., Harris D. B. and King F. G. (2002) Effects of engine speed and accessory load on idling emissions from heavy-duty diesel truck engines, Journal of the Air & Waste Management Association, Vol. 52, no. 9, pp. 1026 – 1031
Reinout PoldersPage 16
November 2011

Dedicated Truck Lanes Investigated
not increase with weight of the truck as long as the truck was in a steady-state operation 19. This is an
important result for infrastructure planners; while normally trucks are seen as the only cause of
pollution, insufficient infrastructure supply should be seen as a cause too. Expensive infrastructure
investments that allow for a fluent flow of trucks may well be paid off by the reduced external costs
that is created when trucks can drive with a stationary speed instead of idling in congestion.
In addition to the fact that trucks are the most pollutant modality with respect to air pollution, there
is another disadvantage of trucks; trucks are more present in urban areas than barges and good-
trains. This has a direct effect; especially particular matters are more harmful when in the vicinity of
urban areas. In addition there is an indirect effect; urban areas are more often subject to congestion.
Evidence for this indirect effect is given be a cross-country comparison for the period 1973-2005
performed by Kamakaté and Schipper (2009). Countries that are used in the comparison are the US,
Australia, Japan, France and the UK. The latter three have performed less than the US and Australia
with respect to reducing total energy use. This can partly be explained by the fact that trucks in the
US and Australia cross vast desert areas with no urban settlements and thus very little congestion
compared to the other three countries. In the ideal situation, trucks should therefore be kept away
from urban areas as far as possible. This will prove to be hard to implement in the Netherlands due
to the high population density. Parks and other recreational areas are valued highly, implying very
high costs for the loss of nature when a highway is developed in the vicinity.
2.1.2 Noise pollutionNoise pollution has a does not have a reputation like air pollution, yet too high noise levels can also
have severe effects on the human health. This is one way in which the effect of noise levels can be
measured; the other one concerns property values. Noise reduces the attractiveness of an area; this
is reflected in the property values within this area. The total air friction of a vehicle and the gross
weight of a vehicle are the main determinants of the level of noise pollution. Hence the higher noise
level for trucks when compared to cars. Trucks are also more pollutant than barges and trains.
Nelson (1982) concludes from an extensive literature review that property near a highway are
subject to a surplus of 20-25 dB of noise when compared to houses at a significant distance of a
highway20. With the empirical result that property values are reduced by 0.4% per dB noise increase,
the effect of noise on property values can be quite big. Again, it seems to be impossible to avoid
urban areas in the Netherlands due to the high population density. Nevertheless, the empirical
19 Gajendran, P. and Clark, N.N. (2003) Effect of Truck Operating Weight on Heavy-Duty Diesel Emissions, Environmental Science and Technology, Vol. 37, no. 18, pp 4309 – 431720 Nelson, JP (1982) Highway Noise and Property Values: A Survey of Recent Evidence in Journal of Transport Economics and Policy, Vol. 16, No. 2 (May, 1982), pp. 117-138
Reinout PoldersPage 17
November 2011

Dedicated Truck Lanes Investigated
results show that investments in noise barriers and noise-reducing asphalt can be profitable for
reducing external costs.
Compared to other freight transport modalities, trucks create also much more noise pollution. This is
mainly due to the fact that roads are often close to living areas, whereas barges and to lesser extent
trains are constantly at a distance of urban regions. The effect on human health can have more
severe consequences than the economic damage due to property values 21. Several studies have
been carried out to investigate the marginal effect of noise on urban population’s health. In total,
90% of all noise pollution leading to health issues is created by highway traffic. In 2000,
approximately 250.000 European citizens suffered from cardiovascular diseases that can be traced
back to traffic noise.
Dedicated truck lanes do not have positive effects for the noise levels of trucks; since they are aimed
to improve the traffic flow of trucks, speed and thus noise levels will increase. There are other
possibilities to limit the noise pollution levels with infrastructure; noise barriers and noise-reducing
asphalt like mentioned before. These possibilities are likely to be insufficient to create an overall
noise reduction, yet limiting the pollution could also prove to be a profitable investment.
2.1.3 SafetyTraffic accidents are the most important component of the effects of trucks on safety. Due to the
increased amount of cars and trucks on highways, safety has not improved in the last two decades.
While trucks do not necessarily have to be the cause of traffic accidents, overall damage of accidents
proves to be bigger when trucks are involved22. A bigger share of trucks on highways implicates a
higher risk of trucks involved in accidents, leading to a higher chance on severe damage. High truck
speed and turn maneuvers are also positive determinants of traffic accidents according to Cate and
Urbanik (2004). Infrastructure that divides trucks from normal traffic can therefore have a positive
effect on the safety costs of truck transport. Middleton and Lord (2005) confirm this view by showing
that there are twice as much accidents on mixed-user lanes than on lanes with separated trucks.
Dedicated truck lanes can therefore play a big role in reducing the external costs that are created by
accidents.
There is a second advantage of dedicated truck lanes for road safety; the reduction of speed
differences between lanes. Smaller speed differences on both lanes, car as well as truck lanes, will
most likely imply that less accidents will occur. In the Netherlands, the discussion about truck passing 21 Boer, den C.L. and Schroten, A. (2007) Traffic noise reduction in Europe: Health effects, social costs and technical and policy options to reduce road and rail traffic noise, CE Delft22 Chang, L and Mannering, F. (1999) Analysis of injury severity and vehicle occupancy in truck- and non- truck-involved accidents, Accident Analysis & Prevention, Vol. 31, no. 5, pp. 579 – 592
Reinout PoldersPage 18
November 2011

Dedicated Truck Lanes Investigated
manoeuvres may even lead to total prohibition of these manoeuvres on certain highways 23. There is
an empirical example from the USA that could help in this case. In 1987, all 50 states were allowed to
increase the speed limit for cars to 65 mph whereas the maximum speed for trucks had to stay at 55
mph. Crash rates comparisons between states (not all chose to increase speed) and within states
showed that while total number of crashes did not increase, the fatalities of injuries increased
dramatically (Ossiander E.M., Cummings P., (2002) )24. The introduction of differential speed limits
showed a break in the trend of reduced injury severity. An increase of the average severity of injuries
implied a rise in social costs for the states that allowed the higher speed limit. Since there is a strict
and at some highways a much bigger difference in maximum speed in the Netherlands for trucks and
cars, this example from the USA supports the idea that dedicated truck lanes can reduce the overall
costs of accidents.
2.1.4 CongestionThe domestic economy can be significantly hurt by the presence of congestion. Congestion increases
the travelling time for both transport firms as well as other users of the road. In addition, there is an
increase in uncertainty of arrival time for goods and passengers. Both effects are a cost to society.
Roads are more often congested than railways and far more often congested than rivers25. Trucks are
contributors to congestion; speed differences, especially the frequent braking that occurs during
passing maneuvers, are thought to be one of the main reasons for congestion. This hypothesis is
confirmed by Verhoef et al. (1999); in a rather simplistic model they shows that speed differences are
one of the major reasons for congestion. In their view, dedicated lanes specified to reduce speed
volatility could reduce congestion26. Whether dedicated truck lanes have a positive effect on overall
congestion is unsure. This is mainly dependant on the structure of the dedicated truck lane. First,
congestion for other users might increase when a lane is taken from existing highways. Second, the
capacity of on- and off-ramps is important. The next paragraph will discuss a possible consequence of
dedicated truck lanes; increased switching of lanes before and after the dedicated truck lane.
2.2 Dedicated truck lanesUp to this point, the focus of this chapter has been solely on discussing in what ways the external
costs of truck traffic can be reduced. As became clear, dedicated truck lanes or HGV (Heavy Good
23 There are wide-supported plans to prohibit passing manoeuvres for trucks on highways with a high density and/or 2-lane highways. At the time of writing there is no indication how this discussion will unfold.24 Ossiander E.M., Cummings P., (2002) Freeway speed limits and traffic fatalities in Washington State, Accident Analysis & Prevention, Volume 34, Issue 1, January 2002, Pages 13-18, ISSN 0001-457525 Railways allow for a logistical planning, which means that predictability is much higher. Barges have little structural congestion, yet in the case of accidents or low water conditions the duration of congestion is relatively high.26 Verhoef, E.T., Rouwendal, J. and P. Rietveld (1999) Congestion caused by speed differences, Journal of Urban Economics, Vol. 45, no. 3, pp. 533 – 556
Reinout PoldersPage 19
November 2011

Dedicated Truck Lanes Investigated
Vehicles) priority lanes have a lot of characteristics that can help reducing these external costs.
Nevertheless, there is no consensus yet in literature whether these dedicated truck lanes are truly a
step forward for traffic flows. The forthcoming paragraph will therefore give a short overview of the
major pros and cons for dedicated truck lanes.
2.2.3 Reduced travelling time and increased predictability In addition to the societal benefits that can be achieved by reducing the external costs of truck traffic,
there are two main advantages for transport firms: reduced travelling time created by higher average
speed and better routing predictability due to the lower chance on congestion. Both advantages are
relying on reduced or completely removed congestion. In theory, this could be achieved by
implementing dedicated truck lanes. Yet in empirics, there is no clear evidence for this idea. The main
bottleneck is the increased switching of cars right before and right after the dedicated truck lanes.
This creates congestion, which simply implies that congestion is shifted rather than reduced. Given
the possible shift of congestion, dedicated truck lanes should have a significant length in order to
reduce congestion overall.
The discussion about lane switching-related congestion leads to a major disadvantage of dedicated
truck lanes; extra congestion for other road users. This phenomenon occurs when dedicated lanes
are taken from existing highways; other road users are then left with less lanes to use. Congestion is
then not only shifted geographically, but also between road users. Depending on the share of
businesses-related road users, the extra congestion costs can turn out to be significant. These extra
costs are rather easy avoided by building a new highway that is dedicated to trucks however. Yet
given the substantial cost increase compared to claiming lanes of existing highways, this option is
rarely used. Especially in the Netherlands, with the population’s ruling perception of the already too
dense highway system, it will prove to be hard to gain sufficient support to construct a new highway
dedicated to trucks. The purpose of this thesis is to open the discussion for new truck investments
however and to draw a parallel with earlier investments in other modalities. Given the completely
new railway that was constructed for the Betuwe-route, it is evident to assume that the same
amount of money and new land used can be put into the investment for road transport. This thesis
will try to show with rationality and objectivity that with the right structure of the highway, road
transport capacity can be increased without damaging the society too much.
Included in most theoretical studies on the effects of dedicated truck lanes is the option of
demanding toll for usage of new highways. Toll revenues could be used to cover the expenses of the
infrastructure project and in addition the revenues could compensate for the external costs that are
created by highway traffic. The first argument is a valid point, since highway projects can be very
Reinout PoldersPage 20
November 2011

Dedicated Truck Lanes Investigated
expensive and benefits are not always divided over the society as a whole. This benefits are more
evenly spread in the case of truck traffic however. Yet to levy tolls on truck traffic for creating
external costs is not justified. Recent research by van Essen et al. (2010) shows that current fuel
taxation already covers the marginal external costs of road transport27. With the current trend in
technology marginal external costs are likely to drop, whereas it is much less likely under the current
political situation that fuel taxes will drop. To levy tolls on truck traffic with the purpose of
compensating for external costs is therefore too much of a burden. Tolls could then have adverse
effects; in contrast to fuel taxes tolls do not have a European regulation. Tolls on highways in the
Netherlands could thus result in a too expensive road transport sector, leading to a reduced
competitive position of the Rotterdam port. Tolls will be therefore be excluded as an option for the
proposed dedicated truck lane. Since there is very little experience in the Netherlands with toll lanes,
it would be hard to properly estimate the effects of toll on the dedicated truck lane as well as other
highways.
2.3 Proposed Highway StructureThe first two paragraphs discussed the theoretical advantages of dedicated truck lanes. This
paragraph will proceed with proposing the structure that should be implemented in order to have
the biggest gains for the society as a whole. The primary difficulty with respect to the structure is the
extent to which theoretical advantages are applicable to the real highway network. Basically, there
are two options; one is to build an entirely new highway whereas the other is to use lanes from
existing highways to create a dedicated truck lane. The first option makes the structure rather
straight-forward, yet it has two major drawbacks; the need for a high investment sum and the need
for unused land. Especially the last is very scarcely available in the Rotterdam port. This is the main
reason that we cannot directly rule out the second option; to use lanes from other highways.
Although this could mean that non-truck traffic could face increased congestion, it might well be the
only scenario that can be considered as realistic.
In order to make a rational and well-founded choice between the two options it is necessary that we
take a closer look at the Dutch highway network. The only highway that has a direct connection to
the container terminals at the far end of the port is the A15. Figure A1 in the appendix shows the
complete route of the A15. The connection to the port implies that the A15 is the highway with the
highest truck density in the Rotterdam region. A small share of the trucks leave the highway when
crossing Rotterdam, yet most of the trucks continue their way to a major junction know as
‘knooppunt Ridderkerk’. This is where trucks have three options. The first one is to continue
27 van Essen, H., Blom, M., Nielsen, D. and Kampman, B. (2010) Economic Instruments Paper 7 page 25
Reinout PoldersPage 21
November 2011
Dedicated Truck Lanes Investigated
following the A15 in eastern direction, eventually to cross the border with Germany. The second
option is to take the A16 in southern direction in order to reach Belgium. The last option is to follow
the A16 in northern direction around Rotterdam to serve the northern part of the Netherlands. This
northern route has already got two small dedicated truck lanes of approximately 12 kilometers in
total.
Table 2.1: Highway characteristics
Av. Number of trucks Trucks Share Total trafficA15 Port -Ridderkerk 17046 23 % 92664A15 Ridderkerk-Gorinchem 21036 23 % 92664A16 Southwards 18071 14 % 129993A16 Northwards 25843 12 % 220336
Table 2.1 shows characteristics of the earlier mentioned highways28. As can be seen, the share of
trucks is highest on the A15; averages do not differ between the two parts that are divided by the
Ridderkerk junction. This does not mean however that the absolute number of trucks is the highest
on this highway; the northern part of the A16 reports more volume. This can easily be explained by
the fact that this highway runs through the city of Rotterdam. Trucks do not necessarily have to come
from the port area when travelling to Rotterdam; it is possible that a significant share of trucks are
carrying deliveries from small and medium-sized enterprises. As such, this highway has less relevance
for the port and the free flow of trucks. In addition, there are already two dedicated truck lanes on
this route. When comparing the A15 to the corridor to Belgium, both the share of trucks as well as
the absolute number of trucks are higher on the A1529.
The dedicated truck lane is thus most needed on the A15 up to Ridderkerk. The DTL could
additionally be stretched all the way to the German border in order to further increase the flow of
trucks. Yet this is not the biggest issue at this point, since land is less scarce from Ridderkerk
onwards. For the part where adjustments are most needed, the A15 up to Ridderkerk, land is
extremely scarce. Chapter 1 has shown that even in the worst-case scenario for container growth in
the port of Rotterdam, road transport is expected to grow. The question is to what extent truck
traffic growth causes congestion for other road users. Congestion is measured in the Netherlands by
28 Data is obtained from the Jaarboek Verkeer Rijskwegen Zuid-Holland 200929 Note that the average number of trucks on the first part of the A15 is very low since it starts at the end of the port, figures for this part are therefore not completely representative.
Reinout PoldersPage 22
November 2011

Dedicated Truck Lanes Investigated
making use of traveling time factors30. The travelling time factors of multiple highways will be
compared in order to determine the relative burden of congestion on the A15.
Table 2.2: Travel time factor comparison
Highway Travel time factorA4 1.280A13 1.744A15 - Ridderkerk 1.233Ridderkerk- A15 1.281A16 1.275A20 1.381
Table 2.2 shows the travelling time factors (TTF) of the major highways around Rotterdam for the
period 2000-200931. The table shows the average TTF of the highway for both directions. Since the
data is only from the region of Rotterdam, the part of the A15 after the junction of Ridderkerk only
has data up to Gorinchem which is another junction. The TTF for this highway might therefore be too
high to represent the whole highway up to Germany. Nevertheless, the TTFs for the A15 are the
lowest among the highways around Rotterdam. This suggest that the A15 is the highway with the
most capacity to cope with an increase in truck traffic. It follows that a completely new highway
might be exaggerated; the A15 with adjustments that are aimed at improving the free flow of truck
traffic might be sufficient in this case. Nevertheless, it might be useful to impose flanking policies to
assure the spread of trucks over the whole day. While average congestion is relatively low, traffic
jams during peak moments are still a burden on the A15. The government should therefore try to
actively manage the flow of trucks. A possibility is to make use of a slot system at container
terminals; implying that trucks can only pick up their container on certain time slots. Without these
kind of policies, the dedicated truck lane itself can become congested leading to lower effectiveness.
The main problem with a dedicated truck lane on a road that already exists is the design of the
structure; how to allow trucks to entry and exit the truck lane without affecting the flow of the other
road users. In addition, some creativity is needed to overcome junctions like the Ridderkerk one;
whereas a large share of trucks continue on the A15, some are destined to the northern part of the
Netherlands. Third, the presence in the Rotterdam port also means that the A15 crosses water on
multiple occasions. It will prove to be very hard to make adjustments to both bridges as well as
30 When there is no congestion at all and road users can move at maximum speed, this traveling time factor is equal to 1. In the case of high congested highways where traffic only travels at an average speed of 50 percent of maximum speed, the traveling time factor is equal to 2. In other words, the traveling time factor represents the average relative speed. 31 Data is obtained from the Jaarboek Verkeer Rijskwegen Zuid-Holland 2009
Reinout PoldersPage 23
November 2011
Dedicated Truck Lanes Investigated
tunnels. For the general outlay of the structure there is one necessity; the road should always consist
of at least three lanes; one dedicated truck lane and two lanes for other traffic. This is mainly due to
the fact that there are other road users than trucks that are restricted to a maximum speed that is
significantly lower than cars. For some parts of the A15, this implies that the highway will have to be
broadened from two to three lanes. The positive news is that this is already planned by the Dutch
government. Over a length of 43 kilometers (both directions), the A15 will be broadened from two to
three lanes. This will happen at the section between the port and the junction of Vaanplein. At the
end of 2011 the construction will start which is bound to end in 201532. In addition, a new bridge will
be build to support a bigger volume of traffic. This new ‘Botlekbrug’ will be one of the biggest in its
kind in Europe; the improved height of the construction implies less delay caused by the lifted bridge.
The hardest and most urgent road widening is thus already planned. Still, the remaining part of the
A15 up to the German border will also need to receive an extra lane. This will be costly, yet not as
much as the scenario where a completely new highway would have to be constructed. The reason to
completely broaden the A15 is to ensure the fluent flow of trucks; ending the dedicated truck lane in
the middle of the country will create a new bottleneck in traffic. Trucks would have to get off the
highway and mix with other road users again, which is bound to create congestion problems.
Additional positive news is that the A15 will be directly connected by the German highway system in
201833. As can be seen in figure A1 in the appendix, the A15 now stops right before the city of
Nijmegen. The connection to the German border requires approximately 25km of new highway.
Since the A15 will always be broadened on important points, one may question the necessity to
construct a dedicated truck lane. After all, capacity will increase regardless of the final structure of
the highway; both in the dedicated truck lane alternative as well as for the zero alternative. An
argument to keep the highway in the current state without a dedicated lane could be that this option
allows for a more flexible use of the total capacity of the highway. The essence of the dedicated tuck
lane is the improvement of traffic flows however; a constant speed has big benefits when compared
to a variable speed that occurs because of passing maneuvers. These benefits regarding safety,
congestion and air pollution have been mentioned earlier in this chapter. The theoretical advantages
of the dedicated truck lane are reason to use this option as the preferred investment alternative. The
dedicated truck lane alternative will therefore be central in the report. The option to increase
32 For more information, see the website of the Dutch Government on planned road infrastructure (Dutch only)http://www.rijkswaterstaat.nl/wegen/plannen_en_projecten/a_wegen/A15/verbreden_a15_maasvlakte_vaanplein/doel_en_resultaten_a15_maasvlakte_vaanplein/ 33 For more information, see the website of the Dutch Government on planned road infrastructure (Dutch only) http://www.rijkswaterstaat.nl/actueel/nieuws_en_persberichten/2011/augustus2011/trajectnotamer_project_via15_ter_inzage_vanaf_16_augustus.aspx
Reinout PoldersPage 24
November 2011
Dedicated Truck Lanes Investigated
capacity without lane restrictions is not completely denied however. Chapter 8 will reflect the
outcomes of the main analysis by making an additional comparison. The difference in social costs
between the dedicated truck lane alternative and the alternative without lane restrictions are central
in this comparison.
The proposed structure should be clear by now; increase the number of lanes on the A15 up to the
German border. The first and the last part of the A15 is already planned to be improved. For the part
that stretches from the junction of Vaanplein (right before Ridderkerk) to the city of Nijmegen,
additional funds will have to be raised. The new lanes should become a dedicated truck lane, that
means in both directions one of out of three lanes will be restricted to trucks. This report will not go
into depth on the technical difficulties that arise when major junctions like Ridderkerk cross the
dedicated truck lane. There are basically no examples available of a dedicated truck lane with this
length on an existing highway in the Netherlands. To come up with a innovative construction plan for
this problem is beyond the scope of this thesis.
2.4 Construction and Maintenance CostsNow that the structure of the dedicated lane is presented, it is possible to estimate the costs of the
construction and maintenance of the new highway. This should be done with caution; infrastructure
projects in the past have shown that too often the actual costs turn out to be far higher than
predictions. The proposed dedicated truck lane is a special case with respect to infrastructure
investments since the lane that is destined to become the truck lane is already planned by the Dutch
government. Nevertheless, the investment that have already been done will be fully assigned to the
dedicated truck lane project. In addition, this paragraph will include the cost for maintaining the road
as it is presented. Truck traffic wears asphalt a lot faster than normal traffic due to the weight of the
vehicles, so it is very important to take these costs into account as well.
It should be noted that the zero alternative is not entirely representing a situation without
infrastructure investments. As mentioned, the government is already planning to construct
additional lanes to the A15. One could therefore argue that for the zero alternative, the already
planned infrastructure improvements should be assigned as investment costs. This argument is not
included in the report however; the broadening is not aimed to serve the road transport sector. It is
primarily aimed at reducing commuters’ congestion. To include these investment costs in a road
transport infrastructure analysis would not be justified.
Reinout PoldersPage 25
November 2011

Dedicated Truck Lanes Investigated
The total length of the A15 is currently 203 km34. The planned connection to the German border
would include a distance of around 25 km extra highway35. This means that for the construction, a
total length of 203 km highway needs to be broadened and 25 km highway needs to be constructed
from scratch. Since a part of this construction plan is already put in motion by the Dutch government,
there are some indicators available for the total investment costs:
Table 2.3: Costs of planned construction
Total Costs Length Costs per kmMaasvlakte - Vaanplein 1.400.000.00
046 30.434.783
Nijmegen - German border 750.000.000 25 30.000.000
This means that for the part of the highway between the junction of Vaanplein and Nijmegen, there
is no data available yet. The highway up to Vaanplein is 45 km long, so that leaves 158 km of highway
to be broadened. It should be mentioned that the required bridge for the connection to the German
border will most likely be partially funded with toll fees. Since there is no information about the
height of the fees, this notion will not be included in the investment costs. It is likely that the
dedicated truck lane will increase traffic on the bridge and therefore the total income generated by
the fees. This could be accounted as an additional benefit of the dedicated truck lane. Yet the lack of
necessary input would make this benefit highly arbitrary, which justifies the exclusion of this benefit
from the analysis.
The information that is available for the part of the A15 that is already planned for construction can
be used as an indication for the investment that is needed for the remaining part that needs to be
altered. Table 2.3 presents the average costs per kilometer for both construction plans. The average
cost per km does not differ much between the two projects; estimations are between 30 million and
30.5 million euro. These costs are for a large part influenced by the fact that in both plans at least
one major bridge is included. Normally, it would therefore be impossible to use the average costs
from these projects for estimating the investments needed in other projects. Yet for this case, the
fact that bridges are included is an advantage rather than a disadvantage.
The highway crosses two rivers in the part between Vaanplein and Nijmegen; the Noord near
Alblasserdam and the Amsterdam-Rijnkanaal near Tiel. In addition, a small crossing of the Linge near
Gorinchem demands for a change in the current bridge. All crossings will need a new bridge or major
improvement in the current structure in order to allow for the dedicated truck lane. The ratio of
34 http://www.rijkswaterstaat.nl/wegen/feiten_en_cijfers/wegenoverzicht/a15/index.aspx (Dutch only)35 The final structure is still in discussion at the time of writing.
Reinout PoldersPage 26
November 2011
Dedicated Truck Lanes Investigated
bridges to total highway length is similar to the part of the highway between the Maasvlakte and
Vaanplein36. This justifies the use of the average costs per km of this highway as input for the
calculation of the expected costs of the highway between Vaanplein and Nijmegen. The total
construction costs are presented in table 2.4.
Table 2.4: Investment costs estimation
Total CostsMaasvlakte - Vaanplein 1.400.000.00
0Vaanplein - Nijmegen 4.774.347.82
6Nijmegen - German border 750.000.000Total A15 6.924.347.82
6
Construction costs are not the only costs that the government will face because of the proposed
dedicated truck lane; maintenance costs will rise as with the increase in asphalt. Only the extra costs
that arise because of the dedicated truck lane will be assigned to this project. The remaining part of
the A15 also requires maintenance nowadays; this is no difference between the dedicated truck lane
alternative and the zero alternative. The estimation of the maintenance costs is much more complex
than the estimation for the construction costs. This mainly due to the fact that there are multiple
types of maintenance projects while there is only one construction process. Maintenance projects
are divided into two groups; routine maintenance projects and periodic maintenance projects. The
first is rather easy to estimate; an average cost per kilometer is multiplied by the total length of the
highway. To estimate the periodic maintenance costs requires more creativity. A report written by
the World Bank indicates 7 different types of periodic maintenance activities37.
Naturally, it is difficult to predict when periodic maintenance activities are necessary. This report
therefore assumes that for every 10 years, a big periodic maintenance project is needed in order to
ensure road quality at the highest level. As mentioned before, it is also assumed that the dedicated
truck lane will not be used until 2020. Given the time-span of this report that runs to 2040, two big
periodic maintenance projects will be needed.
Table 2.5 Maintenance costs
Costs per km Length Frequency Total costs
36 For the Maasvlakte-Vaanplein; 1 bridge per 46 kilometer (1/46). For Vaanplein-Nijmegen; 3 bridges per 158 kilometer (1/53).37 Burningham, S and Stankevich, N (2005) Why road maintenance is important and how to get it done. World Bank, Washington, DC. Transport Nore No. TRN-4
Reinout PoldersPage 27
November 2011

Dedicated Truck Lanes Investigated
Routine Maintenance 2429 228 20 11.077.525Periodic Maintenance 14.9166 228 2 68.019.575Total Maintenance Costs 79.097.100
The maintenance costs will mount up to 79 million euro, a small cost when compared to the total
investment costs required. Nevertheless, this figure corresponds with findings of the CROW. In their
report regarding the costs and maintenance costs of highways, they find that roughly 1.2% of
investment costs are needed to maintain the road in good shape38. The estimation of the dedicated
truck lane maintenance costs gives a percentage of 1.14.
2.5 SummaryThis chapter has shown that dedicated truck lanes should be approached as an actual solution for
reducing external costs of truck traffic. Except for noise pollution, all cost categories directly benefit
from separating trucks from other traffic. While empirics do not give a consensus on the success of
dedicated truck lanes, we believe that this can be overcome with careful planning on specific
characteristics of the dedicated truck lane. Tolls are excluded as an option, since fuel taxes already
compensate the external costs created by CO2 pollution. In addition, there is little empirical
reference in the Netherlands with respect to dedicated truck lanes. This would make it very hard to
properly estimate the effects on truck behavior. Given the required length and the required share of
trucks, it is evident to build a West-East corridor in the Netherlands; similar to the Betuwe-route.
The dedicated truck lane should be placed on the existing highway of the A15. Empirics show that
this is the highway that is best suited for a dedicated truck lane; it possesses a high share of trucks
compared to total traffic and the burden of congestion is relatively low. The option to use a lane of
an existing highway is much cheaper than building a completely new highway. This is especially true
for the A15; the part of the A15 around the Rotterdam port area will be renovated in the next 5
years. This implies that the highway will get an additional lane in both directions as well as new
bridge to support a bigger volume of truck traffic. In addition, the A15 will be connected to the
German border with a new toll bridge near Nijmegen. This report will not go into depth on the
technical difficulties that arise when major junctions like Ridderkerk cross the dedicated truck lane.
There are basically no examples of a dedicated truck lane with this length on an existing highway. To
come up with a innovative construction plan for this problem is beyond the scope of this thesis.
The total costs that are required to construct and maintain the proposed dedicated truck lane are
estimated at 7 billion euro. This amount is primarily needed for construction; only 80 million euro is
38 CROW (March 2008): Onderzoeksresultaten CROW-werkgroep Evaluatie Onderhoudservaringen Betonwegen
Reinout PoldersPage 28
November 2011
Dedicated Truck Lanes Investigated
needed to maintain the road up to 2040. The costs of the parts of the highway that are already
destined to be altered or constructed by the government are fully assigned to the dedicated truck
lane. This is justified by the fact that the dedicated truck lane will take a lane from other road users.
Table 2.6 Total costs for construction and maintenance
Total CostsMaasvlakte - Vaanplein 1.400.000.000Vaanplein - Nijmegen 4.774.347.826Nijmegen - German border 750.000.000Total Construction 6.924.347.82
6Routine Maintenance 11.077.524Periodic Maintenance 68.019.575Total Maintenance 79.097.099Total Construction and Maintenance 7.003.444.92
6
Now that chapter 1 and 2 provided the fundaments, the report can estimate the effects of the
proposed dedicated truck lane. The estimation of the infrastructure is a complex process. In order to
make the analysis as extensive as possible, the report will draw a parallel with an earlier Dutch
infrastructure project of the same scale; the Betuwe-route. The process of the Betuwe-route should
provide the essential information that needs to be incorporated in the analysis for the proposed
dedicated truck lane.
Reinout PoldersPage 29
November 2011

Dedicated Truck Lanes Investigated
Chapter 3: Lessons from the Betuwe-route project
Given the complexity of predicting the economic effects of infrastructure investments, it is important
to draw a parallel with earlier major infrastructure projects. Assessing what steps have been taken in
predicting these effects in earlier reports could provide a valuable lesson for this report and future
infrastructure analyses. The Betuwe-route project can serve as a reference point in this case. This
project was primarily aimed to increase the hinterland connections for the first Maasvlakte container
terminals. By critically evaluating the decision making process of this project, this chapter should
provide insight in the necessary components of a proper infrastructure investment effects prediction.
The first paragraph of this chapter focuses on the main motivations behind the investments in rail
transportation, whereas the second paragraph discusses the economic prediction reports in detail.
3.1 The Betuwe-route: a short overview of its controversial historyThe scale of the Betuwe-route investment plan resulted in a nation-wide discussion that stretched far
beyond rational economic reasoning. Especially the fact that a rural region that had to be crossed in
order to complete the railway track led to much controversy. As a result of the controversy around
the Betuwe-route, there is a large supply of evaluation studies and project reports. These studies can
be helpful to reconstruct the decision making process. The decision making process is especially
interesting for this study, because it should provide information about the main arguments in favour
of the Betuwe-route. This section is aimed to explain the history of the Betuwe-route chronologically,
and discuss the political and economic arguments shortly. These arguments are important for the
rest of the thesis, because they can explain the tendency to prefer rail transportation over road
transport.
In this section we draw heavily on the report ‘Reconstructie Betuwe-route: De Besluitvorming
Uitvergroot39’. This is a reconstruction of the whole project performed by a special task force.
3.1.1 Introducing the Betuwe-route project The original plans for the Betuwe-route were presented at the beginning of the 90s. At the end of the
80s, three factors stimulated the idea for investments in rail transport. The first factor is the
‘mainport’-concept, which was invented in the Netherlands in the 80s to help revitalize the national
economy. A component of this mainport-concept was the construction of the first Maasvlakte. This
first major expansion of the port of Rotterdam required investments in transport infrastructure, as is
the case for the expansion that is planned for the coming 5 years. Rail transportation was thought to
39 Reconstructie Betuwe-route: De Besluitvorming Uitvergroot (2004) Tweede Kamer, vergaderjaar 2004±2005, 29 283, nr. 7
Reinout PoldersPage 30
November 2011

Dedicated Truck Lanes Investigated
be important to sustain the competitiveness of both the Rotterdam region as well as the Amsterdam
region. The second factor affecting the momentum for the Betuwe-route is the European focus on
the trans-European railway network adopted by the EU, which was aimed to increase efficiency of
rail transport between countries. Third, the sustainability of economic activities became more
important at that time. The special committee that advised the government largely relied on the first
factor as a major argument to construct the Betuwe-route. As a result, the Betuwe-route was put on
the official government plans for the first time in 1990. Estimated costs: 2,5 billion gulden (around
1,2 billion euro).
Directly after the government put the Betuwe-route on the agenda, the Dutch rail transport provider
the Nederlandse Spoorwegen (NS) started thinking about the possibilities for their business. This is
the point where the majority of the regional policymakers heard of the Betuwe-route for the first
time. Because of the uncertainty of what would happen to the living conditions in their area, local
and regional policymakers started criticizing the Betuwe-route heavily. As a response to this
controversy, the government assigned two cost-benefit analyses to consultancy firms; the
consultancy firm Knight Wendling was assigned to investigate the effects of the Betuwe-route on the
Dutch economy whereas the consultancy firm McKinsey focused on the exploitation of the Betuwe-
route. For this thesis, the report of Knight Wendling is essential; the report will extensively be
discussed in the next section. The Knight Wendling study gave a very positive picture of the effects of
the Betuwe-route; the Centraal Planbureau (CPB) adjusted the predicted benefits of the Betuwe-
route a year later into a more realistic picture. Nevertheless, both studies led to the same conclusion;
the Betuwe-route was expected to be beneficial for the Dutch economy. Risks and uncertainties were
underexposed; the government stressed the fact that delay in the construction process could hurt
the competitiveness of the Dutch economy. As a consequence, the plans for the Betuwe-route did
not fulfil the wish of the lower governments to minimize the pollution of the landscape.
3.1.2 The Dutch polder-model: first delays From this point, the debate regarding the Betuwe-route exploded. Every involved party (businesses,
political proponents and opponents) hired consultancy firms to conduct a study that would be
advantageous for their perspective. This continuing debate caused the whole project to delay; where
Knight Wendling assumed that the first trains would be able to travel in 1999, the project still was
not accepted by the central government in 1994.
It is at this point that the academic world started to participate in the economic discussion; both
Muller (Erasmus University Rotterdam) as well as Bomhoff (Nyenrode Forum for Economic Research)
came up with a study with criticism towards the initial predictions of the CPB and Knight Wendling.
Reinout PoldersPage 31
November 2011

Dedicated Truck Lanes Investigated
Both studies will be discussed in depth in a later section. The criticism led to a new working paper of
the CPB with adjustments and corrections on their existing calculations. With these new calculations,
the political situation in the Netherlands calmed down. In 1995, the final plans for the Betuwe-route
were created. One major pre-condition for the success of the Betuwe-route was to make road
transport less attractive; levies would have to be imposed but preferably this would happen on a
European scale. In order to increase the chances of success for the Betuwe-route, active flanking
policies towards reducing the attractiveness of the road transport sector were advised. It is therefore
not surprising that the road transport sector reported lower growth rates in the first decade of the
21st century (see chapter 1).
3.1.3 Execution of the projectThe construction of the Betuwe-route started eventually in 1995. The costs of the project were
estimated to be around 8,2 billion gulden (3,7 billion euro) at that time. The whole project was
expected to be finished by 2005; already 5 years later than the initial Knight Wendling report
assumed in their calculations. From the start of the construction process, estimated costs turned out
to be lower than the actual costs that would be needed to construct the project. By the end of 2004,
the estimated costs were already increased up to 10,57 billion gulden (4,8 billion euro). Not
surprisingly, this new information regarding costs and completion of the project led to a new wave of
critics and debates. This thesis will skip the details of these developments; the only essential
information is that from this point the responsible minister started blocking new cost-benefit
analyses. The minister denied the possibility that the new information could change the profitability
of the project and argued that the arguments in favour of the project used in 1994 still hold. It is
therefore difficult to say what was the exact reason behind the significant difference between
predicted and actual investment costs.
3.1.4 Anno 2011In 2007, the first trains finally started to use the Betuwe-route. The new infrastructure still did not
function as was assumed in the initial plans. Anno 2011, the connection to the German railway
system is still not completed. While the number of trains still increases, the actual level of efficiency
does not come close to the level that was presented by the government at the start of the 90s. In
addition, the exploitation of the Betuwe-route has not been profitable in the first 5 years. Not
surprisingly, this up-to-date information violates the assumptions made in the cost-benefit analyses
and could therefore alter the profitability of the whole project. In order to avoid the mistakes that
were made in the economic reports regarding the effects of the Betuwe-route, the next paragraph
will discuss these 5 main reports.
Reinout PoldersPage 32
November 2011
Dedicated Truck Lanes Investigated
3.2 Betuwe-route cost-benefit studies; what can be learned from these reports?The long debate about the economic effects of the Betuwe-route and the suspected subjective
approach of some government officials to the topic are a motivation to revise the economic reports
preceding the construction of the Betuwe-route. The reports concerned with predicting economic
effects of the Betuwe-route could serve as a lesson for future studies; methods could be improved
and the overall perception of modalities could be altered with the help of an extensive analysis of the
initial studies. The initial cost-benefit study for the Betuwe-route has been carried out by the
consultancy group of Knight Wendling in 1992. Being the first report, all following reports opted to
use the Knight Wendling report as a starting point. In particular, the criticism of the following reports
concentrated on four elements of the Knight Wendling report;
1. The too positive attitude towards rail transportation when compared to other modalities
2. The poor argumentation behind the good flow predictions
3. The multipliers used for predicting indirect effects of the Betuwe-route
4. The image effects assigned to the construction of the Betuwe-route
This paragraph will discuss these four points and directly include criticism from the other reports.
These four points are the major components for the rest of this thesis; their shortcomings in the
Knight Wendling report will be improved in later chapters of this report. Other components of the
Betuwe-route reports are beyond the scope of this thesis, either because there is a consensus
amongst the reports or they are not relevant for the result of the calculations.
It should be noted that the Knight Wendling report is written in 1992. Nearly 20 years later, it is easy
yet unfair to judge the Knight Wendling report on its assumptions regarding economic and political
development up to 2015. Most important is whether the assumptions are supported by proper
argumentation. The four points will therefore be judged mainly on objectivity and rationalism.
3.2.1 The too positive attitude towards rail transportation when compared to other modalitiesIn order to understand the argumentation of the later components, it is necessary to put the Knight
Wendling study in the right perspective. As already made clear in the preceding chapter, there was a
tendency to prefer rail transport over trucks. Various stakeholders, some also present in the
government, were therefore better off when the cost-benefit analysis would correspond with their
preferences. The structure of the report already suggests a part of the study’s attitude towards the
different modalities. The report is structured as follows; it compares the expected situation when the
Betuwe-route is constructed with two ‘zero’ alternatives. The ‘zero’ alternatives represent the
situation without the Betuwe-route; alternative A does not involve any changes in transport and
Reinout PoldersPage 33
November 2011

Dedicated Truck Lanes Investigated
logistics supply whereas alternative B assumes an improved service quality of the barge sector. This is
a first indication of the stance of Knight Wendling towards the road sector; improvements of the
road sector are not included in the ‘zero’ alternatives, nor are they the discussed as a possibility. It is
not entirely clear where this neglecting of the road sector originates. Obviously, the road sector is
dealing with one major problem; congestion. Yet this is also true for the rail sector in the situation
before the Betuwe-route; the fact that railways had to be shared with passenger transport induced
delays for goods transported by train. In addition, multiple assumptions will need to hold if the
predicted capacity of the Betuwe-route has to be achieved.
Muller (1994) supports this notion; he claims that the predictions for rail transport are supported by
very strict assumptions with respect to both service efficiency and infrastructure connections with
Germany. The expectations of Knight Wendling for rail transport can therefore be seen as the
optimal situation, it is likely that the actual capacity is lower. For this thesis, it will thus be necessary
to assess the actual capacity and to determine the possibilities for capacity increases objectively.
Another argument put forward by Knight Wendling for the focus on improving rail transport is the
fact that the appreciation of the Dutch railway system is on the average level when compared to
other major European countries (sources; CPB, IMD and World Economic Forum). Hence, the
Betuwe-route could help to improve the appreciation of the railway system and thereby strengthen
the perception of the Netherlands as the best logistic services provider of Europe. In addition, the
appreciation of the Dutch road network is the lowest amongst the major European countries. Knight
Wendling thus argues that failure to improve other modalities, implying a sustained focus on road
transport, could significantly hurt the strength of the Netherlands as a specialized logistics country.
Again, the Knight Wendling report completely neglects the fact that there are numerous
improvements to make in the road sector. Given the fact that the appreciation of the road sector is
very low both in absolute as well as in relative terms, investments in the road sector may well lead to
a bigger increase in the perception of the Netherlands as a logistics country than the same
investments in the rail sector.
The last, and most often used, argument is the fact that road transport is much more polluting than
other modalities. A sustained focus on the road sector would therefore imply much higher costs for
society. This is a valid point, yet again the Knight Wendling report fails to adequately include a major
pro of the road sector. Given the fact that trucks have a relatively short lifetime, technical
innovations are spread rapidly among the trucking sector. We do not blame Knight Wendling for not
including this effect in the calculation. As said, political developments are hard to incorporate into
the report. Since the major force behind the technical innovations aimed at reducing pollution has
Reinout PoldersPage 34
November 2011

Dedicated Truck Lanes Investigated
been the European Union, it was impossible to predict the kind of decrease in pollution that has
occurred in the last decade. Nevertheless, it is an important drawback of the Knight Wendling study
since external costs of the road sector are estimated too high.
Not only are the external costs for road transport too high, Muller (1994) comments that the effect
of the Betuwe-route is underestimated. To support this argument, he uses a Multi Criteria Analysis.
This was a rather new way of predicting at that time, yet it is widely accepted in policy reports
nowadays. The calculations of Muller are focused on the construction costs and the loss of nature,
with in addition predictions for exploitation of the Betuwe-route. Muller does take into account
some developments with respect to ‘cleaner’ trucks; not surprisingly his conclusion is that the
benefits of the Betuwe-route are overestimated. The Multi Criteria Analysis will be discussed further
in the next chapter as a possibility for improving calculations.
While the level of external costs remain arbitrary, the added value that is created per modality is
more or less ignored in the Knight Wendling report. The CPB (1992) shows that the added value per
ton of goods for road transport is much higher than the added value per ton of goods for rail
transport. The CPB comments that it would therefore be more profitable to shift all goods to road
transport in theory. From this argument of the CPB it might be concluded that while road transport
brings relatively high external costs, these costs can well be covered by the relatively high added
value ensuring a net profit for the total society.
For the calculations of this thesis we have to conclude that it is very important to use proper support
when comparing different modalities and at least mention when a scenario can only be seen as a
best future expectation. In addition, corrections will have to be made for the added value differences
between the modalities.
3.2.2 Prediction good flowsHaving presented the structure of the analysis, the Knight Wendling report continues by discussing
demand predictions. These predictions are build up with the help of economic outlooks written by
the CPB4041. Three scenarios were developed by the CPB; Balanced Growth (BG), European
Renaissance (ER) and Global Shift (GS). It is not entirely clear which of these three scenarios is
perceived as most likely by Knight Wendling, yet it does not matter for their argument anyway. All
three scenarios show that demand for rail transport exceeds the railway supply in 2015 by far. The
scenario with the slowest economic growth (Global Shift) already predicts a demand of 27 million
40 Centraal Planbureau, Scanning the Future; een lange termijn scenariostudie over de wereldeconomie voor de periode 1990-2015 (1990)41 Centraal Planbureau, een scenariostudie van de Nederlandse economie voor de periode 1990-2015 (1990)
Reinout PoldersPage 35
November 2011
Dedicated Truck Lanes Investigated
tons. In the ‘zero’ alternatives, the expectation of rail transport supply is expected to fall back to a
‘non-existing’ level where only 5 million tons of goods can be transported. The pressure of passenger
transport is in this case too high to allow for a financially healthy rail transport provider.
The Betuwe-route is thus needed to ensure the possibility for rail transportation of goods that are
shipped to the Rotterdam port, according to the Knight Wendling report. The total capacity of the
Betuwe-route is estimated at a level of 65 million tons, of which 13 million tons will go to national
destinations. These figures are estimated with the help of the exploitation report written by
McKinsey42. The biggest share is thus aimed at the foreign hinterland, yet this requires additional
assumptions. First of all, the connection to the German railway system (situated near Zevenaar)
needs to be optimized; removal of delays at the borders are a necessity. In addition, European
integration of the rail transport sector needs to take a huge step forward with respect to the
reduction of technical and legislative barriers between countries. Anno 2011, neither of these two
requirements have been met. In addition, the expectation of the railway supply starting point has
shifted 8 years from 1999 to the actual starting year of 2007. The predicted benefits of the Knight
Wendling for constructing the Betuwe-route are therefore artificial, but nevertheless valuable since
they can serve as a lesson for future good transportation expectations.
In the case the Betuwe-route is not constructed, there are four options that remain. The first option
is that goods are shipped to another port in Europe, since the Netherlands cannot provide the
essential railway network. This argument especially holds for cargo with a destination in Italy,
Switzerland, Austria and to lesser extent Eastern-Europe. The ports of Hamburg and Le Havre offer
railway services to these countries as well, which will imply a national loss for the Netherlands of
total transported goods when the Betuwe-route is not constructed. The other three options for
transportation are road, barge and barge/rail. All three options will take over a share of the total of
65 million tons that were supposed to be transported via the Betuwe-route. The performance of the
three modalities are tested with a matrix including the variables of speed and reliability. The
modalities only serve as a proper alternative when the costs are not more than 10%-higher than rail
transport.
In the case of ‘zero’ alternative A, thus without improved service quality of the barge sector, the only
case where barge and barge/rail transport are proper alternatives is in the case where speed and
reliability are not requirements for transportation quality. Road transport is therefore the only
substitute of rail transport in the most cases, and given the fact that road transport is very expensive
the total direct loss of goods transportation is the highest in this case; 28,9 million tons by 2010 (48%
42 McKinsey & Company (1992), Economische aantrekkelijkheid goederenvervoer per spoor
Reinout PoldersPage 36
November 2011

Dedicated Truck Lanes Investigated
of the 60 million tons demand in the ER scenario). The rest of the demand shifts to road
transportation (10,3 million tons, 17%), barge transport (15,7 million tons, 26%) and barge/rail
transportation (5,1 million tons, 9%). In the situation with improved service quality of the barge
sector, the direct loss of goods is only 21,1 million tons by 2010 (35% loss). The rest of the demand
shifts to road transportation (7,6 million tons, 13%), barge transport (23,3 million tons, 39%) and
barge/rail transportation (8,0 million tons, 13%). The two ‘zero’ alternatives thus have implications
for the rest of the study through the modal split of transported goods, as well as the direct loss of
total goods transported.
The CPB (1992) criticism on the Knight Wendling good flow analysis has a special focus on rail
transport predictions for the scenario of construction of the Betuwe-route. As mentioned, Knight
Wendling argued that the current rail transport supply was under heavy pressure created by
passenger transport. In the case the Betuwe-route would be constructed, Knight Wendling implicitly
assumed that good transport would have a priority over passenger transport. As such, rail transport
for goods could grow up to (and in the last years beyond) the maximum capacity of the
infrastructure. The CPB argues that this assumption is much too positive given the political
preference for passenger rail transport in order to take pressure from the roads. Calculations with
the correction for scarcity of the railways lead to lower net present values for the Betuwe-route;
between 1,9 billion and 2,6 billion gulden.
Muller (1994) adds to this criticism from another perspective; he argues that the direct loss of goods
in the two alternatives are highly arbitrary and have an obvious preference for rail transport. The CPB
also mentions this, yet they do not want to replace the Knight Wendling predictions with their own
arbitrary predictions43. Muller however does not want to discuss the volumes of the loss of goods; it
is the type of goods that are arbitrary and lead to biased results. Knight Wendling assumes that the
goods loss when the Betuwe-route is not constructed consists entirely out of containers; no general
cargo or bulk goods are included. Since containers have the highest added value of all good types, it
is clear that the Betuwe-route alternative is favoured over the other alternatives when using only
containers in the calculation. In order to improve infrastructure predictions, it will thus be necessary
to correctly estimate the total good composition.
As a response to the criticism of Muller and the debate in the government, the CPB presented a new
report on the Betuwe-route in 199544. Contrary to the first CPB-report, this report does discuss the
43 Centraal Planbureau, De macro-economische effecten van de Betuweroute, werkdocument 52, 199344 Centraal Planbureau, Economische effecten van de Betuweroute op basis van recente informatie, werkdocument 75, 1995
Reinout PoldersPage 37
November 2011

Dedicated Truck Lanes Investigated
arbitrary good flow predictions of Knight Wendling. Not only are the decreasing marginal costs
overestimated, the endogenous cost increases for trucks are support by unrealistic strict
assumptions. The good flow analysis of Knight Wendling is a combination of best future expectations
for rail transport and worst future expectations for trucks, according to the CPB. This maze of
arbitrary assumptions should be avoided in this thesis.
The main lesson from the Knight Wendling good flow analysis is that an overkill of arbitrary
assumptions reduces the relevance of predictions. Possible future benefits should be mentioned in
the report, but to take these benefits for granted in calculations is not valid. A report with a
‘tempered’ future expectation makes a much stronger case than a report filled with unrealistic
assumptions. In addition, there is no such thing as ‘a’ good. Good volumes should be specified with
respect to their characteristics (containers, bulk etc.) in order to calculate the proper added value
changes.
3.2.3 Arbitrary MultiplierThe macro-economic cost-benefit analysis distinguishes between three effects; the direct, indirect
and image effects. The direct effects are represented by the developments for the government as
well as the transport sector. The main framework for the direct effect is based on the good flow
analysis. The indirect effects are measured by the effects on the regions of Rotterdam, Amsterdam
and the regions that serve as important nodes in the hinterland (region of Venlo and Nijmegen). The
main method adopted here is to make use of multipliers.
The first and most important region that is affected by the Betuwe-route is the port-area; the
Rotterdam region. The Knight Wendling study argues that the Betuwe-route is essential for securing
other investments like the Maasvlakte 2. In addition, the argument of competition for the European
hinterland is again put forward. With respect to quantification of these effects, the Knight Wendling
study makes use of multipliers that are provided by studies performed by the port authority (GHR).
Not surprisingly, the multiplier is rather high; for every job created in the port area, 3,2 jobs are
created in the region of Rotterdam. There are no studies to compare this multiplier, yet nevertheless
this number seems rather high given the big share of goods with a destination outside this region.
Compared to the Betuwe-route scenario, the ‘zero’-alternative A would have a lower added value of
5.8 billion gulden while ‘zero’ alternative B has a lower added value of 4 billion gulden. These figures
are based on a quite simple calculation. First, the jobs per million tons of goods handled in the port
are determined (for 1992). After that, the expected increase in tons of goods handled is used to
determine the amount of new jobs that are created. There is a minor adjustment for efficiency
increase (20%), yet further adjustments for economies of scale are not put into place.
Reinout PoldersPage 38
November 2011
Dedicated Truck Lanes Investigated
Muller (1994) does not agree with the used multipliers for multiple reasons. First, the ideal multiplier
is depending on the modality used. Knight Wendling’s multiplier is only related to the volume of
goods, yet it is more likely that road transport will have a higher indirect effect on the Rotterdam
region than rail transportation. Furthermore, a multiplier should either explain a forward or
backward linkage; failure to do this would actually mean that the Dutch economy is twice as big as in
reality. Last, it is not allowed to combine multipliers when multiple sectors are combined in the
equation. Since these three points of criticism have to hold, Muller argues that it is only possible to
predict the maximum effect on the regional economy.
Costs of Labour
Knight Wendling does not take into account any conditions on the labour market; a view not shared
by the CPB (1992). According to the CPB, major infrastructure projects could distort labour market
conditions by a demand shock. As a result, wages will go up and profit margins of firms are under
pressure. Exporting firms will especially be hurt because of the lower competitiveness. In the long-
term this leads to a net loss for the Dutch economy, as argued by the CPB. Bomhoff (1995) is very
critical towards this approach; he argues that this argumentation could be applied to every case,
leaving no room for future investments at all. This approach lacks realism, mainly caused by ignoring
effects on the supply side of the economy. Bomhoff suggests that a major infrastructure project
would not only lead to an increase in production, but also an increase in productivity. A change in
efficiency would then occur, removing some pressure off profit margins.
The CPB approach seems indeed a little too harsh in this case, only under strict assumptions with
respect to demand and supply of transport services their theory can hold. Bomhoff’s argumentation
could be tested with the help of determining the total factor productivity, however it is very hard to
isolate the effects of the new infrastructure in this case. This effect is complex to measure, yet is does
not stretch beyond the scope of this thesis per definition.
3.2.4 Image effectsOne major components of the image effect is the effect on the attractiveness for European
Distribution Centers to settle in the Netherlands. At the start of the 90s, there was a tendency for
firms to make use of one big European distribution center rather than multiple national ones. The
expectation at that time was that this trend would continue up to 2010. Anno 2011, the distribution
sector has evolved into a more hybrid network; European centers combined with national and
regional centers. As such, the effects predicted in the Knight Wendling study might be overstated. In
addition, a part of the effect might already be captured in the indirect effects predictions. The total
Reinout PoldersPage 39
November 2011
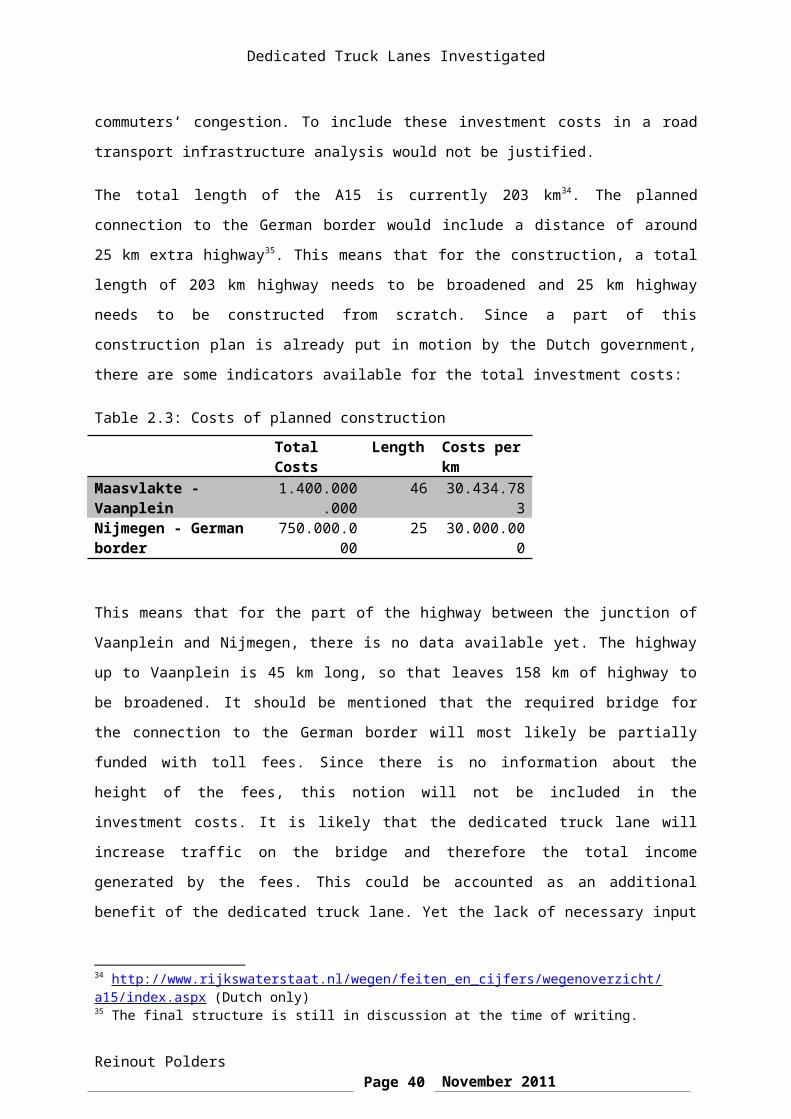
Dedicated Truck Lanes Investigated
loss in added value compared to the Betuwe-route scenario is 0,5 billion gulden for alternative A and
0,4 billion gulden for alternative B.
The second major component that is affected by the image effects is the attractiveness for
manufacturing sector to settle in the Netherlands. A better transport infrastructure could definitely
increase the chance of firms to settle in the Netherlands, yet it is just one of various factors that
influences the decision. The CPB 1992 report agrees with Knight Wendling on this point; they
conclude that it is therefore not relevant to take image affect into account. Since no proper effect
can be assigned to the construction of the Betuwe-route, no calculation should be made at all.
Bomhoff (1995) tries to support the Knight Wendling report by showing references that prove that
infrastructure provision is a major determinant for foreign investments. He does not provide a
method of how to measure the effects of the Betuwe-route however.
With respect to the image effects, this thesis agrees with the CPB approach. Without a doubt, there
is some effect of a major infrastructure project on the foreign perception of the Netherlands. Yet
without a proper method, it is not justified to take into account these image effects. In addition, we
believe that perception is shaped over a long period; it is therefore also not changed in the short-
term. In contrast to the Knight Wendling report, this thesis will not assign any image effects
infrastructure investment project.
3.3 Conclusion This Betuwe-route project provides a couple of important lessons for this report and future
infrastructure investment reports. The first paragraph showed that the main motivation for rail
transport investment was the sustainability of transportation; a point that is also attended to by the
dedicated truck lane. In addition, a major lesson from the project is that predictions should be made
with much caution; suspected subjectivity led to unrealistic positive expectations in politics. The
second paragraph discussed the four main points of controversy in the Knight Wendling paper with
the help of other reports concerning the Betuwe-route. One of the four points, the image effect, has
been regarded as impossible to measure. Perceptions are based on multiple factors and do not
change very quickly; this makes it difficult to assign image effects to infrastructure investment
projects. The three remaining points will be central in the remaining chapters of the report. Note that
this means that for a large part, the structure of this thesis will correspond with the Knight Wendling
structure. The too positive attitude towards rail transportation is especially important for predicting
future social costs. An overview of the actual external costs that are created by truck traffic will be
given in chapter 6. To some extent this perception is also of importance for the direct effects of
infrastructure, yet this effect is mainly influenced by the good flow analysis. A part of this good flow
Reinout PoldersPage 40
November 2011

Dedicated Truck Lanes Investigated
analysis has already been presented by the first chapter. The quantification of this effect will follow in
the first part of chapter 5. Last, the indirect benefits, that have been determined by the use of
multipliers in the Knight Wendling report, will be dealt with in the second part of chapter 5.
The next chapter will present the recent methods used in literature to assess the effects on the
above mentioned aspects. Since the Knight Wendling report was written in 1992, major
improvements have been made in the methodology concerning the quantification of the direct,
indirect and social effects. An overview of this recent methodology can help to avoid the
shortcomings that were present in the quantification of the Betuwe-route project.
Chapter 4: Recent methodology for evaluating infrastructure
Reinout PoldersPage 41
November 2011
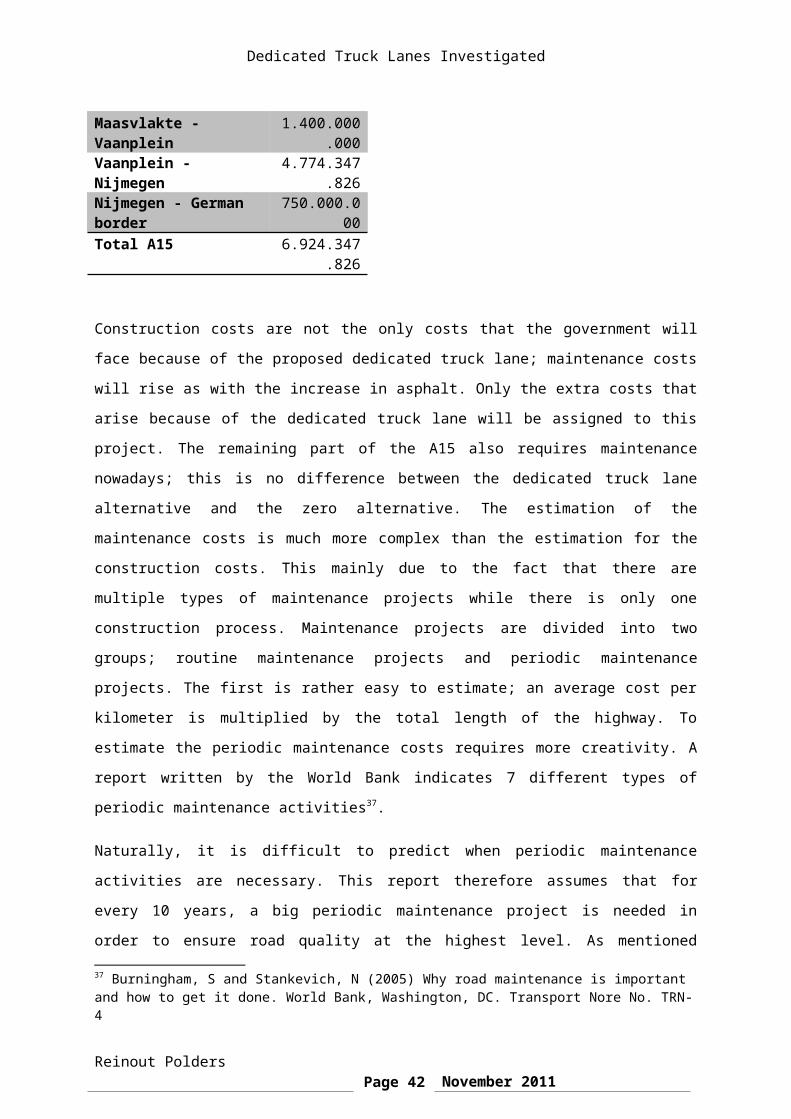
Dedicated Truck Lanes Investigated
Methods to evaluate infrastructure plans have changed dramatically in the past 20 years. Where it
was still possible in the early 90s to make use of relatively simple calculations, complete formats are
present nowadays in order to create structure in infrastructure discussions. It is much more easy to
compare different infrastructure projects when making use of a standardized method. However, the
most important benefit of these formats is the reduced complexity with in addition more room for
objectivity; within a standard format it is more difficult to influence outcomes of calculations.
The first paragraph of this chapter will discuss the formats that have been created and argue which
one of these formats is best applicable to this case. These formats are especially focused on social
costs of infrastructure projects. An additional literature study for direct and indirect effects is
conducted; these applied methods will also be discussed in this chapter. Overall, this chapter should
provide the framework which will be used to calculate the effects of road transport infrastructure
investments.
4.1 Social CostsSocial costs represent all effects that do not take place in a ‘real market’. These externalities have a
wide range and since a real market is missing, it is difficult to put a price on the costs that are
generated by infrastructure projects. Given these methodological difficulties, with in addition the
growing public awareness of negative effects of economic activities, the Dutch government has been
active to create a standard format that helps to determine the social costs of infrastructure
investments.
The format is called OEI (Overview Effects of Infrastructure), The main task of this format is to
provide researchers with a guideline in their studies. The format is the basis for a social costs benefit
analysis with an emphasis on quantitative methods. In order to measure externalities in a
quantitative way, the Dutch government provides ‘kengetallen’: standardized prices for social costs.
This is a first disadvantage of this method; these standardized prices do not necessarily have to
reflect the actual effects of the externalities. Four categories of social costs are defined; connectivity,
safety, living environment and investment and maintenance costs. For projects with a large scale,
additional modules have been developed for environmental costs and indirect effects. The OEI-
format is not revolutionary in its methods, yet it is the first format that is able to narrow down the
rather complex social costs issue to a manageable project.
The counterpart of the OEI-format is the Multi Criteria Analysis. This method deals with the same
kind of social costs, yet it tries to measure the effects in a qualitative way. Instead of expressing all
costs in money, the different costs are now reflected by plusses and minuses. A larger scale of the
Reinout PoldersPage 42
November 2011
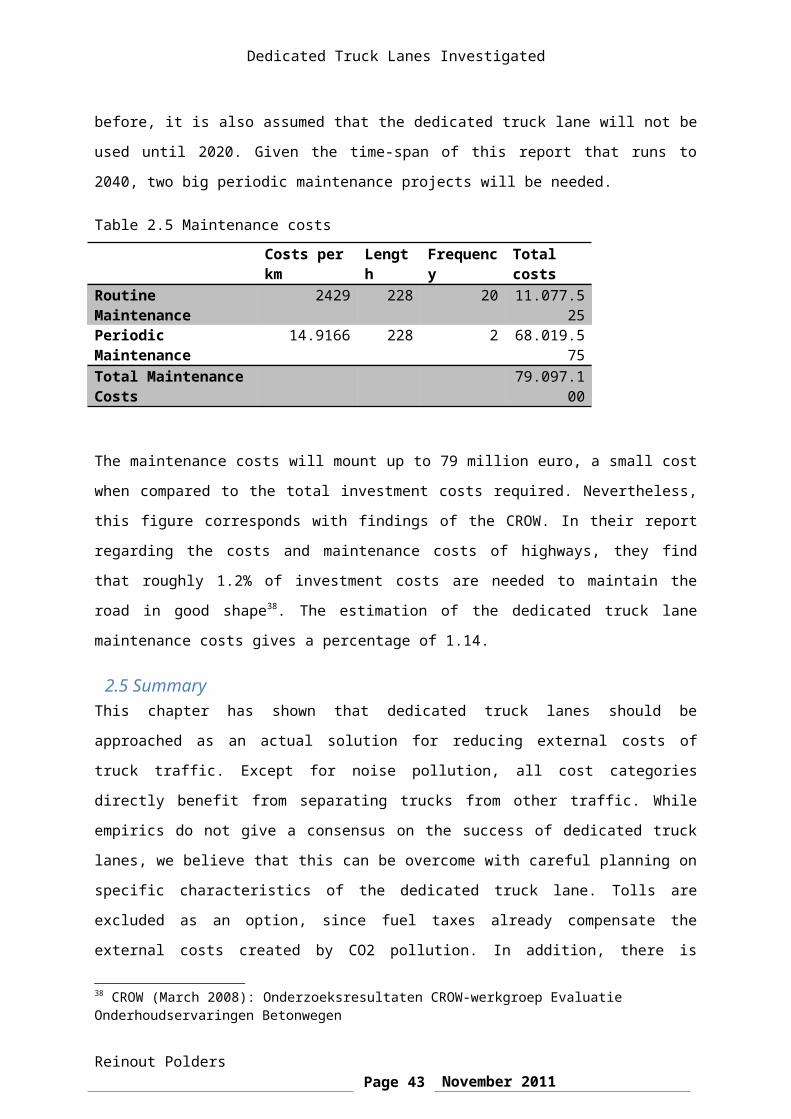
Dedicated Truck Lanes Investigated
effect can result in a double plus or double minus. A big advantage of this approach is the further
reduced complexity; no difficult calculations have to be made in order to reveal the effects of
infrastructure. In addition, the disadvantage of using standardized prices for social costs
(kengetallen) is avoided.
Despite these two advantages, the usefulness of the qualitative approach is reduced by numerous
disadvantages. First, there is more room for subjectivity in this approach. Since costs are not
quantified, it is difficult to compare costs with each other. Researchers are therefore free to choose
when a double plus or minus is assigned to a costs. If a researcher were to have an agenda, he could
still influence the result of the analysis in this way. In addition, the reduced complexity is not
combined with reduced transparency. Quantitative methods may be more difficult to understand,
yet it is a universal tool in economic science. Qualitative analyses are not; discussions can be steered
in any direction. Failure to include all components of a cost could lead to biased results.
Given the transparency and objectivity of the quantitative approach, we believe that it is necessary
to use this OEI-format in this thesis. One of the main shortcomings of infrastructure analysis (the
Betuwe-route in particular) is the suspected subjectivity of research. In order to open the discussion
for truck traffic in a sustainable and productive way, it is a necessity to keep the discussion as
transparent and objective as possible in this thesis.
4.2 Direct effectThe direct effects represent the effects on the transport sector. Infrastructure investment is expected
to be beneficiary for the transport sector. This is mainly based on the idea that transport firms make
use of three input factors; labour, private capital and public capital. Infrastructure investments
increases the public capital stock. This means that less labour and private capital are needed to
deliver the same service, hence an increase in efficiency for transport firms. However, not all modes
profit to the same extent.
The main goal of the direct effects analysis is to investigate the absolute level of the benefits and as a
result what happens to the modal split. The two most important components of this cost driver are
the good flow expectation and the modal split expectation. Remember from chapter 3 that for the
Betuwe-route, both expectations were highly arbitrary. This paragraph will explore the possibilities to
make the expectation as objective as possible. The actual good flow prediction and modal split
predictions will be discussed in the next chapter. The methodology that has been used in the Knight
Wendling report can serve as a proper tool for investigating the direct costs. No criticism towards
Reinout PoldersPage 43
November 2011
Dedicated Truck Lanes Investigated
these methods was brought on in the 90s. In addition, the direct effects need little use of complex
methods to be analyzed.
The main problem lies thus in the predicted good flows. Extensive use of available predictions in the
literature will have to provide predictions for this thesis. In order to avoid arbitrary predictions,
multiple sources will be used and sources will have to be judged on objectivity. As a precaution, it
might even be better to use the ‘worst case scenario’ for the alternative with infrastructure
investment. This will avoid all too positive predictions, ones that have a low probability of occurring
in reality. The direct effects analysis will be the extension of the good flow expectation that has been
presented in chapter 1.
4.3 Indirect effectsThe indirect effects represent the macro-economic effects of infrastructure. Given the wider scale,
the indirect effects are harder to measure than the direct effects. The Knight Wendling study opted
to make use of a rather simple method; the use of labour multipliers. Methodology nowadays differs
much from this approach. The role of simulation programs has become more important for
predicting macro-economic situations. Predictions have therefore become much more detailed and
objective, yet they are increasingly hard to implement too. This paragraph will assess what methods
are an improvement from the Knight Wendling approach and which of these methods can fit within
the scope of this thesis.
Before the tools are discussed a short note needs to be made on the nature of indirect effects. These
effects can be generative, but as is often seen in empirics a part of the effect has a distributive
impact45. When the scope of the indirect effects analysis is not sufficiently big, distributive effects
might abusively be seen as generative effect. This is the case when analysis happens on the regional
level whereas effects occur on the national level. In the case strong distributive effects occur, it might
seem that the analyzed region is positively affected at no costs to other regions in the same country.
Investment predictions will then be too positive. Therefore special attention needs to be given to the
scale selection of the indirect effect analysis. To avoid unrealistic predictions, it might be reasonable
to select the largest possible scale. The approach should thus significantly differ from the approach
taken in the Knight Wendling report. This study provided emphasis on the indirect effects on the two
mainport regions and the region Arnhem-Nijmegen, concluding that all effects measured would be
generative. A distinction for the mainport region of Rotterdam is still possible, yet only in the case
there is a proper correction for the effects on other regions.
45 Rietveld, P. (1994) Spatial economic impacts of transport infrastructure supply Transpn. Res.-A. Vol. 28A, No. 4, pp. 329-341, 1994
Reinout PoldersPage 44
November 2011
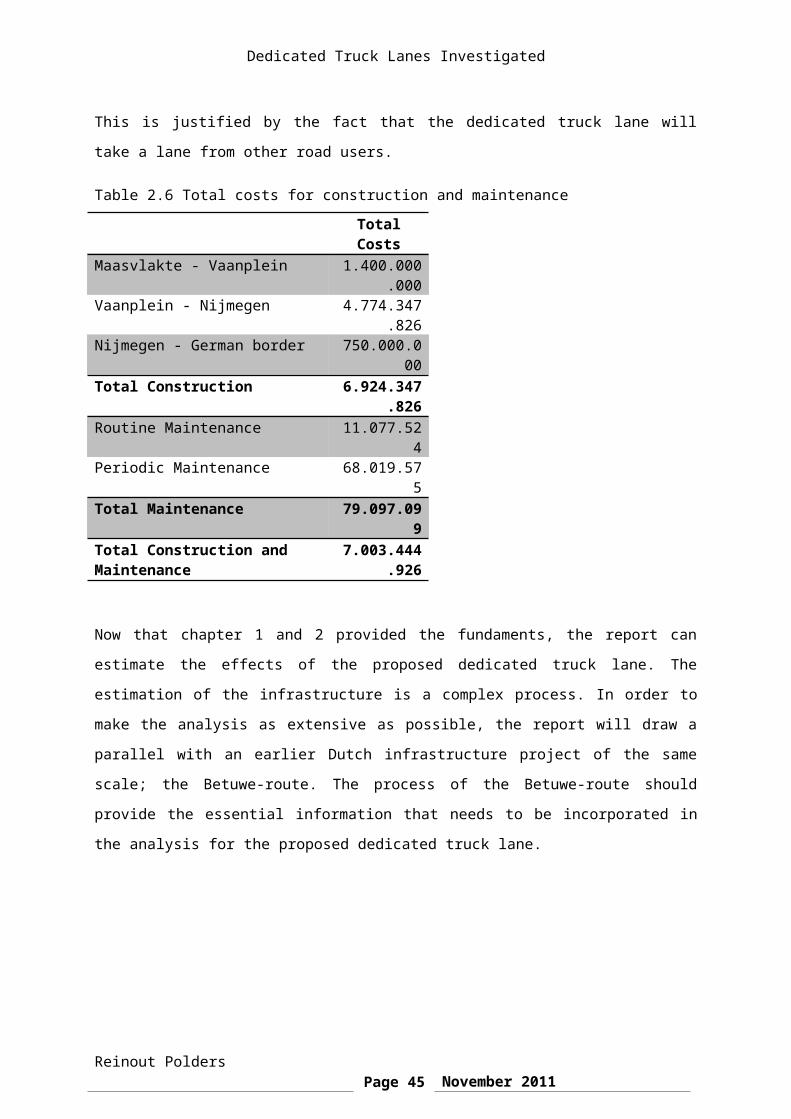
Dedicated Truck Lanes Investigated
The first tool to analyze the effects of infrastructure investments is surveys. This tool is aimed at
revealing preferences of firms and industries in order to predict changes in behavior after
infrastructure is constructed. Surveys can give a good indication of what will happen when new
infrastructure is constructed, yet they have a serious lack of accuracy. Respondents to surveys may
not know the full effect of infrastructure on their firm; their answers could then be biased towards
their own preferences instead of the firm’s. In addition, respondents are not always fully capable of
distinguishing the different effects of two alternatives as is used often in infrastructure predictions. It
is therefore not evident to completely rely on surveys for predicting indirect effects. However, the
qualitative analysis could be a welcome support for the often too theoretical models and
calculations. Without back-up from qualitative arguments, models are often too theoretical and
abstract. Therefore, this thesis will opt to include surveys from literature in order to sketch a
complete overview of infrastructure investments effects.
A second and more outdated tool is the (quasi)-production function. A normal Cobb-Douglas function
with labour stock and capital stock as explanatory variables for income is used. Included in this
function is the stock of infrastructure for a specific region or country. The effect of infrastructure
investment is analyzed by comparing income before and after the investment; changes in
infrastructure stock are expected to have an effect on income. In the case of a quasi-production
function the effect of infrastructure investment on labour and capital is measured. Infrastructure
investments are expected to alter the spatial pattern of labour and capital.
The advantage of this approach is that it is relatively easy to collect data; indices could be used to
determine stock levels. There is more than one disadvantage of this method however. First, it is
assumed that all stock levels are exogenous; income level should not affect infrastructure stock46.
This is a rather unrealistic assumption. Infrastructure investments are often put into place when
congestion starts to hurt economic growth. Since congestion is ultimately an outcome of an increase
in income, the assumption of exogeneity is violated47. Furthermore, a control group of regions
without infrastructure investments is needed. Finding regions with sufficient characteristics to act as
a control group is a hard task. When making use of the quasi-production function, more data is
needed for explaining the stock of capital and labour in a region. This brings additional
methodological difficulties. Overall, the (quasi)-production function is only applicable in the few cases
46 Rietveld, P. (1994) Spatial economic impacts of transport infrastructure supply Transpn. Res.-A. Vol. 28A, No. 4, pp. 329-341, 199447 Rietveld, P. (1994) Spatial economic impacts of transport infrastructure supply Transpn. Res.-A. Vol. 28A, No. 4, pp. 329-341, 1994
Reinout PoldersPage 45
November 2011

Dedicated Truck Lanes Investigated
where the methodological assumptions regarding exogeneity of income is assured48. Still, the (quasi)-
production function could shed a light on the direction and size of the effects. Outcomes will have to
be interpreted with caution, yet still this method is a step up from the multiplier analysis as applied
by Knight Wendling.
The most up to date method concerning macro-economic effects is the (Spatial) Computable General
Equilibrium Models (SCGE). This method is strongly influenced by the New Economic Geography
(NEG) approach that has been put forward by Krugman among others like Venables and Fagita. SCGE
models investigate the relationship between demand, supply and trade of industries and cities. NEG
has a special focus on the spatial distribution of economic activities. Transport costs are used in this
theory to explain the spatial pattern; the trade-off between agglomeration economies and
congestion costs lead to an equilibrium. The NEG theory with its SCGE model is therefore perfectly
suitable for analyzing redistribution effects. This is one of the main advantages compared to the
more general approach of the (quasi)-production functions.
The main disadvantage of the SCGE approach is that its well founded theoretical background induces
a comprehensive and complex quantitative model. In addition, a high level of detail is needed in the
data. One of the most important components of the NEG model is the love for variety; a theory that
explains why nations (or regions) trade products even though both nations produce the products in
that specific sector themselves. In order to complete the model, the relative importance of each
variety compared to every other variety is need; elasticities are essential. Elasticities are also needed
to estimate the relationship between labour and intermediate inputs. These elasticities are
particularly hard to estimate. The model also requires detailed bi-regional trade data and data on the
spatial pattern of economic activity.
Without these data issues, the SCGE model provides the best model for analyzing infrastructure
investment impact. Especially the suitability for investigating redistributive effects, implying a more
objective insight in the actual generative effects, is a major pro for using this tool. We do believe that
this tool should be applied wherever the data obstructions can be overcome. As for this thesis, the
obstructions are too large.
4.4 SummaryThis chapter discussed the methodological framework for the rest of the thesis. The framework is
split into three parts; the social costs, direct effects and indirect effects. For the social costs analysis,
48 Oosterhaven, J. and Knaap, T. (2003) Spatial economic impacts of transport infrastructure investments. Appeared in: A. Pearman, P. Mackie & J. Nellthorp (eds) Transport Projects, Programmes and Policies: Evaluation Needs and Capabilities, Ashgate, Aldershot, 2003, pp. 87-1
Reinout PoldersPage 46
November 2011
Dedicated Truck Lanes Investigated
the conclusion is that the Dutch OEI-format is the superior method. Quantifying the most important
social costs may increase difficulty in both reading as well as executing the study, yet it contributes to
a more objective and transparent discussion for infrastructure investments. The direct effects
analysis requires a proper and well-founded good flow expectation and a model split analysis. The
indirect effects analysis is subject to much more complicated methods. Qualitative methods can
provide useful back-up arguments for quantitative methods, yet to rely solely on qualitative research
is not helpful in this case. Subjectivity and a lack of knowledge may bias the results of surveys,
leading to unrealistic conclusions. For quantitative methods, there is a trade-off between quality and
ease of performing the research. Whereas production functions are fairly easy to incorporate, they
do have problems with finding robust results. This is not the case for SCGE models, but these are
subject to big data constraints. Since this thesis is primarily aimed at opening a objective discussion
for truck transport, we believe that it is evident to go with a second-best method. SCGE models are
superior to (quasi)-production functions, yet the data constraints are too big in order to overcome
within the scope of this thesis.
Chapter 5: Direct & Indirect effects
Reinout PoldersPage 47
November 2011

Dedicated Truck Lanes Investigated
This chapter will present two of the three components of the dedicated truck lane effects prediction.
First, the direct effects will be estimated. The input for this estimation is for a large part taken from
chapter 1. The second paragraph will focus on the indirect effects; these will be estimated with a
regression analysis.
5.1 Direct effectsThe main input for the direct effects analysis is the expected container volume that needs to be
handled by the transport sector. The expected container increase has already been discussed in
chapter 1; this is the main motivation for starting the discussion for investments in road
transportation. Without investments, the container increase cannot be handled by the transport
sector given the growth rates under excess demand that were reported in the period 2003-2008.
Both the rail and barge transport sector do not have the potential to increase their capacity to a level
that enables them to cope with the container increase in the port. The road transport sector has a lot
more potential if the government succeeds to reduce the burden of congestion.
The zero alternative does present some improvements. The governments current solution is to
increase highway capacity at certain points; from the Maasvlakte to the junction of Vaanplein and
from Nijmegen to the German border. Especially the first will have little effect on the capacity of the
road transport sector, since the point where the improvements stop will become a new bottleneck;
the congestion in this case is only shifted. The road transport sector is therefore not able to increase
its capacity drastically in this case. The yearly capacity growth will be equal to the growth in the
period 2003-2008 that was presented in chapter 1; 1.8% per year.
This chapter will analyze the direct effects for the transport sector under the two alternatives. The
zero alternative represents the situation without investments; rail transportation is fully efficient and
will reach maximum capacity of 35 million tons of containers per year. The remaining volume of
containers will be evenly shared among road transport and barges. Note that both will not be able to
cope with this increase, which will lead to excess demand in both sectors. For the DTL alternative, it
is again assumed that rail transportation will reach maximum capacity of 35 million tons of
containers per year. The barge sector will grow at the rate that has been reported in the last ten
years, whereas road transportation will grow significantly faster because of the DTL. In this scenario,
the road transportation will increase its capacity in order to deal with the remaining containers.
5.1.1 Estimating total excess demand The total volume handled is depending on both supply as well as demand. The difference between
both alternatives is best captured when comparing the excess demand of both alternatives. Note
Reinout PoldersPage 48
November 2011
Dedicated Truck Lanes Investigated
that for rail transport and road transport (in the DTL alternative) excess supply can occur. Since the
approach towards economic predictions is cautious, we assume that this excess supply is not filled
with new demand. In the case of excess supply, the excess demand is therefore equal to zero. This
directly implies that the excess demand for rail transport is always equal to zero; the assumption was
that rail transport increased efficiency and supply is therefore always met by demand. Total supply of
rail transport cannot grow further than 65 million tons since this supply is totally dependent on the
Betuwe-route.
The difference between both alternatives is shown best with the help of a figure. Figure 5 .1 plots the
excess demand for both road transport as well as barges under both alternatives.
Figure 5.1: Difference in excess demand
2010201120122013201420152016201720182019202020212022202320242025202620272028202920302031203220332034203520362037203820392040
0
10
20
30
40
50
60 Difference in excess demand
ED zero roadED zero bargeED DTL roadED DTL barge
Year
Mill
ion
tons
of c
onta
iner
s
Note that there is no difference in excess demand until 2020; this is the year where the dedicated
truck lane is assumed to be ready. This implies that up to this year, the road sector has a lower
growth rate and therefore more difficulties with meeting the demand. In addition, the status quo
assumed that the growth in container volume would be evenly spread amongst the road and barge
sector. The barge sector is thus under more pressure in this situation. The effect of the proposed
dedicated truck lane is immediately clear after its introduction. The excess demand of the road sector
turns to zero as a result of the dramatic increase in capacity. In turn, the pressure on the barge sector
is lowered which results in a lower excess demand for this sector too.
Reinout PoldersPage 49
November 2011

Dedicated Truck Lanes Investigated
Table 5.1: Accumulated differences excess demand up to 2040
Zero alternative DTL alternative ∆Road Sector 336 21 315Barge Sector 650 139 511Total 986 160 826
Table 5.1 shows the impact with respect to total container volume of excess demand for both
alternatives. There is a clear difference between the two alternatives as was expected from the
earlier analysis. The volumes from table 5.1 will be used in the final calculations.
5.1.2 Predicting economic loss Zero Alternative The final results in table 5.1 allow us to continue to the calculations that will express the difference
between both alternatives in monetary values. In order to do so, there is still one input factor
missing. The economic loss and benefit of the alternatives will primarily be shown in gross operating
surplus of the two transport sectors. The gross operating surplus is chosen as the main input factor
since it limits the results to the transport sector exclusively. Employment effects are not used since
there is a trend to hire foreign low-skilled labour in the road transport sector. Wages are therefore
not always spend in the Netherlands, which reduces the value of employment effects as a proxy.
The gross operating surplus information is taken from the Eurostat database 49. Due to data
difficulties, the gross operating surplus per ton volume could only be calculated for the period 2005-
2008. The average of this period will be used as the main input for the calculations. A major
drawback of the unavailability of gross operating surplus statistics is that it proved to be impossible
to calculate the added value per type of good. This can make a significant difference; raw materials
demand less service and therefore transport of this good has a lower added value than general cargo
in containers. This implies that especially for the barge sector, where raw materials have a large
share in total transported volume, the average gross operating surplus per ton is estimated too low
for this calculation. This is due to the fact that the good flow analysis focuses primarily on containers.
For the road sector the estimated average gross value added is much more accurate. Furthermore,
the calculations will make use of an interest rate of 5%. This is in line with the original Knight
Wendling study for the Betuwe-route, yet it differs from the current methodological standard applied
by the Dutch government50. Table 5.2 shows the results of the calculations.
49 The Eurostat database does not provide Gross added value statistics per volume (tons, or tonkilometres). In order to retrieve this information we had to make multiple calculations. 50 The Dutch Government has changed the required interest rate in infrastructure projects from 5 to 4% after the Betuwe-route project. In order to sustain the parallel with the Betuwe-route reports we choose to use an interest rate of 5 percent however.
Reinout PoldersPage 50
November 2011
Dedicated Truck Lanes Investigated
Table 5.2: Economic Loss due to Excess Demand
Gross Added Value per ton Loss ZA (billions) Loss DTL (billions) ∆ (billions)Road Sector 318 34 4 30Barge Sector
311 71 23 48
Total 105 27 78
Table 5.2 presents the effects of the alternatives as follows; the excess demand for both alternatives
is multiplied by the gross added value per ton. The interest rate is inserted to determine the net
present value of both alternatives. The differences between the two alternatives are rather big; 78
billion euro for the next 30 years. This can be explained by the big difference in total volume of
containers transported, rather than by the gross added value per ton transported. Presenting these
figures as the direct effect on the Dutch economy would not be justified however. The expansion of
the EU has led to increased competition in the transport sector; the increase in container volumes
will only partly be handled by Dutch transport firms.
The competition is the heaviest in the road transport sector. Especially the low labour costs of
Eastern European firms result in reduced shares of Dutch transport firms in total volume. In 2010, the
share of the Dutch transport firms was estimated at 65%51. This share is expected to decrease
however; the volume handled by Dutch transport firms are assumed to grow with 2.6% whereas this
growth has been set on 4.7% for transport firms from other countries. Extrapolating this growth to
2040 implies that the share of Dutch transport firms in this year will be decreased to 50.9%. The
barges sector is much less complex; the Dutch barges face most of their competition from German
and Belgian transport firms. There is no information available for the shares of Dutch firms in volume
handled, yet the share of the Dutch capacity in the total capacity of these three countries is 55% 52.
Without additional information, it will be assumed that this share does not change up to 2040. When
correcting for the shares of the Dutch transport firms, the difference between the two alternatives is
set at 38.3 billion euro up to 2040.
5.1.3 SummaryThis paragraphs discussed the direct effects of the two alternatives on the transport sector in the
Netherlands up to 2040. In order to create a realistic scenario, predictions on the World economy
were combined with predictions for the Dutch economy and the Rotterdam Port in chapter 1. The
final good flow predictions in this report correspond with a low, stable economic growth in Europe.
In addition, the EU becomes more service-export oriented which implies an increased dependency 51 NEA (2007) Nota Toekomstverkenning vrachtvervoer over de weg (2007)52 Binnenvaart ondervindt onverwacht sterke tegenstroom. ING Economisch Bureau, september 2009
Reinout PoldersPage 51
November 2011

Dedicated Truck Lanes Investigated
on the import of intermediates and final products. As such, the container market will expand rapidly
whereas dry and liquid bulk remain at the levels of 2010. Rail transportation is assumed to reach full
capacity with the increase in container transport demand. For the zero alternative, the remaining
increase in container transport demand is evenly spread amongst barge and road transport. For the
DTL alternative, the relative shares of the modalities in total container transport remain at the same
level.
The predictions for demand were compared to predictions for future transport supply. Supply
predictions are based on the growth of transported volume in the period 2003-2008. Since this
period was characterized by excess demand, it shows the maximum growth rates of transport modes
to increase capacity under the status quo. For rail transport it is assumed that the capacity cannot
grow further than 65 million tons of goods. This is due to the fact that rail transport is entirely
dependent on the Betuwe-route for its capacity. No new rail investments-plans are present at the
time of writing; therefore no rail investments are expected. For barge and road transport, the growth
figures of 2003-2008 were used to extrapolate the maximum capacity up to 2040. This capacity holds
for the zero alternative. For the DTL alternative, road transport is assumed to increase its capacity in
order to cope with the demand increases.
With this information, the excess demand for both alternatives could be determined. As such, the
difference in total goods handled for the two alternatives became clear. The accumulated excess
demand for the zero alternative was estimated at 986 million tons of goods up to 2040, against 160
million tons of goods for the DTL alternative. These figures were used to estimate the direct impact
of the good flow on the Dutch economy. In order to do this, the gross operating surplus of the good
flow for both alternatives was calculated. Due to data unavailability, the gross operating surplus per
ton had to be calculated first. A drawback of this calculation is that it proved to be impossible to
specify the operating surplus for the type of good. The operating surplus for the barge sector is
therefore estimated too low, which has a positive effect on the presented DTL alternative. With an
interest rate of 5%, the difference in gross operating surplus for both alternatives was estimated at
78 billion euro for the next 30 years. Note that this is the operating surplus for the complete road
transport and barge industry. The expansion of the EU requires corrections for the share of the Dutch
transport firms in this calculation. With the help of market information for both transport sectors,
the direct effect on the Dutch economy was estimated at 38.3 billion euro up to 2040.
5.2 Indirect effectsThe analysis of the indirect effects of the proposed dedicated truck lane is aimed to predict the
macro-economic benefits of the new infrastructure. In contrast to the analysis for the direct effects,
Reinout PoldersPage 52
November 2011
Dedicated Truck Lanes Investigated
this analysis will significantly differ from the initial Knight Wendling report. Whereas the main
drawback for the direct effects study in the KW report was subjectivity, the indirect effect analysis
was supported by a rather outdated method. As already explained in chapter 4, relying completely
on multipliers is oversimplifying the complexity of the macro-economic effects. In addition, to make a
distinction between multiple regions for the total effect increases the risk of double counting a part
of the effects. There is also the danger of interpreting distributive effects as generative effects; a too
small scale leads to biased results in this case.
As mentioned in chapter 4, the method that will be used to analyze the indirect effects is the (quasi)-
production function. This method is less advanced than the(Spatial) Computable General Equilibrium
Models (SCGE), yet it is still a step up from the Knight Wendling approach. The main problem of the
KW approach was the use of rather subjective and unrealistic high multipliers. Especially in the
Netherlands where the aging population will strongly restrain the labour stock growth in the next
decades, using simple multipliers is arbitrary. In the case the dedicated truck lane creates new
demand for labour, the most probable source of labour supply would be other industries. Effects are
in this case distributive instead of generative. Total labour supply is therefore not changed, hence it is
not necessarily true that total income will increase. The only thing that changes in this case is overall
efficiency; labour can be more productive in the transport sector than in other industries thanks to
the newly build infrastructure. This effect can be measured with the production function, yet
methodological issues regarding causality and exogeneity e.g. will reduce the statistical relevance of
the outcome. However since the aim of this report is to open a discussion rather than to convince
politicians to actually build the proposed dedicated truck lane, it is justified to make use of a second-
best method.
5.2.1 Description of the ModelThe main variable describing the indirect effect is the value added of the investigated region. Instead
of using added value levels, the natural logarithm of the added value will be inserted in the
regression. This is in order to assure that there is a sufficient number of countries as a reference
point. Labour stock, capital stock and the total infrastructure stock represent the main input
variables. The main aim is to investigate the effect of the infrastructure stock on the total added
value of the Netherlands. As mentioned earlier, the geographic scale of the analysis can influence
the outcome significantly. In order to avoid misinterpreting distributive effects for generative effects,
the analysis will be performed on a national scale. It could still be argued that this is too narrow,
since the dedicated truck lane will be a major connection to the German border. Hence a part of the
effect will spill over to Germany and possibly Eastern Europe. Yet to make an analysis for the whole
Reinout PoldersPage 53
November 2011

Dedicated Truck Lanes Investigated
of Europe will reduce the relevance of the outcome; it is highly unlikely that an infrastructure project
of this scale will have a significant influence for countries outside the Netherlands. In addition, the
construction of the dedicated truck lane will be entirely funded by the Dutch national and regional
governments.
This will not imply that other European countries will be completely ignored in this analysis; they can
still provide usefulness by serving as a control group. One of the main drawbacks of the application of
the production function was the fact that analyses solely focused on either one country on different
points in time or multiple countries at one time. To make use of panel data can help to understand
how infrastructure stock influences efficiency and thereby the total income of countries.
Labour Stock
Labour stock is the most straightforward variable in the production function; to choose a proper
measurement of labour stock is rather simple. For all involved countries the total working population
is taken. The unemployed part of the population is thus left out of the analysis; since they do not
contribute to total added value they cannot be seen as part of the labour stock. Naturally, there is a
big difference in total employed population between the various European countries. In order to get
a normal distribution in the labour stock data, the natural logarithm was taken.
Capital Stock
To choose data that can be inserted as the capital stock is harder than the choice for labour stock.
For this analysis, the gross fixed capital formation per year per country is taken. While this data does
not cover the available capital in a country completely, it does provide useful information. In
addition, fluctuations over time are not very high. In order to get a normal distribution in the capital
stock data, the natural logarithm was taken.
Infrastructure Stock
Since there is no explicit measurement for the infrastructure factor, the inserted data is a proxy.
Literature points out that the choice of the proxy for infrastructure should be made with care.
Sanchez-Robles (1998) shows that investments in infrastructure projects do not turn out to have
significant effects on income. The argument used is that infrastructure projects are often carried out
Reinout PoldersPage 54
November 2011

Dedicated Truck Lanes Investigated
by central governments, which reduces efficiency of the project as a whole. The invested money is
than far greater than actually necessary; without this efficiency no relationship can be found53.
Physical measurements of infrastructure capacity do bring significant and positive results in a
production function analysis. The most often used proxy is the total length of domestic roads in this
case. In order to ensure that the highest number of countries can serve as a control unit; the total
length of roads is given per capita instead of plain kilometers. Naturally, this figure does not change
drastically over the years. The Eurostat database provides statistics for the total length of highways
as well as the total length of other roads in a country. Both variables will be inserted in the regression
model. This is mainly because there are differences between countries with respect to the criteria set
for a road to become a highway. As a result, data figures in Eurostat may differ significantly between
countries while actual road infrastructure can be of a similar level.
Although natural logarithms of the highway capacity per capita are the preferred data input in the
analysis, they do bring additional problems for the analysis. The per capita variables for highway
report values between 0 and 1; this is true for all countries in the sample. When taking the natural
logarithm of values between 0 and 1, the reported figures are all negative. It is not desirable to put
negative logarithm coefficients in a regression analysis54. This would bring serious problems for
interpreting the reported coefficients. These problems are rather easy to avoid however. Instead of
expressing the total length of highways in km, the length is given in mm. All coefficients for the
logarithm of highway per capita are positive in this case. The transition should not affect the
outcome of the regression analysis; relationships between countries as well as standard deviation of
the sample are equal to the data with the highway per capita reported in km.
In order to form a hypothesis with respect to the effect of infrastructure on the total domestic added
value, a correlation test was run for both measurements of road infrastructure. The correlation test
for the highway length reported a coefficient of 0.16; a weak positive relation between infrastructure
and total added value. The correlation for other roads proved to be much stronger; a value of 0.32
was reported here. In addition to this correlation test a second correlation test was run, with this
time a lag of one year in the infrastructure variable. Since input factors are not completely flexible, it
could well be that the effect of infrastructure stock growth is more clear in later years rather than
immediately. Nevertheless, the correlation tests for the lagged variable of infrastructure stock
53 Sanchez-Robles (1998) Infrastructure Investment and Growth: Some Empirical Evidence. Contemporary Economic Policy Vol. XVI, January 1998, 98-10854 Wooldridge, J.M. (2009) Introductory Econometrics, Fourth Edition. 2006 South-Western Page 192
Reinout PoldersPage 55
November 2011

Dedicated Truck Lanes Investigated
reports the same values. From this correlation analysis, the hypothesis that follows is that we expect
a weak positive effect of infrastructure stock growth on added value levels.
Control Variables
As mentioned before, the assumption in a production function model investigating the effect of
infrastructure is that the newly build infrastructure will increase efficiency of the total economy. In
other words; it increases productivity of labour and capital inputs. The productivity of these inputs is
dependent on much more factors than infrastructure however. Failure to include a set of control
variables for productivity could mean that the infrastructure variable captures a part of the effect of
these missing factors. In the case this would happen, the infrastructure stock could abusively be seen
as significant.
The main control variable for the total productivity is education. Education has a clear relation with
total added value; a higher skilled labour pool is more productive than low-skilled workers. Finding a
variable that adequately captures the education factor is harder than it is for the variables for labour
and capital stock. Education data in this regression model is represented by the percentage of labour
that has a tertiary-level diploma. This data gives indsight in the average education level of a country,
which is closely related to productivity of labour.
The second control variable that is put in the analysis is a dummy for former communistic countries.
The dataset that is used runs from 1992-2010, especially at the start of this period the burden of
communism reduced the total added value of countries. Without incorporating the dummy it is likely
that other variables will capture a part of this effect in the regression. The regression equation is
stated below.
ln (Gross AddedValue )=β0+ β1 ln (Labour )+β 2 ln (Capital )+¿
β3 ln ( Infrastructure )+ β4 Education+β 5dummy+u
The descriptive statistics of all variables are given in table 5.3. As can be seen, 33 European countries
are included with data for the period 1992-2010. The dependent and main independent variables are
in natural logarithms in order to achieve a normal distribution. In addition, with the help of natural
logarithms elasticities between the variables can be estimated.
Table 5.3: Descriptive Statistics panel dataset
Variable Obs Mean Std. Dev Min MaxCountrynum 627 17 9.530 1 33Time 627 2001 5.482 1992 2010
Reinout PoldersPage 56
November 2011

Dedicated Truck Lanes Investigated
T 627 10 5.482 1 19LN Gross Value Added 521 11.559 1.578 8.34 14.57LN Labour Stock 491 8.158 1.417 4.97 10.57LN Capital Stock 521 10.126 1.557 6.71 12.99LN Highway per capita 491 4.509 1.073 1.6 6.91LN Other roads per capita 517 9.23 0.763 6.9 10.79Education 345 19.912 7.071 4.9 35.3Dummy Communism 627 0.394 0.489 0 1
5.2.2 Test ResultsThe analysis of the indirect effects focuses on two main tests; two identical production functions with
the two proxies for infrastructure stock incorporated. As mentioned, the model makes use of panel
data in order to increase the relevance of the findings. Panel data tests are based on more
assumptions than a standard cross-section analysis. In order to assess to what extent these
assumptions hold, both a Mundlak test as well as a Hausman test was run55. Both tests indicated that
a fixed effects-specification has to be used for the two panel data tests. As a result, the dummy for
the former communistic countries is dropped from the model.
Table 5.4: Regression Results, dependent variable gross value added
Highways Normal roadsObservations 256 276Countries 30 30R-squared 0.974 0.788Labour stock 0.195*
(0.113)-0.119(0.114)
Capital Stock 0.452***(0.024)
0.474***(0.021)
Highway per capita 0.095***(0.020)
-
Normal roads per capita
- 0.08***(0.018)
Education 0.019***(0.002)
0.029***(0.002)
Standard deviation reported in brackets. *** denotes significance at a 1%-level whereas * denotes significance at a 10%-level.
The two regressions report different results. As can be seen in table 5.4 the model with variable for
the highways per capita included reports the highest overall explanatory value. In this model, all
variables report significant values; labour stock at a 10% level while the other variables are significant
55 For output see appendix tables A1 and A2
Reinout PoldersPage 57
November 2011

Dedicated Truck Lanes Investigated
at a 1%-level. In addition, the relationships of the explanatory variables with total added value are as
expected. The variable for highway per capita reports a significant and positive value. The elasticity
between the added value of a country and the highways per capita is very small; a 1% increase in the
latter results in a 0.095% increase in the total added value. The coefficient for the effect of normal
roads does not show a very different relationship. The overall value of the model with normal roads
included is lower however. In addition, the variable for labour stock does not report a significant
coefficient. The result of the analysis with highways per capita will therefore be the only input for
quantifying the indirect effects..
5.2.3 Quantification of the indirect effectThe Netherlands has currently 2600 km of highway roads; officially only 25km are added due to the
extension of the A15 to the German border. Since the total capacity of the A15 will increase with
50%, this increase will also be accounted as ‘new highway’. It should be noted that the zero
alternative does not assume that no investments are made in infrastructure; some improvements are
already planned by the government. The difference in infrastructure improvement between the two
alternatives is the part between the junction of Vaanplein and Nijmegen. The length of this highway
is approximately 158 km. As such, the total improvement of the DTL alternative compared to the zero
alternative is only 79 km. Translating this to a share in total highway network leads to a value of 3%.
A 3% increase in the highway network leads to a 0.028% increase in total gross added value. It is
much more likely that this figure turns out to be lower; this is mainly due to the share that is assigned
to the added highway sections in the total highway capacity.
At the time of writing, the gross added value of the Netherlands is approximately 480 billion euro. In
order to correctly estimate the effect of the highway network on the added value, it is necessary to
know the economic developments up to 2040. Recall from chapter 1 that there is no institution that
dares to make predictions regarding economic development for a period of more than 5 years. As a
result, this report is forced to assume a growth expectation. In order to stay in line with chapter 1,
this expectation will not be set very positive. An average growth of 2% per year corresponds with the
doubts that are placed by the CPB and the Worldbank regarding economic development56.
The difference between the zero alternative and the DTL alternative can now be quantified. For the
first ten years, the gross added value shows no difference. This is because the dedicated truck lane is
assumed to be completed in 2020. From that point, the gross added value will grow with 0.028%
extra in the DTL alternative. The difference between the two alternatives up to 2040 is estimated at
56 Note that the gross added value is estimated; not net income. An average income growth of 2% would be too high given the current economic situation.
Reinout PoldersPage 58
November 2011

Dedicated Truck Lanes Investigated
49.62 billion euro. Note that this figure is likely to be exaggerated for two reasons. First, the share of
the dedicated truck lane improvement in total highway network is likely to be overstated; this is due
to measurement techniques. Second, this analysis did not correct for population increase. Population
can be expected to increase up to 2040, which would imply a negative impact of the highway per
capita value of the Netherlands. The infrastructure improvements can partly be seen as a solution to
keep the per capita value at the current level rather than an improvement.
5.2.4 SummaryIn accordance with literature that makes use of a production function to estimate the effects of
infrastructure on added value, a very small positive effect was found in the regression analysis. As
has been discussed, it is difficult to estimate with what percentage the proposed dedicated truck lane
would increase the total infrastructure stock. It is highly likely that this increase is only marginal;
around 3%. This increase in infrastructure capacity would lead to 0.028% increase of total gross
added value ceteris paribus according to the model. When this increase is translated to a change in
gross added value, the difference between the alternatives is estimated at 49.62 billion euro up to
2040.
The regression analysis is rather robust however; indirect effects have a complexity that cannot be
analyzed with regression techniques properly. This chapter did show that it can be expected that the
Dutch economy as a whole will benefit, yet the magnitude of the effect should not be interpreted as
a very accurate value. The methods applied try to correct for generative and distributive effects, as
such the predictions are not too positive per definition. However, it is impossible to predict with this
information where this growth will take place. No corrections have been made for the spatial pattern
of economic activity and the effect of the dedicated truck lane on this pattern. Although this analysis
provides useful insights, the more complex methods described in chapter 4 should still be preferred.
Chapter 6: Social Costs
Reinout PoldersPage 59
November 2011

Dedicated Truck Lanes Investigated
The analysis of the effects of the proposed dedicated truck lane is not complete without the
forthcoming part; the social costs analysis. As already argued in chapter 3, one of the main
disadvantages of road transport is the high external costs that are created in comparison to other
transport modes. This drawback was the main motivation for the Betuwe-route; to increase the
attractiveness of other modes. Chapter 2 argued that with a dedicated truck lane that meets certain
criteria, the external costs created by road transport can be minimized. Still, it is undeniable that the
new dedicated truck lane will increase costs for society. The increase in handled goods that has been
predicted in chapter 1 is of such a magnitude that it is unthinkable that social costs can be decreased
by either of the two alternatives.
Recall from chapter 4 that the method regarded as the optimal method was the OEI-method; a
method created by the Dutch government in order to increase transparency in infrastructure
predictions. The methods are rather straightforward and have been used by others before; the
systematic approach is what differs the OEI-method from other methods. Chapter 2 already
discussed the various factors and explained the possible effects of a dedicated truck lane on these
factors. Recall that in the second paragraph, the benefits for the road transport sector were
discussed; increased travelling speed and increased predictability of trip duration. While important,
these factors will not be dealt with in this report. Chapter 5 already gave a broad overview of the
implications for the road transport sector. Since these two factors are only affecting the road
transport industry and not the society as a whole, the factors will be excluded from the social cost
analysis.
This chapter will follow the same approach as chapter 2; discuss the effects on the various factors
one by one. Furthermore, the dedicated truck lane alternative will again by compared to the zero
alternative. The analyses will be supported by the good flow analysis of chapter 1. The good flow of
chapter 1 predicted both scenarios; the only difference between the two scenarios was the amount
of goods transported by trucks. For both rail transport and barge transport, both alternatives
predicted the same goods transported per year57. This implicates that our calculations for this
chapter can be simplified; when comparing the two alternatives the only mode that has to be
analyzed is the road transport sector.
6.1 Air pollutionAir pollution is dependent on multiple factors, some of which are rather hard to predict at this
moment. This is mainly due to an important feature of the road transport sector; intensive rules and 57 In order to avoid misunderstanding; the quantification of the goods flow was based on the excess demand of both alternatives. The excess demand for barges differed between the alternatives; the volume handled by barges did not.
Reinout PoldersPage 60
November 2011

Dedicated Truck Lanes Investigated
regulations put on by national and supra-national governments. Emission levels and truck
characteristics are therefore subject to continuously changing regulations. Both factors are also
major determinants of the pollution levels of trucks. This was one of the reasons why the Knight
Wendling report drew a too bright picture for the benefits of the Betuwe-route, since the fact that
emissions per truck could decrease was not incorporated in the analysis. Although this report wants
to indicate that an improvement in efficiency of trucks is very likely, this will not be included in the
analysis. As has been done throughout the whole report, this analysis will try to avoid drawing the
best-case scenario for road transport. This means that the assumption is that the speed of which
emission standards are improved will be loosened, which will most likely imply that the vehicle stock
will not become more environmental-friendly than it is now in the coming decades. In addition, the
notion that a dedicated truck lane could support longer truck combinations will not be taken into
account in the analysis. Longer truck combinations are significantly reducing the emissions per ton
volume transported58. By not including this in the analysis, the report again restrains from making too
bright predictions.
A distinction has to be made between greenhouse gasses and gasses that are harmful for the health
of the population living in urban areas around the highway. Whereas health effect are relatively local,
the greenhouse effect occurs on a global scale. It is therefore that the latter one concentrates on the
national traveled distance only, whereas greenhouse gasses emitted in foreign countries can also be
seen as a cost for the Netherlands. This difference is important for modeling the effects of air
pollution correctly.
In order to predict the differences between the two alternatives with respect to air pollution the
pollution for trucks has to be multiplied with the predicted good volume handled as explained in
chapter 1. In order to make use of the predictions in chapter 1 however, an additional calculation has
to be made. Most emission figures that have been investigated by other researchers are measured in
ton/kilometers, whereas the findings in chapter 1 only concentrated on total volume handled
without looking at traveled distance. Multiple calculations will thus have to be made in order to
estimate total number of kilometers traveled in the Netherlands as well as the average weight of
trucks; both are essential in order to estimate the total costs of air pollution.
6.1.1 Empirical informationThe first information that has been estimated is the average weight per truck. In order to reveal this,
the total annual volume of truck transport was divided by the total number of trips made in 1 year.
58 Spielmann and Scholz (2004) Life Cycle Inventories of Transport Services, Background Data for Freight Transport. Int J LCA 10 (1) 85 – 94 (2005)
Reinout PoldersPage 61
November 2011

Dedicated Truck Lanes Investigated
This analysis has been performed for the last 5 years, the outcomes proved to be steady over time.
The average truckload reported was 7400 kilogram. Note that the trip include the part of the trips
where the truck is not loaded. This reduces the average weight of a truck per trip, yet it is important
to take into account these parts as well due to air pollution that arises on these parts.
The second information that had to be estimated was the average length of one trip. This was
calculated by the total traveled distance by trucks per annum divided by the total number of trips per
annum. There is one main difficulty within this calculation however. The total number of trips can be
distinguished between national and international, whereas there is a lack of information for the total
national length traveled for international trips. This is where one assumption had to be made; the
total km traveled in the Netherlands for international trips was set at 40059. The average length of a
national trip turned out to be 250 km60. The weighted average was estimated by calculating the share
of national trips in total trips, and multiply this with the average length of a national trip. The same
was done for international trips. The weighted average of a trip was estimated at 177 km in 2010.
Note that this weighted average only holds for the effects on public health; for the analysis of the
effect of greenhouse gasses internationally traveled kilometers also have to be taken into account.
The average total km traveled for an international trip was reported to be 1000 km by the CBS
database.
This weighted average cannot be directly used for estimations up to 2040 however. As mentioned on
earlier occasions; the A15 should mainly serve as a corridor for re-export from the port of Rotterdam.
The port of Rotterdam also argued that the main reason for the increase in container volume
originated in the bigger demand from eastern Europe. The increase in container volume will thus
have a bigger effect on the total amount of international trips than on the total amount of national
trips. Since there is little information about the share of demand growth for the various regions, an
assumption had to be made for the effect on the national and international amount of trips. The
international trip amount is expected gain 80% of the total container volume growth, whereas the
national trips gain 20% of total volume61.
With this information, the difference between the traveled kilometers per year per alternative can be
estimated. Note that the dedicated truck lane alternative implicated a higher total volume of total
59 This is somewhat less than the distance to the German border when taking the A15. Note that the retour trip was also taken into account. Since not all trucks return empty, the weighted average of a trip is set at 400. 60 Information taken from the CBS statline database61 This is justified by the fact that the Dutch economy is relatively small when compared to eastern Europe. In addition, there is already a high share of import and export when compared to the national GDP. Especially Eastern European countries have a high potential for growth of their import and export.
Reinout PoldersPage 62
November 2011

Dedicated Truck Lanes Investigated
goods transported after 2020. This also means that the average length of a trip will be higher in this
scenario.
The marginal external costs of air pollution are hard to calculate given the complexity of the
relationship with transport. There is a non-linear relationship with weight and a non-linear
relationship with speed. Together, this would make it very hard to model the effects of air pollution
created by road transport within the scope of this thesis. Although it reduces the depth of detail in
the analysis, using aggregate data would be very helpful in this case. Such data is provided by CE Delft
(2007)62, a report that calculated the marginal costs per km traveled per truck based on an extensive
literature study combined with own research. The data is available for multiple weight-classes and
environments. When taking into account the proposed structure for the A15, an average of 3.2 cents
per traveled km is taken as the input for air pollution costs related to health issues. For the emissions
of greenhouse gasses, the costs are estimated at 1.4 cents per traveled km.
6.1.2 CalculationsThe calculation is rather simple; multiply the average costs per km by the total number of traveled
kilometers. Table 6.1 presents the accumulated figures up to 2040. The estimated difference
between the two alternatives is roughly 2 billion euro. This relatively low figure is the product of the
intensive EU regulations for trucks; as mentioned already in chapter 2 the costs per km have been
reduced from 29 cents per km to only 3.2 cents per km for the health effects. The outcome of the
calculations support the idea that the ruling perception of trucks is outdated; although still polluting,
the marginal costs of road transport are fairly low when compared to two decades ago.
Table 6.1: Air pollution outcomes
DTL alternative zero alternative Differencetotal traveled km Netherlands 609 billion 567 billion 42 billionkost per km (HEALTH) 3.2 cent 3.2 centcosts 19.5 billion 18.1 billion 1.4 billionTotal traveled km NL+ other countries 964 billion 919 billion 45 billionkost per km (GREENHOUSE) 1.4 cent 1.4 centcosts 13.5 billion 12.9 billion 600 milliontotal costs 2 billion
62 CE Delft (2007) Handbook on estimation of external cost in the transport sector. (2007)
Reinout PoldersPage 63
November 2011
Dedicated Truck Lanes Investigated
6.2 Noise pollutionNoise pollution is the only factor that increases even without the increase in handled goods. The fact
that the dedicated truck lane improves the traffic flow of trucks means that the average speed of
trucks will most likely increase. Since noise pollution is for a major part dependent on the speed of
the vehicle, noise pollution is expected to increase significantly. Again, this analysis will draw a worst-
case scenario for road transport. Chapter 2 argued that highway characteristics such as noise walls
and noise absorbing asphalt could significantly reduce the noise pollution around highways. This
report will not assume that the final structure of the dedicated truck lane will contain both
instruments.
For the analysis of noise pollution there are two main components; the effect on the chance on
cardiovascular diseases and the effect on housing prices in the vicinity of the highway. Since there is
no relationship between these two factors besides noise pollution, there should not be overlap when
computing analyses for both factors.
6.2.1 Empirical inputIn order to measure the effect of the extra noise pollution on the reduction in property value, a
necessary input is the total value of property that is affected by the noise created. The necessary
data will be taken from the ‘Buurtmonitor’63 and the CBS. The level of noise decreases with distance,
so only the neighborhoods in the vicinity of highways will be included; no complete cities are
included in the analysis. According to Forkenbrock (1999), noise is polluting when the level is
constantly above 55 dBA. The same report also concluded that with a total volume higher than
20.000 road users a day, an area up to 220 meters from the highway is by noise levels higher than 55
dBA64. This means that we have to take into account neighborhoods that are within 250 meters of a
highway. Note that for the area in Rotterdam, some of these neighborhoods are already provided
with noise walls. As mentioned earlier however, these noise walls are not taken into account in the
analysis.
The effect of noise pollution is particularly hard to express in monetary terms. This is mainly due to
the fact that stress – the symptom with the highest correlation to noise pollution – can lead to
multiple serious diseases and even death. Because of this complexity this thesis will rely on an
63 This is a Dutch website with data on a broad range of topics, including property value. See www.buurtmonitor.nl for more info.64 Forkenbrock, D.J. (1999) Comparison of external costs of rail and truck freight transportation. In transportation research part a 35 (2001) 321-337
Reinout PoldersPage 64
November 2011
Dedicated Truck Lanes Investigated
extensive research of Boer and Schroten (2007), a research performed for the CE Delft65. For every
noise level between 50 and 82 dBA, the noise costs per person affected was determined. After the
new noise levels are determined, these figures will be used as input for the calculations.
For the marginal effect of trucks on property, we rely on papers of Nelson (1978) and Boer and
Schroten (2007). Nelson (1978) stated that property value decreases with 0.4% per dBA increase66.
The next necessary input is to know the actual increase in noise pollution when trucks drive faster.
Boer and Schroten (2007) concluded based on empirical testing that a speed increase of 60 to 70
km/h leads to a noise-level increase of 1.8 dBA, whereas a speed increase from 70 to 80 km/h leads
to a noise-level increase of 1.7 dBA67. For the part of the A15 around Rotterdam the average
reistijdfactor of all highway sections on the A15 is 1.23. This corresponds with an average speed of 65
km/h for trucks. In the zero alternative scenario, this average speed is expected to remain at this
level. After all, trucks will continue to drive alongside other traffic. Although the highway will still be
broadened, the sharp increase in total trucks implicates that the total highway volume increases with
the same pace as the infrastructure increase. Hence the assumption for the same speed as in the old
situation. In the dedicated truck lane alternative, trucks are assumed to have a free flow on the
highway and thus the reistijdfactor is set at 1. Note that this is sure to be too positive, but in this
calculation it exaggerates the effect of noise pollution and therefore disfavours investments in road
transport. The total difference in speed between the two alternatives is thus set at 15 km/h for the
highway sections around Rotterdam.
In addition, it should be noted that every doubling of total traffic volume leads to a noise increase of
3 dBA. Since the total volume of transported goods for road transport increases from 94 to 255
million goods in the DTL alternative, the total noise increase due to volume increase is set at 4,5 dBA.
For the zero alternative, this is only 3 dBA. With this information, we can draw an estimate for the
effect of the noise increase on property values. Note that despite the information, the estimation
remains robust due to the fact that only the value of houses is included in the analysis. Because of
the fact that noise reduces the value of houses, it has become common in the Netherlands to place
manufacturing firms and retail alongside highways rather than houses. The effect of highways on
property values of these buildings is difficult to predict. Productivity will naturally be lower with a
higher stress-level, yet there is also an advantage of free publicity when a firm is placed close to a
65 Boer, den C.L. and Schroten, A. (2007) Traffic noise reduction in Europe: Health effects, social costs and technical and policy options to reduce road and rail traffic noise, CE Delft66 Nelson, J.P. (1978a): Economic Analysis of Transportation Noise Abatement. Cambridge, Mass.: Bailinger67 Boer, den C.L. and Schroten, A. (2007) Traffic noise reduction in Europe: Health effects, social costs and technical and policy options to reduce road and rail traffic noise, CE Delft
Reinout PoldersPage 65
November 2011

Dedicated Truck Lanes Investigated
highway. Since there is no empirical study explicitly focusing on manufacturing firms’ and retail
property, these buildings will not be incorporated in the analysis.
With the help of the empirical information, the total difference between the two alternatives can be
drawn. There is one remaining difficulty however; there is no information available for the level of
noise nowadays. This makes it difficult to conclude the health analysis part; health effects are
dependent on the absolute level of noise rather than the change in noise as is the case for property
values. This difficulty can be solved by making use of the design of the whole research; to set off the
dedicated truck lane alternative against the zero alternative. The earlier mentioned research by den
Boer and Schroten (2007) gives the annual costs per person per noise level. From this, the difference
in noise levels and the corresponding costs can be taken. For noise levels above 70 dBA, the costs per
person increase with 15,9 euro per dBA increase68. This information makes it possible to compare the
two alternatives with each other.
6.2.2 CalculationsThe most important information for the noise pollution analysis is the amount of people and
property that are actually affected by noise pollution. Although the A15 runs southward past
Rotterdam, this does not necessarily mean that all neighbourhoods located on the Southern part of
Rotterdam are automatically affected. As mentioned, only property and people within 220 meter of
the highway are affected. When taking a good look at the map, not many neighbourhoods fulfil this
criteria. The city of Rotterdam already does a good job in minimizing the noise damage by making use
of green zones between the highway and the various neighbourhoods. Table 6.2 shows the
neighbourhoods that have been selected as ‘affected neighbourhoods’. Note that the analysis has
been performed for the whole highway, not only for the region of Rotterdam. It should be noted that
small villages that are closer to the German border are not incorporated. This is mainly due to data
constraints. The small size of these villages implicates that the outcome of the analysis should not
significantly differ by excluding these villages.
In order to make the analysis as detailed as possible, cities were not selected as a whole but on
postal code. These are codes for neighbourhoods within cities; analysis on this level provides more
detailed information than on city level. Unfortunately, only for the average persons per home and
the total number of inhabitants data could be provided on postal code-level. With this information
however, the total number of homes per neighbourhood could be calculated. For the average
property value, aggregate data on city level had to be used.
68 Boer, den C.L. and Schroten, A. (2007) Traffic noise reduction in Europe: Health effects, social costs and technical and policy options to reduce road and rail traffic noise, page 67 CE Delft. Note that these figures are in 2002 euro’s; a cost of 14 euro at that time corresponds with 15,9 euro in 2010.
Reinout PoldersPage 66
November 2011

Dedicated Truck Lanes Investigated
Table 6.2: Affected neighbourhoods information
Postal code, City Average persons per home
Total inhabitants neighbourhood
Number of homes neighbourhood
Average WOZ-value
Total WOZ-value Neighbourhood
2952, Alblasserdam 2,85 760 267 224.000 59.733.3332981, Ridderkerk 2,07 3.145 1.519 216.000 328.173.9132985, Ridderkerk 2,27 4.720 2.079 216.000 449.127.7532992, Barendrecht 2,57 14.040 5.463 281.000 1.535.112.8403088, Rotterdam 1,21 20 17 161.000 2.661.1573089, Rotterdam 2,01 1.480 736 339.000 249.611.9403162, Albrandswaard 2,63 6.680 2.540 288.000 731.498.0993181, Rozenburg 2,24 12.495 5.578 186.000 1.037.531.2503194, Rotterdam 2,37 6.670 2.814 155.000 436.223.6293197, Rotterdam 2 5 3 94.000 235.0003198, Rotterdam 2 5 3 161.000 402.5003352, Papendrecht 2,57 3.530 1.374 223.000 306.299.6113355, Papendrecht 2,59 6.290 2.429 223.000 541.571.4293362, Sliedrecht 2,24 11.500 5.134 203.000 1.042.187.5003363, Sliedrecht 2,35 5.940 2.528 203.000 513.114.8943364, Sliedrecht 2,94 255 87 203.000 17.607.1433371, Hardinxveld-Giessendam 2,67 11.875 4.448 260.000 1.156.367.041
4002, Tiel 2,36 2.350 996 231.000 230.021.1864003, Tiel 2,44 8.390 3.439 231.000 794.299.1804004, Tiel 2,74 90 33 231.000 7.587.5914005, Tiel 2,5 5.625 2.250 231.000 519.750.0004205, Gorinchem 2,32 9.760 4.207 223.000 938.137.9314206, Gorinchem 2,09 2.000 957 223.000 213.397.1294207, Gorinchem 2,84 11.145 3.924 223.000 875.117.9584213, Gorinchem 2,73 935 342 223.000 76.375.458Total 129.705 53.164 12.062.145.466
Combining the data for the affected neighborhoods with the earlier mentioned empirical
information, the total effect of noise pollution can be estimated. The total effect on both property as
well as health are presented in table 6.3. As can be seen, both parts report more or less the same
magnitude; around 200 million euro. In total, the noise pollution costs are estimated at 425 million
euro. This cost is rather low when compared to the direct benefits; this is mainly due to the
advantageous structure of the A15. Although it runs past a lot of cities, green zones between the
highway and neighborhoods prevent noise levels to reach heights that are actually polluting. In
addition, a lot of buildings alongside the highway facilitate manufacturing and retail. The effect of
noise levels on these buildings is not incorporated in the analysis.
Table 6.3: calculation outcomes
Reinout PoldersPage 67
November 2011

Dedicated Truck Lanes Investigated
∆ Noise levels Marginal costs Affected people Affected property Total costsHealth costs
4 dBA 15,9 euro per dBA p.p per year 129.705 - 231.912.54
0Property costs
4 dBA 0.4% per dBA of total value - 12.062.145.466 192.994.32
7Total 424.906.86
7
6.3 Congestion for other road usersIn contrast to the sharp increase in noise pollution, the congestion for other road users might not rise
at all because of the dedicated truck lane. Normally, trucks are seen as a major reason behind
congestion. This is mainly because of the speed differences that occur when trucks are driving
alongside with other road users, but also because of passing maneuvers of trucks. In the case of the
dedicated truck lane alternative, trucks are kept away from other traffic. This implies that other road
users will not be hindered by trucks anymore, except for the junctions were trucks leave the
dedicated truck lane69.
Not only are the trucks kept away from other road users in the new situation, the other road users
also keep their normal highway capacity. As has been argued in chapter 2, the government has
already planned to broaden the current A15. Instead of allowing all road users on all three lanes, the
dedicated truck lane will take one lane and leave two for other road users. In other words, it could be
argued that on certain points the road capacity for other road users increases compared to the
situation nowadays. This is especially true for the highway sections were trucks represent a high
share of total traffic.
Calculating the effect of extra congestion for other road users remains difficult however. In the ideal
situation, evidence from existing cases could be used to predict the effects of the new dedicated
truck lane. This data could give detailed insight in the effects on the average congestion on the parts
were the truck lane is constructed, for both the dedicated truck lane itself as well as the lanes for
other road users. In addition, it could show the effects on the congestion around junctions were
trucks have to get on and off the dedicated truck lanes. Unfortunately, this evidence is not widely
available. In the Netherlands there are only two small dedicated truck lanes; these lanes do not
account for sufficient observations in order to model the effects on other road users effectively.
Since detailed data is unable to find or construct, it is again necessary to rely on aggregate data. The
data will be provided by the same source as was the case for the analysis of the air pollution costs;
69 Trucks will have to mix with other road users again when leaving the dedicated truck lane, implying a higher chance of congestion at these points.
Reinout PoldersPage 68
November 2011
Dedicated Truck Lanes Investigated
namely the report by the report of CE Delft (2007)70. By taking into account various sources, the
authors of this report constructed an average cost per km for each mode with respect to the creation
of congestion. Note that this data is only available for regular highways; there is no average cost per
km for highways that have been turned into dedicated truck lanes. As mentioned, due to the
decreased speed differences it could be argued that congestion on all lanes is reduced with respect
to the old situation. On the other hand, getting on and off the dedicated truck lane will force trucks
to make maneuvers that can hinder other road users. The assumption is therefore that the average
cost per km for trucks is equal to the normal situation.
The calculation follows with multiplying the total kilometers traveled by trucks in both alternatives
with the average costs per km. The total kilometers traveled are taken from the earlier analysis of air
pollution. Naturally, only the distance traveled on Dutch roads are included. It is very well possible
that the huge increase in trucks will create congestion problems on the German highway system, yet
these costs cannot be assigned to the Dutch economy.
The average costs per km for trucks is estimated at 3.5 cents per passenger car unit 71. One truck is
assumed to be equal to 4 passenger car units on average, so the average cost of 14 cents per
traveled km will be put into the calculations. The outcomes of the calculations are presented in table
6.4. Compared to the analysis for air pollution, the extra costs for congestion turn out to be fairly
high. This is mainly due to the fact that the average costs per km are estimated much higher than the
costs for air pollution. Whether this is completely justified is hard to say, since there is little empirical
evidence for dedicated truck lanes and the effect on the congestion pressure for other road users.
Table 6.4: Costs of congestion for other users
Traveled kilometers average cost total costsDTL alternative 609 billion 0.14 85.3 billionZero alternative 567 billion 0.14 79.4 billion∆ alternatives 42 billion 5.9 billion
6.4 SafetySimilar to the problem of congestion, trucks are seen as one of the major factors behind safety costs
for society. Again, speed differences between trucks and other road users prove to be a major cause
of accidents on highways. In addition, chapter 2 already explained that damage proves to be much
higher when trucks are involved in accidents. As such, it is to be expected that the proposed
70 CE Delft (2007) Handbook on estimation of external cost in the transport sector. (2007)71 Boer, den C.L. and Schroten, A. (2007) Traffic noise reduction in Europe: Health effects, social costs and technical and policy options to reduce road and rail traffic noise, page 67 CE Delft.
Reinout PoldersPage 69
November 2011

Dedicated Truck Lanes Investigated
dedicated truck lane can help to increase safety on highways. This is mainly due to the fact that
trucks are kept away from other traffic and thus damage will be less severe in the case of accidents.
In addition, speed differences are reduced significantly which should reduce the total number of
accidents. Again, it should be noted that on the points were trucks have to get off and on the
dedicated truck lane there is an increased risk of accidents.
Quantifying the effects of road accidents is a hard task, estimating the marginal costs of road
transport therefore relies mostly on aggregate data. The total effect is mainly influenced by the
damage inflicted to humans; not so much by the material damage to the vehicles. As such, it turns
out that accidents with motorcycles and busses have the highest external costs. As was the case for
the costs of air and noise pollution, the best aggregate data comes from the report of CE Delft (2007).
Again, the authors computed the average costs for society per traveled kilometer for each mode. The
average costs for a truck seems to be low on first sight, but this can easily explained by the high
number of traveled distance for trucks per annum. On average, trucks are not that often involved in
accidents.
The main difficulty with respect to the calculations and the average costs input is the big difference
between the average cost for trucks on highways and regional and urban roads. On motorways, the
cost per km is equal to 0.23 cent, on regional roads it is 2.06 cent while the average costs traveled on
urban roads is 6.16 cent per km. Intuitively, it could be expected that the average cost of accidents
reduces because the biggest share of container volume will be transported to Germany exclusively by
highway. Still, as assumed in the analysis for air pollution the goods transported nationally will also
rise. There is no data available for the distribution of traveled kilometers for trucks among the
various road types however. This means that we are forced to make an assumption about this
distribution. Recall from paragraph 6.1 that the average trip length of a national trip is estimated at
155 km. Since the Netherlands has a particularly dense highway network, the share of the distance
traveled on highways must be set on a sufficient high level. The assumed distribution is as follows;
70% on highways, 20% on regional roads and 10% on urban roads.
With this assumption, the average costs for both national as well as international trips can be
estimated. Note that the assumptions of paragraph 6.1 hold for this analysis; the average trip length
of an international trip is again set at 280 km. All kilometers traveled on Dutch roads for an
international trips are assumed to take place on a highway. The average cost per trip are shown in
table 6.5.
Table 6.5: Average accident cost for trucks
Reinout PoldersPage 70
November 2011

Dedicated Truck Lanes Investigated
average costs per km average traveled distancenational trips 1.389 250international trips 0.23 400
As can be seen in the table, there is a big difference between the two types of trips. Because of the
distance traveled on regional and urban roads, the national trip average cost is estimated to be 5
times higher than the average cost for an international trip. It can therefore be expected that the
dedicated truck lane alternative will not incur very high costs with respect to safety. This corresponds
with literature; although absolute truck traffic increases the total costs incurred might not rise that
sharp at all because of the exclusion from other traffic. By multiplying the average distance per trip
with the expected number of trips made, the total distance traveled per type of trip can be
estimated. By multiplying this total distance with the average trip length the total effect of the
dedicated truck lane on accident costs is estimated. The outcome of these calculations are presented
in table 6.6.
Table 6.6: Safety costs
total km national trips total km international trips total costDTL alternative 383 billion 233 billion 5.86 billionZero alternative 377 billion 196 billion 5.69 billion∆ alternatives 6 billion 37 billion 0.17 billion
The estimated extra costs of the dedicated truck lane when compared to the zero alternative is only
170 million euro up to 2040. This is mainly because of the difference in total traveled kilometers on
international trips. This type of trip represents the biggest difference between the two alternatives,
yet the average cost in this trip category is estimated very low.
6.5 ConclusionTo form the conclusion for the social costs effect of the dedicated truck lane, all four individual cost
factors need to be added up into one figure. Because it proved to be impossible to determine the
absolute level of noise pollution costs for both alternatives, it is now also impossible to determine
the total absolute level of costs for both alternatives. Yet what matters is the difference between the
two alternatives; this amount is presented in table 6.7. The difference between the two alternatives
with respect to total costs for society up to 2040 are estimated at 8.51 billion euro. These costs may
be perceived as surprisingly low when compared to the difference between the two alternatives in
the direct effects analysis. The first reason for this observation is the dedicated truck lane’s structure;
as mentioned in chapter two the effect on other traffic is minimal. The second reason is the ideal
placement of the A15; it crosses very few cities and neighborhoods on its path to Germany.
Reinout PoldersPage 71
November 2011
Dedicated Truck Lanes Investigated
Government policies that are aimed to develop green borders between highways and urban districts
pay off in this case, as do the policies to develop industrial and commercial districts alongside
highways.
Table 6.7: Summary social costs analysis (amounts x billion euro)
Cost category DTL alternative Zero alternative ∆ alternativesAir pollution 33 31 2Noise pollution - - 0.44Extra congestion for other users 85.3 79.4 5.9Safety costs 5.86 5.69 0.17Total costs 44.4 41.4 8.51
Chapter 7: Synthesis and Reflection
Combining the three components of the complete analysis with the infrastructure investment costs
leads to the conclusion that the proposed dedicated truck lane has a net benefit for the Dutch
economy as a whole. When compared to the zero alternative, the dedicated truck lane proposal has
a net benefit of 72.4 billion euro up to 2040. This is mainly based on the difference in the total
Reinout PoldersPage 72
November 2011

Dedicated Truck Lanes Investigated
volume of containers handled between the two alternatives. Note that this difference is supported
by multiple assumptions of which some can be seen as arbitrary. This aim of this report was never to
create all too bright predictions for dedicated truck lane investments however. It hopes to instigate
possibilities for discussions regarding infrastructure investments. While the methodological
framework can be seen as an example for objective and rational infrastructure investment
predictions in the future, the applied methods are too simple to deal with the complexity of actual
effects.
Table 7.1: Net result DTL alternative compared to the zero alternative
Total construction and Maintenance
7.003.444.926
Total Social Costs 8.510.000.000Total Costs 15.513.444.926Direct Benefits 38.300.000.000Indirect Benefits 49.620.000.000
*Total Benefits 87.920.000.000Net Result 72.406.555.074*effect is Gross added value
7.1 Extra alternativeThe synthesis of the three analyses gives sufficient evidence to prefer the dedicated truck lane
alternative over the zero alternative. However, these are not the only two alternatives for road
transport investments. As mentioned before in chapter 2, one could argue that broadening the A15
completely without imposing lane restrictions is a serious option. The main advantage of this
structure is that highway capacity for trucks increases, as well does flexibility for total traffic. For
trucks this means that during periods outside traffic volume peaks, there is more highway capacity
available. For normal traffic, the extra lane implies that congestion might be solved faster.
On the other hand, mixing trucks with normal traffic implies that trucks will face more congestion
problems. As argued before, the congestion on the A15 is primarily created by commuters. Trucks
have a much more even spread over the day. The advantage of the dedicated truck lane is that trucks
are given the opportunity to avoid congestion problems. Not only do trucks face the congestion of
commuters without lane restrictions, the trucks might create more congestion by themselves too. As
mentioned before, speed differences between trucks and cars are a major reason for the creation of
congestion. The speeding and braking that occurs during passing maneuvers disrupt the traffic flow,
leading to a chain reaction of braking and ultimately congestion. This means that in this case not only
trucks face more congestion; commuters face more congestion too.
Reinout PoldersPage 73
November 2011

Dedicated Truck Lanes Investigated
The debate between these two alternatives is difficult to settle with qualitative arguments however.
Therefore, an additional analysis for these two alternatives will be made. This analysis is smaller than
the analysis for dedicated truck lanes and the zero alternative however. The reason for this is that it
is assumed that in the ‘no lane restrictions’ alternative (referred to as NLR alternative from now on),
the total volume of containers handled by trucks will be equal to the DTL alternative. Note that the
main difference between the two alternatives is the traffic flow; the NLR has a less fluent flow but
due to the additional capacity the same volume can be handled by trucks. This means that for the
direct and indirect effects, both alternatives will report the same value.
It is also assumed that both alternatives will not show differences with respect to investment costs. It
is likely however that the NLR will require lower investments in reality, yet it is hard to predict the
magnitude of this investment reduction. Another aspect that is left out of the analysis is the fact that
dedicated truck lanes can support longer truck combinations, whereas this is legally prohibited for
the NLR alternative. Longer trucks combinations are much more efficient with respect to fuel use;
social costs are therefore likely to be lower in the DTL alternative. Yet as was the case for the analysis
with the zero alternative, this effect will not be incorporated in the analysis with the NLR alternative.
The essential difference between the two alternatives is the value of the total social costs.
Remember that one of the main advantages of a fluent traffic flow is the fact that air pollution is
much lower. This is especially the case for trucks; idling in congestion increases emissions drastically.
This is a point where the NLR alternative can be expected to incur higher costs than the DTL
alternative. Another crucial point is safety costs; the DTL alternative made sure that trucks and cars
were separated implying lower accident costs. In the case trucks and cars are mixed again, it can be
expected that the costs for society are bigger. The last point where the NLR alternative can incur
higher costs is the congestion for other users. As mentioned, mixing trucks and cars leads to more
congestion; this is created by speed differences. As such, other road users are affected by trucks;
these external costs need to be assigned to the NLR alternative too.
The only social cost component that is not affected by the difference in structure between the two
alternatives is noise pollution. Theoretically, it could be argued that the DTL alternative ensures a
higher average speed of trucks. This would imply that noise pollution is higher in the DTL alternative
given the positive relationship between the speed of trucks and the noise pollution that is created.
However, the average speed in the BLR alternative is primarily affected by congestion; outside peak
moments trucks will travel at the same pace in both alternatives. There is little information available
on the relation between congestion and the reduction of noise pollution. It is difficult to say whether
the temporarily reductions in noise pollution levels that are created by congestion will have a
Reinout PoldersPage 74
November 2011

Dedicated Truck Lanes Investigated
significant effect on health problems or property values. Given the difficulties in modeling these
differences, the noise pollution effect will be dropped from the analysis.
7.2 Estimating social costs differenceThe three social cost components will be quantified in the forthcoming paragraph. Due to the small
amount of empirical examples in the Netherlands, these analyses require a lot of creativity. The
assumptions may be arbitrary at some points, yet again these analyses should primarily serve as an
example. The only good comparison can be made with the A16; this is the highway that has a
dedicated truck lane and can provide a sufficient number of observations for the analysis. The
traveling time factors of the total A16, the A16 excluding trajectories with the dedicated truck lane
and the A16 with only trajectories with the dedicated truck lane can be compared. For the total A16,
a traveling time factor of 1.45 is reported. This means that on average, the time to complete the A16
is 45% higher than when travelling at maximum speed. The travelling time factor for the parts with
the dedicated truck lane is lower; 1.40. If the dedicated truck lane parts are excluded from the
analysis, the traveling time factor is 1.47. This is evidence that normal cars do benefit from a
dedicated truck lane. The most obvious explanation for this outcome is the fact that speed
differences are smaller due to the separation of trucks and cars. Note that there is no data available
for the speed of trucks during the dedicated truck lane, yet it is evident to assume that the traveling
time factor will be significantly lower than 1.4. These traveling time factors can provide useful insight
in the effects of a dedicated truck lane on traffic flow, yet they do not provide ‘hard’ statistics for the
expected level of congestion.
7.2.1 Air pollutionThe main input for the air pollution component is the total congestion that occurs in both
alternatives. The traffic flow is affected by multiple factors, which makes it difficult to correctly
predict the difference in traffic flows between the two alternatives. Table 7.1 provides a summary of
the factors affecting the traffic flow. The estimated effects in the table are based on the traveling
time factors that are reported on the existing dedicated truck lane on the A16. As can be seen, the
total congestion for trucks is expected to increase with 7% whereas the total congestion for cars is
expected to increase with 2%. The difference between the two increases is the fact that trucks do
face commuters’ congestion in the case of the NLR alternative. Both cars and trucks face more
congestion due to the speed differences that are present on the highway when these two groups are
mixed. Last, both groups benefit from the capacity increase. Trucks will benefit because there will
never be something as a ‘perfect flow’ on dedicated truck lanes. Although the flow is superior to
other structures, trucks will nevertheless have to make maneuvers to get on and off the dedicated
Reinout PoldersPage 75
November 2011

Dedicated Truck Lanes Investigated
lane. In the case trucks have more than one lane available, these maneuvers will have less impact on
the traffic flow given the possibility to swerve from certain situations.
Table 7.1: increased congestion for NLR alternative when compared to DTL alternative
Trucks CarsTrucks affected by commuters’ congestion 5%Congestion solved faster -3%Congestion due to speed differences 5% 5%Increased capacity for trucks -3%Total increase in congestion 7% 2%
In addition to the information for the increased congestion, a necessary input is the marginal
emission of a truck during idling. This information is very hard to accurately include in the analysis
however. Table 7.1 provides rough estimates for the amount of time spent in congestion, yet it is also
necessary to have more information regarding the time spent on cruise speed and the time spent in
transient operations. In addition, information about emissions is often far outdated. There is
literature available for emissions during multiple operation velocities, yet most of these papers use
data from at least 10 years ago. Given the pace of technological improvements in trucks’ efficiency, it
would not be justified to include this information in the analysis. Quantifying the air pollution costs in
this case would be rather unrealistic. In addition, the outdated information is likely to affect the
results in a positive way for the DTL alternative72. These two arguments are reason to refrain from
quantifying the difference in air pollution costs. Intuitively, the air pollution costs are expected to be
higher in the NLR alternative. Modeling this difference is beyond the scope of this thesis however.
7.2.2Congestion costsIn contrast to the analysis with the zero alternative, this analysis does assume figures for congestion.
The analysis is therefore based on the additional time that is needed to complete a trip in the NLR
alternative when compared to the DTL alternative. A necessary input for this analysis is the value of
time for the different road users. This input is a standardized monetary value provided by the
government in order to improve the level of detail in infrastructure effects estimations. The value of
time for trucks can be implemented easily in the analysis, since it is standard for all types of trucks.
The value of time for other traffic is more problematic, given the distinction between commuters and
business travelers. The latter group represents a much higher value of time than the commuter
group. There is little information on the shares that each of these types of travelers represent in total
72 Absolute emission rates were higher a decade ago, it is likely that the differences between idling and cruise speed were bigger too. When using this difference in the analysis for future effects, the extra social costs for the NLR alternative are likely to be exaggerated.
Reinout PoldersPage 76
November 2011

Dedicated Truck Lanes Investigated
traffic. The assumption is therefore that commuters represent 90% of total normal traffic whereas
business travelers represent 10%. Based on the traveling time factors that are reported by the A16
dedicated truck lane, normal traffic is assumed to require 6%73 more time to complete trips in the
NLR alternative when compared to the DTL alternative. The value of time for trucks is obtained from
Rijkswaterstaat, the Dutch government organization that is responsible for the highway network. The
average value of time for commuters is set at 10.55, whereas the value of time for business travelers
is 36.574. The weighted average for normal road users is estimated at 13.15.
Trucks on the other hand have a higher increase in expected traveling time. Assuming that the
traveling time factor for trucks on a dedicated truck lane is 1.1575, the increase in traveling time for
trucks mounts up to 23%. This figure is based on the point of the A16 where traffic volume is at its
peak. It is therefore not justified to use this outcome for the A15 as a whole; traffic is less dense here.
The reported traveling time factor for the A15 up to the junction of Deil is 1.23. Taking this as the
average traveling time factor for trucks in the NLR alternative implies a 7% increase when compared
to the DTL alternative.
The next step is to assess the average traveling time for the different traffic groups. For trucks this
can be estimated with the help of earlier input for the total length of trips. There is a difference
between national and international trips with respect to the average speed of traveling; this has to
be corrected for in the analysis. National trips have an average length of 250 km, of which 70% is
traveled at highways. This means that per national trip, 175 km is traveled on a highway. Assuming
an average speed of 70 km/h76, a trip would take 150 minutes. International trips have an average
length of 400 km on Dutch highways. Assuming a speed of 70 km/h, a trip would take 343 minutes.
Recall that the shares for the types of trips have been set in chapter 7; international trips have 80%
of total trips. On average, the travel time for a truck is thus 304.4 minutes, For commuters and
business travelers, there is no other option than to assume an average trip duration. This duration is
set at 30 minutes.
The last input in the estimation is the volume of traffic. It is a necessity to know how many trucks and
normal road users will actually use the A15. Table 2.1 in chapter reports general statistics for the
73 (1.47 divided by 1.4)74 Rijkswaterstaat provides an extensive document with estimated values of time for different years under multiple scenarios. As has been done throughout the whole report, a moderate scenario was chosen as reference.75 As mentioned earlier, even the dedicated truck lane cannot ensure that trucks will always drive at maximum speed. Maneuvers that are necessary to get on and off the dedicated lane will slow down trucks eventually, implying that the travelling time factor will always be higher than 1. 76 Travelling time factor is assumed to be at 1.15; maximum speed is 80km/h. 80/1.15 gives 70 km/h
Reinout PoldersPage 77
November 2011

Dedicated Truck Lanes Investigated
amount of trucks and normal traffic per day. On average, 19.000 trucks and 93.000 cars use make use
of the A15 per day in 200977. The number of trucks is expected to increase drastically, whereas the
number of cars will marginally rise. Table 7.2 shows the expected extra costs of the NLR alternative
compared to the DTL alternative. The difference between both alternatives up to 2040 is estimated
at 5.27 billion euro. It could be argued that this 5.27 billion euro is not entirely an externality; a part
of the congestion for trucks is created by the road transport sector itself due to speed differences. It
is difficult to estimate what part of the 5.1 billion euro is an external cost for trucks created by cars.
The purpose of this analysis is to estimate the external costs for cars created by trucks however. In
order to be consistent with this aim, the external costs of increased congestion is estimated at 155
million euro.
Table 7.2: extra costs NLR alternative compared to DTL alternative
accumulated trips to 2040 Extra travelling time (hours) Extra costs
trucks 402.230.000 1.428.452.801 7.423.669.236
cars 1.181.286.000 11.812.860 155.319.421
7.2.3 Safety CostsSafety costs are expected to increase when trucks are mixed with normal traffic. Trucks increase total
damage of accidents as well as the number of accidents. It is therefore evident to expect that the
NLR alternative will report higher safety costs than the DTL alternative. To quantify this difference
requires some creativity however. This is because the dedicated truck lane does bring a disadvantage
when it comes to safety; the maneuvers that are necessary to get on and off the dedicated lane bring
higher risks than lane shifting on normal highways.
In the NLR alternative, the complete A15 allows for mixed traffic. This means that trucks drive for 228
km alongside normal traffic. This does not mean that the difference between the two alternatives is
228 km however. Every junction brings additional costs in the DTL alternative. There are roughly 20
junctions on the total A15. For every junction, it is assumed that 5 km of highway are necessary to
allow for trucks to get on and off the dedicated lane78. The total length of the highway were trucks
would could endanger cars is therefore set at 100 km. The absolute value of the length of the
highway is not very important however given the average costs per traveled km. Yet with these two
figures a ratio can be derived; trucks have contact with other road users for only 44%, when
compared to the NLR alternative.
77 This is the volume per part of the highway; the average number of trucks and cars passing per day.78 Every junction has 2 exits and 2 entrances. Per exit or entrance 1.25 km is assumed to be necessary. As such, every junction accounts for 5 km of highway.
Reinout PoldersPage 78
November 2011

Dedicated Truck Lanes Investigated
The input for the costs of accidents can be used from chapter 6. The average costs per km traveled
for trucks is rather standardized however. In this case, one could argue that the DTL alternative
provides a higher average cost when trucks are mixed with cars. This is because the maneuvers
around junctions are a distortion in the normal traffic flow, implying a bigger risk and thus higher
average costs. In the NLR alternative, trucks are already part of the traffic flow so average costs
around junctions do not differ from costs at other points of the highway. The assumption for the
average costs around junctions in the DTL alternative is that average costs are twice as high when
compared to the average costs in the NLR alternative.
Recall from chapter 6 that a distinction was made between national trips and international trips. In
the case of international trips, trucks do not have to leave or enter the dedicated truck lane; they do
so at the German border. This means that for these trips, the dedicated truck lane assumes no
additional contact with cars. The NLR alternative has a big disadvantage here since trucks are mixed
even for international trips. For national trips, the dedicated truck lane requires extra maneuvers
implying a higher average cost than the NLR alternative. The effects are summarized in table 7.3.
Table 7.3: Effects of alternatives on average costs trips
NLR alternative DTL alternativeinternational trips
mixed traffic on the whole A15 no contact trucks and cars
national trips standard traffic flow distortion traffic flow necessary 44% ofthe highway (costs doubled)
With this last assumption the difference between the two alternatives with respect to safety costs
can be quantified. The results are presented in table 7.4. The difference between the two
alternatives up to 2040 with respect to safety costs is estimated at 1.18 billion euro. This is primarily
created by the fact that the DTL alternative has negligible effects on safety costs when trucks are on
international trips. For national trips, the advantage of separating trucks and cars is undone by the
fact that trucks must undertake maneuvers to get on and off the dedicated lanes.
Table 7.4: Safety costs NLR alternative vs DTL alternative up to 2040
Costs national trips Costs international trips total costDTL alternative 383 billion * 0.44 * 2.778 4.68 billionNLR alternative 383 billion * 1.389 233 billion * 0.23 5.86 billion∆ alternatives 1.18 billion
Reinout PoldersPage 79
November 2011

Dedicated Truck Lanes Investigated
7.3 ConclusionThis chapter has provided a reflection on the main analysis of this report by including a third
alternative; the situation where the A15 is completely broadened but where no lane restrictions are
set. This alternative demonstrates what happens when the road sector does provide the capacity
that is needed to allow for a massive container increase in the Maasvlakte 2, but when less attention
is given to limit the social costs that are created by the road transport sector. Table 7.5 summarizes
the results of the analysis. Although it was not possible to quantify all three differences in social
costs, this reflection does show the essence of the dedicated truck lane; increased capacity without
harming the society all too much. In a time where economic growth is very much desired, but where
sustainability is perceived as increasingly important, the dedicated truck lane can offer a solution.
The results of both alternatives indicate that dedicated truck lanes can provide benefits on a wide
scale in the Netherlands.
Table 7.5: extra social costs NLR alternative
Cost driver Extra costs NLR alternativeAir pollution not to be quantified, intuitively higherExtra congestion 0.155 billion without extra costs for trucksSafety 1.18 billion
Chapter 8: Summary
This report has shown that the expected container volume increase that will arise when the second
Maasvlakte is completed requires major investments in the transport sector. Predictions for the
magnitude of the increase in container volume vary significantly, yet even relatively conservative
Reinout PoldersPage 80
November 2011

Dedicated Truck Lanes Investigated
predictions indicate a shortage of transport capacity for re-export from the Rotterdam Port to the
rest of Europe. With the help of economic development predictions from the Worldbank and the
CPB, the scenario with a predicted container volume of 371 million tons in 2040 has been perceives
as most likely. When comparing this demand for transport to the actual supply of transport services,
a significant excess demand for transport services can be expected. The growth potential of both
barges and rail transport is not sufficient in order to increase capacity to a level that corresponds
with the increase in demand. With the right investments, road transport is the only mode that is
capable of handling the container volume growth.
The road transport sector is subject to much controversy however given the high amount of external
costs they create for society. Special attention needs to be given to the structure of the infrastructure
project; where possible this structure should try to limit the externalities of road transport.
Dedicated truck lanes can provide capacity without harming the society all too much. In a time where
economic growth is very much desired, but where sustainability is perceived as increasingly
important, the dedicated truck lane can offer a solution. This has become clear in the reflection with
the alternative where no lane restrictions are set. Whereas this option can provide the necessary
capacity to support the container increase of the Maasvlakte 2, it places a bigger burden on the
Dutch society than the DTL alternative.
The main aim of this report was to re-open the debate for investments in the road transport sector,
rather than to actually present a detailed infrastructure project. Little attention has been given to the
opportunities of dedicated truck lanes in the Netherlands. This report has shown that dedicated truck
lanes can bring benefits for the Dutch economy, yet a more extensive study should be performed
before the lane is actually placed. This is mainly due to the fact that the methods that are used in this
report are simplified in some cases; this is a result of the scope of the thesis. Chapter 9 will present
the shortcomings of the applied methods in this thesis, and argue in which way these methods could
be improved. As a whole, this thesis should provide guidelines for infrastructure effects predications
that are based on rationalism and logic reasoning rather than subjective observations as was the case
for the Betuwe-route.
Chapter 9: Limitations
The main purpose of this thesis is to open the discussion for investments in road transport by
showing the possible benefits dedicated truck lanes. By criticizing earlier adopted approaches to
Reinout PoldersPage 81
November 2011

Dedicated Truck Lanes Investigated
infrastructure investments predictions in the chapters 3 and 4, this report aimed to solve the major
shortcomings and develop a transparent approach. Chapter 5 to 7 proceeded with working out such
an analysis for the case of dedicated truck lane; a tool to combine transport volume growth while
limiting the costs for society. While the underlying argumentation for the actual analysis
corresponded with the developed approach in the chapter 4, the lack of data forced us to make
various assumptions and a couple of changes in methodology. In order to serve as a fundament for
future research, this chapter will shortly summarize what aspects of the analyses should be improved
in order to make infrastructure investment predictions as optimal as discussed in the first section.
Since the analysis was divided into three parts, this chapter will follow this division. This chapter
solely focuses on the main analysis of this report; the reflection with the NLR alternative will not be
incorporated.
9.1 Direct Effects AnalysisThe most important aspect of a direct effects analysis –also referred to as the good flow analysis- is
an argumentation based on logic reasoning and objectivity. Chapter 5 succeeded in fulfilling this
criteria, yet to make predictions for a time-span of 30 years also requires some creativity. Especially
in the current economic circumstances, no non-profit organization dares to make economic
development predictions for a longer time-span than 5 years. In order to back-up the calculations
with proper motivation, chapter 5 had to rely on predictions provided by the port of Rotterdam. This
semi-governmental organization has reasons to draw a bright picture for developments in the port; it
is therefore possible that not all predictions will be 100% objective. For an infrastructure investments
project of this scale, it might be justified to hire an independent and objective research agency to
predict economic development. In addition, since the predictions of the port of Rotterdam focused
on the period 2010-2030 the last 10 years of this report had to be extrapolated. Due to the lack of
data this was a necessity, but such a method should tried be avoided in future research.
The scope of this thesis did not allow for an intensive market potential study for the different
transport modes. Multiple assumptions had to be made in order to model the developments on the
supply side of the transport sectors. Again, for an infrastructure investment project of this scale it is
highly recommended that more effort is put into predicting the capacity developments for the
various modes. Since both the analysis of the indirect effects and the analysis of the social costs are
supported by data from the direct effects analysis, it is better to exaggerate the efforts in this analysis
rather than to make too much assumptions.
Reinout PoldersPage 82
November 2011

Dedicated Truck Lanes Investigated
9.2 Indirect Effects AnalysisThe indirect effect analysis deals with the most complex quantification, a complexity that is difficult
to handle within the scope of this thesis. As discussed in chapter 4, new technologies allow
researchers to make complex models on various geographical scales. The production function
approach that has been used in chapter 5 is therefore outdated. Nevertheless, this approach can give
insight in the effects of infrastructure stock changes. As long as the right proxies for infrastructure
are chosen, the regression analysis reports results that are in accordance with literature. However, to
completely assess the effects infrastructure investments future infrastructure prediction reports are
advised to make use of (Spatial) Computable General Equilibrium Models (SCGE).
9.3 Social costs AnalysisThe social costs analysis itself is divided into four parts. The main approach applied is the OEI-format,
a standard approach applied by the Dutch government. While not revolutionary in its methods, this
format can help to reduce complexity of infrastructure investment predictions. Note that the writer
is free to include whatever cost factor that is applicable to the case. It might well be that costs
included in this research are not relevant at all, while other (think of loss of land etc) can be fairly
important.
9.3.1 Air pollutionThe main drawback of the method applied in chapter 6 of this report is the use of aggregate emission
input data. As mentioned, emissions of various gasses are dependent on both speed and weight of
the truck. Incorporating these factors in the analysis increases the complexity of calculations, yet the
amount of detail gained could be worth the effort. Especially the factor speed, which is assumed to
increase on average when the dedicated truck lane allows for a free flow of trucks, is difficult to
capture with aggregate data. This is mainly because the relationship with emissions is non-linear; in
congestion a truck produces more emissions than when driving at maximum speed. In order to
incorporate the factor speed, an extensive database that contains information for average speed and
total congestion per highway section is needed.
9.3.2 Noise pollutionIn order to model the effect of noise pollution on both property and health of the population in the
vicinity of the highway, it was necessary to make a couple of assumptions regarding the nature of
noise pollution. The most strict one was the assumption that only within 200-250 meters of the
highway people and property were affected by traffic noise. Although this has been confirmed by
empirical research for normal traffic, the rule might not hold for exceptional traffic flows created by
the dedicated truck lane. It is very well possible that the absolute noise level created by the
Reinout PoldersPage 83
November 2011
Dedicated Truck Lanes Investigated
dedicated truck lane surpasses the 250 meter radius of noise damage. In order to incorporate this
notion in future research, data should be provided on the actual absolute level of noise alongside
highways.
Furthermore, this analysis did not incorporate the effect of a dedicated truck lane on property other
than houses. This is mainly due to the fact that little research has been done to investigate the
relationship between highways and manufacturing and retail businesses alongside this highway. One
could argue that the stress created by noise reduces productivity, yet the free publicity that comes
with a land-slot next to a highway could be beneficial. Especially in the Netherlands, were a big share
of property alongside highways consists of manufacturing and retail, it is important to incorporate
the effect of noise pollution on this property and its labour too.
9.3.3 Extra congestion for other usersThe effect of the dedicated truck lanes on the congestion for other road users is best analyzed with
the help of empirical data. Unfortunately, no such data is widely available in the Netherlands yet. The
dedicated truck lanes on the A16 and the A20 provide some insight but the number of observations
is too low to form a solid basis for a quantification of the effects. The calculation in chapter 6 is
therefore based on assumptions that do not necessarily have to be hold for the proposed dedicated
truck lane. Furthermore, aggregates had to be used as input again. This generalizes the analysis
rather than supplying a detailed overview. Since no project of this scale has been implemented in the
Netherlands yet, it is hard for researchers to get an idea of the possible effects. A suggestion could be
to draw a parallel with existing dedicated truck lanes in the United States, although these findings
should be translated to the Dutch situation with care however.
9.3.4 Accident costsThe main drawback of the analysis for this factor is more or less in line with the drawback of the air
pollution costs; using aggregate data as an input. Accident costs are naturally dependent on the
transport mode, yet another major dependant is the type of road where the transport takes place. In
the case of road transport there is a large difference between the average costs per km traveled on
urban roads and highways for trucks. Since there is no data available on the shares of the different
types of roads in total traveled kilometers for trucks, assumptions had to be made regarding this
division. More information with respect to this division could increase the level of detail in the
analysis.
Reinout PoldersPage 84
November 2011
Dedicated Truck Lanes Investigated
Reference List
- Beuthe, M. et al. (2001) Freight transportation demand elasticities: a geographic multimodal transportation network analysis, Transportation Research Part E: Logistics and Transportation Review, Volume 37, Issue 4, August 2001, Pages 253-266
- Boer, den C.L. and Schroten, A. (2007) Traffic noise reduction in Europe: Health effects, social costs and technical and policy options to reduce road and rail traffic noise, CE Delft
- Bomhoff, E. J., Met de spade op de schouder, Breukelen (Nyenrode Forum for Economic Research) maart 1995
- Brodrick, C-J, Dwyer, H. A., Farschchi M., Harris D. B. and King F. G. (2002) Effects of engine speed and accessory load on idling emissions from heavy-duty diesel truck engines, Journal of the Air & Waste Management Association, Vol. 52, no. 9, pp. 1026 – 1031
- Burningham, S and Stankevich, N (2005) Why road maintenance is important and how to get it done. World Bank, Washington, DC. Transport Nore No. TRN-4
- CE Delft (2007) Handbook on estimation of external cost in the transport sector. (2007)
- Centraal Planbureau, Scanning the Future; een lange termijn scenariostudie over de wereldeconomie voor de periode 1990-2015 (1990)
- Centraal Planbureau, een scenariostudie van de Nederlandse economie voor de periode 1990-2015 (1990)
- Centraal Planbureau, De macro-economische effecten van de Betuweroute, werkdocument 52, 1993
- Centraal Planbureau, Economische effecten van de Betuweroute op basis van recente informatie, werkdocument 75, 1995
- Centraal Planbureau (2010): The Netherlands of 2040 CPB Bijzondere Publicatie 88 22-06-2010
- Centraal Planbureau (2011) Wereldhandelsmonitor: juni 2011 Wereldhandelsmonitor 22-08-2011
- Chang, L and Mannering, F. (1999) Analysis of injury severity and vehicle occupancy in truck- and non- truck-involved accidents, Accident Analysis & Prevention, Vol. 31, no. 5, pp. 579 – 592
- CROW (March 2008): Onderzoeksresultaten CROW-werkgroep Evaluatie Onderhoudservaringen Betonwegen
- van Essen, Rijkee, Verbrak, Quak and Wilmink (2009) Modal split and decoupling options.Paper 5 produced as part of contract ENV.C.3/SER/2008/0053 between European Commission Directorate-General Environment and AEA Technology plc
- Forkenbrock, D.J. (1999) Comparison of external costs of rail and truck freight transportation. In transportation research part a 35 (2001) 321-337
- Gajendran, P. and Clark, N.N. (2003) Effect of Truck Operating Weight on Heavy-Duty Diesel Emissions, Environmental Science and Technology, Vol. 37, no. 18, pp 4309 – 4317
Reinout PoldersPage 85
November 2011

Dedicated Truck Lanes Investigated
- HEATCO (2006a) Bickel, P. et al: Developing Harmonised European Approaches for Transport Costing and Project Assessment (HEATCO)
- Hjelle, H.M. (2010) Short Sea Shipping’s Green Label at Risk, Transport Reviews, 30:5, 617-640
- Jaarboek Verkeer Rijskwegen Zuid-Holland 2009
- Muller, F., De Betuwe Route getoetst, Rotterdam Erasmus Universiteit, september 1994.
- McKinsey & Company (1992), Economische aantrekkelijkheid goederenvervoer per spoor
- Nelson, JP (1982) ‘Highway Noise and Property Values: A Survey of Recent Evidence’ Journal of Transport Economics and Policy, Vol. 16, No. 2 (May, 1982), pp. 117-138
- Oosterhaven, J. and Knaap, T. (2003) Spatial economic impacts of transport infrastructure investments. Appeared in: A. Pearman, P. Mackie & J. Nellthorp (eds) Transport Projects, Programmes and Policies: Evaluation Needs and Capabilities, Ashgate, Aldershot, 2003, pp. 87-1
- Ossiander E.M., Cummings P., (2002) Freeway speed limits and traffic fatalities in Washington State, Accident Analysis & Prevention, Volume 34, Issue 1, January 2002, Pages 13-18, ISSN 0001-4575
- Port Compass, de Ontwerp-Havenvisie 2030. By the Rotterdam Port Authority (2010)
- Reconstructie Betuwe-route: De Besluitvorming Uitvergroot (2004) Tweede Kamer, vergaderjaar 2004-2005, 29 283, nr. 7
- Rietveld, P. (1994) ‘Spatial economic impacts of transport infrastructure supply’ Transportation Research A. Vol. 28A, No. 4, pp. 329-341, 1994
- Rodriguez-Gomez, L. (2011) ‘A societal cost benefit analysis of dedicated truck lanes: How future lanes should be structured and analyzed’
- Sanchez-Robles (1998) ‘Infrastructure Investment and Growth: Some Empirical Evidence.’ Contemporary Economic Policy Vol. XVI, January 1998, 98-108
- Sandvik, E.T (2005) ‘Environmental impacts of intermodal freight transport’ (Molde: Moreforsking Molde)
- Spielmann and Scholz (2004) ‘Life Cycle Inventories of Transport Services, Background Data for Freight Transport’. Int J LCA 10 (1) 85 – 94 (2005)
- Verhoef, E.T., Rouwendal, J. and P. Rietveld (1999) ‘Congestion caused by speed differences’ Journal of Urban Economics, Vol. 45, no. 3, pp. 533 – 556
- Visie op Transport en Logistiek 2011, ABN AMRO sector research
- Wooldridge, J.M. (2009) Introductory Econometrics, Fourth Edition. 2006 South-Western
Reinout PoldersPage 86
November 2011

Dedicated Truck Lanes Investigated
Appendix
Figure A.1: A15 highway
Table A.1: Hausman Test
(b) Fixed (B) (b-B) Difference sqrt(diag(V_b-V_B)) S.E.Labour stock 0.195 0.562 -0.367 0.109Capital Stock 0.452 0.447 0.005 0.006Highway per capita 0.095 0.104 -0.009 0.009Education 0.020 0.014 0.006 0.001Hausman Test chi2(4) -50.62
Reinout PoldersPage 87
November 2011

Dedicated Truck Lanes Investigated
Table A.2: Mundlak Test, dependent variable ln Gross value added
Observations 256Groups 30R-squared 0.994Labour stock 0.171
(0.11)Capital Stock 0.455***
(0.02)Highway per capita 0.091***
(0.02)Education 0.02***
(0.002)Labour stock average -0.016
(0.14)Capital Stock average 0.409***
(0.09)Highway per capita average -0.048
(0.04)Education average -0.017
(0.005)Standard deviation reported in brackets. *** denotes significance at a 1%-level whereas
Reinout PoldersPage 88
November 2011