decreases in psychological well-being among american
TRANSCRIPT

Decreases in Psychological Well-Being Among American AdolescentsAfter 2012 and Links to Screen Time During the Rise of
Smartphone Technology
Jean M. Twenge and Gabrielle N. MartinSan Diego State University
W. Keith CampbellUniversity of Georgia
In nationally representative yearly surveys of United States 8th, 10th, and 12th graders 1991–2016 (N �1.1 million), psychological well-being (measured by self-esteem, life satisfaction, and happiness)suddenly decreased after 2012. Adolescents who spent more time on electronic communication andscreens (e.g., social media, the Internet, texting, gaming) and less time on nonscreen activities (e.g.,in-person social interaction, sports/exercise, homework, attending religious services) had lower psycho-logical well-being. Adolescents spending a small amount of time on electronic communication were thehappiest. Psychological well-being was lower in years when adolescents spent more time on screens andhigher in years when they spent more time on nonscreen activities, with changes in activities generallypreceding declines in well-being. Cyclical economic indicators such as unemployment were not signif-icantly correlated with well-being, suggesting that the Great Recession was not the cause of the decreasein psychological well-being, which may instead be at least partially due to the rapid adoption ofsmartphones and the subsequent shift in adolescents’ time use.
Keywords: psychological well-being, self-esteem, birth cohort, social media, Internet
Supplemental materials: http://dx.doi.org/10.1037/emo0000403.supp
Cultures change through mechanisms including economic, tech-nological, and political trends, and this cultural change oftenimpacts individuals (Markus & Kitayama, 2010; Oishi, Graham,Kesebir, & Galinha, 2013). This process of cultural evolutioninvolves the transfer of information and can be shaped by ecolog-ical pressures affecting people’s lives (Varnum & Grossmann,2017). Such cultural shifts may have a particularly strong impacton young people, whose worldviews are still forming (Stewart &Healy, 1989). Overall, a growing body of research supports theidea that cultural change leads to birth cohort and/or time perioddifferences in characteristics such as empathy (Konrath, O’Brien,& Hsing, 2011), sexual behavior Twenge, Sherman, & Wells,2017, job characteristics (Wegman, Hoffman, Carter, Twenge, &Guenole, 2017), and individualism (Grossmann & Varnum, 2015).Cultural changes may also affect psychological well-being (Oishiet al., 2013; Twenge, Sherman, & Lyubomirsky, 2016).
In this paper, we seek to document recent trends in the psycho-logical well-being of adolescents and explore the cultural changesthat may have produced them. We draw from Monitoring theFuture (MtF), a large, nationally representative survey of Ameri-
can 8th, 10th, and 12th graders conducted every year since 1991.With samples of same-age participants over many years, the time-lag method of this project allows the disentangling of age effectsfrom those of cultural change (Schaie, 1965). Although any dif-ferences could be caused by either birth cohort (which only affectsyoung people) or time period (which affects those of all ages), bothbirth cohort and time period effects capture cultural change(Campbell, Campbell, Siedor, & Twenge, 2015).
We have two primary goals. First, we aim to document trends inadolescents’ psychological well-being. We conceptualize psycho-logical well-being as it is measured in this dataset, which includesself-esteem, self-satisfaction, domain satisfaction, life satisfaction,and happiness. Second, we explore possible mechanisms behindthese trends. We focus on two primary possible mechanisms:economic conditions and screen time spent on electronic commu-nication such as social media, texting, and Internet use. The mostsevere economic recession since the Great Depression took placefrom 2007 to 2009; previous research has established the impor-tance of economic trends on shifts in the characteristics of indi-viduals (Cooper, 2011; Frasquilho et al., 2016). In addition, the2007 introduction of smartphones allowed mobile and nearly con-stant access to the Internet, with the majority of Americans owninga smartphone by the end of 2012 (Smith, 2017). Several studieshave linked new media screen time, including social media use, tolower psychological well-being (Huang, 2017; Kross et al., 2013;Shakya & Christakis, 2017), including among adolescents (Przy-bylski & Weinstein, 2017), although the latter paper found acurvilinear pattern with low levels of use, rather than nonuse,associated with the highest well-being.
This article was published Online First January 22, 2018.Jean M. Twenge and Gabrielle N. Martin, Department of Psychology,
San Diego State University; W. Keith Campbell, Department of Psychol-ogy, University of Georgia.
Correspondence concerning this article should be addressed to Jean M.Twenge, Department of Psychology, San Diego State University, 5500 Cam-panile Drive, San Diego, CA 92182-4611. E-mail: [email protected]
Thi
sdo
cum
ent
isco
pyri
ghte
dby
the
Am
eric
anPs
ycho
logi
cal
Ass
ocia
tion
oron
eof
itsal
lied
publ
ishe
rs.
Thi
sar
ticle
isin
tend
edso
lely
for
the
pers
onal
use
ofth
ein
divi
dual
user
and
isno
tto
bedi
ssem
inat
edbr
oadl
y.
Emotion © 2018 American Psychological Association2018, Vol. 18, No. 6, 765–780 1528-3542/18/$12.00 http://dx.doi.org/10.1037/emo0000403
765

Previous Research on Birth Cohort/Time PeriodChanges in Psychological Well-Being
Most research documented a consistent increase in psycholog-ical well-being, especially among younger populations, betweenthe 1960s and the 2000s. Self-esteem increased among children,college students, and adults (Gentile, Twenge, & Campbell, 2010;Twenge, Campbell, & Carter, 2017), though among high schoolstudents the increase did not appear in the total self-esteem scale(Bachman, O’Malley, Freedman-Doan, Trzesniewski, & Donnel-lan, 2011) but was limited to the factor Tafarodi and Milne (2002)identified as self-liking (Twenge & Campbell, 2008). Americanadolescents’ happiness, domain satisfaction, and life satisfactionalso increased between the 1990s and 2011 (Twenge et al., 2016).Overall, adolescents of the 2000s were significantly higher inpsychological well-being than those in the 1970s, 1980s, or 1990s.
However, research examining adolescents’ psychological well-being after 2011 is scant. Some have reported that caseloads atcollege (Kingkade, 2016) and high school (Anderssen, 2013; No-guchi, 2014) counseling centers increased after 2011. Given thatseeking counseling is often an indicator of low psychologicalwell-being, this creates the possibility that trends in adolescents’well-being after 2011 may differ from those before that year.However, it is not clear if these increases are due to more studentsbeing willing to seek treatment or if they represent declines inmore wide-ranging indicators of psychological well-being amongthe general population of adolescents. In addition, these sourcesnote that the cause of the increase in caseloads is not known.Below, we consider two possible causes for trends in psycholog-ical well-being in recent years: economic factors and the rise ofnew media technology.
The Influence of Economic Factors
Economic factors are often examined as a larger cultural influ-ence on individual personality and other characteristics (Bianchi,2016; Grossmann & Varnum, 2015; Leckelt et al., 2016). A largebody of research has documented that unemployment has a neg-ative effect on psychological well-being (e.g., Frasquilho et al.,2016). Children and adolescents’ psychological well-being is oftenindirectly affected as unemployment can strain relationships withparents (McLoyd, Jayaratne, Ceballo, & Borquez, 1994). As ageneral indicator of the health of the economy, stock marketperformance may also covary with well-being, as might medianhousehold income and gross domestic product (GDP). Other eco-nomic factors may also have an impact. In particular, incomeinequality is linked to lower happiness when matched by year(Oishi, Kesebir, & Diener, 2011), and the number of high schoolstudents entering college may capture shifts in the job market.
The Influence of Electronic Communication
The smartphone (a mobile phone with Internet access, oftenwith a touch screen), was introduced with the first iPhone in 2007and was adopted faster than nearly any other technological inno-vation (DeGusta, 2012). Half of Americans owned a smartphoneby 2012 and 77% by 2016 (Smith, 2017). Among United Statesteens specifically, smartphone ownership jumped from 37% in2012% to 73% in 2015 (Lenhart, 2015). Perhaps as a result,
adolescents’ social interactions have changed considerably in thelast 10 years, with teens spending more time on electronic com-munication and less time on in-person (face-to-face) interaction(Boyd, 2015; Twenge & Uhls, 2017).
These trends in how adolescents spend their social time mayhave an impact on psychological well-being. Many studies haveestablished a strong link between in-person social interaction andhigher psychological well-being (Blakemore, 2012; Lieberman,2014; Shakya & Christakis, 2017; for a previous review, seeBaumeister & Leary, 1995). However, research examining linksbetween social media use (one of adolescents’ primary electroniccommunication activities on smartphones) and psychological well-being are conflicting. Several studies, including those using ex-perimental and longitudinal designs, have found that social mediause leads to lower psychological well-being (Kross et al., 2013;Shakya & Christakis, 2017; Tromholt, 2016; for a meta-analysis,see Huang, 2017). One study found correlations specifically be-tween greater time spent on smartphones and lower well-beingamong teens (Przybylski & Weinstein, 2017), although this effectwas curvilinear. On the contrary, other studies have found thatsocial media use can increase psychological well-being (Davis,2012; Valkenburg, Peter, & Schouten, 2006), and still others findno relationship (Jelenchick, Eickhoff, & Moreno, 2013). Overall,reviews of the research literature on electronic communication andpsychological well-being have concluded that the results of thesestudies are mixed (Best, Manktelow, & Taylor, 2014). In addition,few studies have simultaneously examined the effects of in-personsocial interaction and electronic communication on the psycholog-ical well-being of adolescents, and those that did so were con-ducted before smartphones gained market saturation (e.g., Pea etal., 2012).
Present Research
We had two primary goals. In Study 1, we sought to determinetrends in adolescents’ psychological well-being, drawing from alarge (N � 1.1 million), nationally representative survey of UnitedStates adolescents measuring several aspects of psychologicalwell-being including happiness, life satisfaction, domain satisfac-tion, self-esteem, and self-satisfaction. For the sake of brevity, we use“psychological well-being” as an umbrella term for these constructs,recognizing that other conceptualizations also include additional fac-tors such as meaning (e.g., Ryff & Keyes, 1995). We take a data-driven approach, using the variables that are available in these largesurveys. In Study 2, we explored possible mechanisms behind thetrends in psychological well-being, including changes in adolescents’time use and national economic factors.
Study 1
The purpose of Study 1 was to determine birth cohort/timeperiod differences in psychological well-being, with a focus onchanges since 2007 when both the economy and available tech-nology underwent large disruptions. We included data since 1991as the 8th and 10th grade surveys began in that year; severalprevious studies examined well-being among 12th graders be-tween 1976 and 1990 (e.g., Bachman et al., 2011; Twenge et al.,2016).
Thi
sdo
cum
ent
isco
pyri
ghte
dby
the
Am
eric
anPs
ycho
logi
cal
Ass
ocia
tion
oron
eof
itsal
lied
publ
ishe
rs.
Thi
sar
ticle
isin
tend
edso
lely
for
the
pers
onal
use
ofth
ein
divi
dual
user
and
isno
tto
bedi
ssem
inat
edbr
oadl
y.
766 TWENGE, MARTIN, AND CAMPBELL
Method
Participants. MtF (Johnston, Bachman, O’Malley, Schulen-berg, & Miech, 2017) surveyed a nationally representative sampleof 12th graders each year 1976–2016, and 8th and 10th graders1991–2016. All procedures of the survey are annually reviewedand approved by the University of Michigan Institutional ReviewBoard. For the items and years used here, maximum N for 8thgraders � 437,293; N for 10th graders � 398,673, and N for 12thgraders � 311,552; total N � 1.1 million.
Measures.Self-esteem. Eighth, 10th, and 12th graders were asked six
items from the Rosenberg Self-Esteem scale (Rosenberg, 1965): “Itake a positive attitude toward myself,” “On the whole, I’m satis-fied with myself,” “Sometimes I think that I am no good at all”(reverse scored), “I feel I am a person of worth, on an equal planewith others,” “I am able to do things as well as most other people,”and “I do not have much to be proud of” (reverse scored; � � .83).Tafarodi and Milne (2002) identified the first three items asmeasuring self-liking and the next three items as measuring self-competence.
Domain satisfaction. The 12th grade survey asked about sat-isfaction in 14 areas of life:
The next questions ask how satisfied or dissatisfied you are withseveral aspects of your life. . . . How satisfied are you with . . . ”:“Your job? (if you have no job, leave blank),” “the neighborhoodwhere you live?” “Your personal safety in your neighborhood, onyour job, and in your school—safety from being attacked and injuredin some way?” “The safety of things you own from being stolen ordestroyed in your neighborhood, on your job, and in your school?”“Your educational experiences?” “Your friends and other people youspend time with?” “The way you get along with your parents?”“Yourself?” “Your standard of living—the things you have like hous-ing, car, furniture, recreation, and the like?” “The amount of time youhave for doing things you want to do?” “The way you spend yourleisure time—recreation, relaxation, and so on?” “Your life as a wholethese days?” “The way our national government is operating?” “Theamount of fun you are having?”
Response choices ranged from 1 to 7, with 1 (completely dissat-isfied), 4 (neutral), and 7 (completely satisfied). Because manystudents did not answer the item about a job, we excluded this itemand formed a 13-item scale (� � .83).
Self-satisfaction. We examined the item about satisfactionwith “yourself” separately as a measure of self-satisfaction.
Life satisfaction. A single item asked of a different subset ofstudents was, “How satisfied are you with your life as a wholethese days?” with choices of 1 (completely dissatisfied), 2 (quitedissatisfied), 3 (somewhat dissatisfied), 4 (neither, or mixed feel-ings), 5 (somewhat satisfied), 6 (quite satisfied), and 7 (completelysatisfied).
Happiness. Eighth, 10th, and 12th graders were asked, “Tak-ing all things together, how would you say things are thesedays—would you say you’re very happy, pretty happy, or not toohappy these days?” with response choices coded 1, 2, or 3.
Statistical analyses. Because these measures of psychologicalwell-being were in most cases asked of different subsamples(called a form), we were not able to perform a factor analysis orreliability analysis of all of the constructs. However, we didexamine correlations among these constructs where possible, and
all correlations were positive, greater than r � .30, and statisticallysignificant (see Table 1 in the online supplemental materials).
Data collected over time can be analyzed in various ways,including grouping by generation blocks (e.g., Boomers, GenX,Millennials, iGen), by decades, or by individual year. We sepa-rated the older data into 5-year intervals (e.g., 2000–2004) toprovide a compromise between specificity and breadth, dividing atthe decade and half-decade marks to enable references to specifictime periods (e.g., “the early 2000s,” for 2000–2004). For theyears 2012 and later, after smartphones were used by the majorityof Americans, we display the year-by-year data. The figures alsodisplay the year-by-year data for most measures. Due to the largesample sizes, we focus primarily on effect sizes rather than statis-tical significance. The p values are two-tailed.
Data availability. The MtF data sets used here are publiclyavailable online at the MtF website.
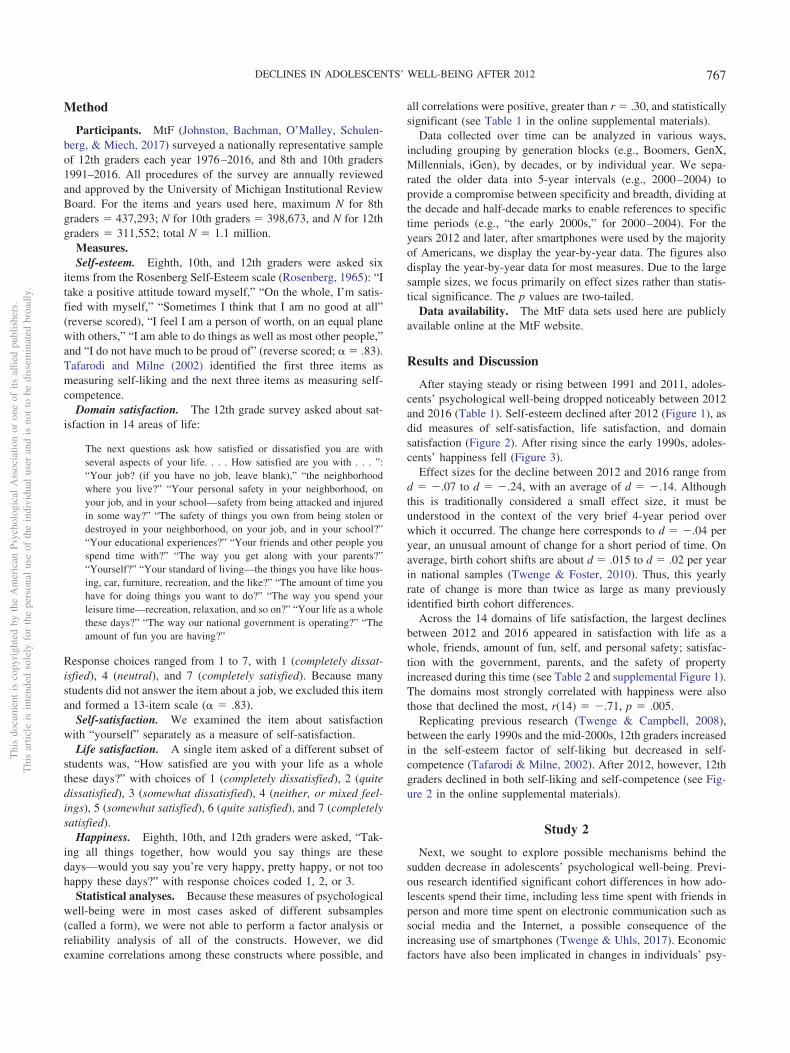
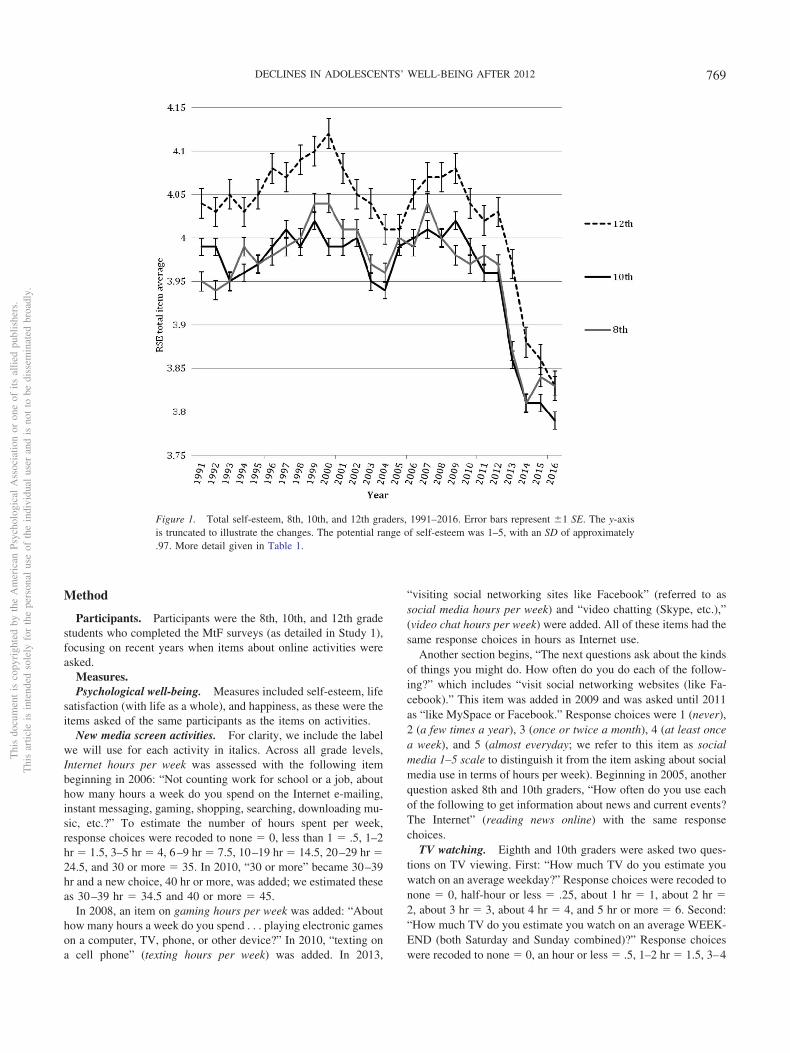
Results and Discussion
After staying steady or rising between 1991 and 2011, adoles-cents’ psychological well-being dropped noticeably between 2012and 2016 (Table 1). Self-esteem declined after 2012 (Figure 1), asdid measures of self-satisfaction, life satisfaction, and domainsatisfaction (Figure 2). After rising since the early 1990s, adoles-cents’ happiness fell (Figure 3).
Effect sizes for the decline between 2012 and 2016 range fromd � �.07 to d � �.24, with an average of d � �.14. Althoughthis is traditionally considered a small effect size, it must beunderstood in the context of the very brief 4-year period overwhich it occurred. The change here corresponds to d � �.04 peryear, an unusual amount of change for a short period of time. Onaverage, birth cohort shifts are about d � .015 to d � .02 per yearin national samples (Twenge & Foster, 2010). Thus, this yearlyrate of change is more than twice as large as many previouslyidentified birth cohort differences.
Across the 14 domains of life satisfaction, the largest declinesbetween 2012 and 2016 appeared in satisfaction with life as awhole, friends, amount of fun, self, and personal safety; satisfac-tion with the government, parents, and the safety of propertyincreased during this time (see Table 2 and supplemental Figure 1).The domains most strongly correlated with happiness were alsothose that declined the most, r(14) � �.71, p � .005.
Replicating previous research (Twenge & Campbell, 2008),between the early 1990s and the mid-2000s, 12th graders increasedin the self-esteem factor of self-liking but decreased in self-competence (Tafarodi & Milne, 2002). After 2012, however, 12thgraders declined in both self-liking and self-competence (see Fig-ure 2 in the online supplemental materials).
Study 2
Next, we sought to explore possible mechanisms behind thesudden decrease in adolescents’ psychological well-being. Previ-ous research identified significant cohort differences in how ado-lescents spend their time, including less time spent with friends inperson and more time spent on electronic communication such associal media and the Internet, a possible consequence of theincreasing use of smartphones (Twenge & Uhls, 2017). Economicfactors have also been implicated in changes in individuals’ psy-
Thi
sdo
cum
ent
isco
pyri
ghte
dby
the
Am
eric
anPs
ycho
logi
cal
Ass
ocia
tion
oron
eof
itsal
lied
publ
ishe
rs.
Thi
sar
ticle
isin
tend
edso
lely
for
the
pers
onal
use
ofth
ein
divi
dual
user
and
isno
tto
bedi
ssem
inat
edbr
oadl
y.
767DECLINES IN ADOLESCENTS’ WELL-BEING AFTER 2012

chological characteristics over time (Bianchi, 2016; Grossmann &Varnum, 2015; Leckelt et al., 2016; Oishi et al., 2011). Othershave speculated that academic pressure such as too much home-work may be behind reports of rising psychological issues amongadolescents (Dwyer, 2014).
Given the impossibility of random-assignment experiments inwork on cultural change, we developed a two-part test in whichpossible mechanisms can be ruled in or out. This test is notdesigned to rule out complex relationships (e.g., interactive orsuppressor effects) but instead to assess straightforward linearrelationships. For a variable to be a possible cause of the decreasein psychological well-being, it must (a) be correlated with psycho-logical well-being among a population of individuals, and (b)change over time in a corresponding pattern (e.g., variables posi-tively correlated with psychological well-being would need todecrease when well-being was declining, and variables negativelycorrelated with psychological well-being would need to increasewhen well-being was declining). Thus, we undertook a two-stepprocess.
First, we examined correlations between adolescents’ psycho-logical well-being and the time they spent on a wide variety ofactivities, including electronic communication and screen time(e.g., Internet, social media, texting, gaming, TV), in-person/face-to-face social interaction, and other nonscreen activities (e.g.,homework, sports/exercise, attending religious services). Theseanalyses, corresponding to the first part of the two-part test, soughtto determine which activities were linked to higher (vs. lower)psychological well-being among adolescents at the individuallevel. As MtF employs a time-lag rather than a longitudinal design(with different participants every year), we were only able toexamine concurrent, and not lagged, relationships among activitiesand psychological well-being at the individual level. Previousresearch found that the link between electronic communication andlower well-being had a curvilinear component (Przybylski &Weinstein, 2017); thus, we also examined the exposure-responsecurve between electronic communication and well-being.
Second, we matched mean, composite psychological well-beingby year with average time spent on screen and nonscreen activitiesand with broader cultural indicators such as smartphone adoption,unemployment, stock market performance, income inequality, me-dian income, GDP, and college enrollment to provide a view ofcorrelations when matched by year at the group level. Matchingcharacteristics by year follows the method of previous researchexamining possible causes behind cultural change (Grossmann &Varnum, 2015; Twenge, Campbell, & Carter, 2014; Varnum &Grossmann, 2016). We also examined these correlations lagged byyear, to provide a view of whether the activity or indicator changedbefore psychological well-being, or instead if psychological well-being changed before the activity or indicator (e.g., if the increasein the frequency of Internet use preceded or followed the declinein psychological well-being). These are known as Granger causal-ity analyses (Granger, 1969). These analyses constitute the secondpart of the two-part test for ruling in or out possible mechanismsbehind the recent decrease in adolescents’ psychological well-being, demonstrating which activities and indicators changed at thesame time. These analyses focus on 2006 and later, when the MtFsurvey began asking about time spent online.T
able
1U
.S.
Ado
lesc
ents
’P
sych
olog
ical
Wel
l-B
eing
,19
91–2
016
Scal
eG
rade
N19
91–1
994
1995
–199
920
00–2
004
2005
–200
920
10–2
011
2012
2013
2014
2015
2016
d(1
991–
1994
to20
10–2
011)
d(2
012
to20
16)
Self
-est
eem
817
3,17
13.
96(.
89)
4.00
(.89
)4.
00(.
91)
4.00
(.91
)3.
98(.
92)
3.97
(.92
)3.
87(.
97)
3.81
(.99
)3.
84(.
99)
3.83
(.99
).0
2�
.15
Self
-est
eem
1017
6,44
13.
97(.
88)
3.99
(.89
)3.
98(.
88)
4.00
(.87
)3.
98(.
89)
3.96
(.89
)3.
86(.
94)
3.81
(.97
)3.
81(.
95)
3.79
(.95
).0
1�
.18
Self
-est
eem
1261
,709
4.04
(.79
)4.
08(.
80)
4.06
(.80
)4.
05(.
79)
4.03
(.82
)4.
03(.
81)
3.97
(.83
)3.
88(.
89)
3.86
(.89
)3.
83(.
90)
�.0
1�
.24
Self
-sat
isfa
ctio
n12
63,2
215.
43(1
.52)
5.44
(1.5
4)5.
43(1
.57)
5.46
(1.5
4)5.
51(1
.56)
5.46
(1.5
8)5.
47(1
.57)
5.27
(1.6
7)5.
25(1
.74)
5.17
(1.7
7).0
5�
.17
Dom
ain
satis
fact
ion
1259
,347
4.96
(.93
)5.
00(.
93)
5.08
(.95
)5.
11(.
94)
5.14
(.95
)5.
19(.
93)
5.16
(.92
)5.
08(.
97)
5.06
(1.0
4)5.
12(1
.01)
.19
�.0
7L
ife
satis
fact
ion
1260
,642
4.79
(1.5
7)4.
91(1
.57)
4.98
(1.5
5)5.
04(1
.53)
5.02
(1.6
0)5.
01(1
.58)
5.01
(1.6
0)4.
93(1
.58)
4.95
(1.5
9)4.
89(1
.60)
.15
�.0
8H
appi
ness
843
7,29
31.
99(.
57)
2.02
(.58
)2.
04(.
58)
2.05
(.59
)2.
06(.
59)
2.07
(.58
)2.
04(.
59)
2.02
(.59
)2.
02(.
59)
2.03
(.59
).1
2�
.07
Hap
pine
ss10
398,
673
1.99
(.58
)2.
02(.
58)
2.03
(.58
)2.
05(.
58)
2.06
(.59
)2.
06(.
58)
2.04
(.59
)2.
01(.
59)
2.00
(.59
)1.
98(.
59)
.12
�.1
4H
appi
ness
1231
1,55
22.
00(.
59)
2.03
(.59
)2.
08(.
59)
2.10
(.59
)2.
09(.
60)
2.11
(.60
)2.
09(.
59)
2.08
(.60
)2.
06(.
60)
2.04
(.60
).1
5�
.12
Not
e.A
llds
�.0
3ar
esi
gnif
ican
tat
p�
.05.
Self
-est
eem
isa
six-
item
mea
sure
;do
mai
nsa
tisfa
ctio
nis
a13
-ite
mm
easu
re.
Thi
sdo
cum
ent
isco
pyri
ghte
dby
the
Am
eric
anPs
ycho
logi
cal
Ass
ocia
tion
oron
eof
itsal
lied
publ
ishe
rs.
Thi
sar
ticle
isin
tend
edso
lely
for
the
pers
onal
use
ofth
ein
divi
dual
user
and
isno
tto
bedi
ssem
inat
edbr
oadl
y.
768 TWENGE, MARTIN, AND CAMPBELL
Method
Participants. Participants were the 8th, 10th, and 12th gradestudents who completed the MtF surveys (as detailed in Study 1),focusing on recent years when items about online activities wereasked.
Measures.Psychological well-being. Measures included self-esteem, life
satisfaction (with life as a whole), and happiness, as these were theitems asked of the same participants as the items on activities.
New media screen activities. For clarity, we include the labelwe will use for each activity in italics. Across all grade levels,Internet hours per week was assessed with the following itembeginning in 2006: “Not counting work for school or a job, abouthow many hours a week do you spend on the Internet e-mailing,instant messaging, gaming, shopping, searching, downloading mu-sic, etc.?” To estimate the number of hours spent per week,response choices were recoded to none � 0, less than 1 � .5, 1–2hr � 1.5, 3–5 hr � 4, 6–9 hr � 7.5, 10–19 hr � 14.5, 20–29 hr �24.5, and 30 or more � 35. In 2010, “30 or more” became 30–39hr and a new choice, 40 hr or more, was added; we estimated theseas 30–39 hr � 34.5 and 40 or more � 45.
In 2008, an item on gaming hours per week was added: “Abouthow many hours a week do you spend . . . playing electronic gameson a computer, TV, phone, or other device?” In 2010, “texting ona cell phone” (texting hours per week) was added. In 2013,
“visiting social networking sites like Facebook” (referred to associal media hours per week) and “video chatting (Skype, etc.),”(video chat hours per week) were added. All of these items had thesame response choices in hours as Internet use.
Another section begins, “The next questions ask about the kindsof things you might do. How often do you do each of the follow-ing?” which includes “visit social networking websites (like Fa-cebook).” This item was added in 2009 and was asked until 2011as “like MySpace or Facebook.” Response choices were 1 (never),2 (a few times a year), 3 (once or twice a month), 4 (at least oncea week), and 5 (almost everyday; we refer to this item as socialmedia 1–5 scale to distinguish it from the item asking about socialmedia use in terms of hours per week). Beginning in 2005, anotherquestion asked 8th and 10th graders, “How often do you use eachof the following to get information about news and current events?The Internet” (reading news online) with the same responsechoices.
TV watching. Eighth and 10th graders were asked two ques-tions on TV viewing. First: “How much TV do you estimate youwatch on an average weekday?” Response choices were recoded tonone � 0, half-hour or less � .25, about 1 hr � 1, about 2 hr �2, about 3 hr � 3, about 4 hr � 4, and 5 hr or more � 6. Second:“How much TV do you estimate you watch on an average WEEK-END (both Saturday and Sunday combined)?” Response choiceswere recoded to none � 0, an hour or less � .5, 1–2 hr � 1.5, 3–4
Figure 1. Total self-esteem, 8th, 10th, and 12th graders, 1991–2016. Error bars represent �1 SE. The y-axisis truncated to illustrate the changes. The potential range of self-esteem was 1–5, with an SD of approximately.97. More detail given in Table 1.
Thi
sdo
cum
ent
isco
pyri
ghte
dby
the
Am
eric
anPs
ycho
logi
cal
Ass
ocia
tion
oron
eof
itsal
lied
publ
ishe
rs.
Thi
sar
ticle
isin
tend
edso
lely
for
the
pers
onal
use
ofth
ein
divi
dual
user
and
isno
tto
bedi
ssem
inat
edbr
oadl
y.
769DECLINES IN ADOLESCENTS’ WELL-BEING AFTER 2012

hr � 3.5, 5–6 hr � 5.5, 7–8 hr � 7.5, and 9 or more hours � 10.We multiplied the weekday estimate by 5, added the weekendestimate, and divided the total by 7 to obtain a daily estimate (TVwatching hours per day). Twelfth graders were asked only the itemabout weekday TV watching.
In-person social interaction. Four items were asked in thesame section beginning “How often do you do each of the follow-ing?”: “get together with friends, informally;” “go to parties orother social affairs;” “ride around in a car (or motorcycle) just forfun;” “go to a shopping mall.” Response choices were 1 (never), 2(a few times a year), 3 (once or twice a month), 4 (at least once aweek), and 5 (almost everyday). Another item asked about goingout: “During a typical week, on how many evenings do you go outfor fun and recreation? (Don’t count things you do with yourparents or other adult relatives)” with response choices recoded as“less than one” � .25, “one” � 1, two � 2, “three” � 3, “four orfive” � 4.5, “six or seven” � 6.5. Less than one was recoded as.25 instead of .50 because “none” was not a response choice on thisitem. Another asked about dating: “On the average, how often (ifever) do you go out with a date?” with choices recoded to“never” � 0, “once a month or less” � .12, “2 or 3 times amonth” � .58, “once a week” � 1, “2 or 3 times a week” � 2.5,and “over 3 times a week” � 4. The calculations for the first tworecodes were as follows: once a month or less � .50 times amonth, divided by 4.3 (the average number of weeks in amonth) � .12; 2 or 3 times a month � 2.5, divided by 4.3 � .58.
The six items were Z scored, added together, and divided by 6(� � .68; in-person social interaction).
Homework. “About how many hours do you spend in anaverage week on all your homework including both in school andout of school?” with response choices recoded to 0 hr � 0, 1–4hr � 2.5, 5–9 hr � 7, 10–14 hr � 12, 15–19 hr � 17, 20–24 hr �22, and 25 or more hours � 30 (homework hours per week).
Sports or exercise. “How often do you do each of the follow-ing? Actively participate in sports, athletics, or exercising.” Re-sponse choices were 1 (never), 2 (a few times a year), 3 (once ortwice a month), 4 (at least once a week), and 5 (almost everyday;sports/exercise).
Religious services. “How often do you attend religious ser-vices?” Response choices were 1 (never), 2 (rarely), 3 (once ortwice a month), and 4 (once a week or more; (religious services).
Paid job. “During an average week how much money do youget from a job or other work?” Those who answered anythingexcept “none” were coded as having a paid job (have a paid job).
Print media. Eighth and 10th graders were asked: “How oftendo you do each of the following? Read magazines. Read newspa-pers.” Response choices were 1 (never), 2 (a few times a year), 3(once or twice a month), 4 (at least once a week), and 5 (almosteveryday). Responses were added and divided by 2 (� � .59; printmedia).
Economic factors. We gathered yearly statistics on the (a)unemployment rate (unemployment), (b) the change in the Dow
Figure 2. Self-satisfaction, domain satisfaction, and life satisfaction, 12th graders, 1991–2016. Error barsrepresent �1 SE. The y-axis is truncated to highlight the changes. The potential range of each satisfactionmeasure was 1–7, with SDs of approximately 1.56, .95, and 1.57, respectively. More detail given in Table 1.
Thi
sdo
cum
ent
isco
pyri
ghte
dby
the
Am
eric
anPs
ycho
logi
cal
Ass
ocia
tion
oron
eof
itsal
lied
publ
ishe
rs.
Thi
sar
ticle
isin
tend
edso
lely
for
the
pers
onal
use
ofth
ein
divi
dual
user
and
isno
tto
bedi
ssem
inat
edbr
oadl
y.
770 TWENGE, MARTIN, AND CAMPBELL
Jones Industrial Average (DJIA) stock market indicator (DJIAchange), (c) the GINI index of income inequality (income inequal-ity), (d) median household income in 2015 dollars (median house-hold income), (e) gross domestic product (GDP), and (f) thepercentage of high school graduates who enroll in college (collegeenrollment) from publicly available sources such as the Bureau ofLabor Statistics and the Federal Reserve Bank.
Smartphone adoption. We gathered yearly statistics on thepercentage of the United States population who owns a smart-phone (smartphone adoption) from surveys conducted by the PewResearch Center (Smith, 2017). These statistics were availablebeginning in 2011. Smartphones were introduced in 2007, so weset 2006 at zero and assumed linear growth between 2007 and2010.
Statistical analyses. We limited the analyses examining thecorrelations between psychological well-being and activities to theyears 2013–2016, when the survey asked the more rigorous ques-tion about time spent on social media (in terms of hours per weekrather than the very general never to almost every day scale, whichin later years has lacked variance as the vast majority of adoles-cents now use social media every day).
We focused primarily on the 8th and 10th grade samples be-cause the items on electronic communication in hours and the sixin-person social interaction items were asked of the same partici-pants, while they were not for 12th graders. In addition, fewer 12th
graders were asked the items on hours spent on electronic com-munication (n � 7,361) than 8th to 10th graders (n � 34,413),resulting in several exposure cells with low n (e.g., for 12th gradersreporting video chatting 30–39 hr a week, n � 51). Thus, the 12thgrade data should be interpreted with caution. However, we reportthe results for 12th graders for the sake of completeness.
We first report bivariate correlations between the activities andthe measures of psychological well-being. Next, we report partialcorrelations controlled for demographic factors, including race/ethnicity (with dummy codes for Black and Hispanic; the surveymeasures race/ethnicity as only White, Black, and Hispanic), sex,socioeconomic status (SES; mother’s education), and grade level.We also plotted the exposure-response curve between electroniccommunication and happiness, both using means (in tables) andusing the percentage who identified as “not very happy” (infigures).
We examined possible additive and interaction effects for screentime with in-person social interaction, as adolescents who spendmore time with their friends in person may also be more likely tointeract with their friends online. To illustrate these results, wecreated a figure showing mean happiness for those low and high inin-person social interaction and low and high in hours spent onsocial media. For in-person social interaction, this was those �1SD of the mean. Social media and texting hours had a right-skeweddistribution, so we compared those who spent no time or less than
Figure 3. Happiness, 8th, 10th, and 12th graders, 1991–2016. Error bars represent �1 SE. The y-axis istruncated to highlight the changes. The potential range of the happiness measure was 1–3, with an SD ofapproximately .59. More detail is given in Table 1.
Thi
sdo
cum
ent
isco
pyri
ghte
dby
the
Am
eric
anPs
ycho
logi
cal
Ass
ocia
tion
oron
eof
itsal
lied
publ
ishe
rs.
Thi
sar
ticle
isin
tend
edso
lely
for
the
pers
onal
use
ofth
ein
divi
dual
user
and
isno
tto
bedi
ssem
inat
edbr
oadl
y.
771DECLINES IN ADOLESCENTS’ WELL-BEING AFTER 2012

an hour (low) with those who spent 20 hr a week or more (high).These roughly corresponded to the bottom and top 20% of thedistribution. As only 8th and 10th graders were asked the sixin-person social interaction items on the same form as the elec-tronic communication hours items, these analyses focused on theseage groups. We also report the exposure-response curve for hap-piness controlled for sex, race, SES, grade, and in-person socialinteraction, again for 8th and 10th graders only.
To examine the co-occurrence of psychological well-being withelectronic communication, nonscreen activities, and economic fac-tors, we matched the means of these variables among 8th and 10thgraders by year. Matching by year is an established method forexploring cultural change at the group level (Grossmann & Var-num, 2015; Twenge et al., 2014; Varnum & Grossmann, 2016).Because means vary less than individuals, these ecological corre-lations are often high; to compensate, the df is the number of yearsrather than the number of individuals. For these analyses, wecreated an index of the two measures of psychological well-beingasked of the 8th and 10th graders (self-esteem and happiness). Welimited this analysis to 8th and 10th graders because the correla-tional analyses for activities and well-being relied primarily on thatpopulation, and because 12th graders were not asked about totalhours spent watching TV, reading news online, or print media use.These analyses examined the years 2006–2016, as the item onInternet use was first asked in 2006. We were limited to the screenactivities with data beginning 2006 or earlier: Internet use, smart-phone adoption, reading news online, and TV watching. We ex-amined these correlations concurrently as well as for the activityone year before a well-being measurement, and the activity oneyear after a well-being measurement (known as Granger causalityanalyses: Granger, 1969). The p values are two-tailed.
Results and Discussion
Adolescents who spent more time on electronic communicationand screens (e.g., social media, texting, electronic games, Internet)were less happy, less satisfied with their lives, and had lowerself-esteem, especially among 8th and 10th graders. TV watching,an older screen activity, was also linked to lower psychologicalwell-being. In contrast, adolescents who spent more time on non-screen activities such as in-person social interaction, sports/exer-cise, print media, and homework had higher psychological well-being (Table 2). Among 8th and 10th graders, every nonscreenactivity was correlated with greater happiness, and every screenactivity was correlated with less happiness (Figure 4).
The negative correlations between screen activities and well-being were generally weaker among 12th graders, suggesting thattime spent on electronic communication is not as strongly linked towell-being among older adolescents as it is among younger ado-lescents. However, the positive correlations between nonscreenactivities and well-being were similar across all age groups. Cor-relations with well-being were weaker or even positive for themeasure of social media on a 1–5 scale ranging from never tonearly every day, possibly because such a high percentage ofadolescents used social media nearly every day by 2013–2016(75% of 8th and 10th graders and 80% of 12th graders).
Happiness and electronic communication: exposure-response curves. Next, we examined the exposure-response re-lationship between new media screen activities and happiness.Similar to previous research (Przybylski & Weinstein, 2017),happiness levels were higher among adolescents using new mediaa few hours a week compared with those not using it all, with meanhappiness then progressively declining with more hours of use(Table 3). Just as with the bivariate correlations, these effects were
Table 2Correlations Between Psychological Well-Being and Time Spent on Screen and Non-Screen Activities, 8th, 10th, and 12th Graders,2013–2016
ActivitiesHappiness
(8th and 10th) Happiness (12th) Life satisfaction (12th)Self-esteem
(8th and 10th) Self-esteem (12th)
Screen activities and electroniccommunication
Social media hours/week �.09��� (�.07���) �.05��� (�.03�)Internet hours/week �.11��� (�.11���) �.08��� (�.08���)Gaming hours/week �.09��� (�.08���) �.08��� (�.07���)Texting hours/week �.07��� (�.05���) �.03� (�.01)Video chat hours/week �.05��� (�.05���) �.03�� (�.02)Social media (1–5 scale) �.01�� (.01) .03�� (.04���) .03�� (.03�) �.04��� (�.01) .03� (.04��)Reading news online .00 (�.01) .01 (.00)TV watching hours/day �.02��� (�.01��) �.01 (.01) �.01� (�.01)
Nonscreen activitiesIn-person social interaction (composite
of 6 activities) .12��� (.12���) .14��� (.14���) .10��� (.10���) .10��� (.11���) .14��� (.13���)Homework hours/week .02��� (.02���) .01 (.00) .03� (.03�) .03��� (.04���) .00 (.00)Sports/exercise .16��� (.14���) .17��� (.16���) .13��� (.12���) .23��� (.21���) .21��� (.20���)Religious services .08��� (.09���) .10��� (.11���) .11��� (.12���) .15��� (.14���) .12��� (.12���)Have a paid job .02��� (.00) .03� (.01) .03� (.02) .02��� (.01) .03� (.03�)Print media .07��� (.06���) .08��� (.07���)
Note. Correlations in parentheses are controlled for sex, race, socioeconomic status (mother’s education), and grade (for 8th and 10th graders). TVwatching for 8th and 10th graders is a total for both weekdays and weekends; for 12th graders it is weekdays only.� p � .05. �� p � .01. ��� p � .001.
Thi
sdo
cum
ent
isco
pyri
ghte
dby
the
Am
eric
anPs
ycho
logi
cal
Ass
ocia
tion
oron
eof
itsal
lied
publ
ishe
rs.
Thi
sar
ticle
isin
tend
edso
lely
for
the
pers
onal
use
ofth
ein
divi
dual
user
and
isno
tto
bedi
ssem
inat
edbr
oadl
y.
772 TWENGE, MARTIN, AND CAMPBELL

generally smaller among 12th graders than among 8th and 10thgraders.
We also plotted the percentage of teens describing themselves as“not too happy” by levels of new media use. Compared with thoseusing new media only a few hours a week, 8th and 10th graderswho engaged with news media 40 hr a week or more (about 6 hra day) were twice as likely or nearly twice as likely to describethemselves as unhappy (Figure 5A). This extreme level of use wasnot uncommon, constituting 11% of 8th and 10th graders foronline time, 11% for social media use, 10% for gaming, and 13%for texting, though only 3% for video chat. Differences in happi-ness were considerable even below levels of extreme use. Com-pared with those using social media 1–2 hr a week, 8th and 10thgraders who used social media 10 to 19 hr a week (about 2 hr aday) were 41% more likely to be unhappy (18.10% vs. 12.88%).Eighth and 10th graders who texted 20 to 29 hr a week (about 3.5hr a day) were 45% more likely to be unhappy than those whotexted only 1–2 hr a week (17.90% vs. 12.31%).
The exposure-response curve for 12th graders was more shallowthan the curve for 8th and 10th graders, with a higher level ofunhappiness among nonusers and an inflection point at a highernumber of hours (see Figure 5B). For example, the happiest 12thgraders were those who spent 3–5 hr a week on social media(12.08% were unhappy, compared with 15.95% of those who spentno time on social media and 20.35% of those spending 40� hr aweek). Thus those using social media a very high amount of timewere 68% more likely to be unhappy, and those not using it at all32% more likely to be unhappy, than those using it a small amountof time. The curve for 12th graders was more similar to that for 8th
and 10th graders for Internet time, with those online 20–29 hr aweek 66% more likely to be unhappy than those online only 1–2hr a week, and those online 40 or more hours a week twice aslikely (105%) to be unhappy. Those who did not use the Internetat all were 62% more likely to be unhappy than those who used it1–2 hr a week.
The role of in-person social interaction. Likely due to indi-vidual differences in sociability, adolescents who spent more timeinteracting with friends in person also spent more time interactingwith them online. Of the electronic communication activities,texting was the most highly correlated with in-person social inter-action r(33,099) � .29, p � .001, followed by social media on the1–5 scale, r(73,813) � .28, p � 001, social media hours,r(33,114) � .24, p � .001, reading news online, r(110,363) � .18,p � .001, and video chatting, r(33,043) � .17, p � .001. (Totalonline time was not correlated with in-person social interactionr(33,222) � .00, p � .74, and gaming was only weakly correlated,r(33,173) � .02, p � .001). Thus, we examined possible additive,suppressive, and interactive effects of electronic communicationand in-person social interaction on happiness. In regression equa-tions including in-person social interaction and each electroniccommunication activity, in-person social interaction was consis-tently correlated with greater happiness and self-esteem, and elec-tronic communication was consistently correlated with lower hap-piness and self-esteem. The results were similar when the cross-product (the interaction term) was included in the regressionequation (Table 4). The exposure-response curve for unhappinessfor 8th and 10th graders was also similar when the demographicvariables and the index of in-person social interaction were in-
Figure 4. Partial correlations between happiness and screen activities (black bars) and nonscreen activities(gray bars), including demographic controls, 8th, and 10th graders, 2013–2016.
Thi
sdo
cum
ent
isco
pyri
ghte
dby
the
Am
eric
anPs
ycho
logi
cal
Ass
ocia
tion
oron
eof
itsal
lied
publ
ishe
rs.
Thi
sar
ticle
isin
tend
edso
lely
for
the
pers
onal
use
ofth
ein
divi
dual
user
and
isno
tto
bedi
ssem
inat
edbr
oadl
y.
773DECLINES IN ADOLESCENTS’ WELL-BEING AFTER 2012

cluded as covariates (see Table 3 and supplemental Figure 3).Thus, when in-person social interaction was controlled, electroniccommunication was still linked to lower happiness, in some casesat an even higher rate.
The least happy adolescents were those low in in-person socialinteraction and high in electronic communication, and the happiestwere those high in in-person social interaction and low in elec-tronic communication. For example, social media use was nega-tively related to happiness among both those low in in-personsocial interaction, F(1, 2993) � 88.59, p � .001, d � .43, andamong those high in in-person social interaction, F(1, 2542) �42.20, p � .001, d � .28 (Figure 6). Similar results appeared fortexting: those who spent more time on texting were less happy,including both those low in in-person social interaction, F(1,3020) � 69.52, p � .001, d � .38 and for those high in in-personsocial interaction, F(1, 2588) � 20.56, p � .001, d � .23 (seeFigure 4 in the online supplemental materials).
Well-being, activities, and economic indicators by year.Next, we matched mean psychological well-being by year withmean levels of adolescents’ activities as well as broader culturalindicators. This provides a view of the trends at the group orcultural level. These analyses showed that psychological well-being was lowest in years when adolescents spent more timeonline, on social media, and reading news online, and when moreAmericans owned smartphones. Psychological well-being washighest in years when adolescents spent more time with theirfriends in person, reading print media, and on exercise/sports(Table 5). Homework time was not related to psychological well-being when matched by year. TV watching declined over time;thus, TV watching was positively correlated with psychologicalwell-being when matched by year.
We then lagged these indicators by one year in either direction,known as Granger causality analyses. These analyses suggestedthat the changes in activities, particularly those in new mediascreen activities, preceded the decrease in psychological well-being rather than vice versa (see Table 5). The same was also trueof most nonscreen activities, with decreases in these activitiespredicting psychological well-being one year later.
Last, we matched economic indicators by year with mean psy-chological well-being. The GINI index of income inequality was asignificant predictor of lower psychological well-being, both con-currently and as a predictor from one year before. GDP was alsoa significant negative predictor in all three comparisons. Medianfamily income and college enrollment were not significantly cor-related with yearly well-being. However, cyclical economic fac-tors such as unemployment and yearly change in the DJIA werenot significantly correlated with psychological well-being whenmatched by year, either concurrently or when lagged. Thus, theGreat Recession is unlikely to be a direct cause (at least in currentor 1-year lagged effects) of the decline in psychological well-
Figure 5 (opposite). (A) Exposure-response curve for unhappiness andelectronic communication, 8th and 10th graders, 2013–2016. (B)Exposure-response curve for unhappiness and electronic communication,12th graders, 2013–2016. The y-axis is truncated to illustrate the changes.The potential range of percent not happy is 0–100%.T
able
3M
ean
Hap
pine
ssan
dH
ours
Per
Wee
kSp
ent
onSc
reen
Act
ivit
ies,
8th
and
10th
Gra
ders
and
12th
Gra
ders
,20
13–2
016
Mea
nty
peN
one
�1
hr1–
2hr
3–5
hr6
–9hr
10–1
9hr
20–2
9hr
30–3
9hr
40�
hrd
(0vs
.40
�)
d(1
–2vs
.40
�)
8th
and
10th
,no
nadj
uste
dSo
cial
med
iaho
urs/
wee
k2.
04(.
61)
2.08
(.58
)2.
08(.
58)
2.03
(.58
)2.
02(.
58)
1.98
(.58
)1.
97(.
58)
1.91
(.58
)1.
91(.
61)
�.2
1�
.29
Inte
rnet
hour
s/w
eek
2.05
(.62
)2.
11(.
58)
2.09
(.57
)2.
05(.
57)
2.02
(.58
)2.
01(.
58)
1.99
(.60
)1.
91(.
58)
1.87
(.62
)�
.29
�.3
7G
amin
gho
urs/
wk
2.01
(.64
)2.
07(.
60)
2.07
(.57
)2.
05(.
57)
2.03
(.57
)2.
02(.
58)
2.00
(.59
)1.
93(.
57)
1.89
(.62
)�
.19
�.3
1T
extin
gho
urs/
wee
k1.
98(.
63)
2.07
(.58
)2.
09(.
57)
2.04
(.57
)2.
02(.
58)
2.01
(.59
)1.
98(.
56)
1.97
(.61
)1.
93(.
61)
�.0
8�
.27
Vid
eoch
atho
urs/
wee
k2.
04(.
60)
2.05
(.57
)2.
00(.
57)
1.99
(.57
)1.
94(.
59)
1.98
(.58
)1.
97(.
64)
1.89
(.60
)1.
92(.
66)
�.2
0�
.14
8th
and
10th
,ad
just
edfo
rco
vari
ates
Soci
alm
edia
hour
s/w
eek
2.10
(.61
)2.
11(.
56)
2.10
(.55
)2.
06(.
58)
2.04
(.59
)1.
98(.
56)
1.98
(.56
)1.
92(.
58)
1.91
(.60
)�
.31
�.3
1In
tern
etho
urs/
wee
k2.
08(.
59)
2.14
(.56
)2.
12(.
57)
2.07
(.55
)2.
03(.
56)
2.02
(.57
)2.
00(.
58)
1.93
(.57
)1.
90(.
57)
�.3
1�
.39
Gam
ing
hour
s/w
eek
2.06
(.59
)2.
10(.
57)
2.08
(.60
)2.
06(.
58)
2.05
(.58
)2.
03(.
56)
2.02
(.57
)1.
96(.
58)
1.91
(.58
)�
.25
�.2
9T
extin
gho
urs/
wee
k2.
05(.
59)
2.13
(.59
)2.
11(.
59)
2.06
(.59
)2.
04(.
56)
2.01
(.57
)1.
97(.
57)
1.98
(.57
)1.
94(.
59)
�.1
9�
.29
Vid
eoch
atho
urs/
wee
k2.
08(.
62)
2.07
(.59
)2.
01(.
60)
2.00
(.59
)1.
94(.
58)
1.98
(.58
)1.
98(.
58)
1.93
(.57
)1.
89(.
57)
�.3
1�
.20
12th
grad
ers,
nona
djus
ted
Soci
alm
edia
hour
s/w
eek
2.09
(.64
)2.
06(.
58)
2.10
(.61
)2.
10(.
58)
2.06
(.56
)2.
08(.
62)
2.07
(.60
)2.
02(.
56)
1.99
(.63
)�
.16
�.1
1In
tern
etho
urs/
wee
k2.
09(.
64)
2.12
(.57
)2.
16(.
58)
2.10
(.57
)2.
06(.
57)
2.07
(.62
)2.
02(.
60)
2.04
(.62
)1.
97(.
62)
�.1
9�
.32
Gam
ing
hour
s/w
eek
2.11
(.62
)2.
09(.
59)
2.12
(.59
)2.
07(.
58)
2.07
(.59
)2.
06(.
60)
2.00
(.59
)2.
02(.
63)
1.95
(.61
)�
.26
�.2
8T
extin
gho
urs/
wee
k2.
10(.
67)
2.02
(.58
)2.
11(.
60)
2.08
(.58
)2.
07(.
57)
2.10
(.60
)2.
08(.
61)
2.05
(.59
)2.
03(.
61)
�.1
1�
.13
Vid
eoch
atho
urs/
wee
k2.
08(.
60)
2.09
(.59
)2.
05(.
57)
2.04
(.56
)2.
04(.
63)
2.07
(.58
)2.
02(.
65)
2.04
(.63
)1.
97(.
63)
�.1
8�
.14
Not
e.C
ovar
iate
sar
ese
x,ra
ce(d
umm
yco
ded)
,mot
her’
sed
ucat
ion,
grad
e,an
dth
ein
dex
ofsi
xin
-per
son
soci
alin
tera
ctio
nac
tiviti
es.M
eans
adju
sted
for
this
list
ofco
vari
ates
cann
otbe
repo
rted
for
12th
grad
ers
asth
esi
xite
ms
ofth
ein
-per
son
soci
alin
tera
ctio
nin
dex
wer
eno
tas
ked
onth
esa
me
form
asth
ese
item
son
elec
tron
icco
mm
unic
atio
n.
Thi
sdo
cum
ent
isco
pyri
ghte
dby
the
Am
eric
anPs
ycho
logi
cal
Ass
ocia
tion
oron
eof
itsal
lied
publ
ishe
rs.
Thi
sar
ticle
isin
tend
edso
lely
for
the
pers
onal
use
ofth
ein
divi
dual
user
and
isno
tto
bedi
ssem
inat
edbr
oadl
y.
774 TWENGE, MARTIN, AND CAMPBELL

Figure 5 (opposite)
Thi
sdo
cum
ent
isco
pyri
ghte
dby
the
Am
eric
anPs
ycho
logi
cal
Ass
ocia
tion
oron
eof
itsal
lied
publ
ishe
rs.
Thi
sar
ticle
isin
tend
edso
lely
for
the
pers
onal
use
ofth
ein
divi
dual
user
and
isno
tto
bedi
ssem
inat
edbr
oadl
y.
775DECLINES IN ADOLESCENTS’ WELL-BEING AFTER 2012
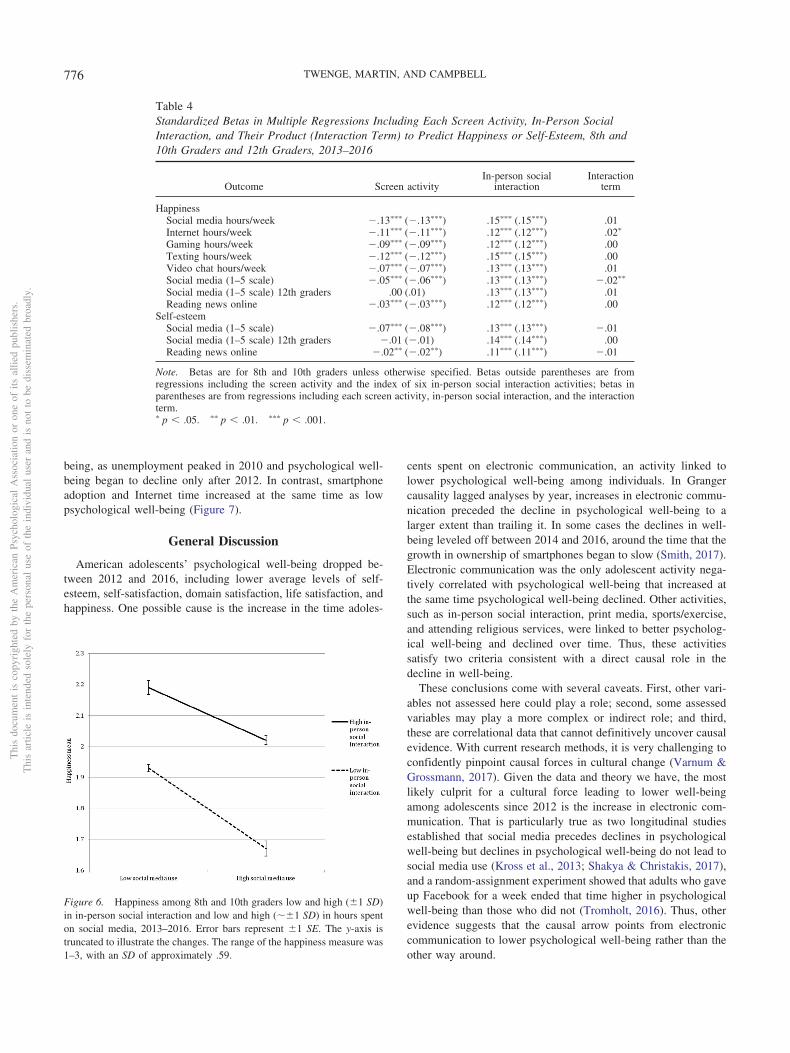
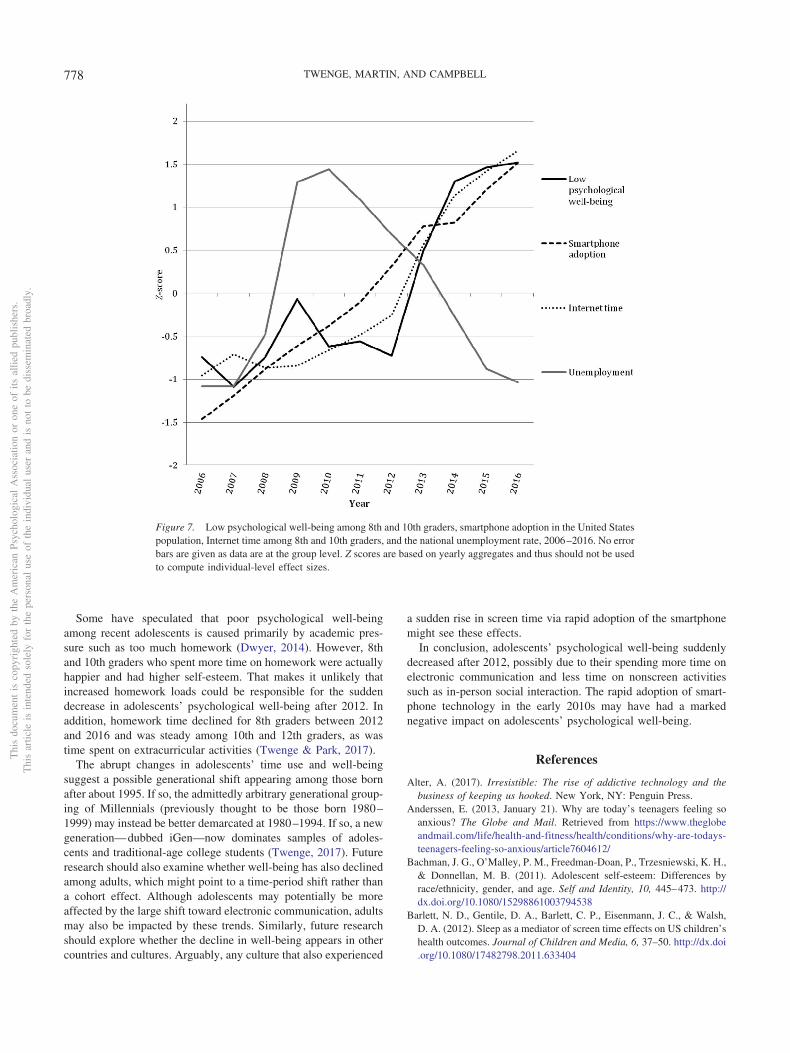
being, as unemployment peaked in 2010 and psychological well-being began to decline only after 2012. In contrast, smartphoneadoption and Internet time increased at the same time as lowpsychological well-being (Figure 7).
General Discussion
American adolescents’ psychological well-being dropped be-tween 2012 and 2016, including lower average levels of self-esteem, self-satisfaction, domain satisfaction, life satisfaction, andhappiness. One possible cause is the increase in the time adoles-
cents spent on electronic communication, an activity linked tolower psychological well-being among individuals. In Grangercausality lagged analyses by year, increases in electronic commu-nication preceded the decline in psychological well-being to alarger extent than trailing it. In some cases the declines in well-being leveled off between 2014 and 2016, around the time that thegrowth in ownership of smartphones began to slow (Smith, 2017).Electronic communication was the only adolescent activity nega-tively correlated with psychological well-being that increased atthe same time psychological well-being declined. Other activities,such as in-person social interaction, print media, sports/exercise,and attending religious services, were linked to better psycholog-ical well-being and declined over time. Thus, these activitiessatisfy two criteria consistent with a direct causal role in thedecline in well-being.
These conclusions come with several caveats. First, other vari-ables not assessed here could play a role; second, some assessedvariables may play a more complex or indirect role; and third,these are correlational data that cannot definitively uncover causalevidence. With current research methods, it is very challenging toconfidently pinpoint causal forces in cultural change (Varnum &Grossmann, 2017). Given the data and theory we have, the mostlikely culprit for a cultural force leading to lower well-beingamong adolescents since 2012 is the increase in electronic com-munication. That is particularly true as two longitudinal studiesestablished that social media precedes declines in psychologicalwell-being but declines in psychological well-being do not lead tosocial media use (Kross et al., 2013; Shakya & Christakis, 2017),and a random-assignment experiment showed that adults who gaveup Facebook for a week ended that time higher in psychologicalwell-being than those who did not (Tromholt, 2016). Thus, otherevidence suggests that the causal arrow points from electroniccommunication to lower psychological well-being rather than theother way around.
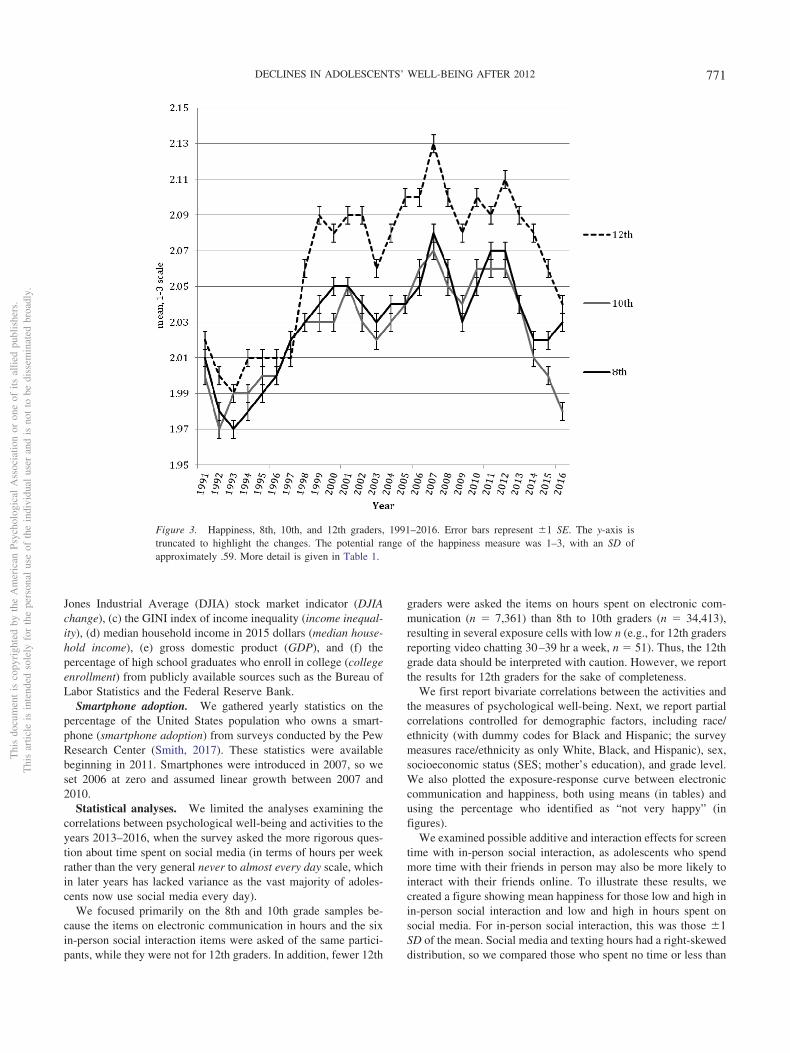
Table 4Standardized Betas in Multiple Regressions Including Each Screen Activity, In-Person SocialInteraction, and Their Product (Interaction Term) to Predict Happiness or Self-Esteem, 8th and10th Graders and 12th Graders, 2013–2016
Outcome Screen activityIn-person social
interactionInteraction
term
HappinessSocial media hours/week �.13��� (�.13���) .15��� (.15���) .01Internet hours/week �.11��� (�.11���) .12��� (.12���) .02�
Gaming hours/week �.09��� (�.09���) .12��� (.12���) .00Texting hours/week �.12��� (�.12���) .15��� (.15���) .00Video chat hours/week �.07��� (�.07���) .13��� (.13���) .01Social media (1–5 scale) �.05��� (�.06���) .13��� (.13���) �.02��
Social media (1–5 scale) 12th graders .00 (.01) .13��� (.13���) .01Reading news online �.03��� (�.03���) .12��� (.12���) .00
Self-esteemSocial media (1–5 scale) �.07��� (�.08���) .13��� (.13���) �.01Social media (1–5 scale) 12th graders �.01 (�.01) .14��� (.14���) .00Reading news online �.02�� (�.02��) .11��� (.11���) �.01
Note. Betas are for 8th and 10th graders unless otherwise specified. Betas outside parentheses are fromregressions including the screen activity and the index of six in-person social interaction activities; betas inparentheses are from regressions including each screen activity, in-person social interaction, and the interactionterm.� p � .05. �� p � .01. ��� p � .001.
Figure 6. Happiness among 8th and 10th graders low and high (�1 SD)in in-person social interaction and low and high (��1 SD) in hours spenton social media, 2013–2016. Error bars represent �1 SE. The y-axis istruncated to illustrate the changes. The range of the happiness measure was1–3, with an SD of approximately .59.
Thi
sdo
cum
ent
isco
pyri
ghte
dby
the
Am
eric
anPs
ycho
logi
cal
Ass
ocia
tion
oron
eof
itsal
lied
publ
ishe
rs.
Thi
sar
ticle
isin
tend
edso
lely
for
the
pers
onal
use
ofth
ein
divi
dual
user
and
isno
tto
bedi
ssem
inat
edbr
oadl
y.
776 TWENGE, MARTIN, AND CAMPBELL

The decline in in-person social interaction among adolescents inrecent years (Twenge & Uhls, 2017) may also play a role. Therelationship between electronic communication and in-person so-cial interaction varied depending on the level of analysis. Elec-tronic communication and in-person social interaction do not seemto displace each other among individuals, where they are positivelycorrelated. Adolescents who prioritize social relationships overother activities spend more time on both electronic communicationand in-person social interaction. However, at the group level overtime, in-person social interaction decreased at the same time thatelectronic communication increased (Twenge & Uhls, 2017). Thecombination of lower in-person social interaction (positively cor-related with well-being) and higher electronic communication(negatively correlated with well-being) may be two possible andrelated causes of the decline in psychological well-being. Thesudden shift in well-being around 2012–13 suggests that the trendsin adolescent time use reached a tipping point around that year,perhaps due to the market saturation of smartphones in that period(Lenhart, 2015; Smith, 2017).
Other mechanisms created by screen time may also lower well-being. Adolescents who spend more time on screens also sleep less(Barlett, Gentile, Barlett, Eisenmann, & Walsh, 2012; Hysing et al.,2015; Twenge, Krizan, & Hisler, 2017), and inadequate sleep islinked to lower psychological well-being (Kalmbach, Pillai, Roth, &Drake, 2014). Thus, screen time may impact well-being indirectlythrough sleep time and sleep quality. In addition, screen activitiessuch as social media and texting may be addictive (Alter, 2017),which may mean users are spending time on an activity even if it doesnot increase well-being.
Replicating previous research examining adolescents in theUnited Kingdom (Przybylski & Weinstein, 2017), we found thatthe happiest adolescents were those who spent a small amountof time on electronic communication activities, not those whospent no time. However, the exposure-response curve, espe-cially among 8th and 10th graders, showed steadily lowerwell-being with more hours of use after a small amount, withadolescents who spent more than 40 hr a week (6 or more hoursa day) about twice as likely to be unhappy than those spendingonly a few hours a week. (A similar pattern has been found withadolescent marijuana use, where abstainers report more psycho-logical problems than moderate users, but heavy users reportthe most distress; Shedler & Block, 1990). These results suggestthat reducing screen time, not eliminating it entirely, may be auseful path for interventions focusing on increasing adolescentwell-being.
Cyclical economic factors such as unemployment were notclosely linked to psychological well-being, suggesting that theGreat Recession can be ruled out as a simple cause, at least inconcurrent effects and effects delayed by one year. It is possiblethat the effects of the recession took more than one year to appear.However, given that the Great Recession began in 2007 (withunemployment peaking in 2010) and the decline in well-being wasthe most steep around 2013, the effects would have to be delayedby 3 to 6 years, which seems unlikely (see Figure 7). However,income inequality was related to poor psychological well-being,suggesting it may play a role in the decline, consistent withprevious research (Oishi et al., 2011).
Table 5Bivariate Correlations Between Yearly Mean Composite Psychological Well-Being (Happinessand Self-Esteem) and Activities and Economic Indicators, Concurrent and Lagged, 8th and 10thGraders, 2006–2016
Activities and indicators
Activity/indicator ¡Well-being 1 year
later Concurrent
Well-being ¡ Activity/indicator 1 year
later
Screen activities and electroniccommunication
Internet hours �.93�� �.95��� �.84��
Reading news online �.83�� �.81�� �.64�
Smartphone adoption �.91�� �.87�� �.72�
TV watching hours .88�� .87�� .83��
Nonscreen activitiesIn-person social interaction (composite
of six activities) .93��� .90�� .78���
Homework hours �.55 �.09 �.06Sports/exercise .43 .81� .82�
Religious services .54 .67� .67�
Have a paid job .71� .67� .50Print media .87�� .88�� .76��
Economic indicatorsUnemployment .16 .28 .42DJIA change .02 �.20 �.15Income inequality �.76�� �.74��� �.55GDP �.94�� �.90�� �.79��
Median household income .15 �.22 �.38College enrollment �.02 �.46 �.43
Note. df is number of years. DJIA � Dow Jones Industrial Average; GDP � gross domestic product.� p � .05. �� p � .01. ��� p � .001.
Thi
sdo
cum
ent
isco
pyri
ghte
dby
the
Am
eric
anPs
ycho
logi
cal
Ass
ocia
tion
oron
eof
itsal
lied
publ
ishe
rs.
Thi
sar
ticle
isin
tend
edso
lely
for
the
pers
onal
use
ofth
ein
divi
dual
user
and
isno
tto
bedi
ssem
inat
edbr
oadl
y.
777DECLINES IN ADOLESCENTS’ WELL-BEING AFTER 2012
Some have speculated that poor psychological well-beingamong recent adolescents is caused primarily by academic pres-sure such as too much homework (Dwyer, 2014). However, 8thand 10th graders who spent more time on homework were actuallyhappier and had higher self-esteem. That makes it unlikely thatincreased homework loads could be responsible for the suddendecrease in adolescents’ psychological well-being after 2012. Inaddition, homework time declined for 8th graders between 2012and 2016 and was steady among 10th and 12th graders, as wastime spent on extracurricular activities (Twenge & Park, 2017).
The abrupt changes in adolescents’ time use and well-beingsuggest a possible generational shift appearing among those bornafter about 1995. If so, the admittedly arbitrary generational group-ing of Millennials (previously thought to be those born 1980–1999) may instead be better demarcated at 1980–1994. If so, a newgeneration—dubbed iGen—now dominates samples of adoles-cents and traditional-age college students (Twenge, 2017). Futureresearch should also examine whether well-being has also declinedamong adults, which might point to a time-period shift rather thana cohort effect. Although adolescents may potentially be moreaffected by the large shift toward electronic communication, adultsmay also be impacted by these trends. Similarly, future researchshould explore whether the decline in well-being appears in othercountries and cultures. Arguably, any culture that also experienced
a sudden rise in screen time via rapid adoption of the smartphonemight see these effects.
In conclusion, adolescents’ psychological well-being suddenlydecreased after 2012, possibly due to their spending more time onelectronic communication and less time on nonscreen activitiessuch as in-person social interaction. The rapid adoption of smart-phone technology in the early 2010s may have had a markednegative impact on adolescents’ psychological well-being.
References
Alter, A. (2017). Irresistible: The rise of addictive technology and thebusiness of keeping us hooked. New York, NY: Penguin Press.
Anderssen, E. (2013, January 21). Why are today’s teenagers feeling soanxious? The Globe and Mail. Retrieved from https://www.theglobeandmail.com/life/health-and-fitness/health/conditions/why-are-todays-teenagers-feeling-so-anxious/article7604612/
Bachman, J. G., O’Malley, P. M., Freedman-Doan, P., Trzesniewski, K. H.,& Donnellan, M. B. (2011). Adolescent self-esteem: Differences byrace/ethnicity, gender, and age. Self and Identity, 10, 445–473. http://dx.doi.org/10.1080/15298861003794538
Barlett, N. D., Gentile, D. A., Barlett, C. P., Eisenmann, J. C., & Walsh,D. A. (2012). Sleep as a mediator of screen time effects on US children’shealth outcomes. Journal of Children and Media, 6, 37–50. http://dx.doi.org/10.1080/17482798.2011.633404
Figure 7. Low psychological well-being among 8th and 10th graders, smartphone adoption in the United Statespopulation, Internet time among 8th and 10th graders, and the national unemployment rate, 2006–2016. No errorbars are given as data are at the group level. Z scores are based on yearly aggregates and thus should not be usedto compute individual-level effect sizes.
Thi
sdo
cum
ent
isco
pyri
ghte
dby
the
Am
eric
anPs
ycho
logi
cal
Ass
ocia
tion
oron
eof
itsal
lied
publ
ishe
rs.
Thi
sar
ticle
isin
tend
edso
lely
for
the
pers
onal
use
ofth
ein
divi
dual
user
and
isno
tto
bedi
ssem
inat
edbr
oadl
y.
778 TWENGE, MARTIN, AND CAMPBELL

Baumeister, R. F., & Leary, M. R. (1995). The need to belong: Desire forinterpersonal attachments as a fundamental human motivation. Psycho-logical Bulletin, 117, 497–529. http://dx.doi.org/10.1037/0033-2909.117.3.497
Best, P., Manktelow, R., & Taylor, B. (2014). Online communication,social media and adolescent wellbeing: A systematic narrative review.Children and Youth Services Review, 41, 27–36. http://dx.doi.org/10.1016/j.childyouth.2014.03.001
Bianchi, E. C. (2016). American individualism rises and falls with theeconomy: Cross-temporal evidence that individualism declines when theeconomy falters. Journal of Personality and Social Psychology, 111,567–584. http://dx.doi.org/10.1037/pspp0000114
Blakemore, S. J. (2012). Development of the social brain in adolescence.Journal of the Royal Society of Medicine, 105, 111–116. http://dx.doi.org/10.1258/jrsm.2011.110221
Boyd, D. (2015). It’s complicated: The social lives of networked teens.New Haven, CT: Yale University Press.
Campbell, W. K., Campbell, S., Siedor, L. E., & Twenge, J. M. (2015).Generational differences are real and useful. Industrial and Organiza-tional Psychology: Perspectives on Science and Practice, 8, 324–331.http://dx.doi.org/10.1017/iop.2015.43
Cooper, B. (2011). Economic recession and mental health: An overview.Neuropsychiatrie: Klinik, Diagnostik, Therapie und Rehabilitation: Or-gan der Gesellschaft Osterreichischer Nervenarzte und Psychiater, 25,113–117.
Davis, K. (2012). Friendship 2.0: Adolescents’ experiences of belongingand self-disclosure online. Journal of Adolescence, 35, 1527–1536.http://dx.doi.org/10.1016/j.adolescence.2012.02.013
DeGusta, M. (2012). Are smart phones spreading faster than any technol-ogy in human history? MIT Technology Review, May, 9, 2012.
Dwyer, L. (2014, October 3). When anxiety hits at school. The Atlantic.Retrieved from https://www.theatlantic.com/health/archive/2014/10/when-anxiety-hits-at-school/380622/
Frasquilho, D., Matos, M. G., Salonna, F., Guerreiro, D., Storti, C. C.,Gaspar, T., & Caldas-de-Almeida, J. M. (2016). Mental health outcomesin times of economic recession: A systematic literature review. BMCPublic Health, 16, 115. http://dx.doi.org/10.1186/s12889-016-2720-y
Gentile, B., Twenge, J. M., & Campbell, W. K. (2010). Birth cohortdifferences in self-esteem, 1988–2008: A cross-temporal meta-analysis.Review of General Psychology, 14, 261–268. http://dx.doi.org/10.1037/a0019919
Granger, C. W. (1969). Investigating causal relations by econometricmodels and cross-spectral methods. Econometrica, 37, 424–438. http://dx.doi.org/10.2307/1912791
Grossmann, I., & Varnum, M. E. (2015). Social structure, infectiousdiseases, disasters, secularism, and cultural change in America. Psycho-logical Science, 26, 311–324. http://dx.doi.org/10.1177/0956797614563765
Huang, C. (2017). Time spent on social network sites and psychologicalwell-being: A meta-analysis. Cyberpsychology, Behavior and SocialNetworking, 20, 346–354. http://dx.doi.org/10.1089/cyber.2016.0758
Hysing, M., Pallesen, S., Stormark, K. M., Jakobsen, R., Lundervold, A. J.,& Sivertsen, B. (2015). Sleep and use of electronic devices in adoles-cence: Results from a large population-based study. British MedicalJournal Open, 5, e006748 – e006748. http://dx.doi.org/10.1136/bmjopen-2014-006748
Jelenchick, L. A., Eickhoff, J. C., & Moreno, M. A. (2013). “Facebookdepression?” social networking site use and depression in older adoles-cents. Journal of Adolescent Health, 52, 128–130. http://dx.doi.org/10.1016/j.jadohealth.2012.05.008
Johnston, L. D., Bachman, J. G., O’Malley, P. M., Schulenberg, J. E., &Miech, R. A. (2017). Monitoring the Future: A continuing study ofAmerican youth (12th grade surveys; 8th- and 10th-grade surveys),
2016. ICPSR36799-v1 (pp. 10–26). Ann Arbor, MI: Inter-universityConsortium for Political and Social Research.
Kalmbach, D. A., Pillai, V., Roth, T., & Drake, C. L. (2014). The interplaybetween daily affect and sleep: A 2-week study of young women.Journal of Sleep Research, 23, 636–645. http://dx.doi.org/10.1111/jsr.12190
Kingkade, T. (2016, January 13). The number of college students seekingmental health treatment is growing rapidly. Huffington Post. Retrievedfrom https://www.huffingtonpost.com/entry/college-students-mental-health-treatment_us_5696a1dde4b0ce496422e8f1
Konrath, S. H., O’Brien, E. H., & Hsing, C. (2011). Changes in disposi-tional empathy in American college students over time: A meta-analysis.Personality and Social Psychology Review, 15, 180–198. http://dx.doi.org/10.1177/1088868310377395
Kross, E., Verduyn, P., Demiralp, E., Park, J., Lee, D. S., Lin, N., . . .Ybarra, O. (2013). Facebook use predicts declines in subjective well-being in young adults. PLoS ONE, 8, e69841. http://dx.doi.org/10.1371/journal.pone.0069841
Leckelt, M., Back, M. D., Foster, J. D., Hutteman, R., Jaeger, G., McCain,J., . . . Campbell, W. K. (2016). Entering adulthood in a recessiontempers later narcissism—But only in men. Journal of Research inPersonality, 60, 8–11. http://dx.doi.org/10.1016/j.jrp.2015.10.006
Lenhart, A. (2015). Teens, social media, and technology overview 2015.Washington, DC: Pew Research Center.
Lieberman, M. D. (2014). Social: Why our brains are wired to connect.New York, NY: Broadway Books.
Markus, H. R., & Kitayama, S. (2010). Cultures and selves: A cycle ofmutual constitution. Perspectives on Psychological Science, 5, 420–430.
McLoyd, V. C., Jayaratne, T. E., Ceballo, R., & Borquez, J. (1994).Unemployment and work interruption among African American singlemothers: Effects on parenting and adolescent socioemotional function-ing. Child Development, 65, 562–589. http://dx.doi.org/10.2307/1131402
Noguchi, S. (2014, February 5). Teen health: Depression, anxiety andsocial phobias rising in kids, educators say. San Jose Mercury News.Retrieved from http://www.mercurynews.com/2014/02/05/teen-health-depression-anxiety-and-social-phobias-rising-in-kids-educators-say/
Oishi, S., Graham, J., Kesebir, S., & Galinha, I. C. (2013). Concepts ofhappiness across time and cultures. Personality and Social PsychologyBulletin, 39, 559–577. http://dx.doi.org/10.1177/0146167213480042
Oishi, S., Kesebir, S., & Diener, E. (2011). Income inequality and happi-ness. Psychological Science, 22, 1095–1100. http://dx.doi.org/10.1177/0956797611417262
Pea, R., Nass, C., Meheula, L., Rance, M., Kumar, A., Bamford, H., . . .Zhou, M. (2012). Media use, face-to-face communication, media mul-titasking, and social well-being among 8- to 12-year-old girls. Develop-mental Psychology, 48, 327–336. http://dx.doi.org/10.1037/a0027030
Przybylski, A. K., & Weinstein, N. (2017). A large-scale test of theGoldilocks hypothesis. Psychological Science, 28, 204–215. http://dx.doi.org/10.1177/0956797616678438
Rosenberg, M. (1965). Society and the adolescent self-image. Middletown,CT: Wesleyan University Press.
Ryff, C. D., & Keyes, C. L. M. (1995). The structure of psychologicalwell-being revisited. Journal of Personality and Social Psychology, 69,719–727. http://dx.doi.org/10.1037/0022-3514.69.4.719
Schaie, K. W. (1965). A general model for the study of developmentalproblems. Psychological Bulletin, 64, 92–107. http://dx.doi.org/10.1037/h0022371
Shakya, H. B., & Christakis, N. A. (2017). Association of Facebook usewith compromised well-being: A longitudinal study. American Journalof Epidemiology, 185, 203–211.
Thi
sdo
cum
ent
isco
pyri
ghte
dby
the
Am
eric
anPs
ycho
logi
cal
Ass
ocia
tion
oron
eof
itsal
lied
publ
ishe
rs.
Thi
sar
ticle
isin
tend
edso
lely
for
the
pers
onal
use
ofth
ein
divi
dual
user
and
isno
tto
bedi
ssem
inat
edbr
oadl
y.
779DECLINES IN ADOLESCENTS’ WELL-BEING AFTER 2012

Shedler, J., & Block, J. (1990). Adolescent drug use and psychologicalhealth. A longitudinal inquiry. American Psychologist, 45, 612–630.http://dx.doi.org/10.1037/0003-066X.45.5.612
Smith, A. (2017, January 12). Record shares of Americans now ownsmartphones, have home broadband. Retrieved from Pew ResearchCenter website: http://www.pewresearch.org/fact-tank/2017/01/12/evolution-of-technology/
Stewart, A. J., & Healy, J. M. (1989). Linking individual development andsocial changes. American Psychologist, 44, 30–42. http://dx.doi.org/10.1037/0003-066X.44.1.30
Tafarodi, R. W., & Milne, A. B. (2002). Decomposing global self-esteem.Journal of Personality, 70, 443–484. http://dx.doi.org/10.1111/1467-6494.05017
Tromholt, M. (2016). The Facebook experiment: Quitting Facebook leadsto higher levels of well-being. Cyberpsychology, Behavior and SocialNetworking, 19, 661–666. http://dx.doi.org/10.1089/cyber.2016.0259
Twenge, J. M. (2017). iGen: Why today’s super-connected kids are grow-ing up less rebellious, more tolerant, less happy—and completely un-prepared for adulthood. New York, NY: Atria Books.
Twenge, J. M., & Campbell, W. K. (2008). Increases in positive self-viewsamong high school students: Birth-cohort changes in anticipated perfor-mance, self-satisfaction, self-liking, and self-competence. PsychologicalScience, 19, 1082–1086. http://dx.doi.org/10.1111/j.1467-9280.2008.02204.x
Twenge, J. M., Campbell, W. K., & Carter, N. T. (2014). Declines in trustin others and confidence in institutions among American adults and lateadolescents, 1972–2012. Psychological Science, 25, 1914–1923. http://dx.doi.org/10.1177/0956797614545133
Twenge, J. M., Campbell, W. K., & Carter, N. T. (2017). Age, time period,and birth cohort differences in self-esteem: Reexamining a cohort-sequential longitudinal study. Journal of Personality and Social Psy-chology, 112, e9–e17. http://dx.doi.org/10.1037/pspp0000122
Twenge, J. M., & Foster, J. D. (2010). Birth cohort increases in narcissisticpersonality traits among American college students, 1982–2009. SocialPsychological and Personality Science, 1, 99–106. http://dx.doi.org/10.1177/1948550609355719
Twenge, J. M., Krizan, Z., & Hisler, G. (2017). Decreases in self-reportedsleep duration among U.S. adolescents 2009–2015 and association with
links to new media screen time. Sleep Medicine, 39, 47–53. http://dx.doi.org/10.1016/j.sleep.2017.08.013
Twenge, J. M., & Park, H. (2017). The decline in adult activities amongU.S. adolescents, 1976–2016. Child Development. Advance online pub-lication. http://dx.doi.org/10.1111/cdev.12930
Twenge, J. M., Sherman, R. A., & Lyubomirsky, S. (2016). More happi-ness for young people and less for mature adults: Time period differ-ences in subjective well-being in the United States, 1972–2014. SocialPsychological and Personality Science, 7, 131–141. http://dx.doi.org/10.1177/1948550615602933
Twenge, J. M., Sherman, R. A., & Wells, B. E. (2017). Sexual inactivityduring young adulthood is more common among U.S. Millennials andiGen: Age, period, and cohort effects on having no sexual partners afterage 18. Archives of Sexual Behavior, 46, 433–440. http://dx.doi.org/10.1007/s10508-016-0798-z
Twenge, J. M., & Uhls, Y. T. (2017). Less in-person social interactionamong U.S. adolescents in the 21st century and links to loneliness.Manuscript submitted for publication.
Valkenburg, P. M., Peter, J., & Schouten, A. P. (2006). Friend networkingsites and their relationship to adolescents’ well-being and social self-esteem. CyberPsychology & Behavior, 9, 584–590. http://dx.doi.org/10.1089/cpb.2006.9.584
Varnum, M. E. W., & Grossmann, I. (2016). Pathogen prevalence isassociated with cultural changes in gender equality. Nature HumanBehaviour, 1, 0003. http://dx.doi.org/10.1038/s41562-016-0003
Varnum, M. E. W., & Grossmann, I. (2017). Cultural change: The how andthe why. Perspectives on Psychological Science, 12, 956–972. http://dx.doi.org/10.1177/1745691617699971
Wegman, L. A., Hoffman, B. J., Carter, N. T., Twenge, J. M., & Guenole,N. (2017). Placing job characteristics in context: Cross-temporal meta-analysis of changes in job characteristics since 1975. Journal of Man-agement. Advance online publication. http://dx.doi.org/10.1177/0149206316654545
Received June 30, 2017Revision received November 13, 2017
Accepted November 16, 2017 �
Thi
sdo
cum
ent
isco
pyri
ghte
dby
the
Am
eric
anPs
ycho
logi
cal
Ass
ocia
tion
oron
eof
itsal
lied
publ
ishe
rs.
Thi
sar
ticle
isin
tend
edso
lely
for
the
pers
onal
use
ofth
ein
divi
dual
user
and
isno
tto
bedi
ssem
inat
edbr
oadl
y.
780 TWENGE, MARTIN, AND CAMPBELL