decoupling control loops - expertune · 1 decoupling control loops using expertune software theory,...
TRANSCRIPT
1
Decoupling control loops using ExperTune software
Theory, diagnosis, and practical considerations
Bernardo Soares Torres, M.Sc. (ATAN)Lívia Camargos R. de Oliveira (ATAN)
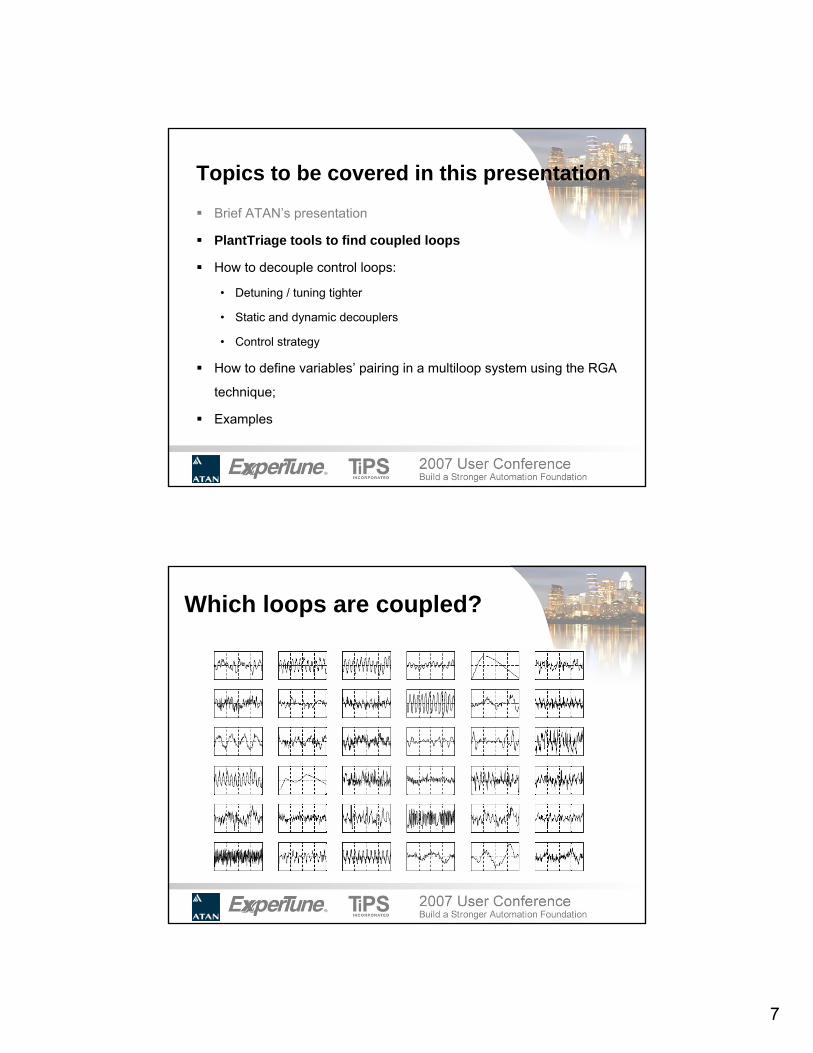
Topics to be covered in this presentation
Brief ATAN’s presentation
PlantTriage tools to find coupled loops
How to decouple control loops:
• Detuning / tuning tighter
• Static and dynamic decouplers
• Control strategy
How to define variables’ pairing in a multiloop system using the RGA
technique;
Examples
2
9290-103-25 (Rev.:003) 3
+ Mission
+ Business Profile
+ History
+ CompetitiveAdvantages
+ Partnership
+ Metric
+ MarketSegments
+ AT
+ CustomersGeographic Distribution
+ IT
+ SpecialSolutions
ATAN´s PRESENTATION
9290-103-25 (Rev.:003) 4
+ Mission
+ Business Profile
+ History
+ CompetitiveAdvantages
+ Partnership
+ Metric
+ MarketSegments
+ AT
+ CustomersGeographic Distribution
+ IT
+ SpecialSolutions
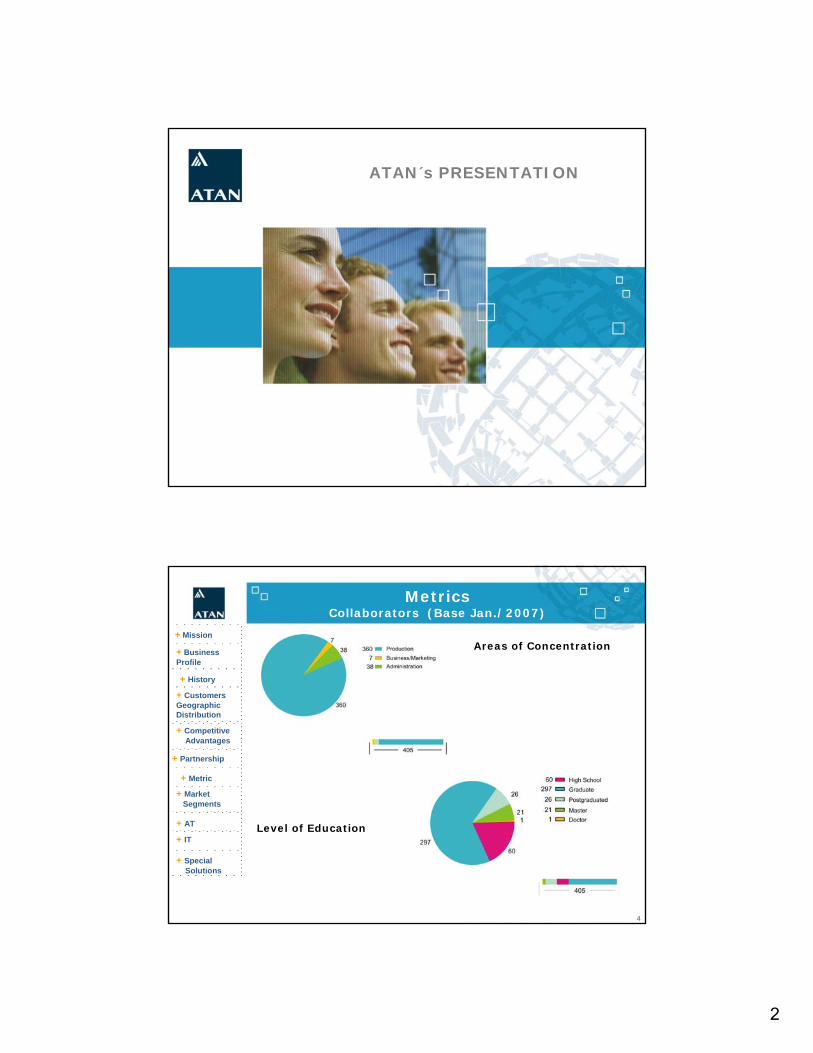
MetricsCollaborators (Base Jan./2007)
Areas of Concentration
Level of Education
3
9290-103-25 (Rev.:003) 5
+ Mission
+ Business Profile
+ History
+ CompetitiveAdvantages
+ Partnership
+ Metric
+ MarketSegments
+ AT
+ CustomersGeographic Distribution
+ IT
+ SpecialSolutions
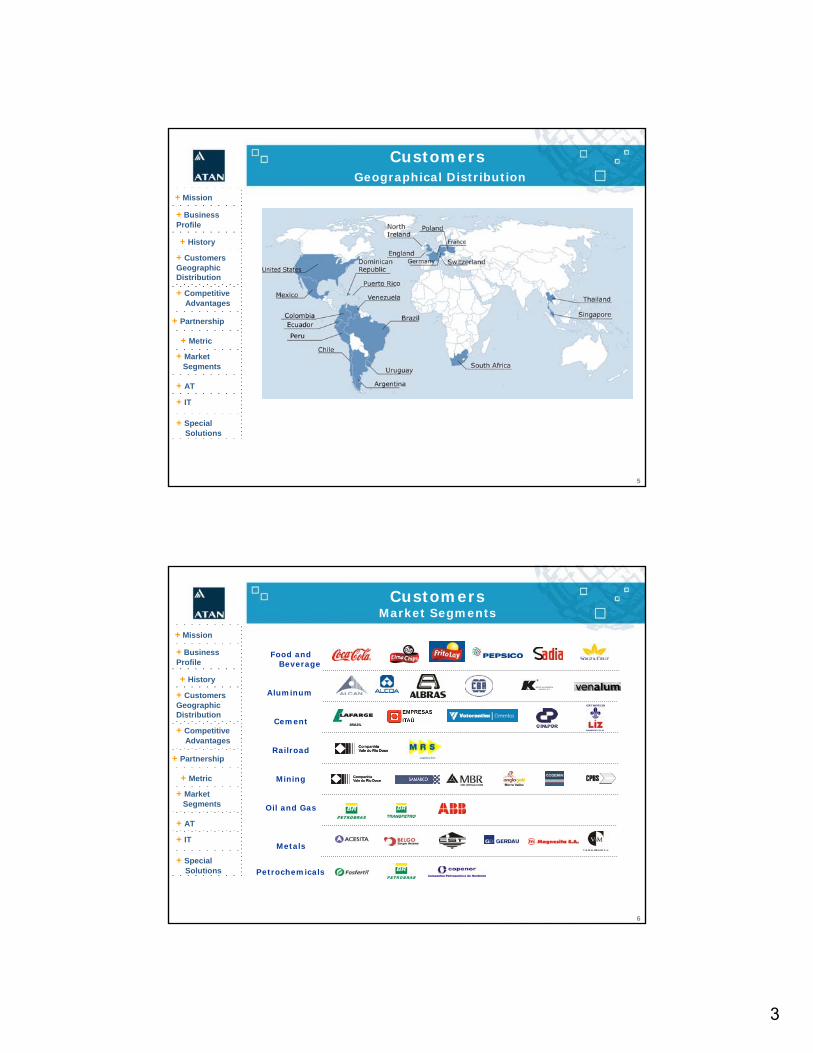
Customers Geographical Distribution
9290-103-25 (Rev.:003) 6
+ Mission
+ Business Profile
+ History
+ CompetitiveAdvantages
+ Partnership
+ Metric
+ MarketSegments
+ AT
+ CustomersGeographic Distribution
+ IT
+ SpecialSolutions
Customers Market Segments
Food and Beverage
Aluminum
Cement
Railroad
Mining
Oil and Gas
Metals
Petrochemicals

4
9290-103-25 (Rev.:003) 7
+ Mission
+ Business Profile
+ History
+ CompetitiveAdvantages
+ Partnership
+ Metric
+ MarketSegments
+ AT
+ CustomersGeographic Distribution
+ IT
+ SpecialSolutions
Business
Automation TechnologyAutomation Technology
Information TechnologyInformation Technology
Special SolutionsSpecial Solutions
9290-103-25 (Rev.:003) 8
+ Mission
+ Business Profile
+ History
+ CompetitiveAdvantages
+ Partnership
+ Metric
+ MarketSegments
+ AT
+ CustomersGeographic Distribution
+ IT
+ SpecialSolutions
Automation TechnologyIndustrial Automation
INSTRUMENTATION, CONTROL E SUPERVISION IN ON SHORE E OFF SHORE Environments(focus in turn-key project)
Systems specification and configuration (SCADA/PLC, UTR, DCS, radio frequency, data communication, etc.)
Communication drivers development
Start up and commissioning
Training
Technical assistance
5
9290-103-25 (Rev.:003) 9
+ Mission
+ Business Profile
+ History
+ CompetitiveAdvantages
+ Partnership
+ Metric
+ MarketSegments
+ AT
+ CustomersGeographic Distribution
+ IT
+ SpecialSolutions
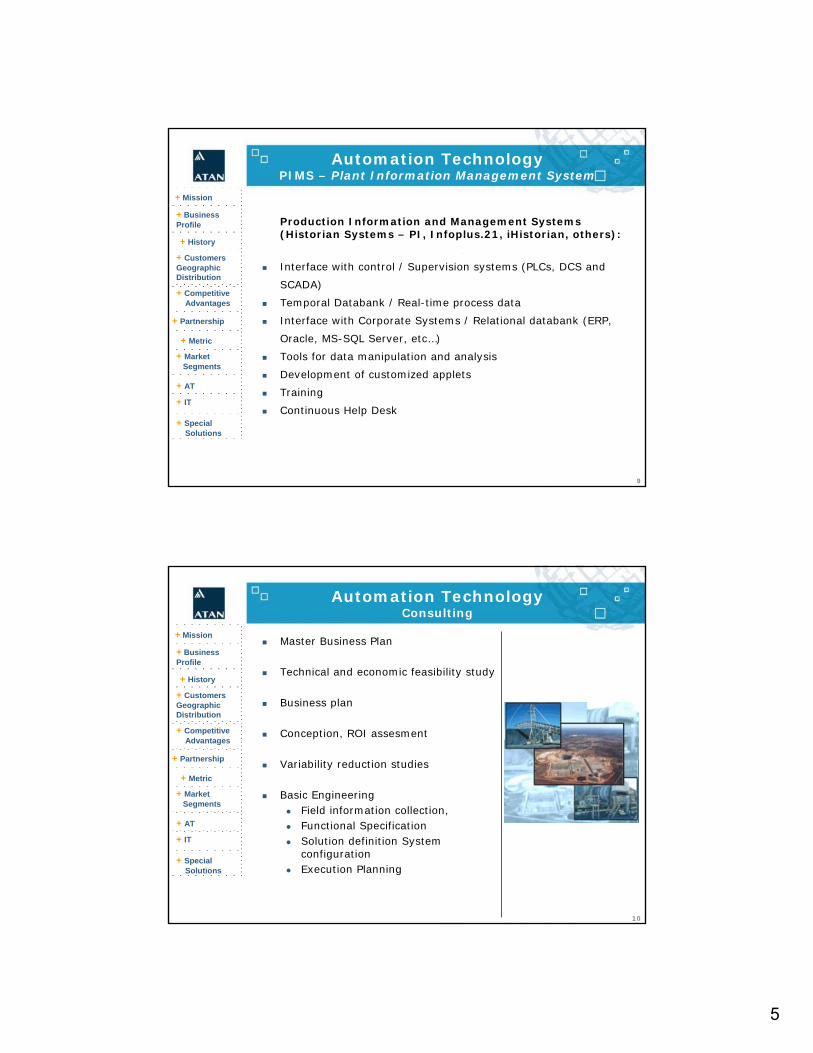
Automation Technology PIMS – Plant Information Management System
Production Information and Management Systems (Historian Systems – PI, Infoplus.21, iHistorian, others):
Interface with control / Supervision systems (PLCs, DCS and
SCADA)
Temporal Databank / Real-time process data
Interface with Corporate Systems / Relational databank (ERP,
Oracle, MS-SQL Server, etc…)
Tools for data manipulation and analysis
Development of customized applets
Training
Continuous Help Desk
9290-103-25 (Rev.:003) 10
+ Mission
+ Business Profile
+ History
+ CompetitiveAdvantages
+ Partnership
+ Metric
+ MarketSegments
+ AT
+ CustomersGeographic Distribution
+ IT
+ SpecialSolutions
Automation Technology Consulting
Master Business Plan
Technical and economic feasibility study
Business plan
Conception, ROI assesment
Variability reduction studies
Basic EngineeringField information collection, Functional SpecificationSolution definition System configurationExecution Planning
6
9290-103-25 (Rev.:003) 11
+ Mission
+ Business Profile
+ History
+ CompetitiveAdvantages
+ Partnership
+ Metric
+ MarketSegments
+ AT
+ CustomersGeographic Distribution
+ IT
+ SpecialSolutions
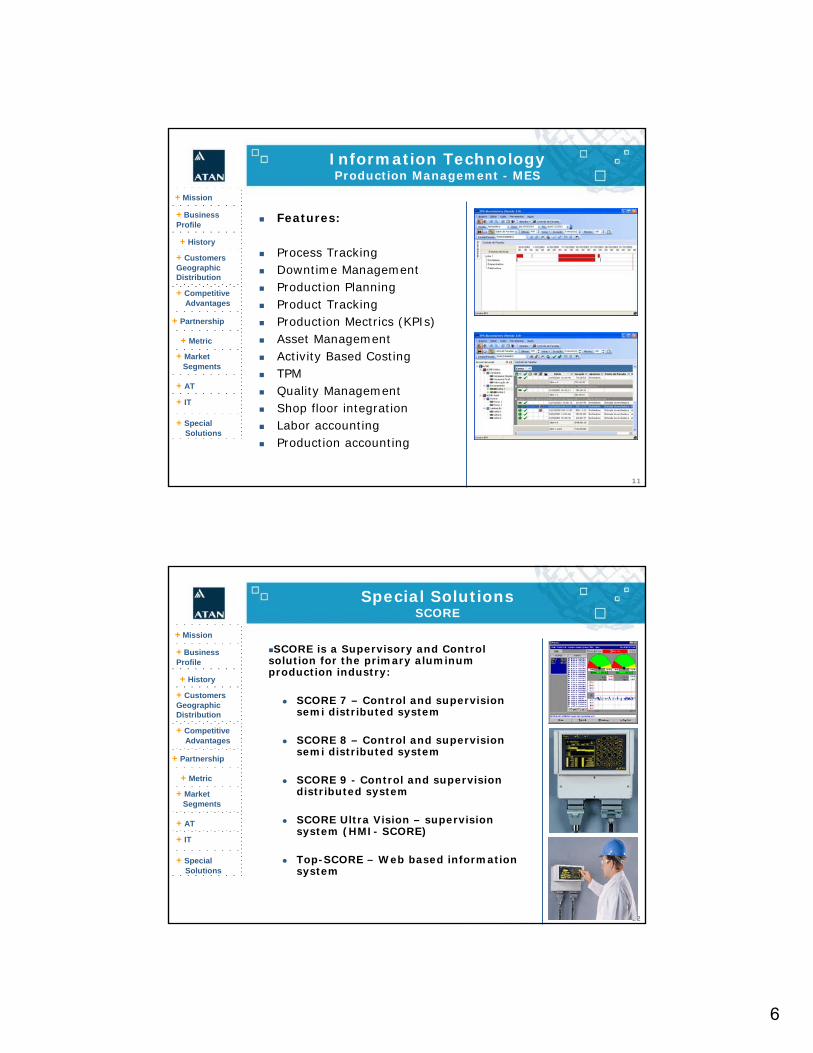
Information TechnologyProduction Management - MES
Features:
Process TrackingDowntime ManagementProduction PlanningProduct TrackingProduction Mectrics (KPIs)Asset ManagementActivity Based CostingTPMQuality ManagementShop floor integrationLabor accountingProduction accounting
9290-103-25 (Rev.:003) 12
+ Mission
+ Business Profile
+ History
+ CompetitiveAdvantages
+ Partnership
+ Metric
+ MarketSegments
+ AT
+ CustomersGeographic Distribution
+ IT
+ SpecialSolutions
Special SolutionsSCORE
SCORE is a Supervisory and Control solution for the primary aluminum production industry:
SCORE 7 – Control and supervision semi distributed system
SCORE 8 – Control and supervision semi distributed system
SCORE 9 - Control and supervision distributed system
SCORE Ultra Vision – supervision system (HMI- SCORE)
Top-SCORE – Web based information system
7
Topics to be covered in this presentation
Brief ATAN’s presentation
PlantTriage tools to find coupled loops
How to decouple control loops:
• Detuning / tuning tighter
• Static and dynamic decouplers
• Control strategy
How to define variables’ pairing in a multiloop system using the RGA
technique;
Examples
Which loops are coupled?
8
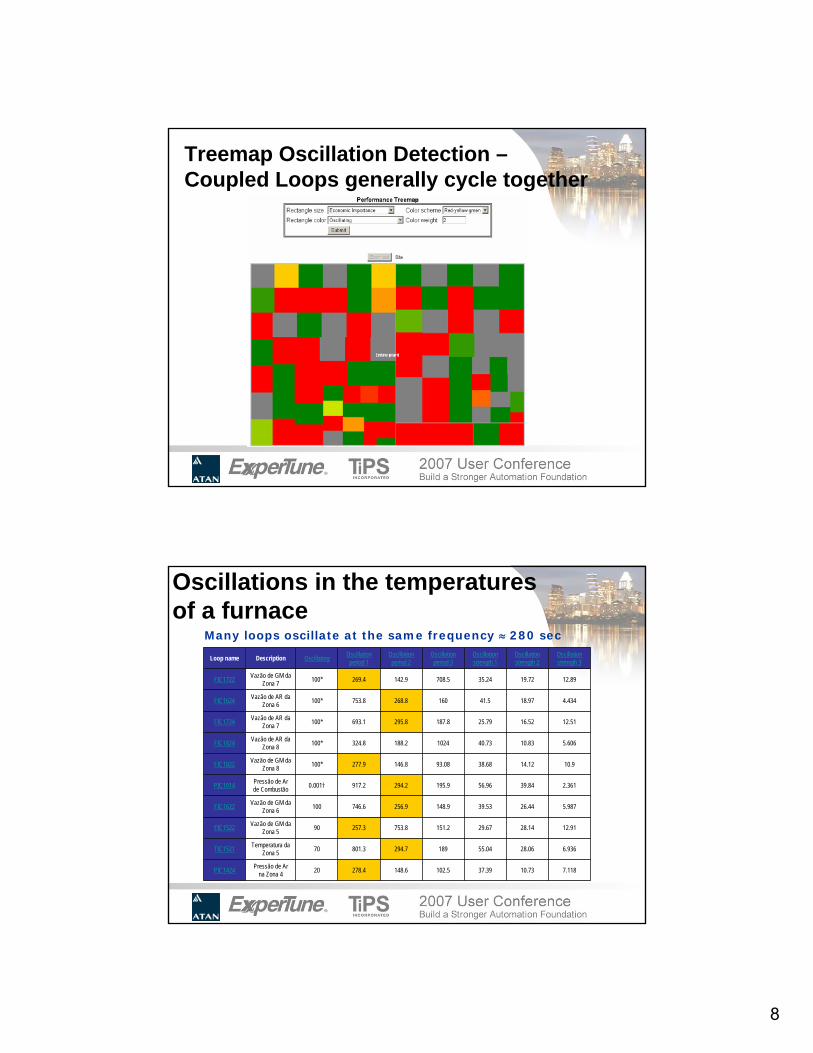
Treemap Oscillation Detection –Coupled Loops generally cycle together
7.11810.7337.39102.5148.6278.420Pressão de Ar na Zona 4PIC1424
6.93628.0655.04189294.7801.370Temperatura da Zona 5TIC1521
12.9128.1429.67151.2753.8257.390Vazão de GM da Zona 5FIC1522
5.98726.4439.53148.9256.9746.6100Vazão de GM da Zona 6FIC1622
2.36139.8456.96195.9294.2917.20.001†Pressão de Ar de CombustãoPIC1014
10.914.1238.6893.08146.8277.9100*Vazão de GM da Zona 8FIC1822
5.60610.8340.731024188.2324.8100*Vazão de AR da Zona 8FIC1824
12.5116.5225.79187.8295.8693.1100*Vazão de AR da Zona 7FIC1724
4.43418.9741.5160268.8753.8100*Vazão de AR da Zona 6FIC1624
12.8919.7235.24708.5142.9269.4100*Vazão de GM da Zona 7FIC1722
Oscillation strength 3
Oscillation strength 2
Oscillation strength 1
Oscillation period 3
Oscillation period 2
Oscillation period 1OscillatingDescriptionLoop name
Many loops oscillate at the same frequency ≈ 280 sec
Oscillations in the temperatures of a furnace

9
Finding possible couplings with PlantTriage Process Interaction Mapping
Process Interaction Mapping diagnosis: No coupled loops (Metallurgical Furnace)

10
Simple strategy to decouple control loops: detune the controller
Making the tuning of a loop more conservative by changing the PID parameters – robustness change.
Kp Ti
Example 1 – Decoupling level and temperature loops
Kp Ti
Detuning a level loop reduces oscillation in a temperature loop
11
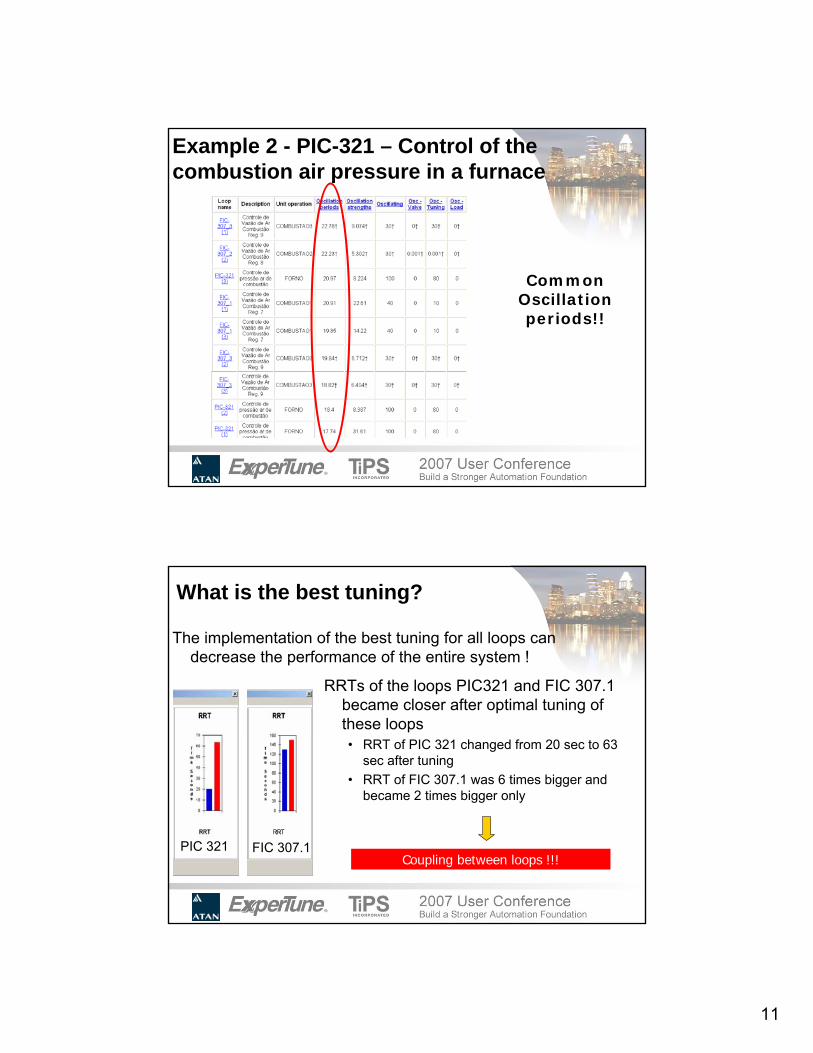
Example 2 - PIC-321 – Control of the combustion air pressure in a furnace
Common Oscillation periods!!
What is the best tuning?
PIC 321 FIC 307.1
RRTs of the loops PIC321 and FIC 307.1 became closer after optimal tuning of these loops• RRT of PIC 321 changed from 20 sec to 63
sec after tuning• RRT of FIC 307.1 was 6 times bigger and
became 2 times bigger only
Coupling between loops !!!
The implementation of the best tuning for all loops can decrease the performance of the entire system !

12
PIC-321Tuning synchronism - RRT
FIC 307.1
RRT of the loop PIC321 became 3 times smaller than that of FIC 307.1
The loops were tuned again to adjust the RRTs and reduce the coupling.
PIC 321
Decoupled Loops
Spectral AnalysisPIC-321 x FIC 307.1
Before
FIC-307.1Spectra of PIC-321
and FIC-307.1 became different
PIC-321 Coupling removed !!!!!!!
After
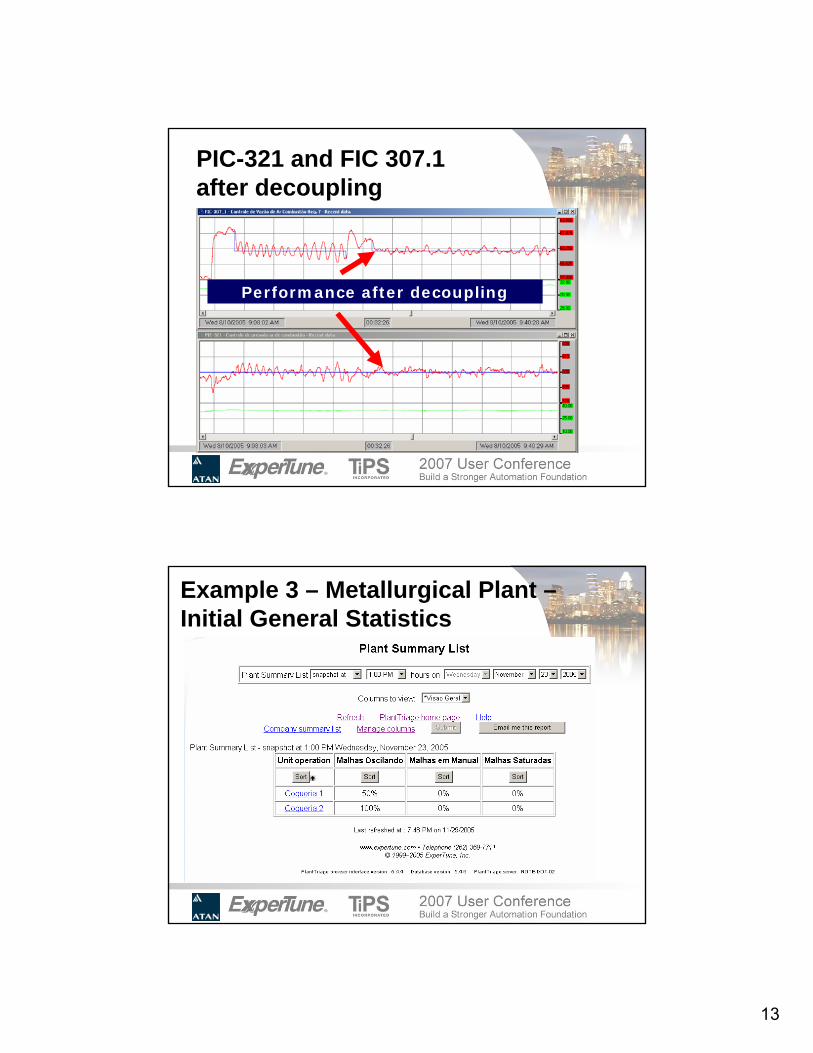
13
PIC-321 and FIC 307.1 after decoupling
Performance after decoupling
Example 3 – Metallurgical Plant –Initial General Statistics
14
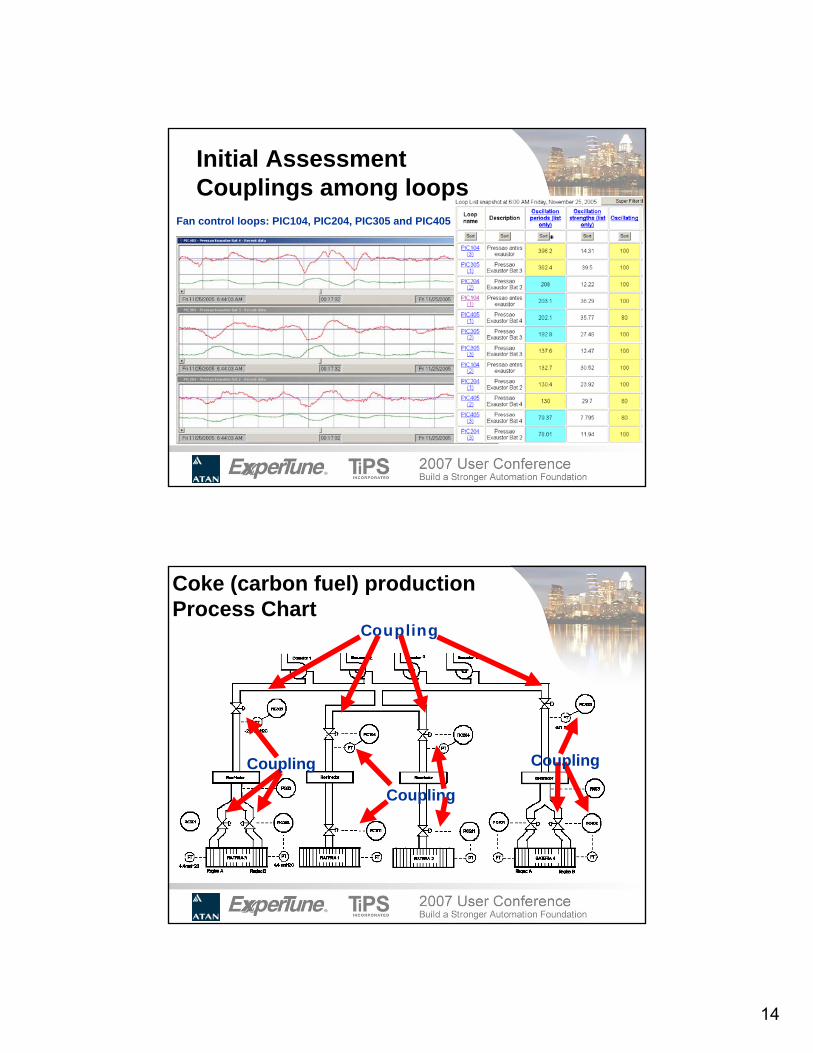
Initial AssessmentCouplings among loops
Fan control loops: PIC104, PIC204, PIC305 and PIC405
Coke (carbon fuel) production Process Chart
Coupling Coupling
Coupling
Coupling

15
Is making the tuning more agressive a good way to decouple loops?
PIC104
PIC101
Strategy for tuning: RRT is the key !!!
Goals:
PIC104 Relative Response Time at least 3 times bigger
Steps of the job:
Tests for process identificationAdjustment of the Relative
Response Time (RRT)
16
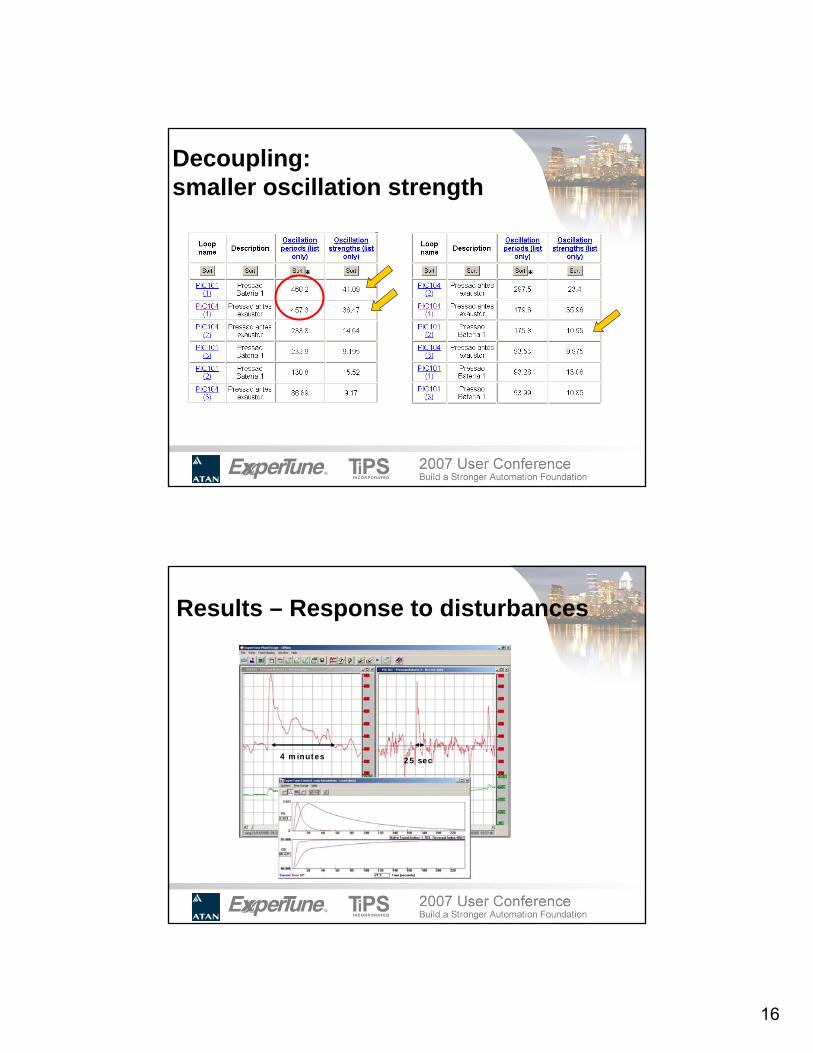
Decoupling: smaller oscillation strength
Results – Response to disturbances
4 minutes 25 sec

17
PlantTriage Assessments
Final AssessmentGeneral Statistics
Before
After

18
Decoupling loops based on tuningChange tuning (robustness) of the coupled loops in order to have RRT (Relative Response time) as far as possible from each other (at least 3 times).
PIC104
PIC101
Decoupling
However, in some cases, detuning can really harm the performance of the detuned loop to unacceptable levels.
Alternative solution
Decouplers design and implementation

19
Decouplers DesignMIMO System
Level and temperature of a tank
Types of decouplers1. Dynamic
)()()(
22
2121 sGp
sGpsD −=
2. Static (simpler)
22
2121 Kp
KpD −=
MIMO SystemLevel and temperature of a tank
20
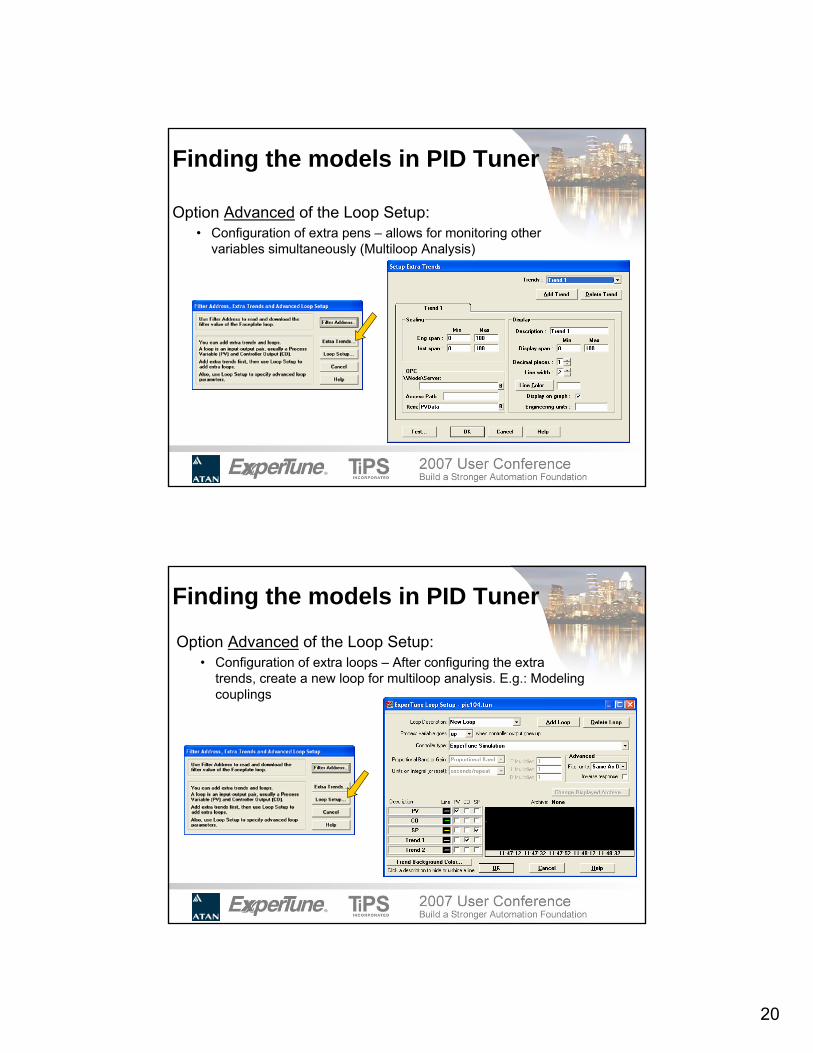
Option Advanced of the Loop Setup:• Configuration of extra pens – allows for monitoring other
variables simultaneously (Multiloop Analysis)
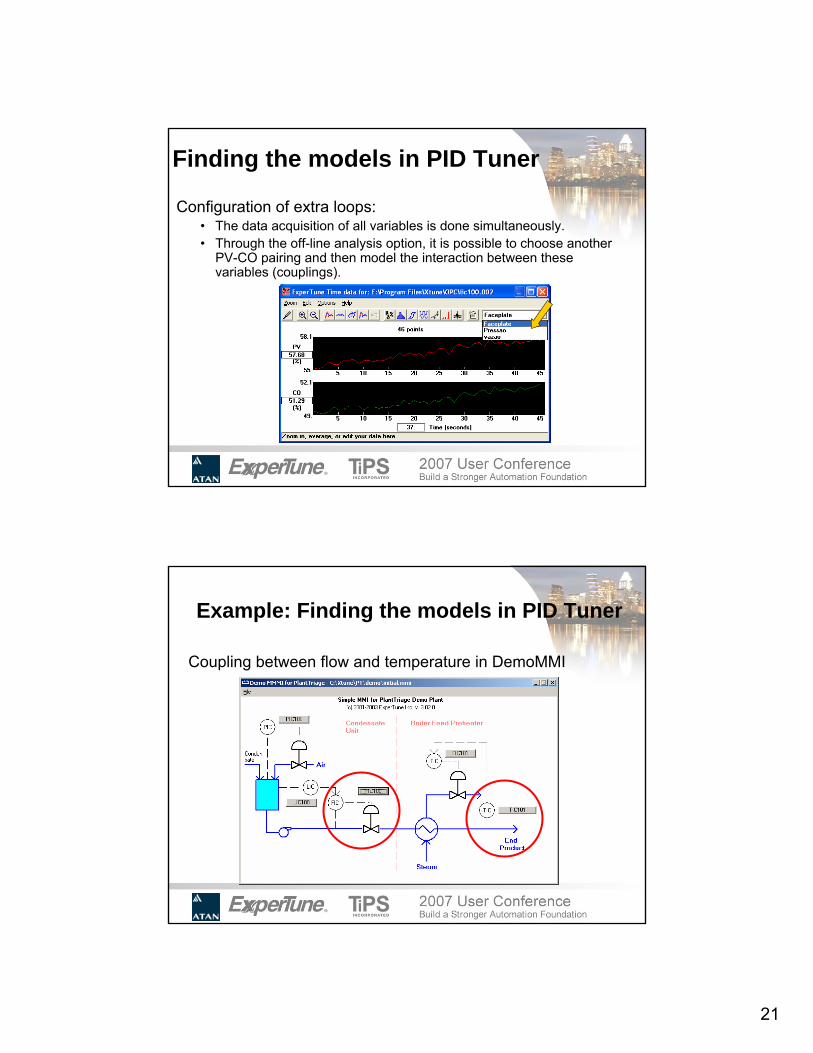
Finding the models in PID Tuner
Option Advanced of the Loop Setup:• Configuration of extra loops – After configuring the extra
trends, create a new loop for multiloop analysis. E.g.: Modelingcouplings
Finding the models in PID Tuner
21
Configuration of extra loops:• The data acquisition of all variables is done simultaneously.• Through the off-line analysis option, it is possible to choose another
PV-CO pairing and then model the interaction between these variables (couplings).
Finding the models in PID Tuner
Example: Finding the models in PID Tuner
Coupling between flow and temperature in DemoMMI
22
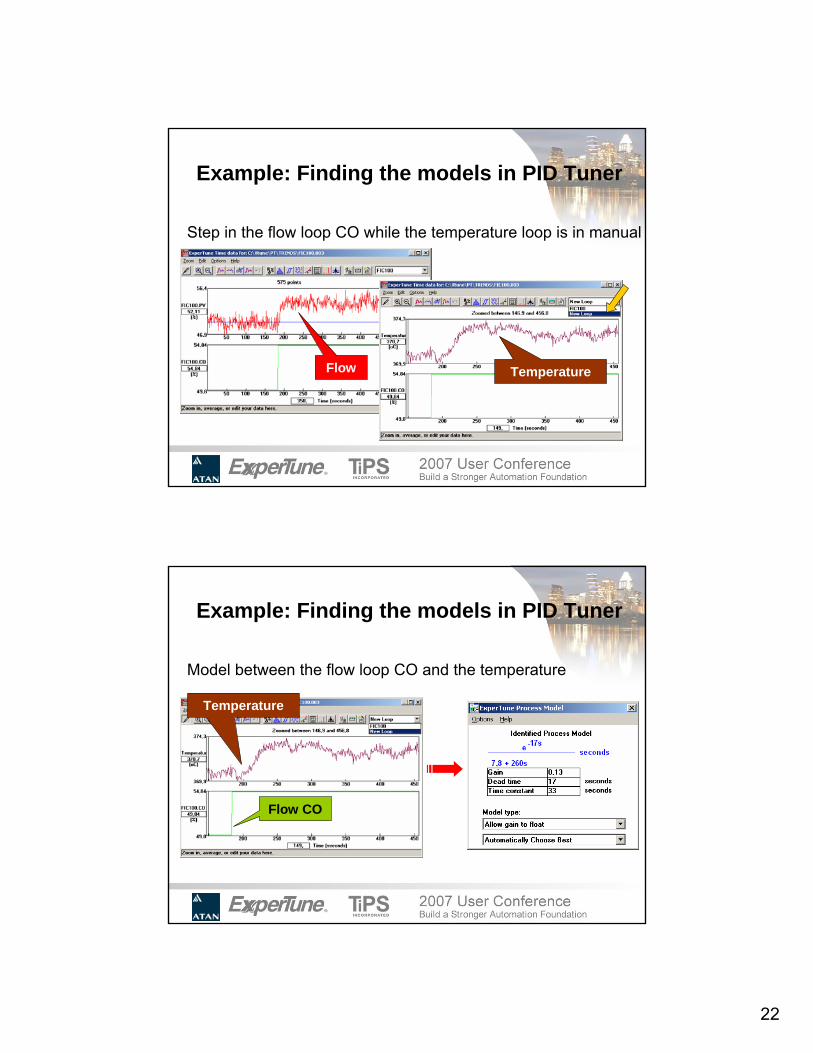
Example: Finding the models in PID Tuner
Step in the flow loop CO while the temperature loop is in manual
TemperatureFlow
Example: Finding the models in PID Tuner
Temperature
Model between the flow loop CO and the temperature
Flow CO

23
Example: 5x5 multiloop system
Block Diagram
Decoupling - exampleMatrix of the system’s transfer functions with the
relevant interactions
⎥⎥⎥⎥⎥⎥⎥⎥⎥⎥⎥⎥⎥⎥⎥
⎦
⎤
⎢⎢⎢⎢⎢⎢⎢⎢⎢⎢⎢⎢⎢⎢⎢
⎣
⎡
+−
+−
+−
++−
−
−−
−−
−−−
−
1489590.00
115407.000
1692185.0
1175175.00
185124.00
0030.0192.000
0025.0016.0110.0180.0
0000210.1
495
2002831
6
se
se
se
se
se
ss
ssss
e
ss
sss
s
TF =
24
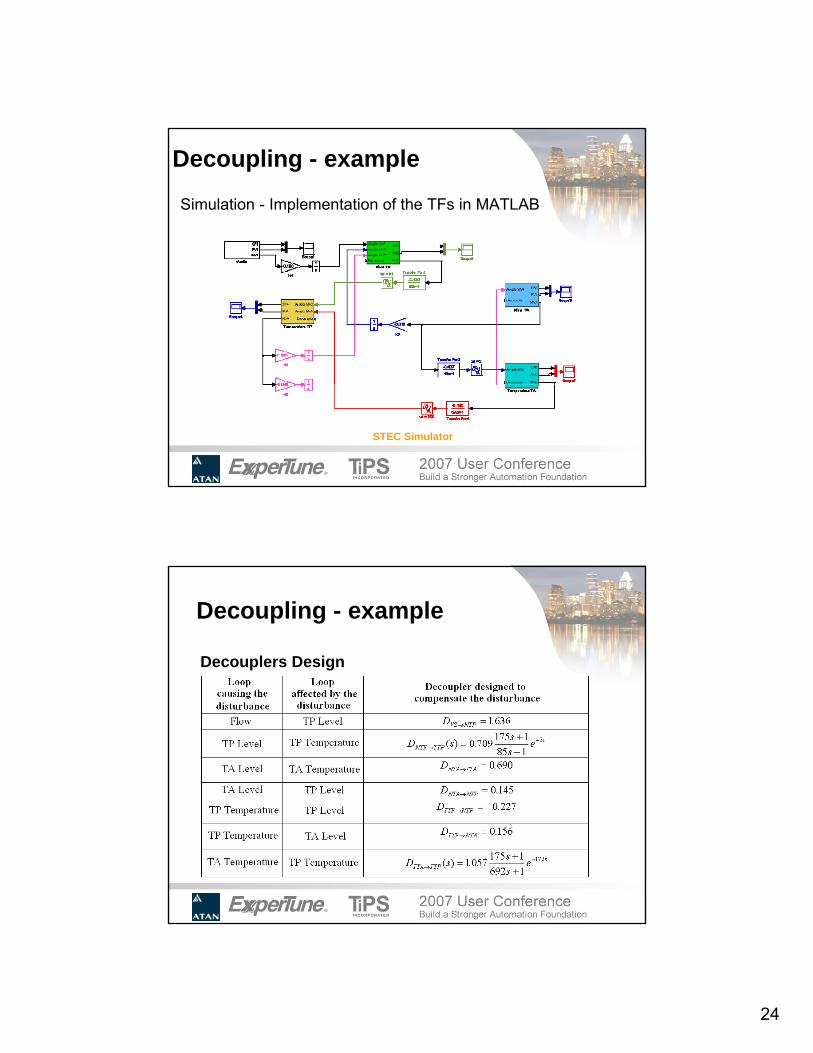
Decoupling - example
Simulation - Implementation of the TFs in MATLAB
STEC Simulator
Decoupling - example
Decouplers Design
25
Decoupling - example
The only decoupler for this system that is not feasible was:
s
s
s
TTANTA ess
es
essD 44
49
5
1151489690.0
1489590.0
115407.0
)(++
=
+
+=−
−
→
690.0)( =→ sD TTANTA
Hence, the following was adopted instead
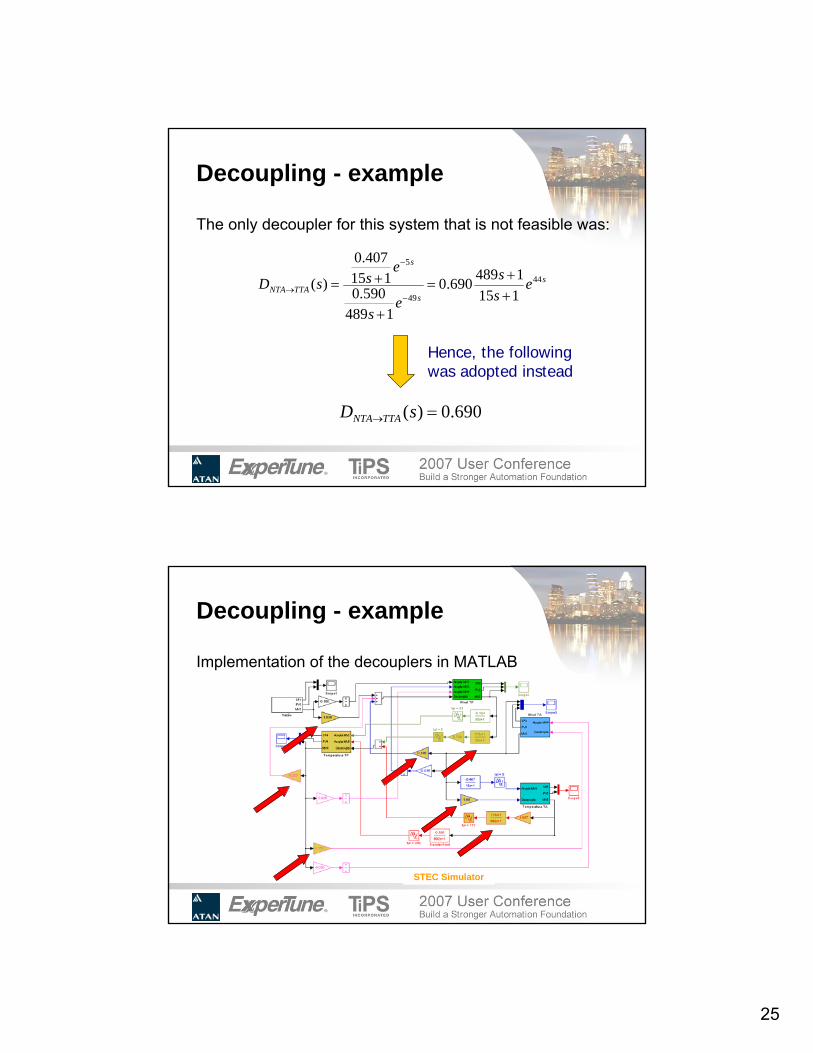
Decoupling - example
Implementation of the decouplers in MATLAB
STEC Simulator
26
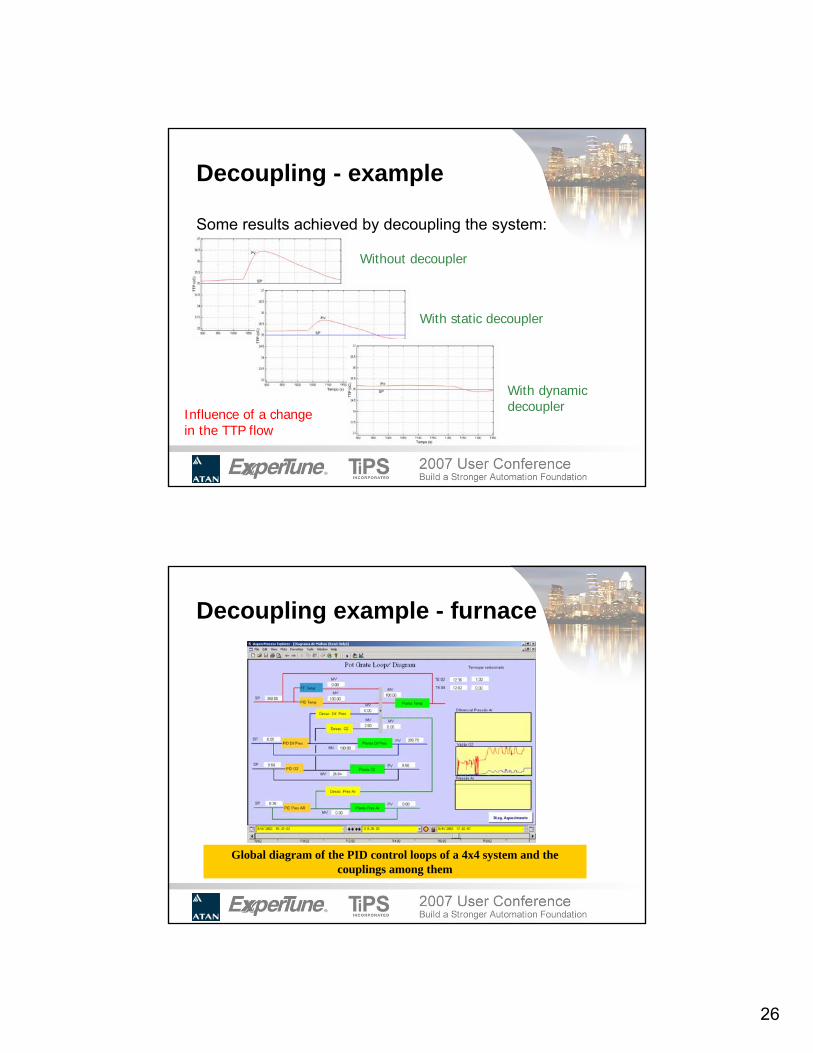
Decoupling - example
Some results achieved by decoupling the system:
Influence of a change in the TTP flow
Without decoupler
With static decoupler
With dynamic decoupler
Decoupling example - furnace
Global diagram of the PID control loops of a 4x4 system and the couplings among them
27
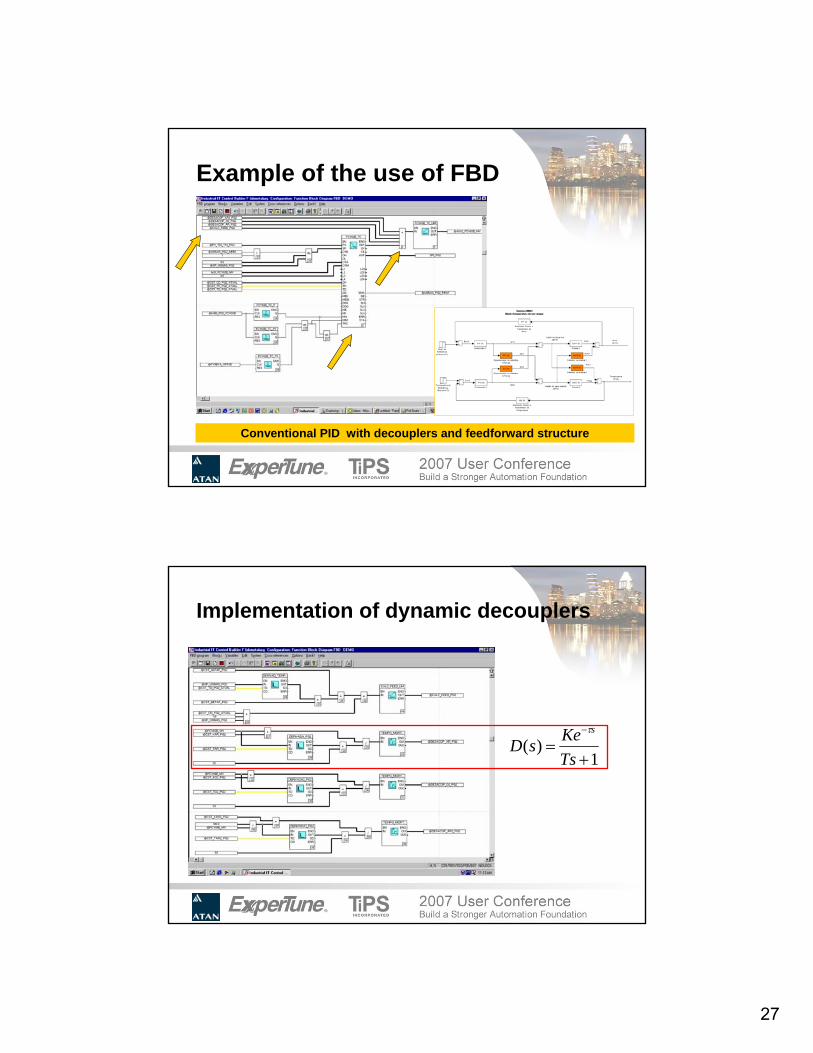
Example of the use of FBD
Conventional PID with decouplers and feedforward structure
Implementation of dynamic decouplers
1)(
+=
−
TsKesD
sτ
28
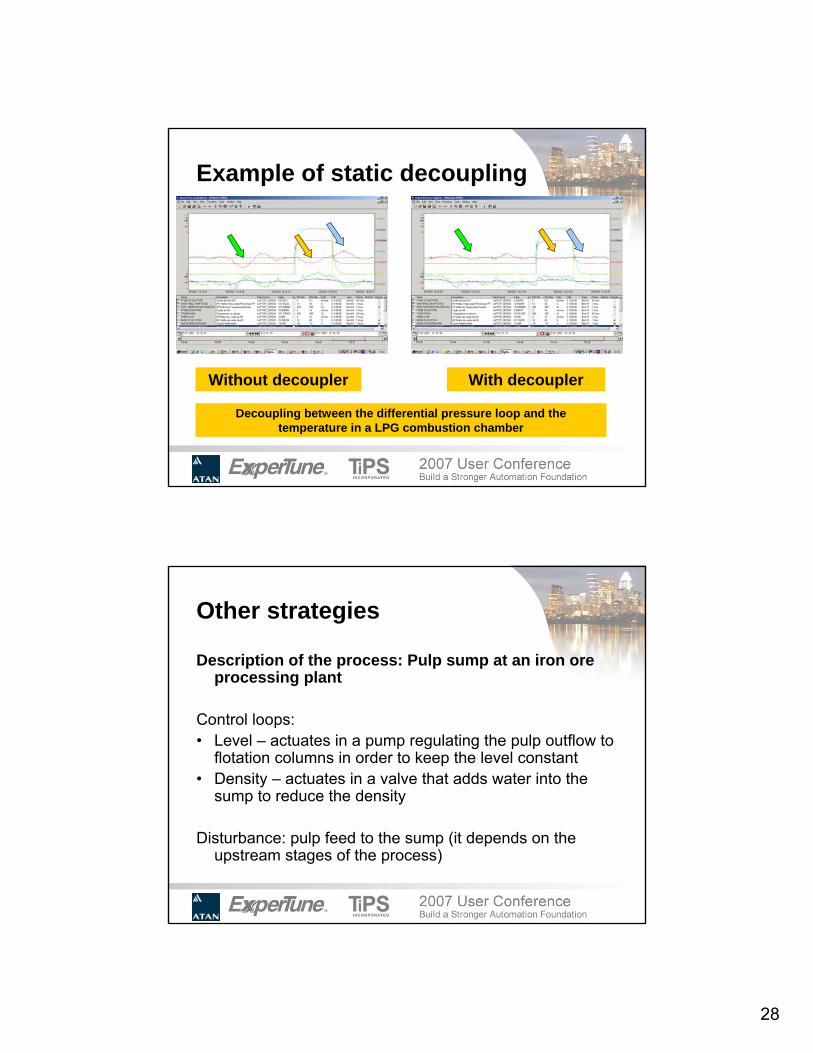
Example of static decoupling
Decoupling between the differential pressure loop and the temperature in a LPG combustion chamber
Without decoupler With decoupler
Other strategies
Description of the process: Pulp sump at an iron ore processing plant
Control loops:• Level – actuates in a pump regulating the pulp outflow to
flotation columns in order to keep the level constant • Density – actuates in a valve that adds water into the
sump to reduce the density
Disturbance: pulp feed to the sump (it depends on the upstream stages of the process)
29
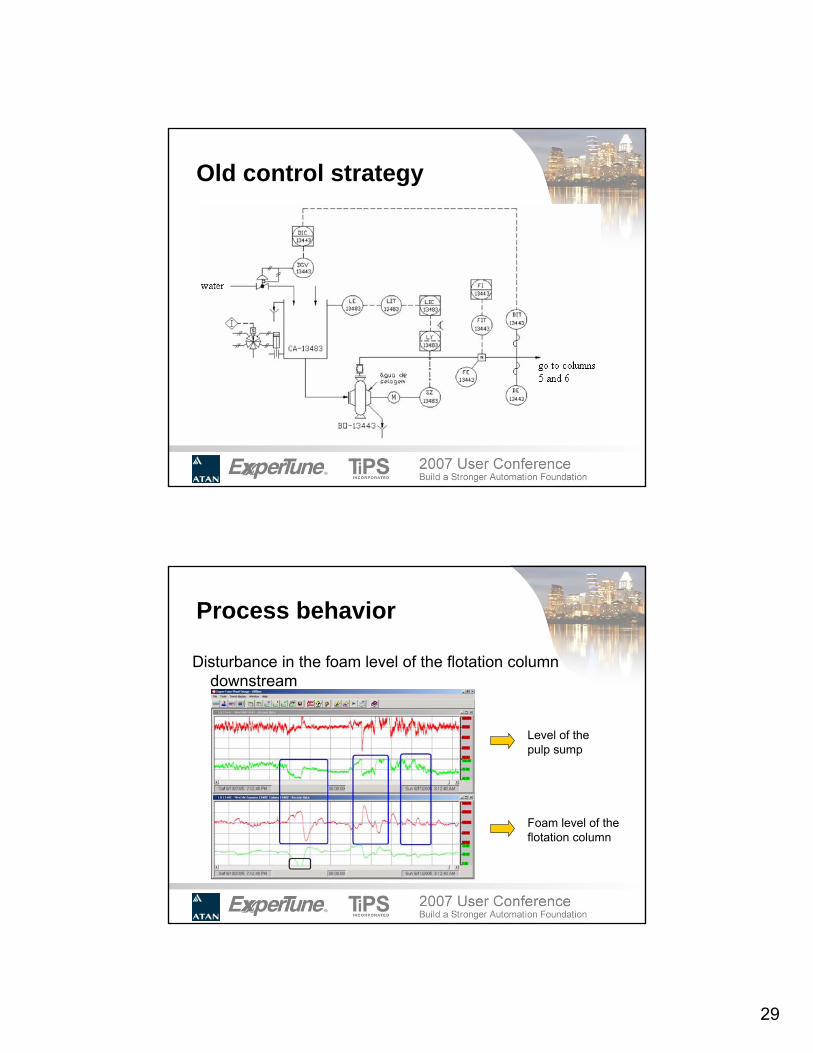
Old control strategy
Process behavior
Disturbance in the foam level of the flotation column downstream
Level of the pulp sump
Foam level of the flotation column
30
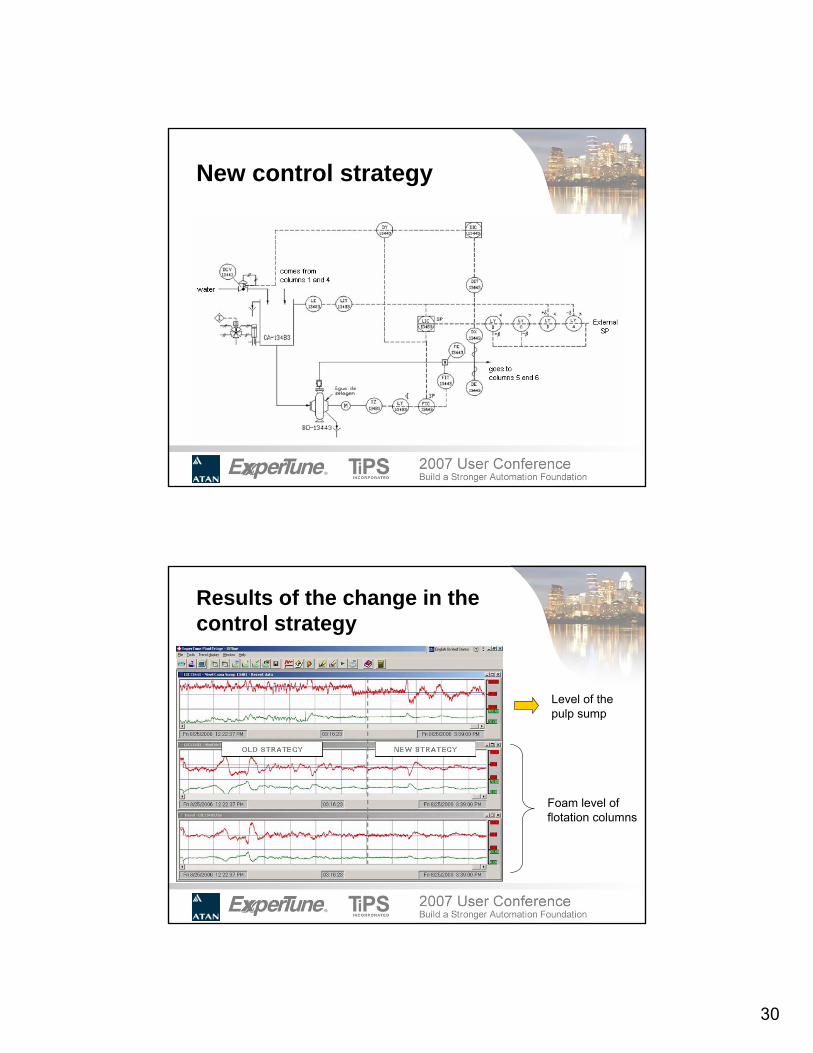
New control strategy
Results of the change in the control strategy
Level of the pulp sump
Foam level of flotation columns

31
Results of the change in the control strategyReduction in the variability of the foam level of the flotation
column
BEFORE
AFTER
Control System Design
What should we do if the disturbances are so strong that our decoupling strategies cannot handle them?
Study the control system design and variable’s pairing (CO x PV)
32
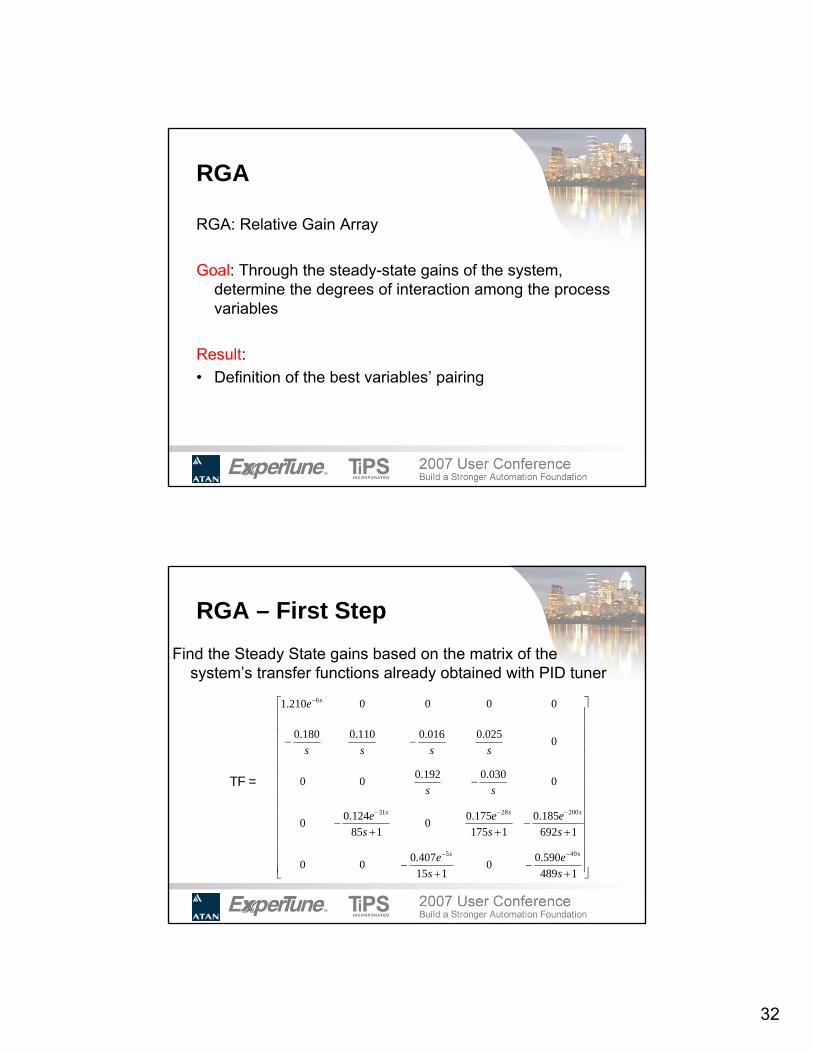
RGA
RGA: Relative Gain Array
Goal: Through the steady-state gains of the system, determine the degrees of interaction among the processvariables
Result:• Definition of the best variables’ pairing
Find the Steady State gains based on the matrix of the system’s transfer functions already obtained with PID tuner
⎥⎥⎥⎥⎥⎥⎥⎥⎥⎥⎥⎥⎥⎥⎥
⎦
⎤
⎢⎢⎢⎢⎢⎢⎢⎢⎢⎢⎢⎢⎢⎢⎢
⎣
⎡
+−
+−
+−
++−
−
−−
−−
−−−
−
1489590.00
115407.000
1692185.0
1175175.00
185124.00
0030.0192.000
0025.0016.0110.0180.0
0000210.1
495
2002831
6
se
se
se
se
se
ss
ssss
e
ss
sss
s
TF =
RGA – First Step
33
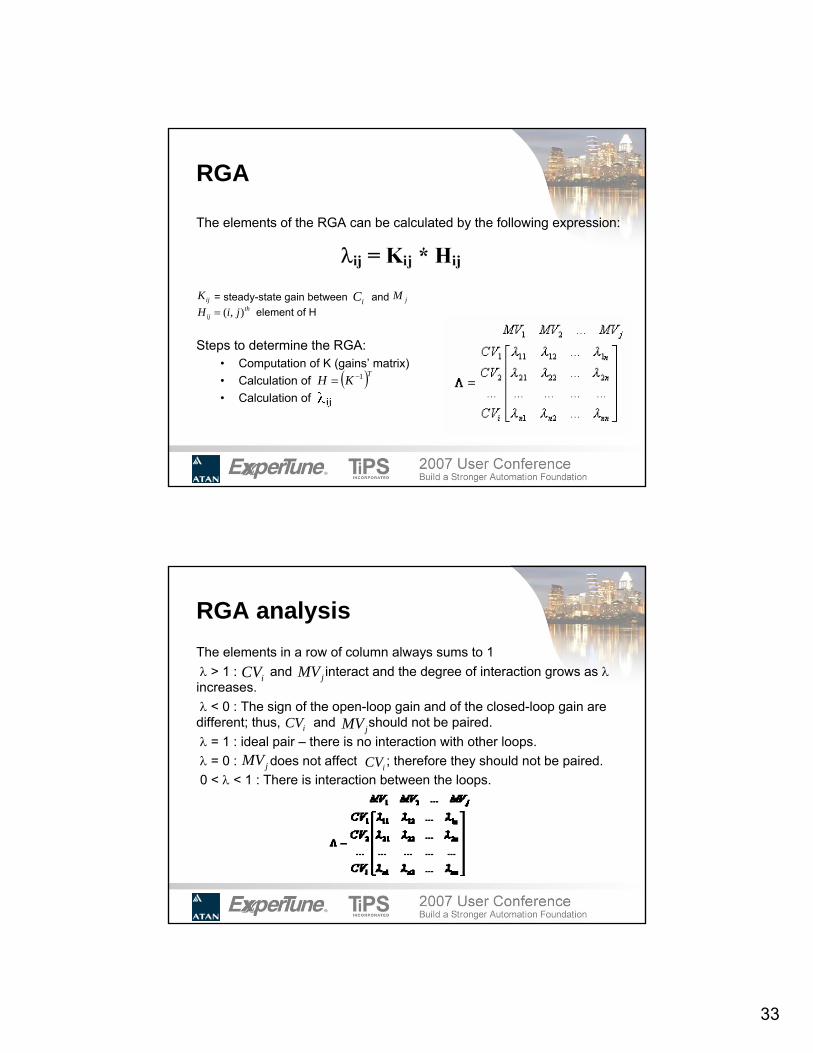
RGA
The elements of the RGA can be calculated by the following expression:
= steady-state gain between andelement of H
Steps to determine the RGA:• Computation of K (gains’ matrix)• Calculation of• Calculation of
ijK iC jMth
ij jiH ),(=
( )TKH 1−=
RGA analysisThe elements in a row of column always sums to 1λ > 1 : and interact and the degree of interaction grows as λincreases.λ < 0 : The sign of the open-loop gain and of the closed-loop gain are different; thus, and should not be paired.λ = 1 : ideal pair – there is no interaction with other loops.λ = 0 : does not affect ; therefore they should not be paired.0 < λ < 1 : There is interaction between the loops.
iCV jMV
iCV jMV
jMV iCV
34
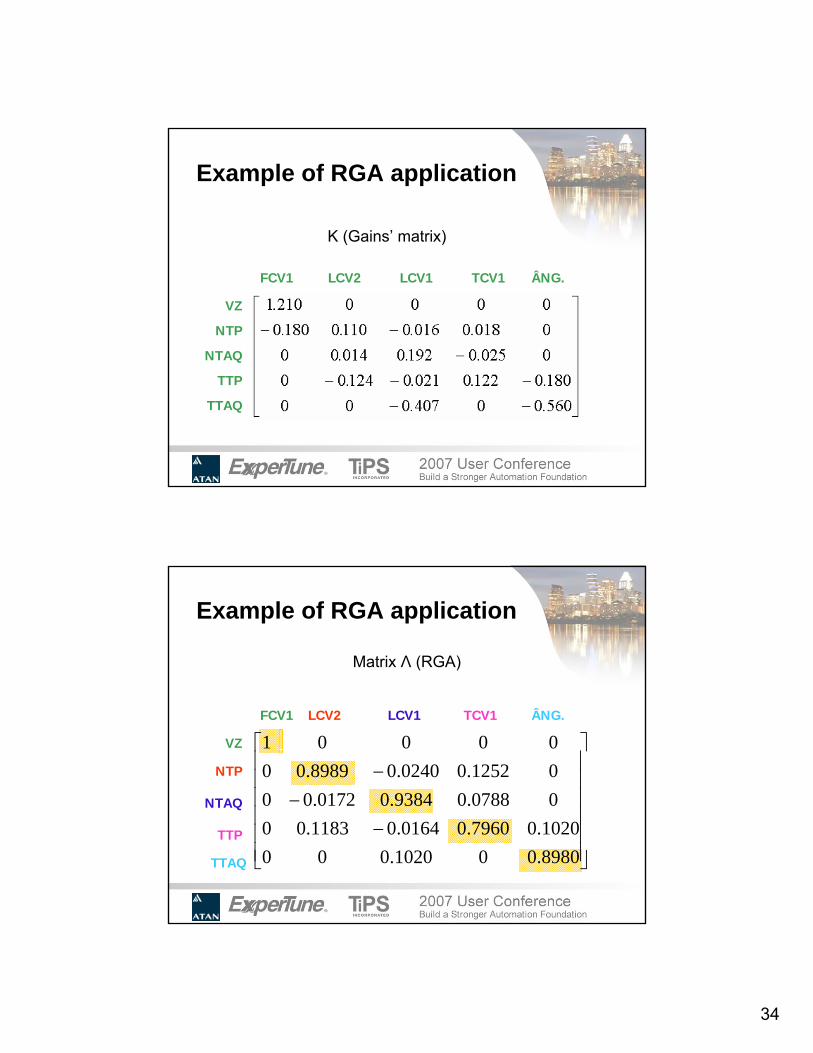
Example of RGA application
K (Gains’ matrix)
FCV1 LCV2 LCV1 TCV1 ÂNG.
VZ
NTP
NTAQ
TTP
TTAQ
Example of RGA application
Matrix Λ (RGA)
FCV1 LCV2 LCV1 TCV1 ÂNG.
VZ
NTP
NTAQ
TTP
TTAQ ⎥⎥⎥⎥⎥⎥
⎦
⎤
⎢⎢⎢⎢⎢⎢
⎣
⎡
−−
−
8980.001020.0001020.07960.00164.01183.0000788.09384.00172.0001252.00240.08989.0000001

35
ConclusionsCouplings among loops are harmful to process performance.
This is quite common in industry;
PlantTriage has some tools to help you find the coupled loops;
Once detected, the loops need to be decoupled. Possible approaches:
In order for the control system to reach a great performance level, the
variables’ pairing needs to be carefully chosen. The RGA technique can
help you to define the best variables’ pairing in a multiloop system and
PID Tuner can be used to find the models.
Change control strategyChange Tuning Design decouplers
BBúúzios zios –– Rio de Janeiro Rio de Janeiro -- BrazilBrazil
Bernardo Soares TorresBernardo Soares [email protected]@atan.com.br
www.atan.com.brwww.atan.com.br