deconvolution in 3-d optical microscopy
TRANSCRIPT

Histochemical Journal 26, 687-694 (1994)
REVIEW
Deconvolution in 3-D optical microscopy PETER S H A W
Department of Cell Biology, John Innes Centre, Colney Lane, Norwich NR 4 7UH, UK
Received I0 January 1994 and in revised form 4 March 1994
Summary
Fluorescent probes are becoming ever more widely used in the study of subcellular structure, and determination of their three-dimensional distributions has become very important. Confocal microscopy is now a common technique for overcoming the problem of oubof-focus flare in fluorescence imaging, but an alternative method uses digital image processing of conventional fluorescence images-a technique often termed 'deconvolution' or 'restoration'. This review attempts to explain image deconvolution in a non-technical manner. It is also applicable to 3-D confocal images, and can provide a further significant improvement in clarity and interpretability of such images. Some examples of the application of image deconvolution to both conventional and confocal fluorescence images are shown.
Introduction
Optical microscopy is centuries old and yet is still at the heart of much of modem biological research, particularly in cell biology. The reasons are not hard to find. Much of the current power of optical microscopy stems from the availability of an almost endless variety of fluorescent optical probes - antibodies for immunofluorescence, tagged and fluorescent nucleotide probes for in situ hybridization, and reporter dyes which monitor the intracellular levels of an ever-increasing number of bio- logically active molecules and ions. The resolution of the technique-about half the wavelength of the light used - allows a great deal of interesting and rapid obser- vation at the cellular and subcellular level. Importantly, light is often relatively non-destructive to biological materials, and with skill, perseverance and some luck, many observations, even of fluorescently labelled probes, can be carried out on living cells. This has spawned yet another acronym-FACS (Fluorescent Analogue Cyto- chemistry)-where fluorescently labelled analogues of biological molecules, usually proteins, are introduced by microinjection or other means into living cells for obser- vation by epifluorescence microscopy. When coupled with the introduction of various biological effectors, often 'caged' for later release by a pulse of UV light, a huge variety of very specific manipulations and observations become possible-biochemistry in single cells.
However, it is a law of nature, or perhaps of human nature, that the most interesting information is just beyond what is observable, and this has led to attempts
0018-2214 �9 1994 Chapman & Hall
to alleviate the resolution limits of optical imaging. The most obvious resolution limit is due to the wavelength of the light used- about 0.25 lam in general. This limi- tation can clearly be overcome by non-conventional optical imaging such as near-field microscopy; whether it can be exceeded in conventional microscopy ('super-res- olution') has been very controversial (see e.g. Cox et aI., 1982; Inoue, 1989). I shall not be directly concerned with this limitation in this review. A resolution degradation which can certainly be at least improved, if not entirely eliminated, is the 'out-of-focus blur'. In addition to the structural information originating from the plane of focus of the microscope system, in a conventional optical microscope, there is a substantial contribution from adjacent parts of the specimen either side of this plane. The further away from the plane of focus, the more the high-resolution components of the image are attenuated. The total image at a given level of focus from a three-dimensional object is thus not a true section through the object, but neither is it a true projection. This makes detailed interpretation very difficult. In the case of dark-field imaging modes, such as epifluorescence, the out-of-focus parts of the image are very intrusive, and often give a large background flare. The fine image detail in the actual focal plane is seen as a relatively small modulation on top of this background, and can even be substantially swamped out by it. Confocal microscopy is the most widely used technique for alleviating this problem. An alternative approach, which was actually applied to biological problems before biological confocal microscopes were available, is to use digital image

688 SHAW
processing of the conventional optical images (often now called 'wide-field images' to distinguish the imaging from confocal) (Castleman, 1979; Agard & Sedat, 1983). This procedure is generally called 'deconvolution' or 'deblur- ring', and will be the subject of this review. I shall also show that deconvolution can usefully be applied also to confocal images, since confocal imaging alone is not a complete solution to the out-of-focus blur and attenuation of the fine image detail.
The point spread function and deconvolution
Deconvolution, often termed 'restoration', is a technique which has been developed and used in a wide variety of fields from one-dimensional spectroscopy to three- dimensional biomedical imaging. It has probably been most rigorously and carefully applied in the field of astronomy, perhaps because so much expense and time are spent in acquiring astronomical images. The Hubble space telescope is a much-publicized recent example; the lens aberration which was inadvertently left in the telescope mirror degraded the resolution, and before the recent successful optical correction of the defect, a good deal of effort was made to apply deconvolution techniques very similar to those described below to compensate for at least some of the aberration. Although it is certainly better to remove the aberrations in the optical system, it will be interesting to know how successful the deconvolution approach proved when a comparison can be made with the subsequent optically improved images.
In order to devise a soundly based reversal of the image degradation introduced by the optical system, it is necessary to be able to describe the relation between the specimen and its optical image in mathematical terms. The interested reader is referred elsewhere for more rigorous derivations (Agard et al., 1989; Young, 1989; Shaw, 1993; van de Voort & Smeulders, 1993), but it turns out that
within some very general limitations, the object (speci- men) and image are mathematically simply related by an operation known as convolution. In a convolution, every point of the object is replaced by an appropriately blurred point and the final image is then the sum of all these blurred points. (For a more thorough introduction to convolution, the interested reader is referred to standard textbooks on image processing, e.g. Gonzalez & Wintz, 1977; Castleman, 1979.) The way each individual point is blurred is determined by the point spread function (PSF) which is simply the image of a single point. This is illustrated in a diagram in Fig. 1. The conditions that must be met are that the imaging should be linear - that is, the whole image is the sum of the images of the parts - and shift-invariant - that is, the point spread func- tion is the same over the whole field of view (Young, 1989). Clearly, some types of optical images do not obey these conditions. For example, phase-contrast and DIC are not linear, since the contrast depends on differences within the object, either of phase or phase gradient, but fluorescence and bright field imaging do obey these conditions to a good approximation.
Having established that the imaging can be described by a convolution, we can consider reversing the pro- cess - deconvolution. First, however, we need a measure- ment of the relevant point spread function. This may be calculated theoretically for the imaging arrangement used (Stokseth, 1969), or alternatively may be measured di- rectly from images of sub-resolution fluorescent beads in the case of epifluorescence microscopy (Hiraoka et al., 1990; Shaw & Rawlins, 1991). Both approaches have been used in biological studies, but my preference is to use a directly measured PSF. In the case of conventional wide-field microscopy, the in-plane part of the PSF is simply the Airy disc. However, since we are dealing with three-dimensional images, we need the three-dimensional PSF, which is considerably more complicated. Figure 2a shows a measurement of a wide-field PSF, made from the
convolution
deconvolution
�9 co nvolutio n ~i~
: t OtQi �9 deco nvo l utio n ~!~
�9 . i i t ~
Fig. 1. Diagrammatic illustration of the effect of optical imaging as a convolution of object with the microscope point spread �9 function. (a) A single point is replaced by the PSF. (b) Each point in an extended object is replaced by a weighted copy of the
PSF. The resultant image is the sum of all the blurred points-a mathematical process known as 'convolution'.
Deconvolution in 3-D optical microscopy
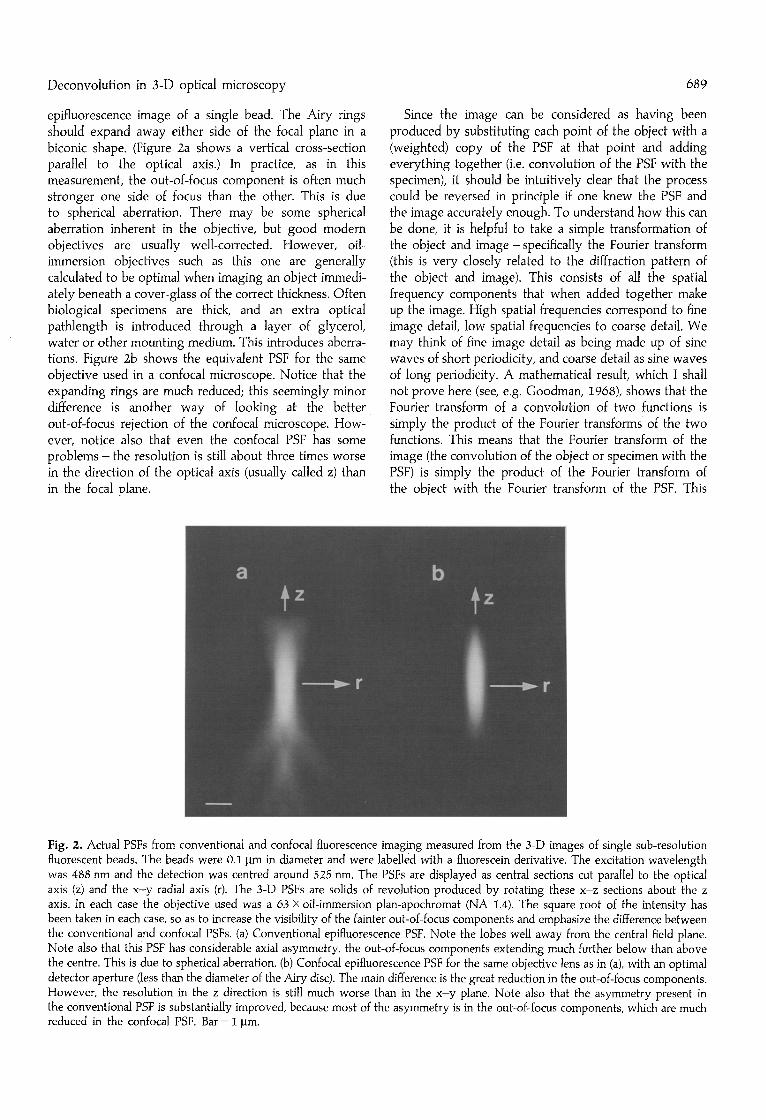
epifluorescence image of a single bead. The Airy rings should expand away either side of the focal plane in a biconic shape. (Figure 2a shows a vertical cross-section parallel to the optical axis.) In practice, as in this measurement, the out-of-focus component is often much stronger one side of focus than the other. This is due to spherical aberration. There may be some spherical aberration inherent in the objective, but good modern objectives are usually well-corrected. However, oil- immersion objectives such as this one are generally calculated to be optimal when imaging an object immedi- ately beneath a cover-glass of the correct thickness. Often biological specimens are thick, and an extra optical pathlength is introduced through a layer of glycerol, water or other mounting medium. This introduces aberra- tions. Figure 2b shows the equivalent PSF for the same objective used in a confocal microscope. Notice that the expanding rings are much reduced; this seemingly minor difference is another way of looking at the better oubof-focus rejection of the confocal microscope. How- ever, notice also that even the confocal PSF has some problems - t h e resolution is still about three times worse in the direction of the optical axis (usually called z) than in the focal plane.
689
Since the image can be considered as having been produced by substituting each point of the object with a (weighted) copy of the PSF at that point and adding everything together (i.e. convolution of the PSF with the specimen), it should be intuitively clear that the process could be reversed in principle if one knew the PSF and the image accurately enough. To understand how this can be done, it is helpful to take a simple transformation of the object and image- specifically the Fourier transform (this is very closely related to the diffraction pattern of the object and image). This consists of all the spatial frequency components that when added together make up the image. High spatial frequencies correspond to fine image detail, low spatial frequencies to coarse detail. We may think of fine image detail as being made up of sine waves of short periodicity, and coarse detail as sine waves of long periodicity. A mathematical result, which I shall not prove here (see, e.g. Goodman, 1968), shows that the Fourier transform of a convolution of two functions is simply the product of the Fourier transforms of the two functions. This means that the Fourier transform of the image (the convolution of the object or specimen with the PSF) is simply the product of the Fourier transform of the object with the Fourier transform of the PSF. This
Fig. 2. Actual PSFs from conventional and confocal fluorescence imaging measured from the 3-D images of single sub-resolution fluorescent beads. The beads were 0.1 ~tm in diameter and were labelled with a fluorescein derivative. The excitation wavelength was 488 nm and the detection was centred around 525 nm. The PSFs are displayed as central sections cut parallel to the optical axis (z) and the x-y radial axis (r). The 3-D PSFs are solids of revolution produced by rotating these x-z sections about the z axis. In each case the objective used was a 63 x oil-immersion plan-apochromat (NA 1.4). The square root of the intensity has been taken in each case, so as to increase the visibility of the fainter out-of-focus components and emphasize the difference between the conventional and confocal PSFs. (a) Conventional epifluorescence PSF. Note the lobes well away from the central field plane. Note also that this PSF has considerable axial asymmetry, the out-of-focus components extending much further below than above the centre. This is due to spherical aberration. (b) Confocal epifluorescence PSF for the same objective lens as in (a), with an optimal detector aperture (less than the diameter of the Airy disc). The main difference is the great reduction in the out-of-focus components. However, the resolution in the z direction is still much worse than in the x-y plane. Note also that the asymmetry present in the conventional PSF is substantially improved, because most of the asymmetry is in the out-of-focus components, which are much reduced in the confocal PSF. Bar = 1 p,m.

690 SHAW
latter function is usually called the optical transfer func- tion (OTF). Each spatial frequency that comes from the specimen is multiplied by the value of the OTF at that frequency. A perfect, ideal OTF for a hypothetical microscope with infinite resolution would have a value of 1 over the entire plane. In practice the OTF decreases to zero at the maximum spatial frequency transmitted by the microscope. This in turn is determined primarily by the numerical aperture or angle of acceptance of the objective lens and the wavelength of the light used. Think of the specimen as a diffraction grating; the light emerging from it is then a series of diffracted beams at different angles. The highest order diffracted beam that can pass through the objective is determined by its angle of acceptance. The OTF can be considered as a masking function placed over the theoretically infinite series of diffracted beams which lets through just those beams which are accepted by the objective lens system.
The OTFs corresponding to the PSFs from Fig. 2 are shown in Fig. 3. From this figure it can be seen that the OTF produces mainly an attenuation of the high spatial frequencies. The confocal and conventional OTFs differ mainly in the attenuation of low spatial frequencies in the z direction. There is a 'missing cone' of information near the z axis (the optical axis) in the conventional OTF (Fig. 3a). This is another way of looking at the lack of z resolution and resulting out-of-focus blur. In the confocal OTF this region is filled in, so confocal imaging has much reduced out-of-focus blur. However, even in the confocal case, there is considerable attenuation of the high spatial frequencies. Furthermore the maximum spatial frequencies in z, the direction of the optical axis (vertical in Fig. 3) are about one-third the resolution of those in the plane of focus.
We wish to have a true reconstruction of the object, but all that can be measured is the degraded image. As the image Fourier transform is the object Fourier trans- form multiplied by the OTF, it should be possible to
recover the object transform simply by dividing the image transform, point by point, by the OTF; inverse Fourier transformation would then produce an unblurred, undegraded image. Unfortunately this is made impossible by the inevitable presence of noise in any real image. Each spatial frequency has an associated noise component, and at high spatial frequencies this can be very large. In these regions, the OTF has a very small value - very much less than I - and so dividing by the value of the OTF will greatly magnify the noise, often to a degree which makes the reconstructed image meaningless. A standard way of avoiding this is the Wiener filter, where an extra noise- dependent factor is added to the OTF values, so that in noisy regions the divisor is larger, and the noisy com- ponents are not boosted (see e.g. Andrews & Hunt, 1977; Gonzalez and Wintz, 1977). However, this often has the effect of rejecting genuinely useful information so that the reconstructed image is of lower resolution than necessary.
This problem of restoring noisy data is a common one to many fields in spectroscopic, optical and medical imaging. The most powerful methods of solution apply 'constraints' to the solution, typically requiring the result to be positive and smooth- physically reasonable re- quirements. A simple way to visualize this is to consider fitting a curve to some noisy data points. If the curve is allowed to have many parameters it can pass right through all the points, but may well contain wild and meaningless oscillations in regions away from the points. If we put some constraints on the curve, such as preventing physically meaningless values, or ensuring a certain degree of smoothness, then the curve may not pass exactly through any point, but will be near them all, and will be a more reasonable and 'believable' solution. This is the basis of constrained deconvolution methods. They are invariably more complex and time-consuming to compute than the simpler methods, and usually require multiple rounds of iterative approximation to the recon- structed image. However their power, and the rapidly
Fig. 3. Conventional and confocal optical transfer functions (OTFs) calculated from the PSFs in Fig. 2. As in Fig. 2, the OTFs are showed as central sections parallel to the optical axis (z) and the radial (x-y) axis, and the 3-D functions are radially symmetric about the optical axis. Note the 'missing' region near the z axis in the conventional OTF, which is filled in in the confocal OTF.

Deconvolution in 3-D optical microscopy
decreasing cost of computing, make them the most attractive option for 3-D image deconvolution. The examples we show here are all calculated by the con- strained, iterative method developed by Jansson (Jansson et al., 1970), and later by Agard and colleagues (e.g. Agard et al., 1989). There are many different methods for this type of restoration. The best current methods take a much more rigorous statistical view of the signal, the noise, and of what is the most likely object to have given rise to the observed image (see e.g. Frieden, 1984; Holmes & Liu, 1992). So far, however, these methods are exceed- ingly time-consuming for large three-dimensional images. We think that the Jansson method represents a good compromise between rigor and computation for the types of work-stations currently available.
A deblurring algorithm which has been often quoted is the 'nearest neighbour algorithm'. I shall describe it briefly here. It was devised by Castleman (1979) at a time when the three-dimensional deconvolution problem was beyond the power of virtually all available computers. It attempts to reduce the 3-D problem to a series of 2-D calculations, each focal section being considered individ- ually. The neighbouring focal sections either side of the section in question are then taken as an approximation to the real image structure either side and their blurred images are assumed to be an estimate of the additional out-of-focus light added to the focal plane in question. A fraction of these blurred neighbouring sections is then subtracted from the image of this focal plane. However,
691
the assumptions are questionable, and the procedure generally approximates a simple high-frequency enhance- ment. Furthermore, it is susceptible to the effect of slight differences in scaling and alignment between successive focal planes. For these reasons, and because of the uncertainty of the actual effect of the procedure, the more clearly defined restoration schemes mentioned above are preferable.
Some practical examples All the examples shown here were calculated using the Jansson-van Cittert method described by Agard et aL (1989), implemented on a Titan unix-based work-station. The conventional images were measured using a Photo- metrics CCD camera with a Kodak ICAF 1400 chip cooled thermoelectrically to -35~ and the confocal images were measured with a Biorad MRCSO0 confocal micro- scope.
Figure 4a shows a series of focal sections of a Vicia faba nucleus labelled with the DNA dye DAPI and imaged by conventional epifluorescence microscopy. The entire 3-D data set contained about 30 sections. In Fig. 4b the equivalent selected sections are shown after deconvolu- tion of the 3-D data using a measured PSF. Note that the background flare has been largely removed and the fine image detail is seen much more clearly with greater contrast. The deconvoluted image is equivalent to what might be produced by a confocal microscope.
Fig. 4. Deconvolution of conventional epifluorescence images. Fluorescent labelling and detection as in Fig. 2. Three consecutive focal sections of a very early G1 nucleus from root tissue of Vicia faba stained with the DNA dye DAPI are shown. (a) Original fluorescence images (collected with a cooled CCD camera) selected from a full 3-D data set. (b) The same sections after 3-D deconvolution of the original data set. The background flare has been substantially reduced and the fine detail is much more apparent. The original data were collected at a z spacing of 0.4 ~tm. Deconvolution took approximately one hour on a Titan work station. Bar = 2 gm.
692 SHAW
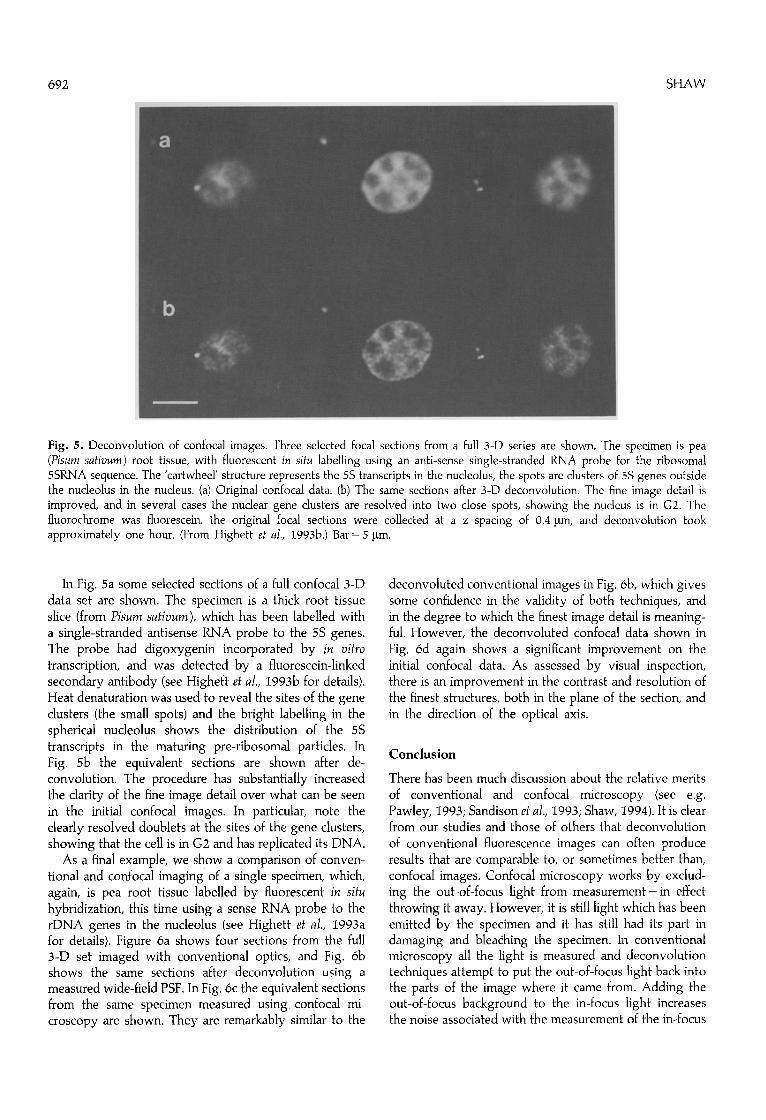
Fig. 5. Deconvolution of confocal images. Three selected focal sections from a full 3-D series are shown. The specimen is pea (Pisum sativum) root tissue, with fluorescent in situ labelling using an anti-sense single-stranded RNA probe for the ribosomal 5SRNA sequence. The 'cartwheel' structure represents the 5S transcripts in the nucleolus, the spots are clusters of 5S genes outside the nucleolus in the nucleus. (a) Original confocal data. (b) The same sections after 3-D deconvolution. The fine image detail is improved, and in several cases the nuclear gene clusters are resolved into two close spots, showing the nucleus is in G2. The fluorochrome was fluorescein, the original focal sections were collected at a z spacing of 0.4 Ixm, and deconvolution took approximately one hour. (From Highett et al., I993b.) Bar = 5 ~tm.
In Fig. 5a some selected sections of a full confocal 3-D data set are shown. The specimen is a thick root tissue slice (from Pisum sativum), which has been labelled with a single-stranded antisense RNA probe to the 5S genes. The probe had digoxygenin incorporated by in vitro transcription, and was detected by a fluorescein-linked secondary antibody (see Highett et al., I993b for details). Heat denaturation was used to reveal the sites of the gene clusters (the small spots) and the bright labelling in the spherical nucleolus shows the distribution of the 5S transcripts in the maturing pre-ribosomal particles. In Fig. 5b the equivalent sections are shown after de- convolution. The procedure has substantially increased the clarity of the fine image detail over what can be seen in the initial confocal images. In particular, note the clearly resolved doublets at the sites of the gene clusters, showing that the cell is in G2 and has replicated its DNA.
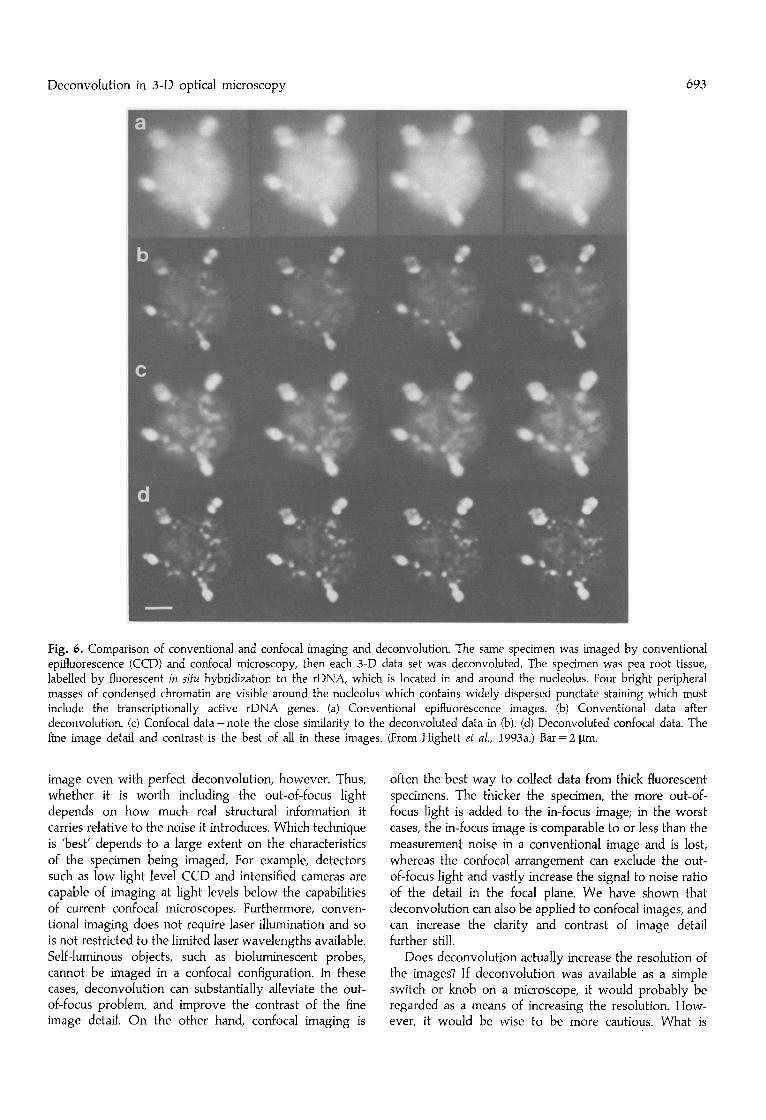
As a final example, we show a comparison of conven- tional and confocal imaging of a single specimen, which, again, is pea root tissue labelled by fluorescent in situ hybridization, this time using a sense RNA probe to the rDNA genes in the nucleolus (see Highett et al., 1993a for details). Figure 6a shows four sections from the full 3-D set imaged with conventional optics, and Fig. 6b shows the same sections after deconvolution using a measured wide-field PSF. In Fig. 6c the equivalent sections from the same specimen measured using confocal mi- croscopy are shown. They are remarkably similar to the
deconvoluted conventional images in Fig. 6b, which gives some confidence in the validity of both techniques, and in the degree to which the finest image detail is meaning- ful. However, the deconvoluted confocal data shown in Fig. 6d again shows a significant improvement on the initial confocal data. As assessed by visual inspection, there is an improvement in the contrast and resolution of the finest structures, both in the plane of the section, and in the direction of the optical axis.
Conclusion
There has been much discussion about the relative merits of conventional and confocal microscopy (see e.g. Pawley, I993; Sandison et al., I993; Shaw, 1994). It is clear from our studies and those of others that deconvolution of conventional fluorescence images can often produce results that are comparable to, or sometimes better than, confocal images. Confocal microscopy works by exclud- ing the out-of-focus light from measurement- in effect throwing it away. However, it is still light which has been emitted by the specimen and it has still had its part in damaging and bleadhing the specimen. In conventional microscopy all the light is measured and deconvolution techniques attempt to put the out-of-focus light back into the parts of the image where it came from. Adding the out-of-focus background to the in-focus light increases the noise associated with the measurement of the in-focus
Deconvolution in 3-D optical microscopy 693
Fig. 6. Comparison of conventional and confocal imaging and deconvolution. The same specimen was imaged by conventional epifluorescence (CCD) and confocal microscopy, then each 3-D data set was deconvoluted. The specimen was pea root tissue, labelled by fluorescent in situ hybridization to the rDNA, which is located in and around the nucleolus. Four bright peripheral masses of condensed chromatin are visible around the nucleolus which contains widely dispersed punctate staining which must include the transcriptionally active rDNA genes. (a) Conventional epifluorescence images. (b) Conventional data after deconvolution. (c) Confocal data- note the close similarity to the deconvoluted data in (b). (d) Deconvoluted confocal data. The fine image detail and contrast is the best of all in these images. (From Highett et al., 1993a.) Bar = 2 ~tm.
image even with perfect deconvolution, however. Thus, whether it is worth including the out-of-focus light depends on how much real structural information it carries relative to the noise it introduces. Which technique is 'best' depends to a large extent on the characteristics of the specimen being imaged. For example, detectors such as low light level CCD and intensified cameras are capable of imaging at light levels below the capabilities of current confocal microscopes. Furthermore, conven- tional imaging does not require laser illumination and so is not restricted to the limited laser wavelengths available. Self-luminous objects, such as bioluminescent probes, cannot be imaged in a confocal configuration. In these cases, deconvolution can substantially alleviate the out- of-focus problem, and improve the contrast of the fine image detail. On the other hand, confocal imaging is
often the best way to collect data from thick fluorescent specimens. The thicker the specimen, the more out-of- focus light is added to the in-focus image; in the worst cases, the in-focus image is comparable to or less than the measurement noise in a conventional image and is lost, whereas the confocal arrangement can exclude the out- of-focus light and vastly increase the signal to noise ratio of the detail in the focal plane. We have shown that deconvolution can also be applied to confocal images, and can increase the clarity and contrast of image detail further still.
Does deconvolution actually increase the resolution of the images? If deconvolution was available as a simple switch or knob on a microscope, it would probably be regarded as a means of increasing the resolution. How- ever, it would be wise to be more cautious. What is

694 S H A W
actually achieved is a reversal of the resolution-dependent at tenuation in the image. Al though the resolution limit in a conventional microscope is somewhere around half the wave length of the light used (depending on the definition of resolution adopted), the contrast transmitted by the microscope at and near the limit is a very small pro- port ion of the contrast originally present in the specimen. Thus the observable resolution in a typical specimen might be not even close to the optical resolution limit, unless there are very strong image components at these spatial frequencies. Image deconvolut ion at tempts to restore the various spatial frequency components to something nearer what they were in the original object before being at tenuated by the optical system. Rather than saying that deconvolut ion increases the resolution, it would be more correct to say that it allows us to make better use of the information that the physics of the optical microscope, conventional or confocal, allows us.
Acknowledgements
This work was supported by the Agricultural and Food Research Council of the UK, via a grant-in-aid to the John Innes Institute. I thank Richard Lee for the data shown in Figures 2 and 3.
References
AGARD, D. A. & SEDAT, J. W. (1983) Three-dimensional architec- ture of a polythene nucleus. Nature 302, 676-81.
AGARD, D. A., HIRAOKA, Y., SHAW, P. J. & SEDAT, J. W. (1989) Fluorescence microscopy in three dimensions. Meth. Cell Biol. 30, 353-78.
ANDREWS, H. C. & HUNT, B. R. (1977) Digital Image Restoration. Englewood Cliffs: Prentice-Hall.
CASTLEMAN, K. R. (1979) Digital Image Processing. Englewood Cliffs: Prentice-Hall.
cox, I. J., SHEPPARD, C. ]. R. & WILSON, T. (1982) Super-resolution by confocal scanning fluorescence microscopy. Optik 60, 391-6.
FRIEDEN, B. R. (1984) Maximum-likelihood estimates of spectra. In Deconvolution with Applications in Spectroscopy (edited by JANSSON, P. A.), pp. 229-61.
GONZALEZ, R. C. & WINTZ, P. (1977) Dig#a] Image Processing. Reading, MA: Addison-Wesley Inc.
GOODMAN, J. W. (1968) Introduction to Fourier Optics. p. 278. McGraw-Hill Inc.
HIGHETT, M. I., RAWLINS, D. J. & SHAW, P. J. (1993a) Different patterns of rDNA distribution in Pisum sativum nucleoli correlate with different levels of nucleolar activity. ]. Cell Sci. 104, 843-52.
HIGHETT, M. I., BEVEN, A. F. & SHAW, P. J. (1993b) Localization of 5S genes and transcripts in Pisum sativum nuclei. ]. Cell Sci. 105, 1151-8.
HIRAOKA, Y., SEDAT, J. W. & AGARD, D. A. (1990) Determination of three-dimensional imaging properties of a light micro- scope system: partial confocal behaviour in epifluores- cence microscopy. Biophys. ]. 57, 325-33.
HOLMES, T. J. & LIU, Y.-H. (1992) Image restoration for 2-D and 3-D fluorescence microscopy. In Visualization in Biomedical Microscopies (edited by KRIETE, A.), Weinheim, Germany: VCH.
INOUE, S. (1989) Imaging of unresolved objects, superresolution, and precision of distance measurement, with video microscopy. Meth. Cell Biol. 30, 85-112.
JANSSON, P. A., HUNT, R. M. & PLYLER, E. K. (1970) J. Opt. Soc. Am. 60, 596.
PAWLEY, J. B. (1993) The sources of noise in three-dimensional microscopical data sets. In Three-dimensional Confocal Microscopy: Volume Investigation of Biological Specimens (edited by STEVENS, J. K., MILLS, L. R. & TROGADIS, J. E.), Academic Press.
SANDISON, D. R., PISTON, D. W. & WEBB, W. W. (1993) Back- ground rejection and optimization of signal-to-noise in confocal microscopy. In Three-dimensional Confocal Microscopy: Volume Investigation of Biological Specimens (edited by STEVENS, J. K., MILLS, L. R. & TROGADIS, J. E.), New York: Academic Press.
SHAW, P. J. (1993) Computer reconstruction in three-dimensional fluorescence microscopy. In Electronic Light Microscopy (edited by SHOTTON, D. M.), New York: Wiley-Liss Inc.
SHAW, P. J. (1994) Comparison of wide-field/deconvolution and confocal microscopy for 3-D imaging. In Handbook of Biological Confocal Microscopy, 2nd edn (edited by PAWLEY, J. B.), New York: Plenum Press (in press).
SHAW, P. J. & RAWLINS, D. J. (1991) The point spread function of a confocal microscope: its measurement and use in deconvolution of 3D data. ]. Microsc. 163, 151-65.
STOKSETH, P. A. (i969) Properties of a defocused optical system. ]. Opt. Soc. Am. 59, 1314-21.
VAN DE VOORT, H. T. M. & SMEULDERS, A. W. M. (1993) Acqui- sition, processing and visualisation of three-dimensional confocal images. In Electronic Light Microscopy (edited by SHOTTON, D. M.), New York: Wiley-Liss Inc.
YOUNG, I. T. (1989) Image fidelity: characterizing the imaging transfer function. Meth. Cell Biol. 30, 2-47.