decision - georgia institute of technologyhpark/papers/cluster_jogo.pdffashion. moreo v er, the...
TRANSCRIPT

A Decision Criterion for the Optimal Numberof Clusters in Hierarchical ClusteringYunjae Jung ([email protected]) �Qwest Communications, 600 Stinson Blvd., Minneapolis, MN 55413Haesun Park ([email protected]) yDepartment of Computer Science and Engineering University of Minnesota,Minneapolis, MN 55455 and Korea Institute for Advanced Study 207-43Cheongryangri-dong, Dongdaemun-gu Seoul 130-012, KOREA zDing-Zhu Du ([email protected])Department of Computer Science and Engineering University of Minnesota,Minneapolis, MN 55455Barry L. Drake ([email protected])CDT, Inc., Minneapolis, MN 55454Jan. 21, 2002Abstract. Clustering has been widely used to partition data into groups so thatthe degree of association is high among members of the same group and low amongmembers of di�erent groups. Though many e�ective and e�cient clustering algo-rithms have been developed and deployed, most of them still su�er from the lack ofautomatic or online decision for optimal number of clusters.In this paper, we de�ne clustering gain as a measure for clustering optimality,which is based on the squared error sum as a clustering algorithm proceeds. Whenthe measure is applied to a hierarchical clustering algorithm, an optimal number ofclusters can be found. Our clustering measure shows good performance producingintuitively reasonable clustering con�gurations in Euclidean space according to theevidence from experimental results. Furthermore, the measure can be utilized toestimate the desired number of clusters for partitional clustering methods as well.Therefore, the clustering gain measure provides a promising technique for achievinga higher level of quality for a wide range of clustering methods.1. IntroductionClustering refers to the process of grouping patterns so that the pat-terns are similar within each group and remote between di�erent groups[1]. The distribution of groups can be de�ned as a cluster con�guration.z A part of this work was carried out while H. Park was visiting the KoreaInstitute for Advanced Study, Seoul, Korea, for her sabbatical leave, from September2001 to July 2002.� The work of this author was supported in part by the National ScienceFoundation grant CCR-9901992y The work of this author was supported in part by the National ScienceFoundation grant CCR-9901992c 2002 Kluwer Academic Publishers. Printed in the Netherlands.cluster.tex; 23/01/2002; 12:40; p.1

2The cluster con�guration is valid if clusters cannot reasonably occurby chance or as a bene�cial artifact of a clustering algorithm [2]. Anoptimal cluster con�guration is de�ned as an outcome of all possiblecombinations of groupings, which presents a set of the most \mean-ingful" associations. Even if the de�nition of clustering is that simple,evaluation of clustering performance is well known as a fundamentalbut di�cult problem. One reason is that clustering should be performedwithout a priori understanding of the internal structure of the data.In addition, it is impossible to determine which distribution of clustersis best given certain input patterns without an objective measure forclustering optimality. Thus, there have been many attempts to for-mulate a measure of optimal clustering in the past . However, only asmall number of independent clustering criteria can be understood bothmathematically and intuitively [12, 2]. Consequently, the hundreds ofcriterion functions proposed in the literature are related and the samecriterion appears in several disguises [3, 4, 5, 6, 7].Even though an objective measure is given, the di�culty of optimalclustering stems from the astounding number of possible combina-tions of cluster con�gurations [8]. The number of ways of generat-ing k clusters from n patterns is a Stirling number of the secondkind [9, 10, 11]: S(k)n = 1k! kXi=1(�1)(k�i) � ki � in:In particular, the huge volume of data and the potentially high dimen-sionality of the patterns increase the di�culty of achieving a measurefor optimal clustering. Furthermore, it is hard to select a criterion thattranslates into an intuitive notion of a \cluster" from a reasonablemathematical formula [12]. Feature selection before clustering and clus-ter labeling after clustering are also challenging problems. As a result,many clustering algorithms to date have been heuristic or ad hoc [12, 2].Since no ideal solution to the optimal clustering problem has ex-isted from early clustering research [13], recently proposed algorithmshave focused mostly on e�ciency [14, 15, 16, 17, 18, 19] and scalabil-ity [20, 21, 22, 23, 24, 25] to reduce the computational cost and increaseprocessing capability, respectively. It may be possible to produce acluster con�guration very quickly and process huge amounts of dataat once. However, often there is no guarantee of achieving an optimalor close-to-optimal clustering con�guration.We propose a method to measure clustering optimality quanti-tatively with a purpose to use it to determine an optimal number ofclusters in various clustering algorithms. The method has been designedcluster.tex; 23/01/2002; 12:40; p.2

30 5 10 15 20
0
2
4
6
8
10
12
(a) Raw cluster configuration0 5 10 15 20
0
2
4
6
8
10
12
(b) Under−clustered configuration
0 5 10 15 200
2
4
6
8
10
12
(c) Optimal cluster configuration0 5 10 15 20
0
2
4
6
8
10
12
(d) Over−clustered configurationFigure 1. A series of snapshots of clustering con�gurations in Euclidean distance.based on the assumption that the optimal cluster con�guration canbe recognized only by the intuitive and subjective interpretation ofa human. Since intuitive validation of clustering optimality can bemaximized in two dimensional feature space, it is useful to considertwo dimensional Euclidean space for the sake of an objective decisionas depicted in Figure 1.In order to quantify clustering optimality, we introduce cluster-ing gain, which has been designed to have a maximum value whenintra-cluster similarity is maximized and inter-cluster similarity is min-imized [26, 8]. Thus, the optimal cluster con�guration can be identi�edby the maximum of the clustering gain curve. This measure can bedirectly used to explore an optimal con�guration for all hierarchicalclustering algorithms as they proceed. The measure can also be use-ful for performance comparison among clustering algorithms since theclustering performance is also measured by clustering gain.Since discovering all possible combinations of cluster con�gura-tion is computationally prohibitive [8, 12], most partitional clusteringalgorithms are dependent on users to determine the target number ofclusters. We show how the desired number of clusters can be estimatedbased on the data using the clustering gain measure. The best clus-ter con�guration will be one which can be produced by any speci�ccluster.tex; 23/01/2002; 12:40; p.3

4hierarchical clustering algorithm. Consequently, the measure is usedto estimate the desired number of clusters in partitional clusteringalgorithms.According to the experimental results, most commonly used hier-archical clustering algorithms are able to produce intuitively reasonablyclustered con�gurations using our clustering measure when the inputpatterns are distributed in a well isolated fashion. Moreover, the desirednumber of clusters for partitional clustering methods, e.g. k-means, hasbeen successfully estimated experimentally.The rest of this paper is organized as follows. In Section 2, somebackground information on previous work is presented to derive optimalclustering measures. The design scheme of the optimal clustering gainmeasure is discussed in Section 3. Section 4 discusses how the pro-posed method can be used to evaluate the performance of clusteringalgorithms. Finally, we discuss how to estimate the optimal number ofclusters for partitional clustering algorithms using our new scheme inSection 5. 2. Optimal ClusteringStopping criteria for optimal clustering have been the topic of con-siderable past research e�ort [27]. Speci�cally, deciding the optimallevel of a dendrogram and estimating the number of target clustersremains as a challenging and fundamental problem. For hierarchicalagglomerative clustering, some decision rules have been provided byMilligan and Cooper [28] to determine the appropriate level of the den-drogram [29, 30] for optimal clustering. In addition, Milligan comparedand described objective functions for optimal agglomerative clustering.However, the functions are based on strong assumptions, heuristics, andexperimental dependency. Recently, a stopping rule for the hierarchicaldivisive clustering method has been suggested in the Principal Direc-tion Divisive Partitioning (PDDP) algorithm [31]. While the PDDPalgorithm is proceeding, a dynamic threshold based on a so-calledcentroid scatter value is calculated. The rule is to stop partitioningwhen the centroid scatter value exceeds the maximum cluster scattervalue at any particular point. This approach relies on experimentalobservations. In general, currently used stopping criteria for hierarchi-cal clustering methods are based on prede�ned thresholds includingthe number of iterations, the number of clusters, average dissimilarity[32] within a cluster, maximum distance between patterns, and relativeinter-connectivity and relative closeness [33].cluster.tex; 23/01/2002; 12:40; p.4

5For non-hierarchical partitional algorithms, Dubes [27] provided aseparation index:S(k) = j f(k + 1; k) � f(k; k � 1) j1+ j f(k + 1; k)f(k; k � 1) j ; (1)where f(k + 1; k) =MH(k + 1)�MNH(k):The value MH is the point serial correlation coe�cient between thematrix of Euclidean distances for patterns and a \model" matrix, and kis the nubmer of clusters. The model matrix sets the distance betweentwo patterns to be the distances between the centers of clusters towhich the patterns belong. A stopping rule is adopted to search fora signi�cant knee in the curve of MH(k) as k varies from kmax to 2where kmax is the maximum possible number of clusters.. However, athreshold that distinguishes the knee from other anomalies is di�cult todetermine. In addition, the rule is not able to avoid premature stopping,i.e., the convergence to local minima problem. Similarly, Boulder andOdell [34] introduced a cluster separation measureRij � Si + SjMij ; (2)where Si is a dispersion measure of cluster i such as the squared errorsum and Mij is the distance between two centroids. The separationmeasure will be that which minimizes the average similarity as followsR � 1n kXi=1 niRi; (3)where Ri � maximum of Rij ; i 6= j, ni is the number of paterns incluster i, and n is the total number of the patterns to be clustered.However, a unique optimal clustering condition can not be detected bythe separation measure. According to the experimental results, thereare many minimum points in the hierarchical system [34]. Furthermore,there is no theoretical basis for the feasibility of the measure and noreasonable separation measure for partitional clustering seems to existat present [19].
cluster.tex; 23/01/2002; 12:40; p.5

6 3. Design of A Measure for Optimal Clustering3.1. Clustering BalanceThe clustering problem is to partition the given input patterns into aspeci�c number of groups (clusters) so that the intra-cluster similarity ismaximized and the inter-cluster similarity is minimized in a particularmetric space [26, 8]. Throughout the paper, we will use the followingnotations. Pattern i is a feature vector in an m dimensional space,denoted as pi = [pi1; pi2; : : : ; pim]T ;and a cluster Cj is a set of patterns grouped together by a clusteringalgorithm and expressed byCj = fp(j)1 ; p(j)2 ; : : : ; p(j)nj g;where nj is the number of patterns in cluster Cj. We will assume thatthere are total of n vectors to be clustered and the total number of theclusters is k. Accordingly, Pki=1 ni = n. In addition, p(j)0 denotes thecentroid of the cluster j, which is de�ned asp(j)0 = 1nj njXi=1 p(j)i :The centroid is a mean vector of the cluster and provides a compressedrepresentation of the cluster in a simpler form. The centroid is oftenused for cluster data compression.Cluster con�guration is a random variable whose possible outcomeis a particular assignment of input pattern sets. The problem of optimalclustering is to �nd a cluster con�guration that is optimized accordingto some evaluation criterion. However, as mentioned before, the num-ber of ways of clustering n observations into k groups is enormouslylarge [35]. In fact, a combinatorial search of the set of possible con�gu-rations for optimal clustering is clearly computationally prohibitive [27]and, is NP-complete [36, 37]. Accordingly, currently used agglomerativeclustering algorithms take an approximation approach by merging moresimilar patterns prior to grouping less similar patterns to construct acluster hierarchy. A measure of the similarity between two patternsdrawn from the same feature space plays an essential role in theseclustering procedures [12, 35].The most popular metric for measuring similarity between pat-terns is the Euclidean distance since it is more intuitive and applicable,especially in two dimensional feature space [13, 2]. The most intuitivecluster.tex; 23/01/2002; 12:40; p.6

7and frequently used criterion function in clustering techniques is thesquared error criterion which is the sum of squared distances from thecentroid of a group to every pattern in the group [38, 13, 39, 14, 40, 41,42, 43, 19] which can be expressed using the Euclidean distance [2, 44].The intra-cluster error sum � is de�ned by the squared error e as� = kXj=1 njXi=1 e(p(j)i ; p(j)0 ):which, using the Euclidean distance, can be denoted as� = kXj=1 njXi=1 kp(j)i � p(j)0 k22: (4)It is also called the within-group error sum [12]. Ward used the errorsum of squared to quantify the loss of information by grouping [38].The inter-cluster error sum takes into account error sums betweenclusters by considering the collection of cluster centroids to be a globalpattern set, which also has a global centroid. The inter-cluster errorsum, in case of Euclidean space is de�ned as� = kXj=1 e(p(j)0 ; p0) = kXj=1 kp(j)0 � p0k22; (5)where p0 is the global centroid de�ned asp0 = 1n nXi=1 pi:Now, we present some characteristics of these two con icting er-ror sums, to be utilized in designing a measure for optimal clustercon�guration as well as a stopping criterion in hierarchical clusteringalgorithm. We will assume that the hierarchical algorithm we are con-siering is agglomerative. In case of divisive algorithms, an analogous butopposite trends can easily be proved. We can assume that in the initialstate of any agglomerative clustering algorithm, each pattern is the onlypattern in its own cluster. It is clear that the singleton clusters have nocontribution to the intra-cluster error sum �, and the minimum valuethat � can take is zero. On the other hand, � is maximized when thereis only one cluster that contains all patterns. More interesting fact isthat while clustering process proceeds, the value of � cannot decrease.Suppose two clusters Ci and Cj are merged in a step of agglomerativeclustering. Let the new cluster Cij be the cluster obtained by meringcluster.tex; 23/01/2002; 12:40; p.7

8Ci and Cj. Then, the centroid cij of the new cluster Cij iscij = nip(i)0 + njp(j)0ni + nj :Let �b and �a be intra-cluster error sums of the items that belongto the clusters Ci and Cj only, before and after merging, respectively.Then �b = niXl=1 kp(i)l � p(i)0 k22 + njXl=1 kp(j)l � p(j)0 k22;and �a = niXl=1 kp(i)l � cijk22 + njXl=1 kp(j)l � cijk22:Since, there is no split of a cluster in a path of agglomerative cluster-ing, intra-cluster error sum would be nondecreasing as the clusteringproceeds if �a � �b � 0. We have�a � �b = niXl=1 kp(i)l k22 � 2cTij niXl=1 p(i)l + nicTijcij + njXl=1 kp(j)l k22�2cTij njXl=1 p(j)l + njcTijcij�[ niXl=1 kp(i)l k22 � 2(p(i)0 )T niXl=1 p(i)l + nikp(i)0 k22 + njXl=1 kp(j)l k22�2(p(j)0 )T njXl=1 p(j)l + njkp(j)0 k22]:Using Pnil=1 p(i)l = nip(i)0 and Pnjl=1 p(j)l = njp(j)0 , we have the desiredresult�a � �b = 2nikp(i)0 k22 � nikp(i)0 k22 � 2ni(p(i)0 )T cij + nikcijk22+2njkp(j)0 k22 � njkp(j)0 k22 � 2nj(p(j)0 )T cij + njkcijk22= nikp(i)0 � cijk22 + njkp(j)0 � cijk22 � 0:Similarly, the inter-cluster error sum satis�es the following char-acteristics which show the opposite trend to that of the intra-clustererror sum. Note that the global centroid p0 does not change through-out the clustering process. The inter-cluster error-sum � is maximizedwhen there are n singleton clusters, which occurs at the beginning ofcluster.tex; 23/01/2002; 12:40; p.8
9clustering. Then � is minimized when all n patterns belong to onecluster at the end of clustering. It is easy to show that the value of � isnonincreasing as the clustering proceeds using the triangular propertyof the L2 norm, the Euclidean distance.Our design scheme is based on the fact that intra-cluster simi-larity is nondecreasing and inter-cluster error sum is nonincreasing asthe agglomerative clustering algorithm proceeds. When the clusteringalgorithm is divisive, the trend is the other way around, which is thatintra-cluster error sum is nonincreasing and inter-cluster similarity isnondecreasing as the divisive clustering algorithm proceeds.We transformed the optimal clustering problem into a problem for�nding the point where the two similarities are balanced by representingthese similarities by the squared error sum in Euclidean space. Wede�ne the clustering balance asE(�) = �� + (1� �)�; (6)where � and � denote intra-cluster and inter-cluster error sums fora speci�c clustering con�guration �, respectively, and 0 � � � 1is a scalar that determines the weight between these two sums. Theclustering balance E(�) has been formulated with the idea that intu-itively optimal clustering is achieved when the error sums have reachedequilibrium. We will concentrate on the special case for � = 1=2 whichprovides an even balance and accordingly assume thatE(�) = � + �: (7)Thus clustering behavior can be interpreted as a procedure seeking theglobal minimum of clustering balance. With the de�nitions of clusteringbalance based on the error sums, what follows will use the trade-o�between inter-cluster and intra-cluster balance to de�ne a measure forthe optimal clustering con�guration.3.2. Clustering GainThe clustering balance can be computed in each step of a hierarchicalclustering algorithm to determine the optimal number of clusters. How-ever, a major disadvantage is the high computational cost of computingclustering balance. In this section, we introduce clustering gain whichhas an interesting relation to cluster balance. In addition, clusteringgain is cheap to compute. Therefore, it can be computed in each step ofclustering process to determine the optimal number of clusters withoutincreasing the computational complexity.Clustering gain �j for Cj is de�ned as the di�erence between thedecreased inter-cluster error sum j compared to the initial stage andcluster.tex; 23/01/2002; 12:40; p.9

10
(a) No clustering has been conducted.
Co =
x 2
x 1 1X= C-
X
2 - oP1
2n
n-1
P
P
o1
C 2X=
( oC 1 Co2, )
1
X 2
(b) Clustering has been finished.
X
Co = (
P
0, 0)
X2x
x 1
2P
P 2P( j )P
( j )1
( j )
oP
( j )n
( j )
n-1
1Figure 2. Clustering gain de�ned by di�erence between error sums. (a) Initial con�gura-tion. (b) Final con�guration of cluster Cj .the increased intra-cluster error sum �j compared to the initial stage.Speci�cally, the gain is de�ned as�j = j � �j :In the above equation, an equal weighting factor, one, has been assignedto both error sums. Clustering gain is graphically illustrated in Figure 2using cluster con�gurations. In particular, the number of patterns ofthe �nal con�guration of cluster Cj can vary from 1 to n.The decreased portion of the inter-cluster error sum compared tothe initial stage is denoted by j = njXi=1 e(p(j)i ; p0)� e(p(j)0 ; p0)= njXi=1 kp(j)i � p0k22 � kp(j)0 � p0k22In addition, the increased portion of the intra-cluster error sum com-pared to the initial stage is de�ned by�j = njXi=1 e(p(j)i ; p(j)0 ) = njXi=1 kp(j)i � p(j)0 k22: (8)cluster.tex; 23/01/2002; 12:40; p.10
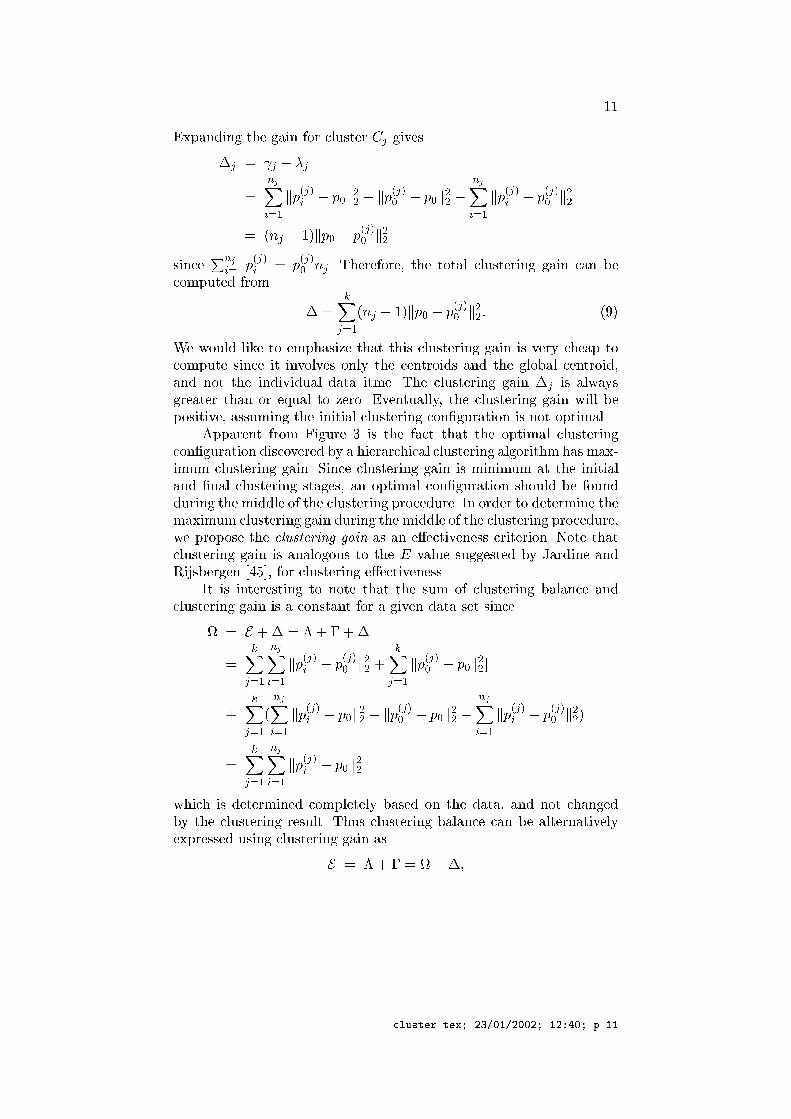
11Expanding the gain for cluster Cj gives�j = j � �j= njXi=1 kp(j)i � p0k22 � kp(j)0 � p0k22 � njXi=1 kp(j)i � p(j)0 k22= (nj � 1)kp0 � p(j)0 k22since Pnji=1 p(j)i = p(j)0 nj. Therefore, the total clustering gain can becomputed from � = kXj=1(nj � 1)kp0 � p(j)0 k22: (9)We would like to emphasize that this clustering gain is very cheap tocompute since it involves only the centroids and the global centroid,and not the individual data itme. The clustering gain �j is alwaysgreater than or equal to zero. Eventually, the clustering gain will bepositive, assuming the initial clustering con�guration is not optimal.Apparent from Figure 3 is the fact that the optimal clusteringcon�guration discovered by a hierarchical clustering algorithm has max-imum clustering gain. Since clustering gain is minimum at the initialand �nal clustering stages, an optimal con�guration should be foundduring the middle of the clustering procedure. In order to determine themaximum clustering gain during the middle of the clustering procedure,we propose the clustering gain as an e�ectiveness criterion. Note thatclustering gain is analogous to the E value suggested by Jardine andRijsbergen [45], for clustering e�ectiveness.It is interesting to note that the sum of clustering balance andclustering gain is a constant for a given data set since = E +� = �+ �+�= kXj=1 njXi=1 kp(j)i � p(j)0 k22 + kXj=1 kp(j)0 � p0k22]+ kXj=1( njXi=1 kp(j)i � p0k22 � kp(j)0 � p0k22 � njXi=1 kp(j)i � p(j)0 k22)= kXj=1 njXi=1 kp(j)i � p0k22which is determined completely based on the data, and not changedby the clustering result. Thus clustering balance can be alternativelyexpressed using clustering gain asE = �+ � = ��;cluster.tex; 23/01/2002; 12:40; p.11

120 20 40 60
0
5
10
15
20
25(a)
0 20 40 600
5
10
15
20
25(b)
0 20 40 60 800
0.5
1
1.5
2
2.5
3x 10
4 (c)
number of iterations0 20 40 60 80
0
0.5
1
1.5
2
2.5
3x 10
4 (d)
number of iterationsFigure 3. Clustering gain: the opposite concept of clustering balance. (a) Initial con�gura-tion of patterns. (b) Intuitively well clustered con�guration captured when clustering gainis maximized. (c) Clustering gain (d) The sum of clustering balance and clustering gain.where 0 � �;�;� � . Now, we are able to �nd an optimal clustercon�guration by tracing clustering gain instead of clustering balance.For visual demonstration, clustering gain � and the constant arecompared in Figure 3.In Tracking Algorithm, we summarize how we can obtain theoptimal cluster con�guration in a given hierarchical agglomerative clus-tering algorithm while keeping track of the cluster gain value. Notethat we need to keep track of the clustering gain �(�) since the globalmaximum value of clustering gain can be discovered only after theclustering is completed.Application of this method to hierarchical divisive clustering methodis straightforward. To demonstrate the performance of Tracking Al-gorithm, the optimal con�guration detected by the complete-link isvisualized in Figure 4. Clearly, the con�guration containing the lowestvalue of clustering balance coincides with the optimal con�gurationproduced by human being. Given the same input patterns, the sameoptimal con�guration has been obtained by popular agglomerative clus-tering algorithms including the single-link, the average-link and Ward'smethod.cluster.tex; 23/01/2002; 12:40; p.12

13Tracking Algorithm:1 Choose a hierarchical agglomerative clustering method(HACM)2 Do while clustering is not complete in HACM4 merge two clusters according tothe fusion rule of the HACM5 keep track of maximum value for �(�) and save �6 end while7 recover the optimal con�guration �
0 10 20 300
2
4
6
8
10
12(a)
0 10 20 300
2
4
6
8
10
12(b)
0 10 20 30 400
1000
2000
3000
4000(c)
number of iterations0 10 20 30 40
0
1000
2000
3000
4000(d)
number of iterationsFigure 4. Visual demonstration of optimal con�guration discovered by Tracking Algorithmusing the complete-link. (a) Initial con�guration. (b) Optimal con�guration. (c) Intra-clusterversus inter-cluster error sum. (d) Clustering balance.4. Performance Evaluation of Clustering AlgorithmsGiven a hierarchical clustering algorithm, either clustering balance orclustering gain can be used to �nd optimal con�guration. Since thesemeasures represent clustering optimality in an absolute value, theyalso can be used to compare various clustering algorithms in termsof clustering performance. To give an example we estimated the prac-tical distribution in high dimensionality using the method proposed byBennett [46]. The method is based on the observation that the variancecluster.tex; 23/01/2002; 12:40; p.13

140 1 2 3 4
0.5
1
1.5
2
2.5
3
3.5
4(a)
0 20 40 60 80 1000
20
40
60
80
100
120
140
(b)
0 1 2 3 40.5
1
1.5
2
2.5
3
3.5
4(c)
0 20 40 60 80 1000
20
40
60
80
100
120
140
(d)
number of clustersFigure 5. Comparison of the single-link and the average-link. (a) Optimal con�gurationfound by single-link. (b) Clustering balance versus the number of clusters in single-link. (c)Optimal con�guration found by average-link. (d) Clustering balance versus the number ofclusters in average-link.of the distance between patterns chosen randomly in a hyper-sphere isinversely proportional to the dimensionality m as follows.m x variance(a pair of patterns) ' constance:According to the equation, the higher the dimensionality is the smallerthe variance is. Thus clustering in high dimensional space can be simu-lated in two dimensional space if patterns are randomly and uniformlydistributed. Typically used agglomerative clustering algorithms havebeen applied to Tracking Algorithm, and then their optimal con�gura-tions and clustering balances are represented in Figure 5 and Figure 6.According to the results, the complete-link produces the con�gurationwith the lowest clustering balance. In the experiment, the complete-link outperformed other three clustering algorithms since it producesthe best con�guration given the same input patterns.To extend our approach to practical domain, we conducted a sim-ple experiment with practical document vectors. The documents havebeen downloaded from MEDLINE on-line library. They are dividedinto eight cancer categories including breast, colon, weightless, gly-colic, heart attack, oral, prostate and tooth-decay. Each category con-cluster.tex; 23/01/2002; 12:40; p.14

150 1 2 3 4
0.5
1
1.5
2
2.5
3
3.5
4(a)
0 20 40 60 80 1000
20
40
60
80
100
120
140
(b)
0 1 2 3 40.5
1
1.5
2
2.5
3
3.5
4(c)
0 20 40 60 80 1000
20
40
60
80
100
120
140
(d)
number of clustersFigure 6. Comparison of the complete-link and Ward's method. (a) Optimal con�gurationfound by the complete-link. (b) Clustering balance versus the number of clusters in thecomplete-link. (c) Optimal con�guration found by Ward's method. (d) Clustering balanceversus the number of clusters in Ward's method.tains 500 documents. After �ltering the document set using the sto-plist of SMART IR system and the stemming algorithm proposed byPorter [48], we applied Tracking Algorithm to the combination of Colonand Tooth categories. The results in Euclidean space are graphicallyillustrated in Figure 7. According to the results, optimal cluster con-�gurations can be found by our measure in Euclidean space.5. Estimation of the Optimal Number of Clusters forPartitional Clustering AlgorithmsA major problem accompanying the use of a partitional clustering al-gorithm is the choice of the number of desired output clusters [27] andorder dependency [13]. The sensitivity to the selection of the initialpartition is a problem in most partitional algorithms [2] since thepartitional clustering algorithms may converge to a local minimum ofthe criterion function if the initial partition is not properly chosen [2].For handling large data set and avoiding such sensitivity, many e�cientalgorithms have been proposed including CLARANS [19], BIRCH [47],CURE [23], and ROCK [24]. Many clustering algorithms have e�ciencycluster.tex; 23/01/2002; 12:40; p.15

16
0 10 20 30 40 50 60 70 80 90 1000
0.5
1
1.5
2
2.5
3
3.5x 10
4
number of clusters
Clustering by complete−link in Euclidean metric space:3154x100
Figure 7. Clustering balance, intra-cluster and inter-cluster squared error sums in Eu-clidean space.and capacity, but most partitional clustering algorithm depend on usersto determine the desired number of clusters.Even though exhaustive enumeration of all possible assignments isnot computationally feasible even for small numbers of patterns [12], wecan generate all possible cases with very small number of patterns suchas ten. In Figure 8, optimal con�gurations and their clustering balancesare compared with respect to ideal con�guration. For each possiblenumber of clusters, the lowest balance is presented in the part (a) ofthe �gure. According to the experimental results, the complete-linkdiscovered the optimal con�guration as closely as the ideal. However, itis risky to generalize this result so that the complete-link is superior toall other algorithms for all input patterns since clustering performancemay change in accordance with the distribution of the input patterns. Ahierarchical clustering algorithm is considered as the best if it producesthe lowest clustering balance given particular data patterns.As we previously described, the best con�guration can be selectedamong optimal con�gurations produced by hierarchical clustering algo-rithms. Consequently, the desired number of clusters can be estimatedfrom the best con�guration. Also the centroids of the best con�gurationcan be fed to partitional clustering algorithms to avoid random initialassignments for centroids. The basic assumption of this approach is thatthe best cluster con�guration, the winner among con�gurations pro-duced by hierarchical clustering algorithms, will be an approximationof the ideal cluster con�guration for partitional clustering.cluster.tex; 23/01/2002; 12:40; p.16

170 0.2 0.4 0.6 0.8 1
0
0.5
1(a1)
2 4 6 8 10
1
1.5(a2)
0 0.2 0.4 0.6 0.8 10
0.5
1(b1)
2 4 6 8 10
1
1.5(b2)
0 0.2 0.4 0.6 0.8 10
0.5
1(c1)
2 4 6 8 10
1
1.5(c2)
0 0.2 0.4 0.6 0.8 10
0.5
1(d1)
2 4 6 8 10
1
1.5(d2)
0 0.2 0.4 0.6 0.8 10
0.5
1(e1)
optimal configurations2 4 6 8 10
1
1.5(e2)
number of clustersFigure 8. Comparison of currently used agglomerative clustering algorithms to the optimalclustering by using cluster con�gurations and clustering balances. (a) The optimal (b) Thesingle-link (c) The average-link (d) The complete-link (e) Ward's method.It is clear that the estimated number is not the true value. How-ever, the estimated number can contribute to decision of the range ofthe true number of optimal clusters. To verify this assumption exper-imentally, we applied k-means algorithm with all possible number ofclusters. The averaged clustering balance produced by the k-means isdepicted in Figure 9 along with the number of clusters. In this experi-ment, the clustering balance is the average of �ve trials. According tothe experimental results, the desired number of clusters for the givendistribution is nine. When we apply Tracking Algorithm to four pop-ular algorithms including single-link, average-link, complete-link andWard's method, corresponding optimal con�gurations are found as inTable I. Surprisingly, the number of clusters produced by the complete-link is equivalent to the desired number of clusters obtained by k-meansusing all possible k values. This result convincingly illustrates that ourclustering measure can be used for partitional algorithms to estimatethe number of desired clusters. In addition, more stable con�gurationand improved performance are demonstrated in Figure 10. When thenumber of desired clusters and initial centroids are estimated, k-meansis able to converge quickly.cluster.tex; 23/01/2002; 12:40; p.17

18
0 1 2 3 40.5
1
1.5
2
2.5
3
3.5
4(a)
0 20 40 60 80 10020
40
60
80
100
120
140
160(b)
number of clustersFigure 9. The optimal con�guration and clustering balance traced by k-means. (a) Opti-mal con�guration. (b) Averaged clustering balance of all possible number of clusters usingk-means.Table I. Comparison of lowest balancesalgorithms the lowest balance the highest gain number of clustersSingle-link 49.8603 100.139651 21Average-link 29.2123 120.787653 10Complete-link 27.0904 122.909583 9Ward's Method 29.2292 120.770844 10For k-medoid algorithm, the results are almost the same as k-means algorithm except some uctuations of clustering balance beforeconvergence. This result is normal since centroids and medoids are lo-cated di�erently in the same feature space. As a result, the best clustercon�guration found by hierarchical clustering algorithms contributesto determining the desired number of clusters and the initial centroidsfor partitional clustering algorithms.6. ConclusionClustering is not a new technique in computer related disciplines. How-ever, a huge demand for clustering technique represented by a variety
cluster.tex; 23/01/2002; 12:40; p.18

19
0 1 2 3 40.5
1
1.5
2
2.5
3
3.5
4(a)
1 1.5 2 2.5 326
26.1
26.2
26.3
26.4
26.5
26.6
26.7
26.8
26.9
27
iterations
(b)
Figure 10. Additional clustering optimization and quick convergence. (a) Optimal con�g-uration found by a hierarchical clustering algorithm. (b) Improved clustering performance.of clustering applications demonstrates its importance. Recently, muche�ort has been presented to achieve clustering e�ciency and scalabil-ity. In this paper, we proposed a measure for optimal clustering. Wede�ned clustering balance using the squared error sums. By searchingthe compromising point between intra-cluster and inter-cluster errorsums, we are able to detect the optimal clustering con�guration forany hierarchical clustering algorithms. For the purpose of �nding anoptimal con�guration, an agglomerative clustering recovers the clustercon�guration with the minimum clustering balance.Our approach is quite di�erent from other traditional approaches.We evaluates clustering optimality using only internal properties ofclusters and successfully achieves intuitive agreement for clusteringoptimality. In particular, the number of desired clusters and initialcentroids can be estimated from the optimal cluster con�guration, andprovided to non-hierarchical partitional clustering methods. As a result,partitional clustering algorithms are able to converge more quicklyand give lower clustering balance than those without our clusteringmeasure.When it comes to classi�cation, multiple centroids in a class canbe found using our clustering measure since each class in turn is acluster. It is natural to assume that those centroids provides us withmore accurate information describing the internal structure of a classthan that represented by only one centroid. Therefore, we believe thatclassi�cation performance will be enhanced if we exploit our cluster-ing measure to �nd optimal sub-centroids in each class. The basiccluster.tex; 23/01/2002; 12:40; p.19

20rationale of improved classi�cation is that classi�cation performance iscontributed by comparing test data to multiple centroids instead of thesingle centroid. Therefore, we expect that many unknown contributionsof our approach will be discovered in various applications of clusteringwhile our clustering measure consistently gives feasible solutions tooptimal clustering. References1. E. Gose, R. Johnsonbaugh and S. Jost, Pattern Recognition & Image Analysis,Prentice Hall, Upper Saddle River, NJ, 19962. A.K. Jain and M.N. Murty and P.J. Flynn, `Data Clustering: A Review', ACMComputing Surveys, Vol.31 no.3, pp. 264{323, 19993. E. Sha�er, R. Dubes and A.K. Jain, `Single-link Characteristics of a Mode-seeking Algorithm', Pattern Recognition, Vol.11, pp. 65{73, 19794. J. Kittler, `A Locally Sensitive Method for Cluster Analysis, Pattern Recogni-tion, Vol.8, pp. 22{33, 19765. C.T. Zahn, `Graph-theoretical methods for Detecting and Describing GestaltClusters, IEEE Transactions on Computers, Vol.20, pp. 68{86, 19716. R. Urquhart, `Graph Theoretical Clustering based on limited neighborhood sets,Pattern Recognition, Vol.15, pp. 173{187, 19827. K.C. Gowdar and G. Krishna, `Agglomerative Clustering using the Concept forMultispectral Data, Pattern Recognition, Vol.10, pp. 105{112, 19788. M.R. Anderberg, Cluster Analysis for Applications, Academic Press, New York,19739. M. Abramowtiz and I.A. Stegun, Handbook of Mathematical Functions with For-mulas, Graphics and Mathematical Tables, US Govt. Printing O�ce, Washington,D.C., 196810. J.J. Fortier and H. Solomon, Clustering Procedures, In Multivariate Analysis,P. R. Krishnaiah, editor. Academic Press, Inc., New York, NY, pp. 493{506, 196611. R.E. Jensen, `A Dynamic Programming Algorithm for Cluster Analysis',Operations Research, Vol.17, pp. 1034{1057, 196712. A.K. Jain and R.C. Dubes, Algorithms for Clustering Data, Prentice Hall,Englewood Cli�s, NJ, 198813. P. Willet, `Recent Trends in Hierarchic Document Clustering: A Critical Re-view, Information Processing and Management, Vol.24 no.5, pp. 577{597,198814. R.C. Jancey, `Multidimensional Group Analysis', Austral. J. Botany,Vol.14 no.1, pp. 127{130, 196615. J.B. MacQueen, `Some Methods for Classi�cation and Analysis of MultivariateObservations', In the Fifth Berkeley Symposium on Mathematical Statistics andProbability, Vol.1, AD 669871, Univ. of California Press, Berkeley, pp. 281{297,196716. R. Sibson:73, `SLINK: an Optimally E�cient Algorithm for the Single-linkCluster Method', Computer Journal, Vol.16, pp. 30{34, 197317. D. Defays, `An E�cient Algorithm for a Complete Link Method', ComputerJournal, Vol.20, pp. 364{366, 1977cluster.tex; 23/01/2002; 12:40; p.20

2118. W.H.E. Day and H. Edelsbrunner, `E�cient Algorithms for Agglomerative Hi-erarchical Clustering Methods', Journal of Classi�cation, Vol.1 no.1, pp. 7{24,198419. R.T. Ng and J. Han G., `E�cient and E�ective Clustering Methods for SpatialData Mining', In Proceedings of the 20th VLDB Conference, Santiago, Chile, 199420. E.M. Voorhees, `Implementing Agglomerative hierarchical Clustering Algo-rithms for use in Document Retrieval', Information Processing and Management,Vol.22, Pergamon Press Ltd., Great Britain, pp. 465{476, 198621. X. Li, `Parallel Algorithms for Hierarchical Clustering and Cluster Validity',IEEE Transactions on Pattern Analysis and Machine Intelligence,Vol.12 no.11,pp. 1088{1092, 199022. P. Bradley and U. Fayyad and C. Reina, `Scaling Clusterin Algorithms to LargeDatabases', Knowledge Discovery and Data Mining, 199823. S. Guha and R. Rastogi and K. Shim, `CURE: An E�cient Clustering Al-gorithm for large Databases', In ACM-SIGMOD Int. Conf. on Management ofData, Seattle, WA. USA, pp. 73{84, 199824. S. Guha and R. Rastogi and K. Shim, `ROCK: A Robust Clustering Algorithmfor Categorical Attributes', In the 15th Int. Conf. on Data Eng., 199925. V. Ganti and R. Ramakrishnan and J. Gehrke, `Clustering Large Datasets inArbitrary Metric Spaces', ACM, 200026. M. Charikar and C. Chekuri and T. Feder and R. Motwani, `IncrementalClustering and Dynamic Information Retrieval', In STOC'97, El Paso, Texas,USA, pp. 153-180, 199727. R.C. Dubes, `How many Clusters are best? { an experiment', Pattern Recog-nition, Vol.20 no.6, pp. 645{663, 198728. G.W. Milligan and M.C.Cooper, `An Examination of Procedures for Detectingthe number of Clusters in a data set', Psychometrika, Vol.50, pp. 159{179, 198529. J.T. Tou and R.C. Gonzalez, Pattern Recognition Principles, Addison-Wesley,Miami, FL, 197430. B. Everett, Cluster Analysis, Addison-Wesley, New York, 197531. D.L. Boley, `Principal Direction Divisive Partitioning', Data Mining andKnowledge Discovery, Vol.2 no.4, pp. 325{344, 199832. B. Mirkin and I. Muchnik, Combinatorial Optimization in Clustering, InHandbook of Combinatorial Optimization, D.Z. Du and P.M. Pardalos, KluwerAcademic Publishers, pp. 261{329, 199833. G. Karypis and E.S. Han and V. Kumar, `CHAMELEON: A Hierarchical Clus-tering Algorithm Using Dynamic Modeling', IEEE Computer: Special Issue onData Analysis and Mining, Vol. 32 no. 8, pp 68-75, 199934. B.S. Duran and P.L. Odell, Cluster Analysis: A Survey, Springer-Verlang,Berlin, 197735. E. Diday and J.C. Simon, Clustering Analysis, In Digital Pattern Recognition,K.S. Fu, Ed., Springer-Verlag, Secaucus, NJ, pp. 47{94, 197636. M.R. Garey and D.S. Johnson, Computers and Intractability: a guide to thetheory of NP-completeness, W.H.Freeman and Company, San Francisco, CA, 197937. P. Crescenzi and V. Kann, A compendium of NP optimization problems, URLsite:http://www.nada.kth.se/~viggo/problemlist/compendium2, 199538. J.H.Jr. Ward, `Hierarchical Grouping to Optimize an Objective Function',Journal of the American Statical Association, Vol.58, pp. 236{244, 196339. E.W. Forgy, `Cluster Analysis of Multivariate Data: E�ciency Versus In-terpretability of Classi�cation', In Biometric society meetings, Reverside, CA,Abstract in Biometrics Vol.21 No.3, pp. 768, 1965cluster.tex; 23/01/2002; 12:40; p.21

2240. G.S. Sebestyen, `Pattern Recognition by an Adaptive Process of Sample SetConstruction, IRE Trans. on Info. Theory, Vol.IT-8, Sep., 196241. J.B. MacQueen, `Some Methods for Classi�cation and Analysis of MultivariateObservations', In Wester Management Science Inst., University of California,pp. 96, 196642. G.H. Ball and D.J. Hall, `Some Fundamental Concepts and Synthesis Pro-cedures for Pattern Recognition Preprocessors', In International Conference onMicrowaves, Circuit Theory, and Information Theory, 196443. L. Kaufman and P.J. Rousseeuw, Finding Groups in Data: an Introduction toClustering Analysis, Academic Press, San Diego, CA, 199044. E. Rasmussen, Clustering Algorithms, In Information Retrieval: Data Struc-tures and Algorithms, W.B. Frakes and R. Baeza-Yates, Eds., Prentice-Hall, Inc.,Upper Saddle River, NJ, pp. 419{442, 199245. N. Jardine and C.J. Rijsbergen, `The Use of Hierarchical Clustering in In-formation Retrieval', Information Storage and Retrieval, Vol.7, pp. 217{240,197146. R.S. Bennett, `The Intrinsic Dimensionality of Signal Collections', IEEETransactions on Information Theory, Vol.15, pp. 517{525, 196647. T. Zhang and R. Ramakrishnan and M. Livny, `BIRCH: An e�cient dataclustering method for very large databases', SIGMOD Rec., Vol.25 No.2,pp. 103{114, 199648. M. F. Porter, `An Algorithm for Su�x Stripping', Program, Vol.14 No.3,pp. 130{137, 1980
cluster.tex; 23/01/2002; 12:40; p.22