deception and misreporting in a social program · pdf filedeception and misreporting in a...
TRANSCRIPT
Deception and Misreporting in a SocialProgram
César Martinelli and Susan W. Parker�
June 16, 2006
Abstract
We investigate empirically the extent of misreporting in a poverty-alleviation program in which self-reported information, followed by ahousehold visit, is used to determine eligibility. Underreporting maybe due to a deception motive, and overreporting to an embarrassmentmotive. We �nd that underreporting of goods and desirable homecharacteristics is widespread, and that overreporting is common withrespect to goods linked to social status. Larger program bene�ts en-courage underreporting and discourage overreporting. The e¤ect ofbene�ts on underreporting is signi�cant under a variety of speci�-cations. We also investigate the e¤ects of education and gender onmisreporting.
�Martinelli: Centro de Investigación Económica, Instituto Tecnológico Autónomo deMéxico, Camino Santa Teresa 930, 10700 México DF ([email protected]); Parker: Di-visión de Economía, Centro de Investigación y Docencia Económicas, Carretera México-Toluca 3655, 01210 México DF ([email protected]).

1 Introduction
Targeted poverty-alleviation programs rely on the ability to identify the poorpopulation from the non-poor. The costs of identifying the poor are presum-ably larger in developing countries, where variables such as income cannotbe independently veri�ed (for example through tax institutions). As a con-sequence, targeted programs in developing countries usually rely on informa-tion provided by the applicants. It is widely believed that the incentives forunderreporting of economic conditions in this context are quite large. Nev-ertheless, to our knowledge, no previous research has analyzed the extentto which individuals misreport their characteristics when applying for socialprograms. This lack of research is because the data requirements are severe,e.g. information is needed on what an individual reports to a governmentagency when applying for a program, as well as independent informationon the �true� characteristics of the individual. Such information has beenrarely, if at all, available. In this paper, we employ a very unusual data-base from Oportunidades, the Mexican government main poverty-alleviationscheme, to explore quantitatively the extent and causes of misreporting insocial programs.Economists usually assume that individuals tell the truth only if this is
incentive-compatible given the material outcomes. According to conventionalassumptions, applicants to a social program will understate their materialpossessions, so long as this increases the probability of bene�tting from theprogram. A corollary of this view is that underreporting should be madecostly by the program requirements.1 If underreporting is not costly, wecan expect potential bene�ciaries to display a strategic bias toward decep-tion. Ethical considerations may act as a counterweight,2 however, so thatthe willingness of individuals to deceive for advantage is worth exploringquantitatively.Research in participation in welfare programs reminds us that very often
individuals do not apply to a program even if participation seems convenientgiven the material outcomes. This has been interpreted by Mo¢ tt (1983) andothers as the result of a social �stigma�or utility loss associated with par-
1See e.g. Besley and Coate (1992, 1995).2See Bok (1999) for a thoughtful review of the positions of moral philosophers about
deception, and the recent article by Gneezy (2005) for some experimental evidence.
1

ticipation.3 By analogy, we may expect that even some individuals who arewilling to apply may have a bias toward overreporting due to embarrassmentor stigma associated with the lack of certain material goods.We use a database from the Mexican program Oportunidades to estimate
a model of reporting in the context of social programs that encompassesboth deception and embarrassment considerations. When this program wasintroduced in urban localities in 2002, an advertising campaign was carriedout to inform potential applicants that registration centers for the programwould open during certain dates. Applicants who turned up at the regis-tration centers were asked to provide information on their address and ontheir household characteristics. Eligibility into the program was determinedusing the household characteristics to compute a household poverty index.4
Applicants initially found to be eligible received a household visit during thecoming weeks to verify the information given, after which a �nal classi�cationon eligibility was made.Our database is rather unique in that it includes not only what individuals
reported at the registration center but also what they were actually foundto have during the household visit for over a million households. Thus, wecan check whether applicants reported correctly, understated or overstatedtheir possessions in answering the questionnaire. Since we can calculate thebene�ts for each applicant according to program rules, we have informationabout what was at stake for each applicant.We �nd that underreporting is widespread in every item we investigate.
Overreporting is common in goods that may have a �status� value. Bothunderreporting and overreporting are clearly sensitive to material incentives.Larger program bene�ts encourage underreporting and discourage overre-porting. Quantitatively speaking, though, the impact of program bene�ts onmisreporting is not overwhelming at the margin. As an illustration, increas-ing in 50% the monetary bene�ts from the program (which were close to 26%
3Riphahn (2001) provides some recent evidence on widespread lack of participationin social programs by potential bene�ciaries. See also Currie (2004) for a review of theliterature on take up.
4The weights attached to each answer in the household poverty index were previouslydetermined using a poverty regression similar to the methodology described by Ravallion(1996). The methodology was public (Reglas de Operación 2002) but no the speci�cweights.
2

of the households�preprogram expenditure) would increase underreportingin a few percentage points, and would have an even smaller impact in deter-ring overreporting. There is also evidence that there are forces at work otherthan material incentives in the decision to misreport or report accurately. Forinstance, education discourages underreporting and, very clearly, encouragesoverreporting. This is interesting because education may be linked to social-ization and therefore to sensitivity to status considerations. Finally, maleapplicants underreport more and overreport less than female applicants withrespect to �status�goods.The results suggest that the use of self-reported household characteristics
in targeting poverty-alleviation programs can be improved upon by takinginto account both under and overreporting in the allocation of weights tohousehold characteristics. For instance, the eligibility index employed byOportunidades o¢ cials gave some weight to gas boilers, cars, trucks, andwashing machines, all items for which underreporting was rampant. Theindex also gave weight to toilets, tap water, and concrete �oor, items forwhich overreporting was common. While underreporting may have beencorrected at the household visit stage, overreporting is worrisome because itmay have led to the exclusion of the program of households that could qualifyin principle. It is also a problem that is harder to deal with: If a povertyindex accurately identi�es goods whose absence is a clear indicator of poverty,it is also probably identifying goods associated with a higher social status.At a broader level, there has recently been a surge of interest by econo-
mists on the issue of deception in a variety of contexts.5 The experimentalwork of Gneezy (2005) shows that in two-party interactions people care bothabout their own gains and about the losses to the other party in decidingwhether to deceive. Other experimental studies reviewed by Croson (2005)reveal that deception is widespread and that generally individuals are notsu¢ ciently skeptical of statements they receive from others. Our setup isdi¤erent in that individuals� deceptive behavior does not create losses foranother easily identi�ed individual. Our results on the impact of monetarypayo¤s on the willingness to deceive may be of particular interest given thehigh stakes involved for applicants in our database.
5Including among others Crawford (2003), Chen (2005), Ettinger and Jehiel (2006),and Kartik, Ottaviani and Squintani (2006).
3

Table IMisreporting in Oportunidadesa
Underreporting Overreporting Households
(as % of Households (as % of Households Having Good
Good Having Good) Not Having Good) (as % of Total)
Concrete Floor 14.45 25.41 64.25Tap Water 13.79 31.76 70.27Toilet 16.58 39.07 73.08Gas Boiler 73.12 1.07 3.22Washing Machine 53.46 6.20 8.49Phone 73.12 1.34 2.64Car 83.10 0.80 1.54Truck 81.71 0.61 1.53Satellite TV 73.91 1.74 2.32Water Tank 58.44 3.80 5.18Refrigerator 36.93 12.05 27.07Gas Stove 24.25 28.56 48.40Video Recorder 79.73 1.98 3.25
aObservations: 74034. Source: ENCASURB.
Overreporting may be due at least in part to inaccurate beliefs similar tothe overcon�dence or �self-serving bias�described by Babcock and Loewen-stein (1997) and Camerer (1997) in other contexts. Overreporters may feelbetter about themselves by believing that their house �oor is accurately de-scribed as mostly covered by concrete rather than dirt, even if an �impartial�observer, such as the visitor sent by the program, may disagree.
2 Evidence on Misreporting
Table I provides evidence on misreporting in Oportunidades from a randomsample of 101,803 applicants (10% of the applicants interviewed at the reg-istration centers in 2002). Out of this sample, 74,034 applicants initiallyquali�ed and received a household veri�cation visit. We have calculated un-der and overreporting as follows. For each of the goods or desirable householdcharacteristics g, let Ag be the set of applicants who asserted having the good
4
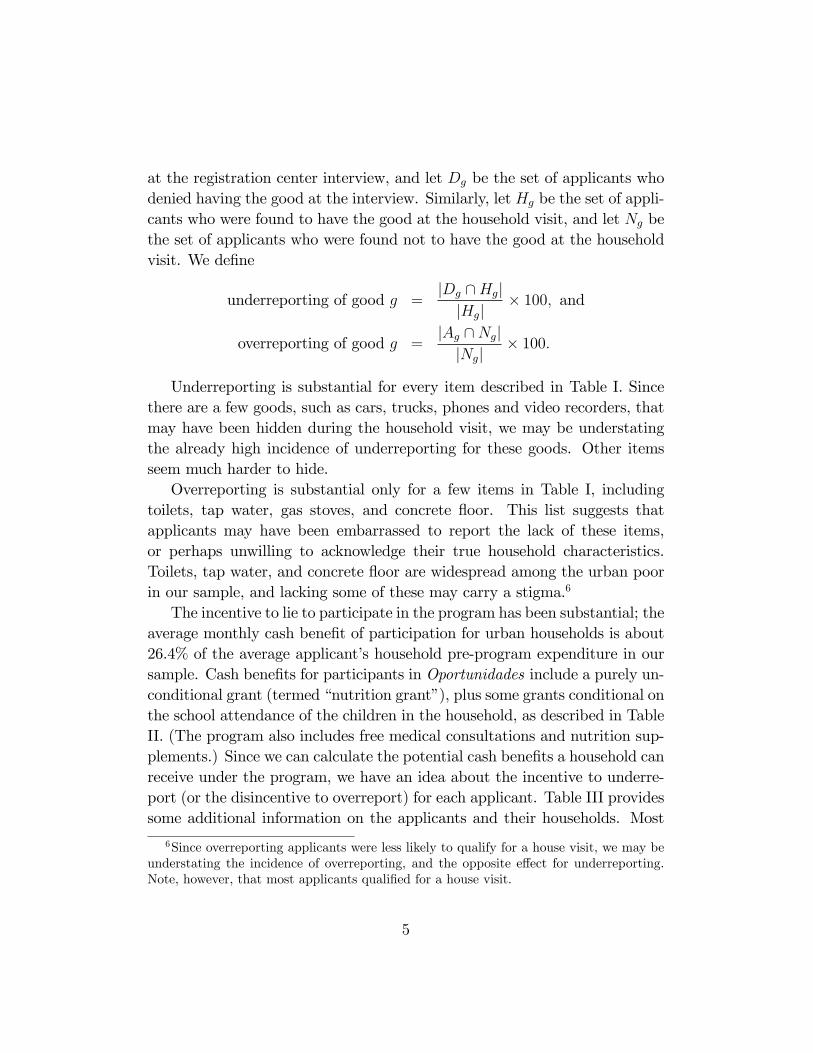
at the registration center interview, and let Dg be the set of applicants whodenied having the good at the interview. Similarly, let Hg be the set of appli-cants who were found to have the good at the household visit, and let Ng bethe set of applicants who were found not to have the good at the householdvisit. We de�ne
underreporting of good g =jDg \HgjjHgj
� 100; and
overreporting of good g =jAg \NgjjNgj
� 100:
Underreporting is substantial for every item described in Table I. Sincethere are a few goods, such as cars, trucks, phones and video recorders, thatmay have been hidden during the household visit, we may be understatingthe already high incidence of underreporting for these goods. Other itemsseem much harder to hide.Overreporting is substantial only for a few items in Table I, including
toilets, tap water, gas stoves, and concrete �oor. This list suggests thatapplicants may have been embarrassed to report the lack of these items,or perhaps unwilling to acknowledge their true household characteristics.Toilets, tap water, and concrete �oor are widespread among the urban poorin our sample, and lacking some of these may carry a stigma.6
The incentive to lie to participate in the program has been substantial; theaverage monthly cash bene�t of participation for urban households is about26.4% of the average applicant�s household pre-program expenditure in oursample. Cash bene�ts for participants in Oportunidades include a purely un-conditional grant (termed �nutrition grant�), plus some grants conditional onthe school attendance of the children in the household, as described in TableII. (The program also includes free medical consultations and nutrition sup-plements.) Since we can calculate the potential cash bene�ts a household canreceive under the program, we have an idea about the incentive to underre-port (or the disincentive to overreport) for each applicant. Table III providessome additional information on the applicants and their households. Most
6Since overreporting applicants were less likely to qualify for a house visit, we may beunderstating the incidence of overreporting, and the opposite e¤ect for underreporting.Note, however, that most applicants quali�ed for a house visit.
5

Table IIMonthly Cash Benefits of Oportunidadesa
Grants Nutrition Grant 150Education Grants: Grade Boys GirlsPrimary 3 100 100
4 115 1155 150 1506 200 200
Middle School 7 290 3108 310 3409 325 375
High School 10 490 56511 525 60012 555 635
Maximum Transfer With High-School Children 1550to Household Other Households 915Average Transferb 350
aIn Mexican pesos (2002); 11 pesos is approx. US$1. bUrban households (2003).
Table IIIApplicants and their Householdsa
Veri�ed Group Not Veri�ed GroupHousehold Characteristics Mean Std. Dev. Mean Std. Dev.Total Monthly Expenditure (pesos) 1312 766 1405 735Per Capita Expenditure (pesos) 319 193 382 219Family Size 4.54 1.93 4.05 1.73Children from 0 to 5 0.77 0.87 0.49 0.71Children from 6 to 21 1.90 1.54 1.63 1.37
Applicant Characteristics Mean Std. Dev. Mean Std. Dev.Gender (Female=1) 0.94 0.23 0.94 0.24Age 38.21 14.46 40.47 14.43Education 4.44 3.39 5.05 3.49Working 0.27 0.44 0.27 0.44Married 0.47 0.50 0.50 0.50Cohabitating 0.22 0.42 0.16 0.36Look very poor to interviewer 0.37 0.48 0.24 0.43
aObservations: 74034 veri�ed and 10424 not veri�ed applicants. Source: ENCASURB.
6

applicants are women, which is consistent with the fact that the transfersunder the program are paid to the mother of the household.Our data source is the ENCASURB (Encuesta Socio-Económica de los
Hogares Urbanos), the survey used to establish eligibility for Oportunidadesfor urban households. The ENCASURB consists of three related question-naires. The �rst is the �inclusion questionnaire�which was applied to ap-plicants at the registration center. Applicants were informed whether theyqualify or not on the spot. Applicants who quali�ed for a household visit, anda large fraction of those who did not, were asked to answer a second question-naire about themselves and their households. Finally, applicants who wereinitially declared eligible were informed that they would receive a householdvisit in the next two or three weeks. A �veri�cation questionnaire� (sim-ilar to the inclusion questionnaire) was applied during the household visit.Applicants were required to let interviewers into their households to visuallyinspect their belongings. Table I employs the answers to the �rst and thirdquestionnaire, and Table III the answers to the second.In the next section, we model the decision about reporting of an appli-
cant who understands that these reports are used to determine whether herhousehold quali�es or not for a social program.
3 Misreporting and Incentives
Consider an applicant to a social program who is asked to answer a question-naire about whether the applicant�s household has or not some goods or de-sirable characteristics (e.g. phone, tap water, concrete �oor, etc.). Denotingapplicants by a = 1; : : : ; n and goods by g = 1; : : : ;m, the report of appli-cant a is a vector (rag)mg=1 2 f0; 1gm, where rag = 1 means �yes�and rag = 0means �no.�In answering the questionnaire, applicant a is aware of the trueanswers to the questions, which are represented by (tag)mg=1 2 f0; 1gm. We saythat applicant a overreports, underreports or reports truthfully with regardto good g if rag > tag, rag < tag, or rag = tag, respectively.Eligibility into the program is determined in the following manner. There
is a vector of weights assigned to each good (!g)mg=1 2 <m+ , and a cuto¤ � � 0(the �poverty line�). With probability 1 � �, the applicant is eligible forthe program if
Pg !grag � �. With probability �, the applicant is eligible if
7
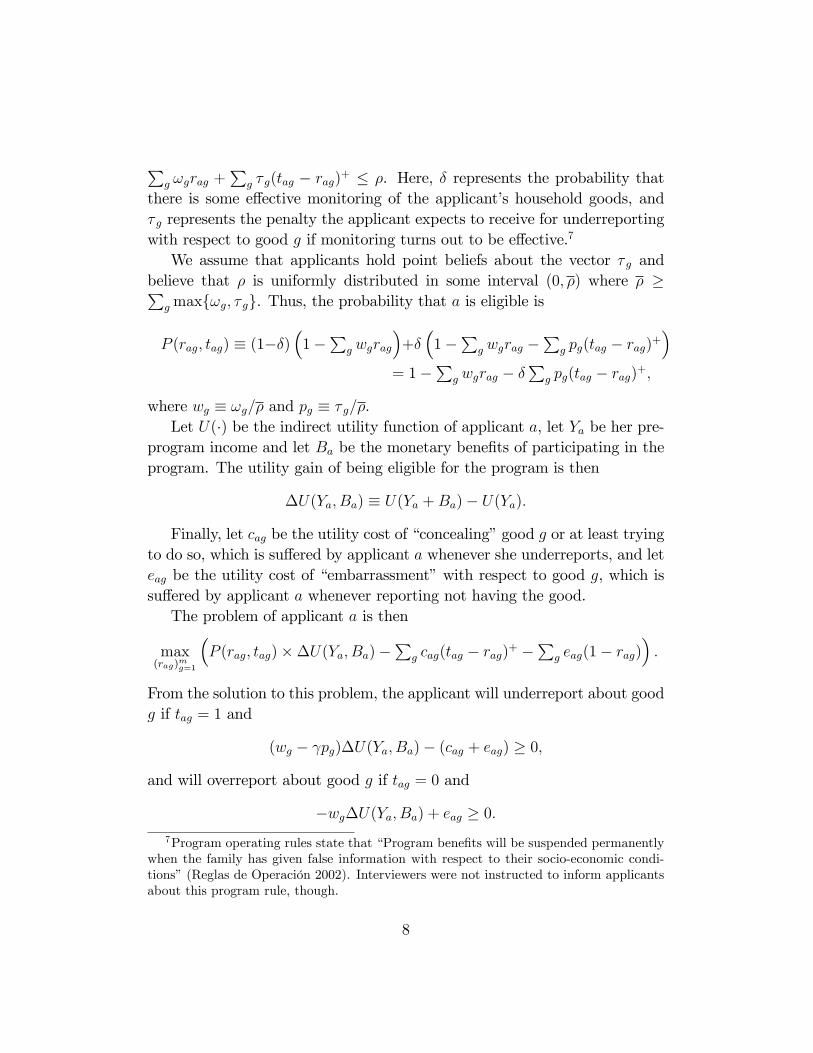
Pg !grag +
Pg � g(tag � rag)+ � �. Here, � represents the probability that
there is some e¤ective monitoring of the applicant�s household goods, and� g represents the penalty the applicant expects to receive for underreportingwith respect to good g if monitoring turns out to be e¤ective.7
We assume that applicants hold point beliefs about the vector � g andbelieve that � is uniformly distributed in some interval (0; �) where � �P
gmaxf!g; � gg. Thus, the probability that a is eligible is
P (rag; tag) � (1��)�1�
Pg wgrag
�+��1�
Pg wgrag �
Pg pg(tag � rag)+
�= 1�
Pg wgrag � �
Pg pg(tag � rag)+;
where wg � !g=� and pg � � g=�.Let U(�) be the indirect utility function of applicant a, let Ya be her pre-
program income and let Ba be the monetary bene�ts of participating in theprogram. The utility gain of being eligible for the program is then
�U(Ya; Ba) � U(Ya +Ba)� U(Ya):
Finally, let cag be the utility cost of �concealing�good g or at least tryingto do so, which is su¤ered by applicant a whenever she underreports, and leteag be the utility cost of �embarrassment�with respect to good g, which issu¤ered by applicant a whenever reporting not having the good.The problem of applicant a is then
max(rag)mg=1
�P (rag; tag)��U(Ya; Ba)�
Pg cag(tag � rag)+ �
Pg eag(1� rag)
�:
From the solution to this problem, the applicant will underreport about goodg if tag = 1 and
(wg � pg)�U(Ya; Ba)� (cag + eag) � 0;
and will overreport about good g if tag = 0 and
�wg�U(Ya; Ba) + eag � 0:7Program operating rules state that �Program bene�ts will be suspended permanently
when the family has given false information with respect to their socio-economic condi-tions�(Reglas de Operación 2002). Interviewers were not instructed to inform applicantsabout this program rule, though.
8

We assume that applicants have a constant relative risk aversion utilityfunction with risk parameter �; that is8
�U(Ya; Ba) =
�((Ya +Ba)
1�� � Y 1��a )=(1� �) if � 6= 1ln(1 +Ba=Ya) if � = 1:
We assume further that cga and ega depend linearly on a vector of observ-able applicant characteristics Xa and a random term; that is
cag = ��cg � cgXa + �ag and eag = �eg � egXa + �ag;
where �ag and �ag are random terms. Thus, applicant a will underreportabout good g if tag = 1 and
(1) �1g + �1g�U(Ya; Ba) + 1gXa � �1g;
and will overreport about good g if tag = 0 and
(2) �2g + �2g�U(Ya; Ba) + 2gXa � �2g;
where �1g = �cg��eg, �1g = wg��pg, 1g = cg� eg, �1g = �ga+�ga, �2g = �eg,�2g = �wg, 2g = eg, and �2g = ��ga. Under appropriate assumptions on therandom terms, and under the assumption that household visits were in facte¤ective in monitoring misreporting, equations (1) and (2) can be estimatedusing logistic regressions.
4 Empirical Analysis
We have estimated equations (1) and (2) for di¤erent values of the risk-aversion coe¢ cient using the data from ENCASURB. We take Ya to be theexpenditure per capita in the household of the applicant, as reported in thesecond questionnaire, and Ba to be the cash bene�t from the program forthe household in per capita terms, calculated using the structure of programbene�ts and the age and schooling levels of household members. By the timethe information on expenditure was collected, applicants knew that they
8We are sidestepping for simplicity the issue of the di¤erent horizon of bene�ts fordi¤erent applicants.
9

quali�ed for the program and knew also that reported expenditure was notamong the criteria for participation in the program. Nevertheless, we maythink that a person that under or overreported with respect to goods may beinclined to do the same with respect to expenditure. We thus include amongour estimations the case of risk-neutrality (� = 0), in which the utility gainof participating is just the bene�ts from the program for the household inper capita terms.The independent variables included in the regressions, other than the
utility gain �U(Ya; Ba), are age of the applicant, years of education, gender,whether the applicant works outside his or her house, whether the applicantspeaks an indigenous language, per capita expenditure in the applicant�shousehold, and a set of dummies re�ecting subjective judgements of the in-terviewer: whether the applicant looks �very poor,� �somewhat poor,� or�not poor,� and whether the applicant seems to understand the question-naire.910 We also include registration center �xed e¤ects, in an attempt todeal with unobserved heterogeneity both in who attends di¤erent registrationcenters and in treatment of applicants across centers.Table IV provides maximum likelihood logit estimates of �1g and �2g
for di¤erent goods, using as samples respectively those households who werefound to have the good and those households who were not. Estimates in Ta-ble IV are provided for � = 1, which is an intermediate value of risk-aversionamong those we explored (we return below to the issue of the appropriatevalue of the risk-aversion parameter).In agreement with the model, �̂1g is positive and signi�cant in almost
every item for both sets of estimations. The results are thus very supportiveof the e¤ect of bene�ts in encouraging underreporting. Note that the fewitems in which the model performs badly, such as phones and trucks, areamong those in which the assumption of e¤ective monitoring of underreport-ing is suspect.Also in agreement with the model, �̂2g is negative in almost every item.
9Interviewers were also asked if they thought the applicants were lying. Consistentwith the evidence that individuals are bad at detecting the deception of others (Croson2005), interviewers answered that they thought they were told the truth in 98.64% of thecases.10It is unlikely to be a misreporting problem for these independent variables, except for
expenditure and perhaps education.
10

Table IVEstimated Coefficient of Program Benefits on Misreportinga
Underreporting Equation Overreporting EquationWithout Reg. Center Without Reg. Center
Good Fixed E¤ects Fixed E¤ects Fixed E¤ects Fixed E¤ectsConcrete Floor 0.2276 0.2210 -0.0654 -0.1435
(0.0549) (0.0576) (0.0590) (0.0621)Tap Water 0.2073 0.1447 -0.0322 -0.0876
(0.0536) (0.0566) (0.0591) (0.0668)Toilet 0.1602 0.1528 -0.1287 -0.0959
(0.0486) (0.0526) (0.0614) (0.0663)Gas Boiler 0.8035 0.5357 -0.3022 -0.2430
(0.2534) (0.2786) (0.1744) (0.1787)Washing Machine 0.3853 0.1309 -0.3672 -0.0743
(0.1278) (0.1383) (0.0775) (0.0790)Phone -0.1175 -0.5016 -0.3050 -0.1027
(0.2547) (0.2947) (0.1554) (0.1587)Car 1.5715 0.4476 -0.3194 -0.1887
(0.4904) (0.6140) (0.1988) (0.2025)Truck -0.8698 -1.2556 0.0437 0.1574
(0.3640) (0.4428) (0.1954) (0.1951)Satellite TV 0.8467 0.0705 0.1800 0.0765
(0.2906) (0.4520) (0.1156) (0.1231)Water Tank 0.5520 0.4628 -0.2012 -0.0931
(0.1663) (0.1835) (0.0917) (0.0952)Refrigerator 0.5263 0.4305 -0.2225 -0.1055
(0.0721) (0.0760) (0.0591) (0.0628)Gas Stove 0.5461 0.4049 -0.3641 -0.3478
(0.0561) (0.0603) (0.0507) (0.0545)Video Recorder 0.7300 0.3341 -0.3024 -0.0470
(0.2791) (0.3247) (0.1287) (0.1306)
aWith moderate risk-aversion (� = 1). Standard errors in parenthesis; observations:
74034.
11

�̂2g is signi�cant at 10% in most items in which it is negative, although signif-icance levels are less impressive in equation (2) than in equation (1). When�xed e¤ects are considered, signi�cance is reduced in most items, except no-tably in concrete �oor. Overall, the results are somewhat supportive of thee¤ect of bene�ts in discouraging overreporting.According to the model, for each item g, �̂1g should be indicative of what
applicants who have this good believe is the weight given to it in the eligibilitycriterion, adjusted for the penalty expected for lying. In turn, ��̂2g shouldbe indicative of what applicants who lack this good believe is the weightgiven to it in the eligibility criterion. With common beliefs about the weightof good g, we would expect �̂1g to be smaller or equal to the absolute valueof �̂2g. The estimates in Table IV do not satisfy this inequality. Perhapsthis is not so surprising. There is little reason to expect there to be commonbeliefs about the weight of each good since the applicants presumably had noaccess to the �poverty regression�used by the government to determine thoseweights. With some heterogeneity of beliefs, we may expect the applicant inthe margin between underreporting or reporting truthfully to have a largerestimate of the weight of the good in question than the applicant in themargin between overreporting or reporting truthfully.Table V provides estimates of the relative weight of each good according
to the estimated coe¢ cients for equations (1) and (2). Relative weights arecalculated as
weight of good g for under-reporters =maxf0; �̂1ggPg0 maxf0; �̂1g0g
; and
weight of good g for over-reporters =minf0; �̂2ggPg0 minf0; �̂2g0g
:
Estimated relative weights for under and over-reporters are not far o¤ forabout half the items, in particular when compared with the true relativeweights obtained from administrative sources.Next, we have estimated the e¤ect of a marginal increase in per capita
bene�ts of the program on the number of applicants who underreport as apercentage of those having the good, and on the number of applicants whooverreport as a percentage of those lacking the good. For each item g and for
12

Table VWeights of Goods in Program Participationa
Estimated WeightsGood Under-Reporters Over-Reporters True WeightsConcrete Floor 0.035 0.025 0.178Tap Water 0.032 0.012 0.083b
Toilet 0.024 0.049 0.156Gas Boiler 0.123 0.116 0.286Washing Machine 0.059 0.141 0.048Phone 0.000 0.117 0.000Car 0.240 0.122Truck 0.000 0.000
0.060c
Satellite TV 0.129 0.000 0.000Water Tank 0.084 0.077 0.000Refrigerator 0.080 0.085 0.190Gas Stove 0.083 0.139 0.000Video Recorder 0.111 0.116 0.000
aWith moderate risk-aversion (� = 1) and without �xed e¤ects. Observations: 74034.bOnly for households having a toilet. cHaving either a car and no truck, a truck and no
car, or both a car and a truck have the same weight.
each applicant a who has this good, the marginal increase in the probabilityof underreporting is equal to
@ Pr(rag = 0jtag = 1)@�U(Ya; Ba)
� @�U(Ya; Ba)@Ba
:
Thus, the marginal increase in the probability of underreporting for applicanta can be estimated as
�̂1gf(�̂1g + �̂1g�U(Ya; Ba) + ̂1gXa)� (Ya +Ba)��;
where f(z) � exp(z)=(1 + exp(z))2.The marginal increase in underreporting of good g is calculated as one
hundred times the value of the expression above evaluated at the mean valuesof the exogenous variables for those having the good. The marginal increasein overreporting is calculated similarly. Table VI displays the results for fourvalues of the risk-aversion coe¢ cient. The signi�cance levels are those of the
13

Table VIMarginal Effect of Per Capita Benefits on Misreportinga
Risk Neutrality (� = 0) Low Risk Aversion (� = 1=2)E¤ect on E¤ect on E¤ect on E¤ect on
Good Underreport Overreport Underreport OverreportConcrete Floor 0.0089*** -0.0055 0.0193*** -0.0085Tap Water 0.0025 0.0068 0.0091** 0.0089Toilet 0.0006 -0.0047 0.0050 -0.0131Gas Boiler 0.0304** -0.0008 0.0704*** -0.0018*Washing Machine 0.0294*** -0.0044*** 0.0633*** -0.011***Phone 0.0025 -0.0010* -0.0016 -0.0027**Car 0.0546*** -0.0011** 0.1154*** -0.0023**Truck -0.0150 0.0002 -0.0549** -0.0001Cable/Satellite TV 0.0115 0.0007 0.0463 0.0020Water Tank 0.0307*** -0.0012 0.0685*** -0.0034*Refrigerator 0.0354*** -0.0025 0.0788*** -0.0078*Gas Stove 0.0253*** -0.0163*** 0.0561*** -0.0356***VCR 0.0134 -0.0014** 0.0416* -0.0035**
Mod. Risk Aversion (� = 1) High Risk Aversion (� = 2)E¤ect on E¤ect on E¤ect on E¤ect on
Good Underreport Overreport Underreport OverreportConcrete Floor 0.0076*** -0.0037 -0.0001 0.0000Tap Water 0.0068*** -0.0020 0.0001 -0.0001Toilet 0.0062*** -0.0089** 0.0002** 0.0000Gas Boiler 0.0386*** -0.0008* 0.0233*** 0.0000Washing Machine 0.0255*** -0.0055*** 0.0002 0.0001**Phone -0.0056 -0.0010** -0.0023 0.0000Car 0.0552*** -0.0006 0.0242** 0.0000Truck -0.0298** 0.0001 -0.0031 0.0000Cable/Satellite TV 0.0435*** 0.0008 0.0552*** 0.0000Water Tank 0.0356*** -0.0019** 0.0123** 0.0000Refrigerator 0.0326*** -0.0067*** -0.0001 -0.0002Gas Stove 0.0266*** -0.0213*** 0.0008*** -0.0022***VCR 0.0293* -0.0015** 0.0225*** 0.0000
aMarginal e¤ects multiplied by 100. Estimation without �xed e¤ects. Observations:
74034.
* signi�cant at 10%; ** signi�cant at 5%; *** signi�cant at 1%.
14
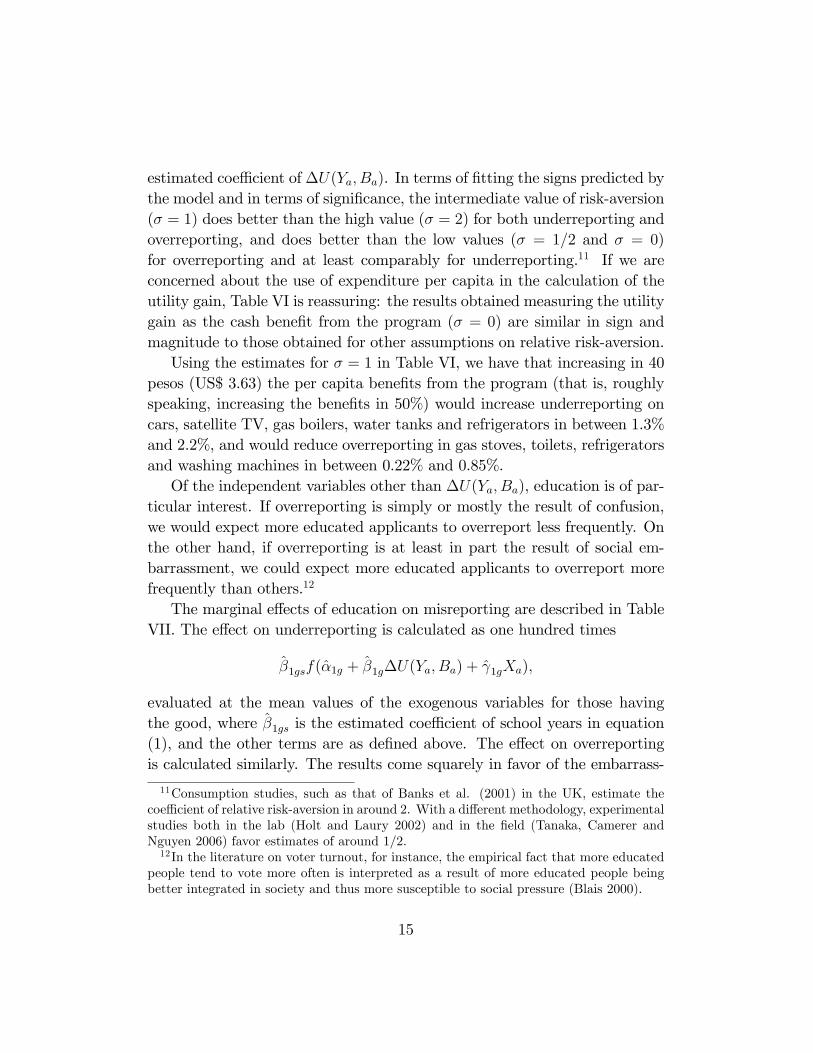
estimated coe¢ cient of �U(Ya; Ba). In terms of �tting the signs predicted bythe model and in terms of signi�cance, the intermediate value of risk-aversion(� = 1) does better than the high value (� = 2) for both underreporting andoverreporting, and does better than the low values (� = 1=2 and � = 0)for overreporting and at least comparably for underreporting.11 If we areconcerned about the use of expenditure per capita in the calculation of theutility gain, Table VI is reassuring: the results obtained measuring the utilitygain as the cash bene�t from the program (� = 0) are similar in sign andmagnitude to those obtained for other assumptions on relative risk-aversion.Using the estimates for � = 1 in Table VI, we have that increasing in 40
pesos (US$ 3.63) the per capita bene�ts from the program (that is, roughlyspeaking, increasing the bene�ts in 50%) would increase underreporting oncars, satellite TV, gas boilers, water tanks and refrigerators in between 1.3%and 2.2%, and would reduce overreporting in gas stoves, toilets, refrigeratorsand washing machines in between 0.22% and 0.85%.Of the independent variables other than �U(Ya; Ba), education is of par-
ticular interest. If overreporting is simply or mostly the result of confusion,we would expect more educated applicants to overreport less frequently. Onthe other hand, if overreporting is at least in part the result of social em-barrassment, we could expect more educated applicants to overreport morefrequently than others.12
The marginal e¤ects of education on misreporting are described in TableVII. The e¤ect on underreporting is calculated as one hundred times
�̂1gsf(�̂1g + �̂1g�U(Ya; Ba) + ̂1gXa);
evaluated at the mean values of the exogenous variables for those havingthe good, where �̂1gs is the estimated coe¢ cient of school years in equation(1), and the other terms are as de�ned above. The e¤ect on overreportingis calculated similarly. The results come squarely in favor of the embarrass-
11Consumption studies, such as that of Banks et al. (2001) in the UK, estimate thecoe¢ cient of relative risk-aversion in around 2. With a di¤erent methodology, experimentalstudies both in the lab (Holt and Laury 2002) and in the �eld (Tanaka, Camerer andNguyen 2006) favor estimates of around 1/2.12In the literature on voter turnout, for instance, the empirical fact that more educated
people tend to vote more often is interpreted as a result of more educated people beingbetter integrated in society and thus more susceptible to social pressure (Blais 2000).
15
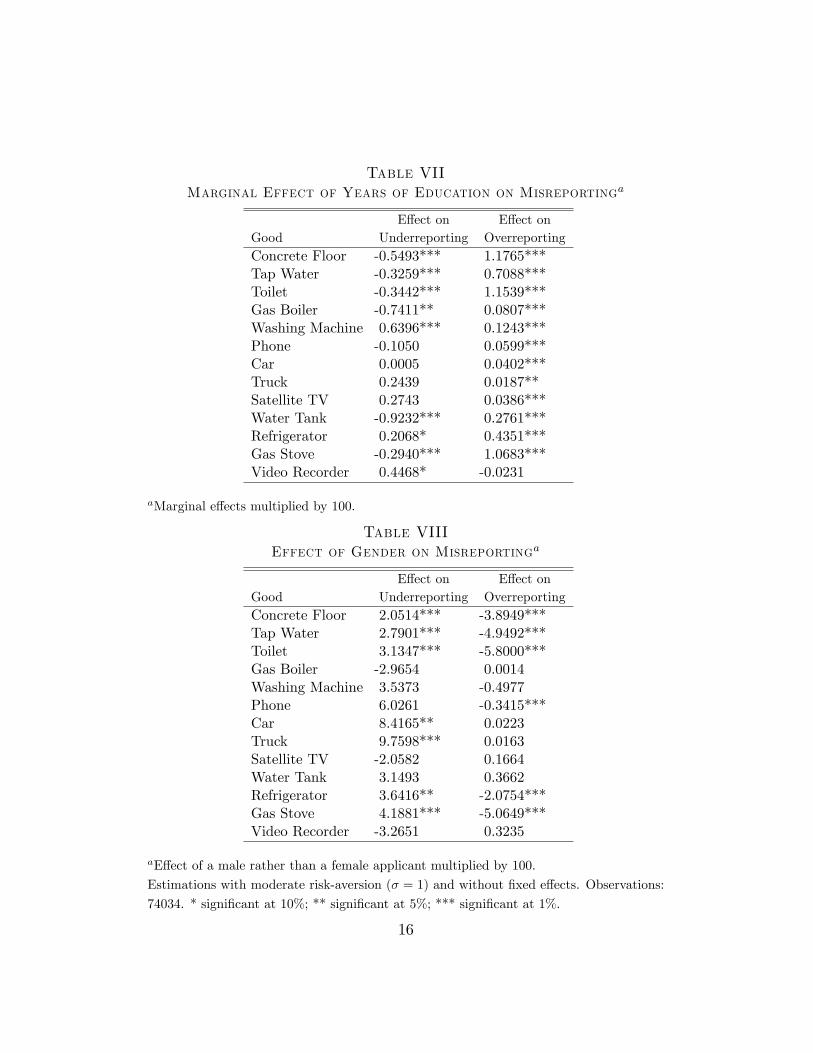
Table VIIMarginal Effect of Years of Education on Misreportinga
E¤ect on E¤ect onGood Underreporting OverreportingConcrete Floor -0.5493*** 1.1765***Tap Water -0.3259*** 0.7088***Toilet -0.3442*** 1.1539***Gas Boiler -0.7411** 0.0807***Washing Machine 0.6396*** 0.1243***Phone -0.1050 0.0599***Car 0.0005 0.0402***Truck 0.2439 0.0187**Satellite TV 0.2743 0.0386***Water Tank -0.9232*** 0.2761***Refrigerator 0.2068* 0.4351***Gas Stove -0.2940*** 1.0683***Video Recorder 0.4468* -0.0231
aMarginal e¤ects multiplied by 100.
Table VIIIEffect of Gender on Misreportinga
E¤ect on E¤ect onGood Underreporting OverreportingConcrete Floor 2.0514*** -3.8949***Tap Water 2.7901*** -4.9492***Toilet 3.1347*** -5.8000***Gas Boiler -2.9654 0.0014Washing Machine 3.5373 -0.4977Phone 6.0261 -0.3415***Car 8.4165** 0.0223Truck 9.7598*** 0.0163Satellite TV -2.0582 0.1664Water Tank 3.1493 0.3662Refrigerator 3.6416** -2.0754***Gas Stove 4.1881*** -5.0649***Video Recorder -3.2651 0.3235
aE¤ect of a male rather than a female applicant multiplied by 100.
Estimations with moderate risk-aversion (� = 1) and without �xed e¤ects. Observations:
74034. * signi�cant at 10%; ** signi�cant at 5%; *** signi�cant at 1%.
16
ment hypothesis. In almost every item, education signi�cantly increases theprobability of overreporting.13
Finally, we take a look at the e¤ect of gender on misreporting. Since mostof the applicants are women, and bene�ts from the program accrue to themother of the household, our sample of male applicants is hardly represen-tative. Undaunted, we proceed to calculate the di¤erence in the behavior ofmale and female applicants with regard to reporting. The e¤ect of gender onthe percentage of misreporting is described in Table VIII. Male applicants aresigni�cantly more likely to underreport and less likely to overreport in �sta-tus�goods and in durable goods, and (curiously) they are also signi�cantlymore likely to underreport in cars and trucks.14
Of our sample of 74,034 initially eligible households, 64,842 householdswere classi�ed as eligible after the household visit. Table IX details the inci-dence of underreporting in households that were rejected by the program andin households that were accepted. Given the high incidence of underreport-ing in the households that were considered eligible in the end, we seriouslydoubt that there was any penalty for underreporting per se.
5 Conclusions
How much do applicants to a social program misreport their �true�charac-teristics when they know this information will be used to determine partici-pation in the program? How sensitive is misreporting to the program bene-�ts? We �nd that underreporting is widespread. Overreporting is commonin goods whose absence in a household is associated with poverty�preciselythose goods that are likely to be given some weight in the methodology em-ployed to determine participation in a poverty-alleviation program. Both
13A potential criticism of this result is that individuals who overreported with respect to�status�goods may also be inclined to overreport with respect to years of education. Wehave found, however, that overreporting is more common in goods that most householdshave, while most applicants seem to have very few years of education.14Evidence on gender di¤erences in preferences is discussed by Eckel and Grossman
(2003) and by Croson and Gneezy (2004). Croson and Gneezy (2004) note that researchfrom psychology suggests that men are more overcon�dent than women, and that womenare more sensitive to social cues in determining appropriate behavior. This seems to favorthe interpretation of the evidence on overreporting as the result of embarrassment ratherthan wrong beliefs.
17

Table IXUnderreporting and Final Status of Verified Households
Rejected from Program Accepted by ProgramGood Obs. Mean Std. Dev. Obs. Mean Std. Dev.Concrete Floor 8521 0.20 0.40 39045 0.13 0.34Tap Water 8045 0.16 0.37 43977 0.13 0.34Toilet 8526 0.18 0.39 45575 0.16 0.37Gas Boiler 1290 0.82 0.38 1093 0.64 0.48Washing Machine 2465 0.71 0.46 3818 0.42 0.49Phone 1169 0.82 0.38 788 0.59 0.49Car 752 0.91 0.28 384 0.67 0.47Truck 690 0.90 0.29 442 0.68 0.47Satellite TV 788 0.89 0.32 929 0.61 0.49Water Tank 1929 0.70 0.46 1902 0.46 0.50Refrigerator 6925 0.53 0.50 13103 0.29 0.45Gas Stove 8610 0.40 0.49 27201 0.19 0.40Video Recorder 1293 0.91 0.29 1114 0.67 0.47
Observations: 74034. Source: ENCASURB.
underreporting and overreporting are sensitive to program bene�ts, more soin the case of underreporting.Though the e¤ect of program bene�ts on misreporting is not large at
the margin, it is signi�cant in the case of underreporting for a variety ofspeci�cations. We believe this robust result is important because applicantswere aware that underreporting could a¤ect the probability of receiving theprogram (positively by increasing the probability of qualifying for a householdvisit and, perhaps, negatively by increasing the probability of being penalizedfor providing false information) but they were also aware that underreportingcould not a¤ect the bene�ts from participating in the program. Thus, if theywere expected utility maximizers and did not su¤er any disutility for lyingper se, their decision to underreport or report truthfully should not havedepended at all on the size of the bene�ts from the program, so long as thesewere positive. If we stick with the expected utility maximization hypothesis,we must conclude that applicants dislike deception enough to forego someprobability of participating in a program with large bene�ts rather thandeceiving.
18

There is evidence that people deviate from single-mindedly pursuing whatis best from the point of view of their individual material interests in avariety of circumstances: they vote even though they know they are notdecisive, they give to charities and political organizations, they punish othersat a cost to themselves when they believe they have been treated unfairly.We show that people also deviate from single-mindedly maximizing theirindividual material interests (or rather those of their family) in the settingof a face-to-face interview with a program o¢ cial. They do so in a mannerthat is consistent with the existence of a disutility for deceiving others and,possibly, a disutility for reporting the lack of some goods whose possessionis widespread among households of a similar social condition.More generally, our work suggests that the design of social programs can
be improved by taking into account current research on the actual behaviorof individuals in contexts that combine economic incentives with ethical andsocial considerations. And vice versa, the understanding of the behavior ofindividuals in those contexts can be improved by taking a look at the evidencecoming from social programs, with their large samples and high stakes.
19

References
[1] Linda Babcock and George Loewenstein (1997) Explaining BargainingImpasse: The Role of Self-Serving Biases, Journal of Economic Perspec-tives
[2] James Banks, Richard Blundell and Agar Brugiavini (2001) Risk Pool-ing, Precautionary Saving and Consumption Growth, Review of Eco-nomic Studies 68: 757-779.
[3] Timothy Besley and Stephen Coate (1992) Workfare versus Welfare: In-centive Arguments for Work Requirements in Poverty-Alleviation Pro-grams, American Economic Review 82: 249-261.
[4] Timothy Besley and Stephen Coate (1995) The Design of Income Main-tenance Programmes, Review of Economic Studies 62: 187-221.
[5] André Blais (2000) To Vote or Not to Vote? The Merits and Limits ofRational Choice Theory, Pittsburgh: University of Pittsburgh Press.
[6] Sissela Bok (1999) Lying: Moral Choice in Public and Private Life, 2ndedition, New York: Vintage Books.
[7] Colin Camerer (1997) Progress in Behavioral Game Theory, Journal ofEconomic Perspectives 11: 167-188.
[8] Ying Chen (2005) Perturbed Communication Games with HonestSenders and Naive Receivers, typescript.
[9] Vincent P. Crawford (2003) Lying for Strategic Advantage: Rationaland Boundedly Rational Misrepresentation of Intentions, American Eco-nomic Review 93: 133-149.
[10] Rachel Croson (2005) Deception in Economics Experiments, in Caro-line Gerschlager (ed.) Deception in Markets: An Economic Analysis,Palgrave Macmillan.
[11] Rachel Croson and Uri Gneezy (2004) Gender Di¤erences in Preferences,typescript.
20
[12] Janet Currie (2004) The Take-Up of Social Bene�ts, forthcoming in AlanAuerbach, David Card, and John Quigley (eds), Poverty, The Distribu-tion of Income, and Public Policy, New York: Russell Sage.
[13] Catherine Eckel and Philip J. Grossman (1999) Di¤erences in the Eco-nomic Decisions of Men and Women: Experimental Evidence, forthcom-ing in Charles Plott and Vernon Smith (eds.), Handbook of ExperimentalResults, New York: Elsevier.
[14] David Ettinger and Philippe Jehiel (2006) Toward a Theory of Decep-tion, typescript.
[15] Uri Gneezy (2005) Deception: The Role of Consequences, AmericanEconomic Review 95: 384-394.
[16] Charles A. Holt and Susan K. Laury (2002) Risk Aversion and Incen-tives, American Economic Review 92: 1644-1655.
[17] Navin Kartik, Marco Ottaviani and Francesco Squintani (2006)Credulity, Lies and Costly Talk, forthcoming in Journal of EconomicTheory.
[18] Robert Mo¢ tt (1983) An Economic Model of Welfare Stigma, AmericanEconomic Review 73: 1023-1035.
[19] Martin Ravallion (1996) Issues in Measuring and Modelling Poverty,Economic Journal 106: 1328-1343.
[20] Regina T. Riphahn (2001) Rational Poverty or Poor Rationality? TheTake-up of Social Assistance Bene�ts, Review of Income and Wealth 47:379-398.
[21] Reglas de Operación del Programa Oportunidades de Desarrollo delCapital Humano para el Ejercicio Fiscal 2002, Diario O�cial de la Fede-ración, May 8, 2002.
[22] Tomomi Tanaka, Colin Camerer and Quang Nguyen (2006) Preferences,Poverty, and Politics: Experimental and Survey Data from Vietnam,typescript.
21