decentralisation outcomes: a review of evidence and ... · decentralisation outcomes: a review of...
TRANSCRIPT

Decentralisation Outcomes: a review of evidence and analysis of international data
This research was commissioned by the previous government and is not necessarily a reflection of the current government’s policies and priorities. DCLG is publishing this report in the interests of transparency.
Decentralisation outcomes: a review of evidence and analysis of international data
Centre for Urban and Regional Development, Newcastle
University and Department of Geography andEnvironment, London School of Economics
This research was commissioned by the previous government and is not necessarily a reflection of the current government’s policies and priorities. DCLG is publishing this report in the interests of transparency.

Department for Communities and Local Government Eland House Bressenden Place London SW1E 5DU Telephone: 030 3444 0000 Website: www.communities.gov.uk © Queen’s Printer and Controller of Her Majesty’s Stationery Office, 2011 Copyright in the typographical arrangement rests with the Crown. This publication, excluding logos, may be reproduced free of charge in any format or medium for research, private study or for internal circulation within an organisation. This is subject to it being reproduced accurately and not used in a misleading context. The material must be acknowledged as Crown copyright and the title of the publication specified. You may re-use this information (not including logos) free of charge in any format or medium, under the terms of the Open Government Licence. To view this licence, visit http://www.nationalarchives.gov.uk/doc/open-government-licence/ or write to the Information Policy Team, The National Archives, Kew, London TW9 4DU, or e-mail: [email protected]. If you require this publication in an alternative format please email [email protected] DCLG Publications Tel: 030 0123 1124 Fax: 030 0123 1125 Email: [email protected] Online via the website: www.communities.gov.uk 2011 ISBN 978 1 4098 3159 4

1
Contents Acknowledgements.................................................................................................... 2 Authors ...................................................................................................................... 2 Summary ................................................................................................................... 3 1 Introduction ......................................................................................................... 9 2 Policy Context................................................................................................... 11 3 Literature review ............................................................................................... 14
3.1 Types of decentralisation and measurement issues ................................... 14 3.2 Benefits and costs resulting from the decentralisation of public service delivery................................................................................................................. 18 3.4 Decentralisation and public service efficiency: some empirical evidence............................................................................................................... 25 3.5 Conclusion and assessment ....................................................................... 27
4 Decentralisation and wellbeing ......................................................................... 29 4.1 Introduction ................................................................................................. 29 4.2 Decentralisation and subjective well-being ................................................. 29 4.2 Research methodology ............................................................................... 30 4.6 Results of the analysis ................................................................................ 32 4.7 Conclusions and policy implications............................................................ 34
5 Decentralisation and Inequality......................................................................... 43 5.1 Introduction ................................................................................................. 43 5.2 Decentralisation, income inequality and level of development.................... 43 5.3 Research methodology ............................................................................... 45 5.4 Research findings ....................................................................................... 46 5.5 Conclusions and policy implications............................................................ 48
6 Conclusions and policy implications ................................................................. 55 7 Bibliography ...................................................................................................... 59

2
Acknowledgements The authors are grateful to Catherine Glossop, Robert Rutherfoord, Michael Barrow, Tom Tolfree, Tom Walker and the participants at the seminar at DCLG for their interest and feedback. This study was funded by DCLG. It also draws upon and contributes to research undertaken as part of the Spatial Economics Research Centre, funded by the Economic and Social Research Council, Department for Communities and Local Government, Department for Business Innovation and Skills and the Welsh Assembly Government. The authors alone are responsible for the contents of the report.
Authors This report was written by John Tomaney, Andy Pike, Gianpiero Torrisi and Vassilis Tselios in the Centre for Urban and Regional Development Studies at Newcastle University and Andrès Rodríguez-Pose of the Department of Geography and Environment at the London School of Economics. We are grateful to Luis Diaz-Serrano of the Department of Economics, Universitat Rovira i Virgili, Reus, for his contribution to Section 4.

3
Summary 1 Introduction The government has embarked on a radical policy of decentralisation in England, which has been termed ‘localism’. Decentralisation from superior to lower tiers of government is a global trend. The government’s approach has a particular character in this context in seeking decentralisation both to the lowest tiers of government and away from government to the individual. The localism agenda is also linked to proposals aiming to increase the rate of local economic growth, rebalancing the economy in sectoral and spatial terms and promoting wellbeing in England. This rapidly evolving policy agenda is based upon principles that are challenging to test rigorously and examine empirically. In principle, the government’s approach is a particular form of decentralisation that has radical and experimental characteristics and is distinct from the kinds of decentralisation that have been tried and tested elsewhere internationally. The current study aims to consider the international evidence about the impacts of decentralisation. It seeks to identify systematically the arguments concerning the social and economic impacts of decentralisation and articulate key issues relevant to the policy debate. 2 Policy context Decentralisation of government and governance is an international phenomenon. The rationale is that this process meets multiple objectives of increasing the efficiency of public services, improving legitimacy and accountability of political institutions and fostering the growth of local and regional economies. Internationally, we can identify a widespread, if heterogeneous, trend toward decentralisation by national governments. Decentralisation comes in different shapes and sizes conditioned by broader processes of globalisation, the growing complexity of the state and growing demands upon it and the variety of motivations and national contexts (historical, political, economic) in which it has been introduced. Distinct territorial or political identities were a key rationale in early shifts toward more decentralised state structures, but latterly economic arguments have dominated as governments seek an ‘economic dividend’ from decentralisation in terms of efficiency gains and improved economic growth. In this regard, governments and international organisations such as the World Bank, OECD and EU expect decentralisation to provide local services more efficiently and promote greater incentives to stimulate local economic growth. The government policy agenda in England constitutes a particular version of these broader processes and rationales in focusing upon the relationship between decentralisation, localism and the ‘Big Society’. The main motivations being improved efficiency in the delivery of public services, the promotion of local economic growth as part of efforts to rebalance the UK economy, sectorally

4
and spatially, and the promotion of wellbeing as a new and broader measure of development. Debate continues about the connections and contradictions between these agendas and as an evolving policy agenda it is difficult to predict its impacts. 3 Literature review The international literature on decentralisation is focused upon the redistribution of power and resources to lower tiers of government. The literature produces ambiguous and at times contradictory findings about the impacts of decentralisation on governance, public services, local growth and wellbeing. These are partly the result of data and methodological limitations and a product of the questions that are asked. For example, we find quite contradictory evidence about the impacts of decentralisation on the efficiency of local services, reflecting the difficulties in finding adequate means of measurement and data and depending upon the specific policy areas addressed. In addition, the literature on decentralisation tends, with one or two exceptions, not to draw strong distinctions between the efficacies of different tiers of sub-national government covering a variety of spatial scales, tending instead to explore the principles of decentralisation itself. We show that as an international phenomenon decentralisation has adopted many forms and been enacted at different spatial scales. Thus, much of the international literature is concerned with decentralisation to the regional instead of —or as well as — the local scale and terms such as decentralisation and devolution are often used interchangeably. The review of studies reveals the challenges of analysing decentralisation processes at the local scale. Therefore, we focus on assessing the evidence of the impacts of decentralisation more broadly defined, while attempting where possible to assess it in relation to the rapidly evolving policy agenda of localism in England. The report shows that such a focus provides evidence that has a strong bearing on government policy toward decentralisation in England. 4 Decentralisation and wellbeing The relationship between decentralisation and subjective wellbeing is a new research area and it is highly relevant to the debate about current government policy. This empirical analysis shifts the focus away from the uncertain impacts of decentralisation on the efficiency of public services and focuses upon the perceptions of citizens about decentralisation and its value to them. The analysis shows that, in broad terms, high degrees of decentralisation are associated with higher levels of subjective well-being among citizens. This positive effect of political and fiscal decentralisation variables on satisfaction and happiness establishes a relationship whereby citizens appear to be happy not only with the transfer of resources – which is an indicator of the capacity of local governments to implement policies – but also with the ability to conduct policies at the local level – which is represented here by the transfer of powers to sub-national governments. With the exception of satisfaction with the health system, the association between greater decentralisation and subjective wellbeing is more strongly associated with perceptions such as
5
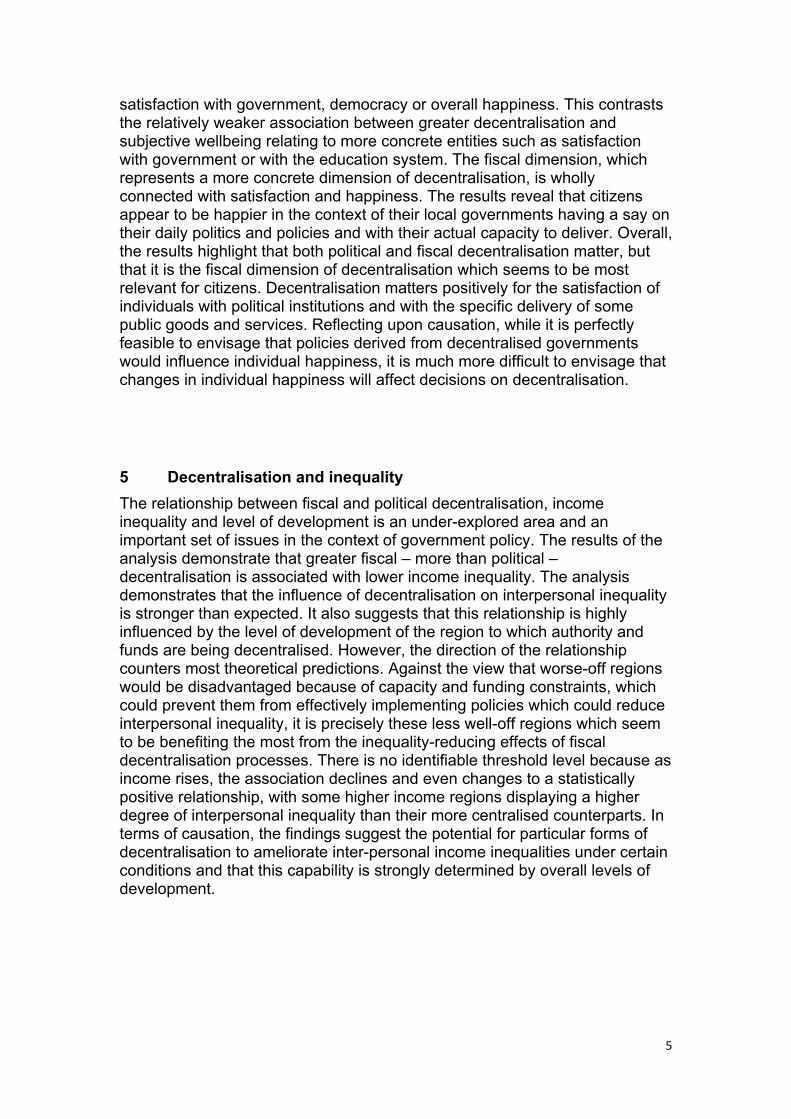
satisfaction with government, democracy or overall happiness. This contrasts the relatively weaker association between greater decentralisation and subjective wellbeing relating to more concrete entities such as satisfaction with government or with the education system. The fiscal dimension, which represents a more concrete dimension of decentralisation, is wholly connected with satisfaction and happiness. The results reveal that citizens appear to be happier in the context of their local governments having a say on their daily politics and policies and with their actual capacity to deliver. Overall, the results highlight that both political and fiscal decentralisation matter, but that it is the fiscal dimension of decentralisation which seems to be most relevant for citizens. Decentralisation matters positively for the satisfaction of individuals with political institutions and with the specific delivery of some public goods and services. Reflecting upon causation, while it is perfectly feasible to envisage that policies derived from decentralised governments would influence individual happiness, it is much more difficult to envisage that changes in individual happiness will affect decisions on decentralisation. 5 Decentralisation and inequality The relationship between fiscal and political decentralisation, income inequality and level of development is an under-explored area and an important set of issues in the context of government policy. The results of the analysis demonstrate that greater fiscal – more than political – decentralisation is associated with lower income inequality. The analysis demonstrates that the influence of decentralisation on interpersonal inequality is stronger than expected. It also suggests that this relationship is highly influenced by the level of development of the region to which authority and funds are being decentralised. However, the direction of the relationship counters most theoretical predictions. Against the view that worse-off regions would be disadvantaged because of capacity and funding constraints, which could prevent them from effectively implementing policies which could reduce interpersonal inequality, it is precisely these less well-off regions which seem to be benefiting the most from the inequality-reducing effects of fiscal decentralisation processes. There is no identifiable threshold level because as income rises, the association declines and even changes to a statistically positive relationship, with some higher income regions displaying a higher degree of interpersonal inequality than their more centralised counterparts. In terms of causation, the findings suggest the potential for particular forms of decentralisation to ameliorate inter-personal income inequalities under certain conditions and that this capability is strongly determined by overall levels of development.
6
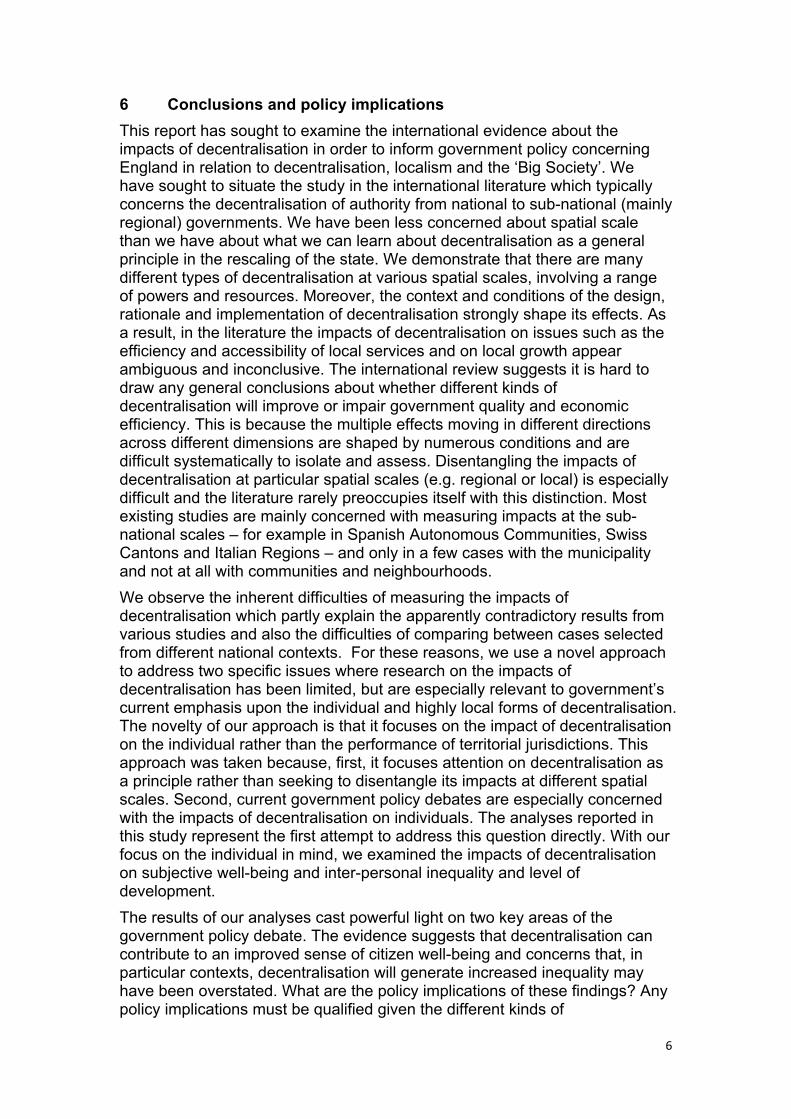
6 Conclusions and policy implications This report has sought to examine the international evidence about the impacts of decentralisation in order to inform government policy concerning England in relation to decentralisation, localism and the ‘Big Society’. We have sought to situate the study in the international literature which typically concerns the decentralisation of authority from national to sub-national (mainly regional) governments. We have been less concerned about spatial scale than we have about what we can learn about decentralisation as a general principle in the rescaling of the state. We demonstrate that there are many different types of decentralisation at various spatial scales, involving a range of powers and resources. Moreover, the context and conditions of the design, rationale and implementation of decentralisation strongly shape its effects. As a result, in the literature the impacts of decentralisation on issues such as the efficiency and accessibility of local services and on local growth appear ambiguous and inconclusive. The international review suggests it is hard to draw any general conclusions about whether different kinds of decentralisation will improve or impair government quality and economic efficiency. This is because the multiple effects moving in different directions across different dimensions are shaped by numerous conditions and are difficult systematically to isolate and assess. Disentangling the impacts of decentralisation at particular spatial scales (e.g. regional or local) is especially difficult and the literature rarely preoccupies itself with this distinction. Most existing studies are mainly concerned with measuring impacts at the sub-national scales – for example in Spanish Autonomous Communities, Swiss Cantons and Italian Regions – and only in a few cases with the municipality and not at all with communities and neighbourhoods. We observe the inherent difficulties of measuring the impacts of decentralisation which partly explain the apparently contradictory results from various studies and also the difficulties of comparing between cases selected from different national contexts. For these reasons, we use a novel approach to address two specific issues where research on the impacts of decentralisation has been limited, but are especially relevant to government’s current emphasis upon the individual and highly local forms of decentralisation. The novelty of our approach is that it focuses on the impact of decentralisation on the individual rather than the performance of territorial jurisdictions. This approach was taken because, first, it focuses attention on decentralisation as a principle rather than seeking to disentangle its impacts at different spatial scales. Second, current government policy debates are especially concerned with the impacts of decentralisation on individuals. The analyses reported in this study represent the first attempt to address this question directly. With our focus on the individual in mind, we examined the impacts of decentralisation on subjective well-being and inter-personal inequality and level of development. The results of our analyses cast powerful light on two key areas of the government policy debate. The evidence suggests that decentralisation can contribute to an improved sense of citizen well-being and concerns that, in particular contexts, decentralisation will generate increased inequality may have been overstated. What are the policy implications of these findings? Any policy implications must be qualified given the different kinds of

7
decentralisation and the conditional nature of its operation that makes it highly dependent upon the context in which it is introduced. In addition, given the exploratory nature of the analysis, the results should be considered with caution in shaping policy in specific cases especially in directly attributing causation, given the strength of quantitative analysis in identifying and measuring the extant relationships, and extending its findings from the regional to the local level. With these qualifications in mind our research allows us to suggest the following policy issues:
• There is a need for much greater clarity in the definition, specification and rationale of exactly what kind and degree of decentralisation is planned by the government in England, and what its precise aims and goals are: Is it seeking to make services more efficient or more accountable? Is the aim to improve subjective wellbeing? Is the goal reducing levels of inter-personal inequality? In particular, the relationships between decentralisation and its spatial scale need to be explained and clarified with greater care. While government may not be seeking to establish a blueprint, the principles of the particular kinds of decentralisation sought need to reflect what the review and evidence here demonstrates: decentralisation can have positive and negative impacts at various spatial scales but current policy focuses only on the local scale as the source of gains in efficiency and accountability. The rationales for the government’s particular kind of decentralisation need clearer explanation and stronger evidence. Moreover, the existing evidence on the impacts of decentralisation mainly concerns the performance of sub-national jurisdictions (e.g. regions, provinces, municipalities) with very little treatment of issues that could be seen as proxies of localism as understood in current debates about the governance of England.
• The results reported here suggest that, internationally, citizens are positive in the context of the fiscal dimensions and capacities of decentralised institutions at the sub-national level. Such decentralised institutions are associated with higher levels of personal subjective well-being. As a key decentralised institution in the context of England, the analysis highlights local government’s critical role in articulating and representing the potential of the kinds of decentralisation and localism that the government seeks. This raises the issue of whether and how local government can be enabled and supported in this role especially in the context of the level of fiscal decentralisation evident in England. In addition, given the government’s emphasis upon decentralisastion beneath the level of local government, it raises the question of how such decentralisation processes unfold when focused upon the spatial scales of communities and neighbourhoods or at the level of individual citizens. Such issues require further investigation and synthesis and review of the available evidence.
• If subjective well-being is emerging as a central focus of government policy then the evidence reported here suggests decentralisation could play a role its improvement. However, the nature and extent of decentralisation and the resources attached to it would seem to be critical in determining the chances of its success.

8
• Our findings suggest that increased fiscal – more than political – decentralisation should be considered given its positive association with lower levels of income inequality. Less well-off places in particular could benefit from the inequality-reducing effects of enhanced fiscal decentralisation. Moreover, consideration needs to be given to how further decentralisation might affect the high levels of inter-personal inequality evident within already highly decentralised and high income regions.
• Given the claims being made for its potential impacts, more attention and clarity on the evaluation of the government’s strategy on decentralisation and localism will be beneficial. How, for example, will government know if its decentralisation and localism policies have achieved their aims? Given the potential for both positive and negative effects arising from decentralisation identified in this report, establishing robust frameworks and methods for the assessment of such policies is a central issue.
9
1 Introduction
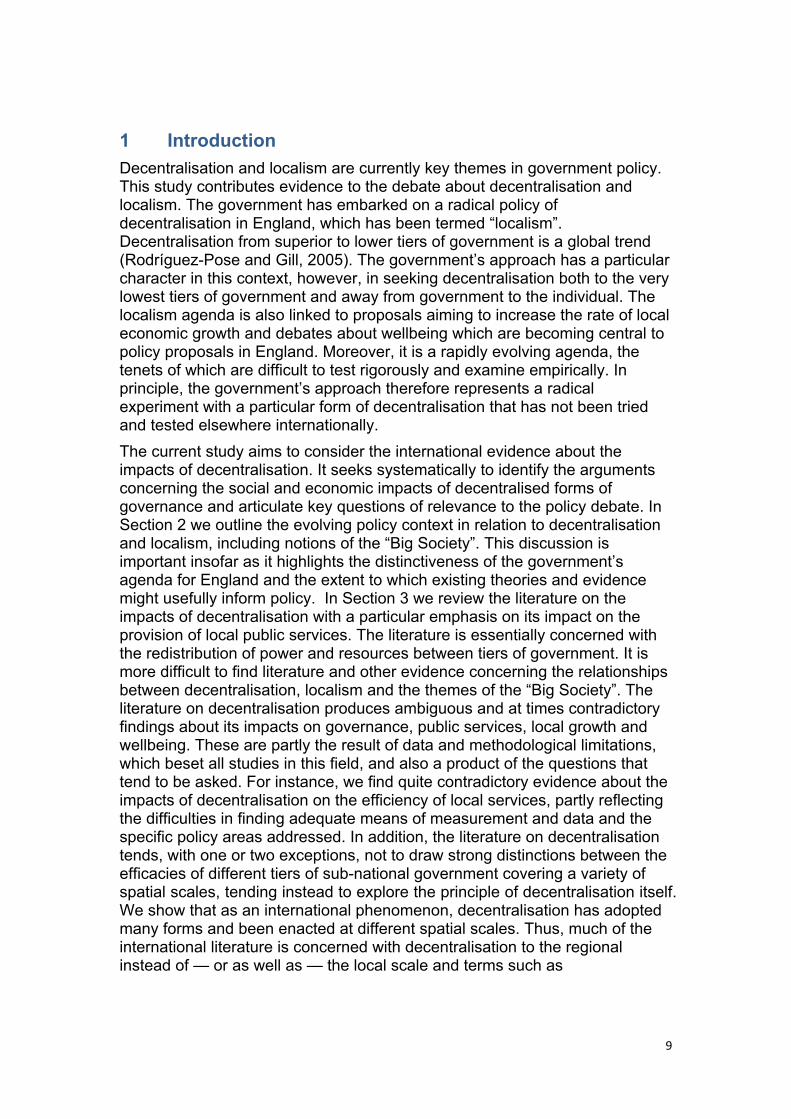
Decentralisation and localism are currently key themes in government policy. This study contributes evidence to the debate about decentralisation and localism. The government has embarked on a radical policy of decentralisation in England, which has been termed “localism”. Decentralisation from superior to lower tiers of government is a global trend (Rodríguez-Pose and Gill, 2005). The government’s approach has a particular character in this context, however, in seeking decentralisation both to the very lowest tiers of government and away from government to the individual. The localism agenda is also linked to proposals aiming to increase the rate of local economic growth and debates about wellbeing which are becoming central to policy proposals in England. Moreover, it is a rapidly evolving agenda, the tenets of which are difficult to test rigorously and examine empirically. In principle, the government’s approach therefore represents a radical experiment with a particular form of decentralisation that has not been tried and tested elsewhere internationally. The current study aims to consider the international evidence about the impacts of decentralisation. It seeks systematically to identify the arguments concerning the social and economic impacts of decentralised forms of governance and articulate key questions of relevance to the policy debate. In Section 2 we outline the evolving policy context in relation to decentralisation and localism, including notions of the “Big Society”. This discussion is important insofar as it highlights the distinctiveness of the government’s agenda for England and the extent to which existing theories and evidence might usefully inform policy. In Section 3 we review the literature on the impacts of decentralisation with a particular emphasis on its impact on the provision of local public services. The literature is essentially concerned with the redistribution of power and resources between tiers of government. It is more difficult to find literature and other evidence concerning the relationships between decentralisation, localism and the themes of the “Big Society”. The literature on decentralisation produces ambiguous and at times contradictory findings about its impacts on governance, public services, local growth and wellbeing. These are partly the result of data and methodological limitations, which beset all studies in this field, and also a product of the questions that tend to be asked. For instance, we find quite contradictory evidence about the impacts of decentralisation on the efficiency of local services, partly reflecting the difficulties in finding adequate means of measurement and data and the specific policy areas addressed. In addition, the literature on decentralisation tends, with one or two exceptions, not to draw strong distinctions between the efficacies of different tiers of sub-national government covering a variety of spatial scales, tending instead to explore the principle of decentralisation itself. We show that as an international phenomenon, decentralisation has adopted many forms and been enacted at different spatial scales. Thus, much of the international literature is concerned with decentralisation to the regional instead of — or as well as — the local scale and terms such as

10
decentralisation and devolution are used interchangeably1. The literature review and subsequent empirical analyses reveals the challenges of analysing these processes at the local scale. For these reasons we focus on assessing the evidence of the impacts of decentralisation more broadly defined, while attempting where possible to assess it in relation to the rapidly evolving policy agenda of localism in England. However, the report shows that such a focus provides evidence that has a strong bearing on government policy toward decentralisation in England. We explore these questions in some detail in Section 3 by examining comparative international data and then identify two issues – wellbeing and inequality – on which more light needs to be shed in the context of government policy toward decentralisation in England. In Section 4 we look at the relationship between decentralisation and subjective wellbeing. This shifts the focus away from the uncertain impacts of decentralisation on the efficiency of public services and instead onto the perceptions of citizens about decentralisation and its value to them. Here the analysis shows that, in broad terms, high degrees of decentralisation are associated with higher levels of subjective well-being among citizens. In Section 5 we address the relationship between fiscal and political decentralisation, income inequality and level of development. Here, the results of the analysis demonstrate that greater fiscal – more than political – decentralisation is associated with lower income inequality. In Section 6 we summarise our findings and highlight their relevance to the emerging government policy on decentralisation in England.
1 The international peer reviewed literature on “localism” and “government” is comparatively limited and much smaller than the literature on decentralisation. A search of Thomson Reuters ISI Web of Knowledge using these terms produced only 30 references, albeit covering a wide range of topics. In addition, there are few papers which address directly the impact of decentralisation and efficiency of local government directly. An exception is the study by Balaguer-Coll et al. (2009) of Spanish municipalities – see Section 3 below. It should be noted, however, that this concerns decentralisation from regional governments to municipalities rather from central to local government, so its direct relevance to UK debates is limited.
11
2 Policy context Decentralisation of government and governance is an international phenomenon. International organisations such as the World Bank, IMF, the OECD and the EU generally strongly support the decentralisation of power, authority and resources from the centre to lower tiers of government. The rationale is that this process meets multiple objectives of increasing the efficiency of public services, improving legitimacy and accountability of political institutions and fostering the growth of local economies (e.g. Burki, et al. 1999; World Bank, 2000; 2010; Ahmad, et al., 2008; OECD, 2001; for an important overview see Treisman, 2007: 1-21). Internationally, we can identify a widespread, if heterogeneous, trend toward decentralisation on the part of national governments. While globalisation is frequently cited as a factor encouraging governments to decentralise authority, along with the growing complexity of the state and growing demands upon it, the variation of patterns of decentralisation reflects the variety of motivations and national conditions (historical, political, economic) in which it has been introduced (e.g. Rodríguez-Pose and Gill, 2005). The factors that compel governments to decentralise power and resources – and the arguments they deploy in this cause – vary over time and between places (see Table 3.2 below for a typology of arguments). The varieties of forms and degress of decentralisation reflect different answers to the question of subsidiarity – that is, what is the lowest appropriate level to which a specific policy area should be decentralised. Claims about distinct territorial or political identities were an important motivation in early shifts toward more decentralised state structures, but latterly economic arguments have tended to be at the forefront (Rodríguez-Pose and Sandall, 2008) as governments search for a putative “economic dividend” from decentralisation in terms of efficiency gains and improved local growth (Rodríguez-Pose and Gill, 2005; Pike et al., 2010). In this regard, governments and international organisations expect decentralised government to provide local services more efficiently and to have greater incentive to promote local economic growth. The government policy agenda in England focuses on the relationship between decentralisation, localism and the “Big Society” (HMG, 2010a). Localism, according to David Cameron, is founded on “the efficiency argument “, suggesting that more local delivery will improve the delivery of public services (quoted in HMG, 2010a: 4). Linked to this are concerns about promoting “Local Growth” as part of efforts to “rebalance” the UK economy in sectoral and spatial terms (HMG 2010b) and a concern with promoting wellbeing as a new and broader measure of development (Cameron, 2010). To some degree these agendas overlap and inform each other, while some commentators see contradictions and inconsistencies between these aspects. For instance, there is a great deal of confusion and contradiction in the commentary on decentralisation and localism, with the terms sometimes used interchangeably and on other occasions used to describe different processes (see Sear and Parry 2011 and Deloitte 2011 for a discussion of this issue). In practice this is an evolving policy agenda which makes it exceptionally difficult to predict its impacts.

12
One notable feature of the current policy agenda for England is that different forms of decentralisation are proposed for different policy fields such as education, health, economic development, etc. Arguably this will make it especially difficult to isolate and measure the contribution of decentralisation and multiply coordination problems2. The thinking underpinning the government’s decentralisation agenda for England is set out in its document Decentralisation and the Localism Bill: an essential guide (HMG, 2010a). Here decentralisation is the mechanism for transferring power from “Big Government” to “Big Society” – a process “giving people back to people and communities”, and a response to the fact that “centralisation has failed”. Figure 2.1 sets out the “six essential actions”, which compromise the decentralisation agenda. The document acknowledges the case against decentralisation, including claims about lack of local capacity, dangers of “nimbyism”, and the unequal provision and access to local services (the so-called “post-code lottery”). In this context, the present study aims to bring evidence to bear on some of the key questions which surround this particular kind of decentralisation and localism, including shedding light on some of the relationships between different aspects of the emerging policy agenda. Section 3 examines the literature on decentralisation with a strong focus on the evidence for the Prime Minister’s claims about the efficiency argument.
2 In a contribution to the theory of federalism, Frey (2005) advocates an approach to decentralisation which is founded on a network of competing administrative units. Units of government, under this proposal, have four characteristics which are: functional (where governmental units are extended over areas defined by the functions to be fulfilled); overlapping (where government units extending over different geographical areas); competing (where individuals choose to which governmental unit they belong for which function), and jurisdictional (the units of government have enforcement powers and the right to levy resources (FOCJ). The FOCJ approach might be considered to offer theoretical underpinning to the current UK policy agenda. It should be note, however, that Frey offers an entirely theoretical exercise. His empirical examples are drawn from the operation of the Hanseatic League from the 12–16th century and from contemporary USA and Switzerland. But, his example from the United States special districts highlights the extent to which these arrangements are designed to address special problems, rather than a general answer to problems of government. In practice, FOCJ can be criticised, like the New Public Management, for obscuring lines of political accountability for citizens, exacerbating rather than resolving problems of coordination and redistribution - arguments which Frey himself acknowledges.

13
Figure 2.1: The government’s approach to decentralisation in England
Source: HMG 2010a

14
3 Literature review
3.1 Types of decentralisation and measurement issues The process of state rescaling and its link to policy outcomes in terms of efficiency, growth, inequality, and political stability raises multidisciplinary interest ranging, for instance, from economics (Tiebout, 1956; Oates, 2006) and politics (Loughlin, 2001; Keating et al., 2009) to geography (Jones et al., 2005) and planning (Houghton, 2005). Analysis often conflates analysis with prescription in fields such as democracy (Drèze and Sen, 2002) and market reforms (Lobao et al., 2009). The process of rescaling of the state raises several methodological issues (Cohen and Peterson, 1996). Indeed, the variety of approaches followed across different studies suggest “a startling diversity of definitions and measures to the decentralisation concept [so that] there is little agreement about what constitutes an example of decentralisation, what causes decentralisation, or what effects it is likely to have” (Schneider, 2003: 32, 33). Not only have different meanings been attributed to “decentralisation” (administrative, fiscal, political, spatial – see Table 3.1), but also many different terms are used in order to refer to changes involving the balance of power and competencies between central government and other actors both at sub-national and supra-national level within multi-level systems. A further concern is the initial starting point of the kinds and degrees of centralisation and/or decentralisation within particular countries and the respective size of the countries and their differing units of decentralised governance. As a result of these difficulties, conceptual confusion has often been the result (Treisman, 2007). This lack of clarity makes it worth stressing differences related to these “de-terms” (deconcentration, delegation, denationalisation, destatisation, and, devolution) both conceptually and methodologically (Brenner, 2009; Torrisi et al., 2010). To begin with, decentralisation is defined as “the transfer of authority and power from higher to lower levels of government or from national to subnational levels” (Rondinelli, et al. 1984; Collins and Green 1994; Mills, 1994). Three main types of decentralisation have been considered in the literature: fiscal, administrative, and political (Treisman, 2007). Fiscal decentralisation refers to “the vertical government distribution of powers for raising and spending public resources” (Martinez-Vazquez and Timofeev 2009). Administrative decentralisation takes into account decision-making authority, personnel control, and control over public finance (Treisman, 2002; Schneider, 2003); while political decentralisation refers to the degree of independence enjoyed by lower tiers of government in performing their typical six main processes (i.e. mobilisation, organisation, articulation, participation, contestation, and aggregation of interests). Deconcentration, delegation and devolution are forms of administrative decentralisation characterised by increasing degree of autonomy. Devolution, among the three types of
15
administrative decentralisation, is the one with the highest degree of autonomy assigned to lower-level receiving unit(s). Many different measures have been utilised in empirical studies as the proxies of concepts introduced above. For the sake of generalisation, fiscal decentralisation has been measured as simple or modified ratios of sub-national government spending/revenue to general government respective datum (Martinez-Vazquez and Timofeev, 2009). Administrative decentralisation has been measured in terms of the degree of autonomy over executive appointment at different levels and the share of subnational governments in total government administration employees (Treisman 2002). Proxies for political decentralisation consist of some measure of the existence of elections at local level (Treisman, 2002; Schneider, 2003). However, no single measure is able properly (and entirely) to capture the complexity of central-local relations reflecting each dimension of state activity. Soft budget constraints (Kornai, 1979; Kornai et al., 2003; Oates, 2006), Baumol’s (1967) “disease”, and bureaucrats’ strategic behaviour (Migué and Bélanger, 1971; Breton and Wintrobe, 1975; Niskanen, 1975) are typical examples of issues involving empirical analysis in this field3. In addition to measures looking only at the internal structure of the state, in order to take into account globalisation, the concepts of “denationalisation”, “destatisation”, and “internationalisation” have been utilised to refer to the “continuing movement of state power upwards, downwards, and sideways” (Jessop, 2002). Table 3.1 offers a synoptic view of concepts and measures utilised in the literature. The “Regional Authority” approach (Hooghe et al., 2008) represents an innovative and increasingly used method to encompass these different forms of decentralisation creating an unified methodology based on observable measures of self- rule and shared rule. Self-rule refers to the independence of a regional government from central control and to the scope of regional decision making and shared rule refers to the capacity of a regional government to shape central decision making (Elazar, 1987). In their paper Hooghe et al. (2008, p.123) ‘conceive regional authority in two domains. Self-rule refers to the authority of a regional government over those living in the region. Shared rule refers to the authority a regional government (co-)exercises in the country as a whole. Each is measured along eight dimensions or scales which describe institutional alternatives’. More precisely, self-rule is operationalised as a numerical measure – ranging from 0 to 15 – resulting from regional government having an independent executive, the scope of its policy competencies, its capacity to tax, and the extent to which it has an independent legislature. As for shared rule, it is operationalised by dividing central government decision making process into four areas (normal legislation, executive policy, taxation, and constitutional reform) and assigning a numerical value - ranging from 0 to 9 – according to observed empirical situations. Regional Authority Index (RAI) represents the sum of the two indices ranging from 0 to 24. Overall, the Index is the strongest recent, systematic, internationally comparative and peer reviewed approach to
3 For a critical review dealing with defining and measuring decentralisation see Torrisi et al. (2010).

16
measuring degrees of decentralisation and by far the most robust available technique. It is therefore our preferred method of measuring decentralisation. Figure 3.1 reports the composite Regional Authority Index for a range of decentralised units in countries of different sizes (Hooghe et al., 2008). We considered the issue of country size because it might have been that larger countries would be more positively disposed to decentralization in order to address regional and local issues more effectively. However, our empirical analysis shows that no statistically significant correlation arises between the two measures. The correlation coefficient is 0,472 which is mildly positive and expected but nothing that would generate statistical problems in the analysis. Figure 3.1. Regional Authority index relative to year 2006. Source: authors’ elaboration on Hooghe et al. (2008) data4.
4 The Regional Authority index, as its name implies, focuses on the regional scale. We use it here as a rigorous – and influential - measure of sub-national decentralisation and are less concerned with the particular spatial scale at which it operates.

17
Tabl
e 3.
1 - D
ecen
tral
isat
ion
type
s an
d po
tent
ial m
easu
res.
Sou
rce:
ada
pted
from
Tor
risi e
t al.,
(201
0).
Fisc
al
Polit
ical
A
dmin
istr
ativ
e D
econ
cent
ratio
n D
eleg
atio
n D
evol
utio
n
Def
initi
on
refe
rs to
how
muc
h ce
ntra
l gov
ernm
ents
ce
de fi
scal
impa
ct to
no
n-ce
ntra
l go
vern
men
t ent
ities
refe
rs to
the
degr
ee
to w
hich
cen
tral
gove
rnm
ent a
llow
no
n-ce
ntra
l go
vern
men
t ent
ities
to
und
erta
ke th
e po
litic
al fu
nctio
ns o
f go
vern
ance
; deg
ree
to w
hich
pol
itica
l ac
tors
and
issu
es a
re
sign
ifica
nt a
t the
loca
l le
vel a
nd a
re a
t lea
st
parti
ally
inde
pend
ent
from
thos
e at
the
natio
nal l
evel
.
refe
rs to
how
muc
h au
tono
my
non-
cent
ral
gove
rnm
ent
entit
ies
poss
es
rela
tive
to c
entra
l co
ntro
l
refe
rs to
a c
entra
l go
vern
men
t tha
t di
sper
ses
resp
onsi
bilit
y fo
r a
polic
y to
its
field
of
fices
; pow
ers
are
trans
ferr
ed to
lo
wer
-leve
l act
ors
who
are
ac
coun
tabl
e to
th
eir s
uper
iors
in a
hi
erar
chy
trans
fer o
f pol
icy
resp
onsi
bilit
y to
lo
cal g
over
nmen
t or
se
mia
uton
omou
s or
gani
satio
ns th
at
are
not c
ontro
lled
by th
e ce
ntra
l go
vern
men
t but
re
mai
n ac
coun
tabl
e to
it.
the
cent
ral
gove
rnm
ent
allo
ws
quas
i-au
tono
mou
s lo
cal u
nits
of
gove
rnm
ent
to e
xerc
ise
pow
er a
nd
cont
rol o
ver
the
trans
ferr
ed
polic
y.
Mea
sure
men
t (s
impl
e or
mod
ified
m
easu
res
of) r
atio
of
subn
atio
nal
gove
rnm
ent
spen
ding
/reve
nue
to
gene
ral g
over
nmen
t da
tum
exis
tenc
e of
ele
ctio
ns
at th
e m
unic
ipal
leve
l or
at t
he
stat
e/pr
ovin
cial
leve
l
Exe
cutiv
e ap
poin
tmen
t (e
xten
t to
whi
ch
appo
intm
ents
are
m
ade
by a
ctor
s at
sa
me
or lo
wer
tier
, ra
ther
than
from
ab
ove)
; Per
sonn
el
(sha
re o
f su
bnat
iona
l go
vern
men
ts in
to
tal g
over
nmen
t ad
min
istra
tion
empl
oyee
s)
Form
s of
adm
inis
trativ
e de
cent
ralis
atio
n no
t ind
ivid
ually
m
easu
red
18
3.2 Benefits and costs resulting from the decentralisation of public service delivery
The discourse concerning the positive and negative effects of decentralisation has been developed in a multidisciplinary way, according to different analytical frameworks which seek to highlight that decentralisation provides benefits and costs for the efficient provision of public services. The arguments for and against decentralisation are longstanding questions of political philosophy (see Table 3.2 for a typology of the arguments about decentralisation). The normative argument in favour of small administrative units as a form of political organisation of the state able to enhance democratic participation and citizens’ satisfaction can be traced back to de Montesquieu (1748: 140):
In an extensive republic the public good is sacrificed to a thousand private views; it is subordinate to exceptions, and depends on accidents. In a small one, the interest of the public is more obvious, better understood, and more within the reach of every citizen; abuses have less extent, and of course are less protected.
However, concerns about some possible harmful implications of decentralisation have been developed since at least 1787 when James Madison wrote:
The smaller the society, the fewer probably will be the distinct parties and interests composing it; the fewer the distinct parties and interests, the more frequently will a majority be found of the same party; and the smaller the number of individuals composing a majority, and the smaller the compass within which they are placed, the more easily will they concert and execute their plans of oppression (Madison 1787: 63).
Modern writers from a political economy perspective, notwithstanding caveats, favour decentralisation because it improves accountability and transparency. Decentralisation of public service delivery potentially resolves the inefficiencies generated by the separation of local spending from tax-raising decisions. In decentralised systems, local policy-makers are more closely connected to the local consequences of their spending decisions. In addition, decentralised delivery may open up opportunities for closer user involvement in more clearly articulating their needs and preferences and making and implementing decisions within their local area. Hence devolved administrations are able to tailor policies to local needs and stimulate participation and accountability by reducing the distance between those in government and their constituencies (Rodríguez-Pose and Gill, 2005; Balaguer-Coll et al. 2010). This allows for an efficient match of public services to local demand. Decentralisation generally adds to the success of democracy which is the most valued institutional means of creating political accountability (Weingast 2009). Accountability also contributes to social cohesion, because if local vested interests are powerful, in the absence of local political accountability, decentralisation could increase social fragmentation (e.g. Bradhan and Mookherjee, 1998; Neyapti, 2006).

19
Table 3.2 Arguments for and against decentralisation (adapted from Treisman, 2007: 12-15; 270-294; Pike et al, 2010: 23)
For
1. Administrative efficiency. Multi-tier government makes it possible to satisfy citizens’ demands for public goods and service more precisely and cost-effectively (e.g. Oates, Montesquieu).
Critique: Only administrative – not political – decentralisation is required for this outcome.
2. Local competition. Competition among local governments to attract mobile residents or investment induces them to be more honest, efficient and responsive (e.g. Hayek, Tiebout).
Critique: The conditions for local competition will rarely be met in most countries and, in any event, may lead to perverse outcomes (e.g. “race to the bottom” tax reduction and public provision competition).
3. Fiscal incentives. Increasing local governments’ share in a shared tax should increase their motivation to support local economic activity, resulting in better performance nationwide (e.g. Oates).
Critique: Increasing local governments’ share means decreasing the shares of other levels of government.
4. Democracy. Decentralisation, by reducing the scale of government increases citizen participation and cultivates civic virtue and enhances electoral accountability because citizens are more informed about local issues (e.g. Tocqueville, J.S. Mill, Jefferson).
Critique: Local government can cultivate corruption as well as virtue and are not necessarily any better informed about local as opposed to national issues.
5. Checks, balances and liberty. In decentralised systems, strong local government will check government abuses and protect against central government abuse (e.g. Tocqueville, Madison, Hamilton).
Critique: Central governments can pursue divide and conquer mechanisms while local government may use their powers to protect local abuses (e.g. slavery).
6. Veto players and change. By making policy changes depend on more actors, decentralisation tends to increase policy stability (e.g. Proudhon, Hume).
Critique: Can lead to the entrenchment of bad policies and lack of incentive for innovation.
7. Local information and policy innovation. Local governments are able make better use of local information, which can lead to policy innovation (e.g. Turgot, Brandeis, J.S. Mill)
Critique: Local governments are not necessarily adept at eliciting local information, while central government can make more use of policy innovations.
8. Ethnic conflicts. Political decentralisation defuses ethnic conflicts by satisfying demand for local autonomy.
Critique: Political decentralisation may equally entrench such conflicts.
Against
1. Fiscal pressures. Politically strong local governments undermine fiscal and macroeconomic discipline by exploiting “soft budget constraints” to extract central government transfers (Kornai)
Critique: These are more a function of weak central government than strong local governments.
2. Fiscal coordination. When local governments and central governments can independently tax the same base or are expected by voters to spend on the same services, leading to problems of over-taxing or over-spending.
Critique: Pressures to overtax and overspend may offset each other.
3. Inequality. Decentralised systems empower strong places at the expense of weaker ones
Critique: Fiscal equalisation measures can mitigate spatial inequality (McLean)
4. Additional administrative costs. Multiple layers of government multiply the costs of government (Treisman)
Critique: Decentralisation reveals the costs of government to citizens.
5. Decentralisation leads to wasteful zero-sum competition.
Decentralised units generate duplication and waste through individualised rent seeking behaviour (Scitovsky)
Critique: national or international competition rules can limit this

20
a
b
d
e
c
Price, Cost
Quantity
D2
D1
Dcentr
Q1 Qcen Q2
AC
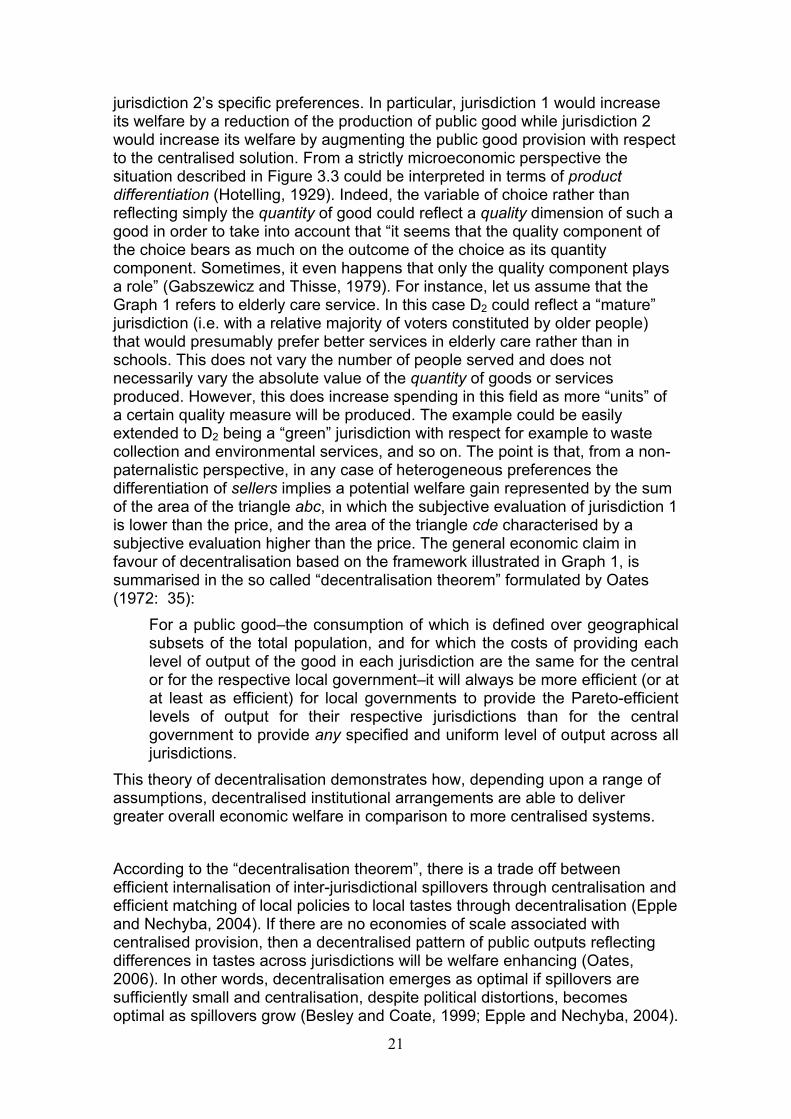
From an economic perspective the discourse is centred on Pareto-efficiency. Indeed, after Tiebout (1956), the benefits of decentralisation could be measured in terms of user satisfaction. Understanding and meeting the local preferences of users in efficient, flexible and responsive ways can be facilitated by decentralised service delivery systems. The principle of subsidiarity is relevant here in seeking to decentralise decision making to the lowest appropriate level. Cost efficiency can be improved through allocative efficiencies in resource distribution and user satisfaction can be enhanced through more appropriate, even ‘personalised’, and accountable public services. Overall, in the Tiebout model, horizontal government competition is likely to lead to efficiency in the local public sector (Epple and Nechyba, 2004). However, population mobility is the central mechanism in this model. Oates (1972) provides a stylised formal analytical model to address this issue, in terms of consumers’ surplus without the strict assumption of mobility of households. In order to explain the benefit of decentralisation his model assumes that the national community is composed of two geographical jurisdictions (1, 2) with different preferences between them concerning their optimal quantity of public good and perfectly homogenous preferences within. Under the assumption of (i) no external effects between jurisdictions and (ii) a production function of the public good characterised by Constant Returns to Scale (CRS) the economic decision-making process concerning the production of the public goods could be represented by Figure 3.3. Here the demand curve for the public good of jurisdiction 1, 2 and the aggregate demand arising from the centralised solution are represented respectively by D1, D2, and Dcentr. In our example jurisdiction 2 has a strong preference for the public good showing a demand curve higher than the jurisdiction 1 demand curve for each price. AC represents the average cost for the provision of the public good.
Figure 3.3. Decentralisation Theorem
Consequently Q1, Q2, would be the quantity produced, at a price equal to the average cost AC, respectively by the first jurisdiction and the second jurisdiction under decentralisation – i.e. if they would be able to set their own preferred quantity of public good provision – and an intermediate quantity, say Qcentr, would be the quantity produced under a centralised setting. The crucial point is that the centralised solution is unable exactly to satisfy neither jurisdiction 1 nor
21
jurisdiction 2’s specific preferences. In particular, jurisdiction 1 would increase its welfare by a reduction of the production of public good while jurisdiction 2 would increase its welfare by augmenting the public good provision with respect to the centralised solution. From a strictly microeconomic perspective the situation described in Figure 3.3 could be interpreted in terms of product differentiation (Hotelling, 1929). Indeed, the variable of choice rather than reflecting simply the quantity of good could reflect a quality dimension of such a good in order to take into account that “it seems that the quality component of the choice bears as much on the outcome of the choice as its quantity component. Sometimes, it even happens that only the quality component plays a role” (Gabszewicz and Thisse, 1979). For instance, let us assume that the Graph 1 refers to elderly care service. In this case D2 could reflect a “mature” jurisdiction (i.e. with a relative majority of voters constituted by older people) that would presumably prefer better services in elderly care rather than in schools. This does not vary the number of people served and does not necessarily vary the absolute value of the quantity of goods or services produced. However, this does increase spending in this field as more “units” of a certain quality measure will be produced. The example could be easily extended to D2 being a “green” jurisdiction with respect for example to waste collection and environmental services, and so on. The point is that, from a non-paternalistic perspective, in any case of heterogeneous preferences the differentiation of sellers implies a potential welfare gain represented by the sum of the area of the triangle abc, in which the subjective evaluation of jurisdiction 1 is lower than the price, and the area of the triangle cde characterised by a subjective evaluation higher than the price. The general economic claim in favour of decentralisation based on the framework illustrated in Graph 1, is summarised in the so called “decentralisation theorem” formulated by Oates (1972: 35):
For a public good–the consumption of which is defined over geographical subsets of the total population, and for which the costs of providing each level of output of the good in each jurisdiction are the same for the central or for the respective local government–it will always be more efficient (or at at least as efficient) for local governments to provide the Pareto-efficient levels of output for their respective jurisdictions than for the central government to provide any specified and uniform level of output across all jurisdictions.
This theory of decentralisation demonstrates how, depending upon a range of assumptions, decentralised institutional arrangements are able to deliver greater overall economic welfare in comparison to more centralised systems. According to the “decentralisation theorem”, there is a trade off between efficient internalisation of inter-jurisdictional spillovers through centralisation and efficient matching of local policies to local tastes through decentralisation (Epple and Nechyba, 2004). If there are no economies of scale associated with centralised provision, then a decentralised pattern of public outputs reflecting differences in tastes across jurisdictions will be welfare enhancing (Oates, 2006). In other words, decentralisation emerges as optimal if spillovers are sufficiently small and centralisation, despite political distortions, becomes optimal as spillovers grow (Besley and Coate, 1999; Epple and Nechyba, 2004).

22
In addition to the quantity/quality issue, from a broader perspective, decentralisation could enhance the capacity to address particular local circumstances in the sense that decentralisation enables public policy and service delivery to reflect geographical differences more effectively than centrally determined approaches. Research has established the importance of place-based effects (e.g. peer effects, neighbourhood and intergenerational effects) that significantly influence public policy and service outcomes (Department for Communities and Local Government, 2007). Decentralisation of public service delivery provides the potential for greater context sensitivity in addressing such place-based effects, adapting broader policy and service approaches, managing differences in services and their potential for improvement between places and contributing to the identification of which spatial levels are the most appropriate for specific kinds of policy and service delivery. In addition, ‘the provision of public services should be located at the lowest level of government encompassing, in a spatial sense, the relevant benefits and costs’ (Oates, 1999: 1122). In line with this argument, more recently, the ‘New Public Management’ literature emphasises the importance of decentralisation in connecting service producers and users, enhancing the responsiveness of services to meet the differentiated choices and rising expectations of users, and improving the efficiency of resource allocation (Tomaney et al., 2009). Moreover, decentralisation could encourage creativity and innovation. Decentralisation enhances autonomy and empowers regional and local actors with the responsibility, resources and decision-making powers to address regional and local policy and service delivery issues. Therefore, in addition to better locally targeted policies potentially applicable and known to the whole set of jurisdictions, experimentation and innovation in public service delivery might result as different places try to find solutions through different approaches in different policy areas5. In addition, the devolved administrations’ ability to tailor policies to local needs generates innovation in service provision through inter-territorial competition (Rodríguez-Pose and Gill, 2005). Competition, in turn, gives sub-national governments the incentive to foster local economic prosperity and to promote the development of local markets (Weingast, 2009). Moreover, decentralisation gives sub-national governments an incentive to produce public goods and services more efficiently by creating inter-jurisdictional competition for residents and economic activity through making use of local resources, knowledge and capacities (Rodríguez-Pose and Tijmstra2009: 2044). In a decentralised system, economically less developed regions, for instance, may offer more attractive investment conditions, such as more flexible labour markets or lower tax rates (Lessmann, 2009). The
5 This idea is expressed in Louis Brandeis’ seminal dissenting US Supreme Court judgement “It is one of the happy accidents of the federal system that a single courageous state may, if its citizens choose, serve as a laboratory, and try novel social and economic experiments without risk to the rest of the country”, New State Ice Co. v. Liebmann, 285 U.S. 262, 311 (1932). This statement stimulated a whole branch of American political science. See the classic article by Walker (1969).

23
investments they attract may help poor regions to catch up with richer ones with less centrally mandated redistribution (Lessmann, 2009). A further positive implication of decentralisation arises in terms of better co-ordination of regional and/or local agents. Decentralised provision of public services and goods can facilitate and encourage the closer relationships and dialogue helpful to co-ordination and integration amongst multiple regional and local agents involved the administration and delivery of public services. As service delivery seeks efficiencies through connecting a wider array of agents in integrated (or ‘joined-up’) approaches to cross-cutting problems, decentralisation can provide practical ways of making this happen. In addition, central government coordination can improve on decentralised outcomes when local public goods and services, such as education, public safety or public infrastructure are provided by overlapping local jurisdictions (Epple and Nechyba, 2004). Nonetheless, the literature on decentralisation notes negative effects or “costs” potentially linked to the decentralisation process. As already mentioned, from a political perspective, the counterpart of transparency and involvement is represented by parochialism, insularity and institutional capture. Decentralised public service delivery systems can promote inward-looking approaches and outlooks that focus exclusively upon local priorities. Opportunities to learn from innovation elsewhere in the system or to address cross-boundary issues such as skills and transport may be stymied as a result. Unproductive and wasteful competition for resources may also be encouraged. Such issues might be particular problems in highly decentralised systems with only limited or loose ties and/or regulation through broader regional and/or national structures. In addition, decentralised systems open to local user involvement may risk the impact of sectional interests exerting undue influence and distorting local decision making. From the economic perspective, decentralisation could fail if, for example, the production of public goods could be characterised by sub-additive cost function and scale economies. Therefore, decentralised systems can risk duplicating effort and resources which undermines the potential scale economies and cost efficiencies available through larger scale service delivery. Hence, the cost efficiency and economic viability of decentralised services may be compromised through the limited demand generated by lower levels of population within smaller catchment areas. Service standards and consistency may also be uneven between different areas as smaller scale and different approaches are pursued in different places. Although geographically differentiated provision of public goods – based on heterogeneous preferences between local jurisdictions – is seen as a welfare-enhancing factor, such unevenness and differences in service delivery raise challenges for managing, planning and improving public services that contribute to social and spatial disparities because people’s access to public services is determined by the area in which they live (often described as the “postcode lottery”). A key issue here is whether the same services in different places are delivered at the same or different levels of cost efficiency and with the same or different levels of user satisfaction. In other words, in addition to the productive efficiency mentioned above, the diversity of preferences within a jurisdiction is a crucial issue in order to obtain the efficiency gain based on users’ surplus.

24
Moreover, resource constraints could ‘condemn’ poorer jurisdictions to lower levels of services regardless of their preferences generating regressive phenomena such as “red-lining” and the stigmatisation of places. In addition to financial resources local jurisdictions could suffer a lack of capacity and specialised knowledge. Decentralised delivery systems can struggle to organise and build capacity to take good decisions and to provide specialised services which require high levels of technical competence and/or sophisticated equipment. For instance, fiscal decentralisation may weaken the capacity of central government to reduce spatial disparities (Ezcurra and Pascual, 2008). A central public sector may generate a more balanced distribution of income by channelling resources from richer regions to poorer ones (Prud’homme, 1995). Figure 3.3 shows the dynamic of potential benefits and costs of decentralisation for the provision of public goods and indicates that the nature and extent of decentralisation will shape the quantity and quality of public goods which affect the performance of local economies. Figure 3.3 demonstrates that decentralisation can have both positive and negative effects on the set of characteristics (quantity and quality) of inputs which, in addition to the direct effect of decentralisation, determines (and is itself determined by) the performance of local government. On the on hand, potential negative effects arising from devolution are linked with (i) enhanced lobbies’ ability to capture policy-makers and bureaucrats at local level and with the potentially (ii) lower level of skills of the latter at the local level. Further, strictly economic factors such as the (iv) missed exploitation of potential economies of scale due to the lack of a critical mass at lower (local) level of activity and the (v) lack of co-ordination in addressing externalities issues could also result in a Pareto-inefficient outcome in the provision of public goods. On the other hand, (a) better political accountability of local policy-makers and bureaucrats and consequent (b) improved political and technical responsibility, accompanied with their (c) better knowledge of the local resources and issues and the relative (c) easier innovation (both of process and product) could have considerable efficiency-enhancing effects. Therefore, the net effect depends upon the balance amongst multiple factors and, as a result, is rather case-specific and cannot be determined ex ante.

25
Figure 3.3. Dynamic of potential benefits and costs of decentralisation for the provision of public goods
3.4 Decentralisation and public service efficiency: some empirical evidence Although theoretical arguments highlight that decentralisation represents both a resource and a threat for local government and for the economic performance of the system as a whole, the discourse on its positive effects has generated a global trend towards greater decentralisation in order to achieve greater growth and efficiency (Rodríguez-Pose and Ezcurra, 2010). Despite this global trend, the empirical analysis does not unambiguously corroborate the claims of a positive effect of decentralisation on economic performance. In a recent paper regarding the Italian case, Boetti et al. (2010) utilising both parametric (stochastic method) and non-parametric (DEA) approaches performed an analysis on the spending efficiency of 262 Italian municipalities considering four outputs (number of served inhabitants, amounts of waste collected, length of municipal road, and number of pupils and old people) generated by four different categories of public current expenditure (general administration, waste management, road maintenance and local mobility, and education and elderly care) for the year 2005. According to both techniques, local governments that enjoy a higher level of decentralisation (measured as revenue share) show a higher level of spending efficiency. In other words, consistent with modern fiscal federalism theories, decentralisation seems to be an efficiency enhancing factor. Barankay and Lockwood (2007) examine the impact of decentralisation and the productive efficiency of government using evidence from Swiss cantons and show robust relationships between decentralisation and higher educational achievement. More inconclusive findings are identified by Balaguer-Coll, et al. (2009) with respect to the Spanish case. Adopting a two-stage approach , in their study regarding a sample of municipalities with a population over 1,000 inhabitants for the years 1995 and 2000 they consider eight outputs (population, number of streetlights, waste collected, street infrastructure surface areas, public buildings
Quantity & Quality of inputs
Local performance
Decentralisation Lobbies, bureaucrats’ skills, economies of scale (critical mass), externalities
Accountability, responsibility, knowledge, preferences, innovation
(+) (‐)

26
surface area, surface area (Lonjas), registered surface area of public parks, and assistance centre surface area) generated by five inputs (wages and salaries, expenditure on goods and services, current transfers, capital expenditure, and capital transfers). The authors conclude that they “cannot provide a clear-cut answer as to whether enhanced decentralisation, or enhanced centralization, is ‘good’ or ‘bad’ in terms of efficiency” (Balaguer-Coll et al., 2009, p. 27). Indeed, their results do show evidence of efficiency gains generated by enhanced decentralisation (decentralisation economies) increasing over time, but this conclusion cannot be generalised to their whole sample. Moreover, Freinkman and Plekhanov (2009) distinguish between the effects of decentralisation on inputs from the effects on outputs and find that there is no significant effect on key inputs into secondary education and utility provision (e.g. schools, computers, or availability of pre-schooling) but decentralisation has a significant positive effect on average examination results (a proxy for education output) and on the quality of municipal utilities provision measured in terms of reliability. The authors interpret this evidence as consistent with the accountability and incentives argument in favour of decentralisation in the sense that as a result of the lack of incentives on local officials to improve the quality of public services, often process-oriented solutions are introduced, making local officials accountable for centrally observed inputs such as student-teacher ratios or hospital beds per head. Therefore, local units, also benefiting from inter-jurisdictional input-equalising grants, would put effort into achieving these targets regardless of decentralisation and citizens’ preferences. However, once the outcome is considered, decentralisation has a role to play in influencing results indirectly monitored by central government in a way that decentralised settings will be more efficient than centralised ones. Focusing on this idea of central targets assigned to local governments, Revelli (2009) explores the link between fulfilment of central expenditure targets and English local government performance. This paper utilises as its performance measures of 150 English local authorities that are responsible for bulk of local public expenditure contained in the Comprehensive Performance Assessment system (CPA)6 covering five main areas (services to children and young people; social care services to adults, elderly and mentally ill people; housing services; environmental services; culture) for the years 2002 to 2007. The author finds empirical evidence that local public expenditures in excess of centrally set spending standards have a detrimental effect on performance. This evidence, even if not directly linked to the decentralisation issue, could be interpreted as consistent with a negative effect of decentralisation in the sense that it indicates that if a local body, differentiating its spending behaviour, deviates its actual spending decision from a centrally set spending standard, a lower level of efficiency will obtain. Nonetheless, Andrews and Martin (2007) in a study comparing England to Welsh performance indicators, covering a range of services, show that the decentralised Welsh approach has not yet delivered significantly better performance in public services to that achieved in comparable areas of England. Moreover, in many cases services in Wales have performed less well and improved more slowly, although it is unclear whether 6 Due to the nature of the CPA system which essentially consists of qualitative ranking measures ranging assuming value “poor”, “weak”, “fair”, “good” and “excellent”, the paper adopt an ordered response probit model.

27
this study reveals more about the context in Wales than the principle of decentralisation. From a more general perspective, an aggregate study performed by Rodríguez-Pose and Ezcurra (2010), analysed the effects of three different types of decentralisation (fiscal, administrative and political) on economic growth analysing 21 OECD countries between 1990 and 2005. Their study finds a negative and robust effect of fiscal decentralisation on economic growth. As for administrative decentralisation, a further negative effect on growth is found even if it is weaker and less robust than the one relative to fiscal decentralisation. Finally, with respect to political decentralisation the impact does not appear robust because of the sensitivity to the proxy used to measure it. When Schneider’s (2003) index is used, the degree of political decentralisation shows a positive influence on economic growth, while using Hooghe at al.’s (2008) index its impact is marginally negative and significant when controlling for the fiscal decentralisation of current expenditures. However, if capital expenditures are considered its effect remains still negative but not significant. Therefore, this study argues that “the potential economic benefits of fiscal decentralization in terms of economic performance are more than counterweighed by the potential economic pitfalls of transferring ever greater resources to sub-national tiers of government” (Rodríguez-Pose and Ezcurra, 2010: 25). Clearly these kinds of study analyse in an indirect way the link between decentralisation and efficiency, in the sense that should decentralisation improve the quality of public services, this will result in higher growth via the systemic link between infrastructure and growth. Nonetheless, with a more specific attention paid to the efficiency issue, but sharing the same macroeconomic definition of efficiency outputs, Adam et al. (2008) in a study of 21 OECD countries between 1970 and 2000 found a positive and robust effect of decentralisation on efficiency measured using two output measures; namely the Economic Performance Indicator (EPI) and the Economic Stability Indicator (ESI)7. Indeed, their study, augmenting the relevant non-parametric literature on efficiency (see e.g. Afonso et al., 2005) with the regression analysis of the effect of decentralisation, shows that DEA efficiency scores are positively affected by fiscal decentralisation. This result is robust according to different proxies of decentralisation based both on the revenue and on expenditure grounds. Therefore, it could be argued that the empirical relationship between decentralisation and efficiency, although generally supporting the positive link between decentralisation and economic efficiency, also reveals cases of negative effects. This finding supports the idea that results are sensitive both to socio-economic contexts and to estimation techniques.
3.5 Conclusion and assessment This section has reviewed the conceptual and methodological issues in defining and measuring decentralisation and efficiency and the relationships between them. The empirical evidence is mixed, reporting both positive and negative outcomes often reflecting different contexts and estimation techniques as well
7 EPI is composed by unemployment rate, GDP per capita, and annual GDP growth rate, while ESI is composed by standard deviation of the GDP growth rate and by the inflation rate.

28
as the different policy areas addressed. Many of these studies seek to measure objective indicators (waste collected, length of municipal road, public building, etc.) without controlling for the quality of outputs – an exception being Revelli’s (2009) use of the CPA (a comprehensive measure of local performance developed by UK Audit Commission), although this measure does not allow us to know whether decentralisation successfully responds to citizens’ heterogeneous local preferences. Decentralisation is justified first and foremost as improving the efficient delivery of public policies. We have demonstrated the difficulty of establishing a consistent and robust link between decentralised government the efficiency of public services. Reviewing the arguments Hooghe and Marks conclude:
The structure of subnational government hangs on the size of the state, which is the outcome of historical forces that have little to do with efficiency and a lot to do with distributional geopolitical conflict. Moreover, in some states, regional units have histories as independent polities and resist being marshalled by the drum of efficiency (2009: 238).
In this context, a more fruitful line of inquiry may be to assess whether in general citizens’ are most satisfied with services under decentralised systems of government. Yet, whether decentralisation yields more or less satisfaction with government and public policies has been overlooked by the literature. No study so far has addressed whether decentralisation leads to greater individual satisfaction with aspects that are directly related to the effectiveness, or lack of it, of the policies implemented by decentralised systems. This represents an omission given the growing government policy concern with wellbeing as the focus for public policy. It is this set of questions that the rest of this report addresses. There is an opportunity to analyse the link between decentralisation and efficiency taking into account citizens’ preferences and satisfaction, which represents two pivotal issues in relation to public and goods and services affected by the decentralisation process. In addition, decentralisation of powers and resources to lower tiers of government can – under different circumstances and in different contexts – contribute to both increase and reduce interpersonal inequalities. Whether decentralisation is good or bad for inter-personal inequality may be highly dependent upon the level of development of a territory. These issues enter the debates in the concerns about “postcode lottery” effects of decentralisation. Behind the latter is the implication that disadvantaged places lack the capacity to derive putative benefits from decentralisation. The following sections shed light on these important questions. A further, and important, point needs to be made here. Both the analysis of well-being and the relationship between decentralisation, inequality and growth presented in the following sections, focus on the impacts on individuals. The impact of decentralisation on individuals has been almost completely overlooked by the literature, which tends to focus instead on its impacts within specific territories (mainly at regional scale – see above.) Our analysis is innovative insofar as we focus on the impacts of decentralisation on individuals and this connects with that aspect of current government policy toward decentralisation in England.

29
4 Decentralisation and wellbeing
4.1 Introduction We noted above that in the context of the difficulty of finding robust evidence for the impact of decentralisation on the efficiency of public services and suggested that a more fruitful approach maybe be to attempt to assess its impact on citizen’s perceptions of their wellbeing. There is an important and emerging literature on the subjective well-being (SWB) of individuals, which has strongly influenced national policy debates (see Cameron 2010)8. This literature tends to assume the importance of well-functioning institutions in the promotion of SWB, although there are few studies which look at the relationship between decentralisation and SWB (exceptions include Frey and Stutzer, 2000; Bjørnskov et al., 2008a; Voigt and Blume, 2009). To date, we are not aware of any study which has directly addressed whether decentralisation leads to greater individual satisfaction with aspects directly related to the effectiveness, or otherwise, of policies implemented by decentralised governments.
4.2 Decentralisation and subjective well-being Much of the interest in decentralisation has been centred on the economic implications of the transfer of powers and resources to sub-national governments. In general, macroeconomic studies have been used to address whether decentralisation has contributed to greater economic efficiency or resulted in more or less territorial inequality. Microeconomic studies have looked at the impact of decentralisation on poverty and interpersonal inequality and social capital. Macroeconomic studies have focused on income, unemployment and inflation. Often inconclusive, such studies may also overlook the extent to which decentralisation is primarily about improving the delivery of public services to individuals in ways which more closely meet their needs and wants and lead them to be more satisfied with their provisions by government. This issue, however, is strangely neglected in the literature. Bjørnskov et al (2008: 140a) note that arguments about whether local autonomy leads to greater satisfaction with public policies, in particular, and political institutions, in general, are closely linked to arguments for and against decentralisation more broadly. In its favour is the “fiscal decentralization theorem” (Tiebout, 1956; Klugman, 2004) discussed above, which suggests that local governments have a greater potential to tailor their specific policies to the needs of citizens in ways that produce greater satisfaction levels. Moreover, decentralisation engenders greater local competition producing efficiency gains and increased accountability and transparency. Critics doubt whether individual needs and wants vary much between localities; suggest some local authorities will lack the capacity to act effectively and are concerned about the dangers of
8 For a fuller treatment of these issues and further details on the research methodology, including the econometric specification, data and variables, are contained in Diaz-Serrano and Rodríguez-Pose (2011).

30
increasing inequality in decentralised governance systems (see Prud’homme, 1995 for a widely cited analysis of “the dangers of decentralization”)9.
4.2 Research methodology In order to determine whether the aspects linked to decentralisation leading to a greater or lower citizens’ satisfaction prevail, the analysis examines how cross-country differences in political and fiscal decentralisation (key independent variables) affect the level of satisfaction of individuals with democracy, government, the economic situation, the education and health systems, and their overall levels of happiness (dependent variables). While in any regression analysis the issue of causation is bound to be thorny, in happiness and subjective well-being research scholars have traditionally approached the question by asking themselves whether happy or more satisfied citizens would choose, in the case of this report, a decentralised system, while unhappy ones would prefer a centralised one (Bjørnskov et al., 2010). Given the larger stability of decentralised institutions over time – even in a period of a drive towards devolution such as the 1990s – than of the happiness and satisfaction indices used in the report, the possibility of reverse causality is extremely unlikely, suggesting as stated by previous research into this type of analysis (e.g. Frey and Stutzer, 2000; Dorn et al., 2008) that “causality runs unambiguously from direct democratic rights to satisfaction with life” (Frey and Stutzer, 2000, p. 927). In addition, by introducing a fixed effects estimation which includes not only specific country effects, but also specific country-time effects in order to control for unobserved heterogeneity across countries and time-periods, the fact that decentralisation factor scores are robust, limits any potential biases linked to endogeneity and omitted variables (see also Bjørnskov et al. 2010). The dependent variables stem from the four waves of the European Social Survey (ESS) that have been made available. This biennial cross-national survey aims to create a standard of methodology for cross-national attitude surveys. Its main focus are people’s attitudes and underlying values, but it also contains a number of social background variables of individuals, as well as their partners and parents. The available survey years are 2002, 2004, 2006 and 2008, and the geographic coverage is at European level. In order to maximise the number of observations by country and across different time periods, we pool the four available waves of the ESS. The ESS consists of regular ‘rounds’ of data collection, with each round involving an independent cross-sectional sample in each nation. The target population for each participating nation is defined as all adults (15 years or older) resident in households within the borders of the nation, regardless of nationality or citizenship. The geographic coverage in the four available waves refers to 30 countries, mostly European. One of the most important features of the ESS questionnaire is that it contains both fixed and rotating elements. In the rotating part of the questionnaire, every
9 See Section 2 for a discussion of how these claims have been expressed in current national policy debates.

31
wave includes two specific topics that can change from wave to wave. The fixed part consists of questions that are included in every ESS-wave. This module includes some basic socio-economic and demographic background information, but also some questions regarding respondents’ satisfaction in different domains. We use these variables to measure the impact of government decentralisation on individual’s subjective well-being. More specifically our outcome variables regard the following satisfaction domains: happiness, present state of the economy, satisfaction with government and satisfaction with democracy, state of education and state of health services. Elicited individuals’ responses are based on an eleven-point scale where 0 means extremely bad/dissatisfied and 10 means extremely good/satisfied. In Table 4.3 we show a summary statistics of the satisfaction variables used in the study. Since the variable collecting the degree of individual’s happiness refers to the same concept than individual’s life satisfaction, we will only use the first as an indicator of the level of individual’s subjective well-being (SWB). Regarding our SWB indicator, i.e. happiness, we observe that the five Nordic countries are the ones reporting the highest levels of SWB. There are a small number of countries reporting a very low level of SWB, i.e. average scores below seven. These countries are in Southern (with the exception of Spain) and Eastern Europe. Looking at the remaining of the satisfaction domains regarding government and institutions, we can distinguish three groups of countries. One group made of countries where their citizens exhibit a high degree of satisfaction with institutions. This group includes, once again, the Nordic and Western European countries. In the negative extreme, we find Eastern European countries plus Portugal. Following the theoretical discussion in Section 3 the decentralisation variables are divided, into political and fiscal decentralisation variables. They stem from two different sources. Political decentralisation indicators are taken from Hooghe et al.’s (2008) Regional Authority Index (RAI). The data covers 42 countries for the period 1950-2006 (Table 4.1). The Regional authority index (RAI) is measured along eight dimensions, i.e. this index results as the combination of different aspects of decentralisation. In addition to Hooghe et al.’s (2008) data, specific data on fiscal decentralisation are used. This data consists of indicators calculated as the ratio between sub-national and general economic magnitudes. These are yearly indicators covering the period 1972-2005. The source of these variables is the Government Finance Statistics of the International Monetary Fund. We use five indicators covering the following five economic variables: expenditure, current expenditure, capital expenditure, revenues/grants and tax revenues. In order to test the impact of decentralisation on individual’s subjective well-being (SWB), we match the ESS with the decentralisation variables. All individuals surveyed in the ESS and residing in the same country have assigned the same value of the corresponding decentralisation index. Since the individual data used here is a pool the four waves of the ESS, the decentralisation variables vary not only by country but also by wave. For instance, for the UK in the 2002 wave, we assign the time-average of a given decentralisation measure from the first available year of the measure from to 2001. For the 2004 and 2006 waves, we assign the same time-average extended to 2003 and 2005, respectively. For the 2008 wave, each country is

32
assigned the same values of the decentralisation indicators as in 2006, because the latest available years for our decentralisation measures are 2005 and 2006 for the fiscal decentralisation and the RAI dataset, respectively. According to the RAI index (Table 4.0), the top five of decentralised countries are Germany, Belgium, Spain, Switzerland, and Austria . At the bottom of the ranking we find small countries as Iceland, Luxembourg, Estonia, Cyprus, and Bulgaria. The specific fiscal decentralisation measures provide the following ranking: the top five is composed now by Switzerland, Germany, Denmark, Sweden and Finland, while at the bottom of this ranking we find Hungary, Luxembourg, Israel, and Portugal10. In order to determine whether the aspects linked to decentralisation lead to a greater or lower citizens’ satisfaction, our analysis examines how cross-country differences in political and fiscal decentralisation (key independent variables) affect the level of satisfaction of individuals with democracy, government, the economic situation, the education and health systems, and their overall levels of happiness (dependent variables). In identifying the relationships and associations, this work provides an exploratory starting point for thinking through issues relating to the direction and magnitude of causation in relation to particular policy areas enacted by decentralised institutions. In our econometric analysis we resort to the use of pooled cross-sections referring to different years. This approach allows us to introduce a temporal dimension in the empirical model. That is, decentralisation measures not only vary by country, but also with time. Our outcome variables are individuals’ self-reported subjective indicators. This circumstance implies that the effect of the country level covariates on the outcome is more sensible to vary, in some cases in a non-negligible way, in different periods of time.
4.6 Results of the analysis The top half of Table 4.2 depicts the results for the individual features which may affect SWB and levels of satisfaction. These results are virtually all statistically significant and, by and large, reproduce those reported in previous empirical analyses, underlining the robustness of the exercise. First, age matters for happiness and satisfaction with institutions and policies. SWB and satisfaction tend to decrease with age, but the relationship is U-shaped, as happiness and satisfaction increase after middle-age. Women tend to be happier, but less satisfied than men with institutions and with the economic situation, democracy and the health system in particular. Also as expected, married people tend to report greater levels of overall happiness and satisfaction that those separated, divorced, widowed or never married. The only partial exception are widowed individuals, who, once controlled for everything else, have levels of satisfaction with government, democracy and the health system that are similar or superior to those married. Higher levels of education yield happier people, but more critical with the state of democracy, the economy and the delivery of public services. Health is also an important determinant of happiness and satisfaction. The lower is the level of self-reported health, then 10 Further details on the data can be found in Diaz-Serrano and Rodríguez-Pose (2011).

33
the lower is the SWB and satisfaction with institutions. Larger households tend to be happier, but, with the exception of the state of the health system, not necessarily more or less satisfied with institutions than smaller households. Right-leaning individuals also tend to be happier and generally more satisfied with institutions and the state of public services than left-leaning ones. Non-nationals are also happier than nationals, but not more satisfied with public services. And, as could be expected, those who report that they live comfortably are happier and more satisfied than those who consider that they are in a very difficult or difficult position or simply coping. The strongest associations with happiness and satisfaction with institutions comes, however, from two variables: religiosity and trust. Religious individuals, regardless of the denomination of their church, tend to be significantly happier, when other factors are controlled for, that those reporting a lower level of religiosity. And trusting individuals, reinforcing the strong effects reported by Helliwell and Wang (2010) reveal themselves as the happiest and most satisfied of all. The distinction between overall happiness and satisfaction with particular institutions is also an important one. While age, marital status, self reported health, feeling about household income, trust, religiosity, and political orientation display similar coefficients both on the different satisfaction domains as on happiness, gender, education and citizenship lead to impacts that are considerably different in terms of overall happiness, relative to the level of satisfaction with economic and political institutions and with specific policies. Having controlled that our results conform to previous analyses of the personality and socio-demographic traits behind happiness and institutional satisfaction, in the bottom half of Table 4.2 we now turn to how political and fiscal decentralisation indicators affect these factors. In order to allow for comparisons across alternative models, in Table 4.3 we report the elasticities for the decentralisation indicators. Our estimates reveal that greater political local autonomy matters for the satisfaction of individuals with political institutions and public polices and for their overall happiness. Political decentralisation has a significant and positive effect on happiness and on the majority of the satisfaction domains considered. Political decentralisation leads to greater satisfaction with democracy and with government, as well as with the health system. It is also associated to greater overall happiness. In contrast, there is no statistically significant association between more autonomy and the perception of the state of the economy or with the education system (Table 4.2). If we focus on the specific constituents of political decentralisation, the RAI index significantly raises happiness, satisfaction with democracy and satisfaction with the state of the health services in the country. It is in this latter domain where the RAI reports the largest effect: for example, a 10% increase in the RAI index generates almost a 1.4% increase in an individual’s level of satisfaction with the state of health services (elasticity of 0.136). Other aggregated decentralisation indexes - self-rule, law making and shared-rule – also exhibit an effect on happiness and the different satisfaction domains. Shared-rule and law-making are positively and significantly associated with happiness, satisfaction with government and health services, while self-rule does it on the same variables and also on satisfaction with democracy (Table 4.2). The disaggregated factors behind the composite political decentralisation indices individually also display a positive and generally significant with the

34
diverse measures of satisfaction with institutions and happiness considered. In particular, variables such as fiscal autonomy, which indicates the extent to which a decentralised adminstration controls its own taxation, and executive and fiscal control, both measures of the influence of local and regional governments on national policy and taxation, respectively, display a very strong correlation with overall levels of satisfaction and happiness. If we focus on the six dependent variables considered, overall happiness and satisfaction with the state of health services are the two outcomes that exhibit a greater sensitivity to decentralisation, followed by satisfaction with the government and satisfaction with democracy. That is, political decentralisation seems to have a much greater effect on those variables that affect the perception of individuals about the more political institutions (democracy and government) and, through them, on overall SWB. In contrast, there seems whether policies are conducted at a local, regional or national scale does not affect, either positively or negatively, individual perceptions about the economy. Fiscal decentralisation also exerts a significant effect on the level of satisfaction with political institutions. Practically all fiscal decentralisation indexes are statistically significant at one percent level in all the satisfaction equations. In addition, fiscal decentralisation is important in determining satisfaction with the economic situation and with the state of the education system, whereas political decentralisation is not (Table 4.2). Sub-national capital expenditure is the only variable that consistently exerts a positive and significant influence on the level of satisfaction with institutions. However, as pointed by Rodríguez-Pose and Tjimstra (2009), decentralisation processes in Europe and elsewhere in the world, have tended to lead to increases in current expenditure at the expense of capital expenditure. The dependent variables which exhibit a greater response to the specific indexes of fiscal decentralisation are satisfaction with economic situation, the government, democracy and the education system. The fact that fiscal decentralisation exert a significant effect on satisfaction with the education system, whereas political decentralisation does not may indicate that citizen’s prefer a better resourced education system, regardless of whether the political decisions are taken at the local or at the national level.
4.7 Conclusions and policy implications The positive effect of political and fiscal decentralisation variables on satisfaction and happiness is an interesting one. This establishes a relationship whereby citizens appear to be happy not only with the transfer of resources – which is an indicator of the capacity of local governments to implement policies - but also with the ability to conduct policies at the local level – which is represented here by the transfer of powers to sub-national governments. The association between greater decentralisation and happiness is also, with the exception of satisfaction with the health system, more strongly associated with more abstract constructs, such as satisfaction with government or democracy or overall happiness, than with more concrete ones, as satisfaction with the economy or with the education system. The fiscal dimension, which represents a more concrete dimension of decentralisation, is wholly connected with satisfaction and happiness. The results reveal that citizens appear to be happy

35
with the principle that their local governments can have a say on their daily politics and policies and with their actual capacity to deliver. Overall, the results highlight that both political and fiscal decentralisation matter, but that it is this latter dimension of decentralisation which seems to be more relevant for citizens. Decentralisation matters positively for the satisfaction of individuals with political institutions and with the specific delivery of some public goods and services. Policies from decentralised governments can therefore be envisaged to influence individual happiness.

36
Tabl
e 4.
0 D
escr
iptio
n of
the
dece
ntra
lisat
ion
varia
bles
Inst
itutio
nal d
epth
(ID
) E
xten
t to
whi
ch a
regi
onal
go
vern
men
t is
auto
nom
ous
rath
er
than
dec
once
ntra
ted.
0: n
o fu
nctio
ning
gen
eral
-pur
pose
adm
inis
tratio
n at
the
regi
onal
leve
l 1:
dec
once
ntra
ted,
gen
eral
-pur
pose
, adm
inis
tratio
n
2: n
on-d
econ
cent
rate
d, g
ener
al–p
urpo
se, a
dmin
istra
tion
subj
ect t
o ce
ntra
l gov
ernm
ent v
eto
3:
non
-dec
once
ntra
ted,
gen
eral
–pur
pose
, adm
inis
tratio
n no
t sub
ject
to c
entra
l gov
ernm
ent v
eto
Polic
y Sc
ope
(PS)
R
ange
of p
olic
ies
for w
hich
a
regi
onal
gov
ernm
ent i
s re
spon
sibl
e
0: n
o au
thor
itativ
e co
mpe
tenc
ies
over
eco
nom
ic p
olic
y, c
ultu
ral-e
duca
tiona
l pol
icy,
wel
fare
sta
te p
olic
y
1: a
utho
ritat
ive
com
pete
ncie
s in
one
are
a: e
cono
mic
pol
icy,
cul
tura
l-edu
catio
nal p
olic
y, w
elfa
re s
tate
pol
icy
2
: aut
horit
ativ
e co
mpe
tenc
ies
in a
t lea
st tw
o ar
eas:
eco
nom
ic p
olic
y, c
ultu
ral-e
duca
tiona
l pol
icy,
wel
fare
sta
te
polic
y
3: a
utho
ritat
ive
com
pete
ncie
s in
at l
east
two
area
s ab
ove,
and
in a
t lea
st tw
o of
the
follo
win
g: re
sidu
al
pow
ers,
pol
ice,
aut
horit
y ov
er o
wn
inst
itutio
nal s
et-u
p, lo
cal g
over
nmen
t 4:
regi
onal
gov
ernm
ent m
eets
the
crite
ria fo
r 3, a
nd h
as a
utho
rity
over
imm
igra
tion
or c
itize
nshi
p
Fisc
al A
uton
omy
(FA
) E
xten
t to
whi
ch a
regi
onal
go
vern
men
t can
inde
pend
ently
tax
its p
opul
atio
n
0: th
e ce
ntra
l gov
ernm
ent s
ets
base
and
rate
of a
ll re
gion
al ta
xes
1:
the
regi
onal
gov
ernm
ent s
ets
the
rate
of m
inor
taxe
s
2: th
e re
gion
al g
over
nmen
t set
s ba
se a
nd ra
te o
f min
or ta
xes
3:
the
regi
onal
gov
ernm
ent s
ets
the
rate
of a
t lea
st o
ne m
ajor
tax:
per
sona
l inc
ome,
cor
pora
te, v
alue
add
ed o
r sa
les
tax
4:
the
regi
onal
gov
ernm
ent s
ets
base
and
rate
of a
t lea
st o
ne m
ajor
tax:
per
sona
l inc
ome,
cor
pora
te, v
alue
ad
ded
or s
ales
tax
Self
Rul
e (S
R)
=ID
+PS+
FA+R
P Th
e au
thor
ity e
xerc
ised
by
a re
gion
al
gove
rnm
ent o
ver t
hose
who
live
in
the
regi
on
Rep
rese
ntat
ion
(RP)
E
xten
t to
whi
ch a
regi
on is
end
owed
w
ith a
n in
depe
nden
t leg
isla
ture
and
ex
ecut
ive:
0: n
o re
gion
al a
ssem
bly
1:
an
indi
rect
ly e
lect
ed re
gion
al a
ssem
bly
2:
a d
irect
ly e
lect
ed a
ssem
bly
3:
the
regi
onal
exe
cutiv
e is
app
oint
ed b
y ce
ntra
l gov
ernm
ent
4: d
ual e
xecu
tives
app
oint
ed b
y ce
ntra
l gov
ernm
ent a
nd th
e re
gion
al a
ssem
bly
5:
the
regi
onal
exe
cutiv
e is
app
oint
ed b
y a
regi
onal
ass
embl
y or
dire
ctly
ele
cted
Law
Mak
ing
A (L
MA
) 0:
regi
onal
gov
ernm
ents
do
not d
esig
nate
repr
esen
tativ
es in
the
legi
slat
ure
0
.5: r
egio
nal g
over
nmen
ts d
esig
nate
repr
esen
tativ
es in
the
legi
slat
ure
La
w M
akin
g B
(LM
B)
0: re
gion
al g
over
nmen
ts d
o no
t des
igna
te re
pres
enta
tives
in th
e le
gisl
atur
e
0.5:
regi
onal
gov
ernm
ents
des
igna
te re
pres
enta
tives
in th
e le
gisl
atur
e
Law
Mak
ing
C (L
MC
) 0:
regi
ons
do n
ot h
ave
maj
ority
repr
esen
tatio
n in
the
legi
slat
ure
0.
5: re
gion
s ha
ve m
ajor
ity re
pres
enta
tion
in th
e le
gisl
atur
e
Law
Mak
ing
(LM
) =L
MA
+LM
B+L
MC
+LM
D
Ext
ent t
o w
hich
regi
onal
re
pres
enta
tives
co-
dete
rmin
e na
tiona
l le
gisl
atio
n,
Law
Mak
ing
D (L
MD
) 0:
the
legi
slat
ure
with
regi
onal
repr
esen
tatio
n ha
s ex
tens
ive
legi
slat
ive
auth
ority
0.
5: th
e le
gisl
atur
e w
ith re
gion
al re
pres
enta
tion
does
not
hav
e ex
tens
ive
legi
slat
ive
auth
ority

37
Tabl
e 4.
0 (c
ontin
uatio
n)
Exec
utiv
e C
ontr
ol (E
C)
Ext
ent t
o w
hich
a re
gion
al g
over
nmen
t co
-det
erm
ines
nat
iona
l pol
icy
in
inte
rgov
ernm
enta
l mee
tings
0: n
o ro
utin
e m
eetin
gs b
etw
een
cent
ral a
nd re
gion
al g
over
nmen
ts to
neg
otia
te p
olic
y
1: ro
utin
e m
eetin
gs b
etw
een
cent
ral a
nd re
gion
al g
over
nmen
ts w
ithou
t leg
ally
bin
ding
aut
horit
y
2: ro
utin
e m
eetin
gs b
etw
een
cent
ral a
nd re
gion
al g
over
nmen
ts w
ith a
utho
rity
to re
ach
lega
lly b
indi
ng
deci
sion
s
Fisc
al C
ontr
ol (F
C)
Ext
ent t
o w
hich
regi
onal
repr
esen
tativ
es
co-d
eter
min
e th
e di
strib
utio
n of
nat
iona
l ta
x re
venu
es
0: re
gion
al g
over
nmen
ts o
r the
ir re
pres
enta
tives
in th
e le
gisl
atur
e ar
e no
t con
sulte
d ov
er th
e di
strib
utio
n of
tax
reve
nues
1:
regi
onal
gov
ernm
ents
or t
heir
repr
esen
tativ
es in
the
legi
slat
ure
nego
tiate
ove
r the
dis
tribu
tion
of ta
x re
venu
es, b
ut d
o no
t hav
e a
veto
2:
regi
onal
gov
ernm
ents
or t
heir
repr
esen
tativ
es in
the
legi
slat
ure
have
a v
eto
over
the
dist
ribut
ion
of ta
x re
venu
es
Shar
ed R
ule
(SH
R)
=LM
+EC
+FC
+CR
Th
e au
thor
ity e
xerc
ised
by
a re
gion
al
gove
rnm
ent o
r its
repr
esen
tativ
es in
th
e co
untry
as
a w
hole
.
Con
stitu
tiona
l Ref
orm
(CR
) E
xten
t to
whi
ch re
gion
al re
pres
enta
tives
co
-det
erm
ine
cons
titut
iona
l cha
nge:
0: th
e ce
ntra
l gov
ernm
ent a
nd/o
r nat
iona
l ele
ctor
ate
can
unila
tera
lly c
hang
e th
e co
nstit
utio
n
1: a
legi
slat
ure
base
d on
the
prin
cipl
e of
regi
onal
repr
esen
tatio
n m
ust a
ppro
ve c
onst
itutio
nal c
hang
e; o
r co
nstit
utio
nal c
hang
e re
quire
s a
refe
rend
um b
ased
on
the
prin
cipl
e of
equ
al
regi
onal
repr
esen
tatio
n
2: re
gion
al g
over
nmen
ts a
re a
dire
ctly
repr
esen
ted
maj
ority
in a
legi
slat
ure
whi
ch c
an d
o on
e or
mor
e of
the
follo
win
g: p
ostp
one
cons
titut
iona
l ref
orm
, int
rodu
ce a
men
dmen
ts, r
aise
the
deci
sion
hur
dle
in th
e ot
her
cham
ber,
requ
ire a
sec
ond
vote
in th
e ot
her c
ham
ber,
requ
ire a
pop
ular
refe
rend
um
3: a
maj
ority
of r
egio
nal g
over
nmen
ts c
an v
eto
cons
titut
iona
l cha
nge
Reg
iona
l Aut
horit
y In
dex
(RA
I) R
AI=
SHR
+SR
Fisc
al d
ecen
tral
izat
ion
Su
bnat
iona
l Gov
ernm
ent
Expe
nditu
re (S
NG
E)
Indi
cato
r: S
ubce
ntra
l Exp
endi
ture
/Gen
eral
Exp
endi
ture
D
efin
ition
Tot
al E
xpen
ditu
re: (
Sta
te G
over
nmen
t + L
ocal
Gov
ernm
ent)/
(Cen
tral G
over
nmen
t-Soc
ial
S
ecur
ity +
Sta
te G
over
nmen
t + L
ocal
Gov
ernm
ent)
Su
bnat
iona
l Cur
rent
Exp
endi
ture
(S
NC
E)
Indi
cato
r: S
ubce
ntra
l Cur
rent
Exp
endi
ture
/Gen
eral
Cur
rent
Exp
endi
ture
D
efin
ition
Cur
rent
Exp
endi
ture
: (S
tate
Gov
ernm
ent +
Loc
al G
over
nmen
t)/(C
entra
l Gov
ernm
ent-
S
ocia
l Sec
urity
+ S
tate
Gov
ernm
ent +
Loc
al G
over
nmen
t)
Su
bnat
iona
l Cap
ital E
xpen
ditu
re
(SN
CA
E)
Indi
cato
r: S
ubce
ntra
l Cap
ital E
xpen
ditu
re/G
ener
al C
apita
l Exp
endi
ture
D
efin
ition
Cap
ital E
xpen
ditu
re: (
Sta
te G
over
nmen
t + L
ocal
Gov
ernm
ent)/
(Cen
tral G
over
nmen
t-Soc
ial
S
ecur
ity +
Sta
te G
over
nmen
t + L
ocal
Gov
ernm
ent)
Subn
atio
nal R
even
ue (S
NR
)
Indi
cato
r: S
ubce
ntra
l Rev
enue
& G
rant
s/G
ener
al R
even
ue &
Gra
nts
Def
initi
on R
even
ue &
Gra
nts:
(Sta
te G
over
nmen
t + L
ocal
Gov
ernm
ent)/
(Cen
tral G
over
nmen
t - S
ocia
l Sec
urity
+
Sta
te G
over
nmen
t + L
ocal
Gov
ernm
ent)
Subn
atio
nal T
ax R
even
ue (S
NTR
)
Indi
cato
r: Su
bcen
tral T
ax R
even
ue/G
ener
al T
ax R
even
ue
Def
initi
on T
ax R
even
ue: (
Sta
te G
over
nmen
t + L
ocal
Gov
ernm
ent)/
(Cen
tral G
over
nmen
t - S
ocia
l Sec
urity
+
Sta
te G
over
nmen
t + L
ocal
Gov
ernm
ent)]

38
Tabl
e 4.
1: T
ime
aver
aged
dec
entra
lisat
ion
inde
xes
by c
ount
ry
R
egio
nal A
utho
rity
Inde
x (R
AI)
Se
lf R
ule
La
w M
akin
g
Shar
ed R
ule
Su
bnat
iona
l Fis
cal
Dec
entr
alis
atio
n
Sco
re
rank
S
core
rank
S
core
rank
S
core
rank
S
core
Ran
k A
ustri
a 17
,87
5
127
0,
46
6
4
0.37
7 B
elgi
um
28,3
6 2
19
,16
2
0,56
4
8,63
2
0.28
11
Bul
garia
1
22
122
0
9
012
Cyp
rus
0 23
0
23
09
0
12
Cze
ch
Rep
ublic
2,
66
20
2,66
20
09
0
12
Den
mar
k 10
,19
10
10,0
89
0,
018
0,
1110
0.
483
Est
onia
0
23
023
0
9
012
Fi
nlan
d 4,
15
17
4,12
17
09
0,
0311
0.
405
Fran
ce
15,0
7 8
15
,07
5
09
0
12
0.25
13
Ger
man
y 29
,35
120
,35
12
19
1
0.50
2 G
reec
e 5,
11
14
5,11
14
09
0
12
Hun
gary
9,
15
12
9,15
11
09
0
12
0.25
13
Icel
and
0 23
0
23
09
0
12
Ire
land
2,
91
19
2,91
19
09
0
12
0.29
10
Isra
el
0.
1615
Ita
ly
16,8
9 7
15
,87
4
09
1,
417
0.
318
Luxe
mbo
urg
0 23
0
23
09
0
12
0.18
14
Net
herla
nds
13,9
5 9
7,
4513
0,
593
6,
53
0.
309
Nor
way
10
11
10
10
09
0
12
0.39
6 P
olan
d 4,
43
16
4,43
16
09
0
12
0.27
12
Por
tuga
l 3,
52
18
3,35
18
0,01
8
0,16
9
0.13
16
Rus
sia
17,5
6
11
,58
0,
782
6
4
Slo
vaki
a 2,
4 21
2,
421
0
9
012
S
love
nia
0 23
0
23
09
0
12
Spa
in
21,1
8 3
18
,18
3
0,49
5
3,02
6
0.28
11
Sw
eden
10
11
10
10
09
0
12
0.45
4.
Sw
itzer
land
19
,5
4
156
0,
593
4,
55
0.
571
Turk
ey
5 15
5
15
09
0
12
Uni
ted
Kin
gdom
8,
72
13
8,54
12
0,03
7
0,24
8
0.28
11
Not
e: T
he c
olum
n la
belle
d as
Sub
natio
nal F
isca
l Dec
entra
lisat
ion
is th
e av
erag
e of
the
five
spec
ific
fisca
l dec
entra
lisat
ion
inde
xes

39
Tabl
e 4.
2: L
inea
r ran
dom
-effe
cts
estim
ates
of e
quat
ion
(3).
Ran
dom
-effe
cts
and
clus
tere
d st
anda
rd e
rror
s ar
e at
yea
r-co
untry
leve
l.
Hap
pine
ss
Satis
fact
ion
econ
omic
si
tuat
ion
Satis
fact
ion
gove
rnm
ent
Sa
tisfa
ctio
nde
moc
racy
Satis
fact
ion
educ
atio
n sy
stem
Satis
fact
ion
heal
th s
yste
m
Coe
f. t-s
tat
Coe
f.t-s
tat
Coe
f.t-s
tat
C
oef.
t-sta
tC
oef.
t-sta
tC
oef.
t-sta
t
Con
stan
t 6.
7194
84
.78*
3.91
3322
.87*
3.07
4213
.84*
3.81
3124
.84*
4.61
4229
.28*
3.85
1018
.93*
Indi
vidu
al v
aria
bles
Age
-0.0
330
-14.
42*
-0.0
231
-7.1
8* -0
.024
6-7
.93*
-0.0
238
-8.3
1* -0
.021
2-5
.51*
-0.0
405
-11.
60*
Age
Squa
red
0.00
03
14.7
9* 0.
0002
7.04
* 0.
0003
9.61
* 0.
0002
8.47
* 0.
0002
4.63
* 0.
0005
12.4
4* W
oman
0.
0719
6.
47*
-0.2
403
-8.9
1* -0
.126
7-5
.16*
-0.1
666
-9.2
8* -0
.078
7-4
.23*
-0.2
681
-10.
62*
(Bas
e: L
ower
prim
ary)
Prim
ary
0.17
25
4.93
* -0
.212
4-4
.12*
-0.1
096
-2.6
8* -0
.157
2-3
.57*
-0.0
985
-2.3
8* -0
.115
2-2
.40*
Low
er s
econ
dary
0.
1959
4.
77*
-0.3
255
-4.9
2* -0
.183
6-3
.19*
-0.2
594
-4.6
7* -0
.310
7-5
.29*
-0.2
541
-4.2
9* U
pper
Sec
onda
ry
0.24
39
6.02
* -0
.278
8-4
.44*
-0.1
716
-3.0
6* -0
.156
6-2
.78*
-0.4
124
-6.3
1* -0
.374
0-5
.73*
Post
-sec
onda
ry, n
on-te
rtiar
y 0.
2555
5.
96*
-0.2
191
-3.1
7* -0
.132
8-2
.20**
-0
.098
9-1
.46
-0
.505
1-6
.89*
-0.4
519
-5.9
0* Fi
rst s
tage
of t
ertia
ry
0.25
21
6.23
* -0
.163
8-2
.43*
-0.1
353
-2.3
8* 0.
0384
0.61
-0
.583
6-8
.17*
-0.3
559
-4.6
8* S
econ
d st
age
of te
rtiar
y 0.
2668
5.
78*
-0.1
049
-1.3
0
-0.1
742
-3.0
0* 0.
0937
1.66
***
-0.5
762
-8.0
8* -0
.267
0-3
.04*
Citi
zens
hip
-0.1
502
-6.1
0* 0.
4430
5.18
* 0.
4900
5.19
* 0.
2923
3.50
* 0.
3235
2.99
* 0.
4652
6.29
* S
elf-r
epor
ted
heal
th
-0.3
956
-32.
35*
-0.1
645
-16.
78*
-0.1
164
-11.
28*
-0.1
461
-14.
23*
-0.1
064
-11.
08*
-0.1
426
-13.
78*
Leve
l of r
elig
iosi
ty
0.03
10
11.3
8* 0.
0358
11.4
2* 0.
0558
10.8
4* 0.
0399
11.6
9* 0.
0389
11.2
5* 0.
0406
11.7
4* Le
ft-rig
ht p
oliti
cal s
cale
0.
0226
5.
56*
0.05
564.
27*
0.06
151.
88**
* 0.
0561
3.82
* 0.
0195
2.03
**
0.02
552.
59*
Trus
t#
0.15
10
34.4
6* 0.
2349
39.0
5* 0.
2264
29.2
0* 0.
2544
35.0
7* 0.
1985
39.9
6* 0.
2166
31.7
8* (B
ase:
Mar
ried)
Sepa
rate
d -0
.601
2 -1
2.88
* -0
.158
7-2
.89*
-0.1
666
-2.7
5* -0
.146
2-2
.72*
-0.1
252
-2.4
3* -0
.054
2-1
.02
Div
orce
d -0
.390
9 -1
4.30
* -0
.117
0-5
.72*
-0.1
557
-6.3
1* -0
.093
4-3
.79*
-0.0
785
-3.3
2* 0.
0112
0.42
W
idow
ed
-0.5
257
-20.
30*
-0.0
061
-0.2
5
0.00
680.
29
0.05
902.
12**
-0
.005
7-0
.26
0.
0393
1.32
N
ever
mar
ried
-0.3
371
-18.
95*
-0.0
484
-2.3
9* -0
.041
3-1
.98**
-0
.005
9-0
.27
-0
.090
5-5
.18*
0.03
591.
42
Feel
ing
abou
t pre
sent
inco
me
(B
ase:
livi
ng c
omfo
rtabl
e)
C
opin
g -0
.196
6 -1
3.59
* -0
.394
3-1
6.04
* -0
.227
7-1
0.60
* -0
.233
6-1
2.56
* -0
.083
7-3
.63*
-0.1
577
-9.7
7* D
iffic
ult
-0.6
900
-22.
14*
-0.8
420
-24.
78*
-0.4
919
-16.
34*
-0.4
996
-15.
27*
-0.2
616
-6.9
8* -0
.331
7-1
2.69
* V
ery
diffi
cult
-1.3
557
-23.
76*
-1.2
993
-25.
16*
-0.8
232
-16.
71*
-0.8
519
-17.
93*
-0.4
395
-9.3
5* -0
.587
7-1
4.14
* H
ouse
hold
siz
e 0.
0147
2.
30*
-0.0
047
-0.8
1
-0.0
013
-0.2
1 -0
.002
8-0
.48
0.
0027
0.43
0.
0364
4.58
* S
igni
fican
t at *
1 pe
rcen
t, **
5 pe
rcen
t and
*** 1
0 pe
rcen
t lev
el. #
Ave
rage
per
cept
ion
of tr
ustw
orth
ines
s of
pop
ulat
ion.
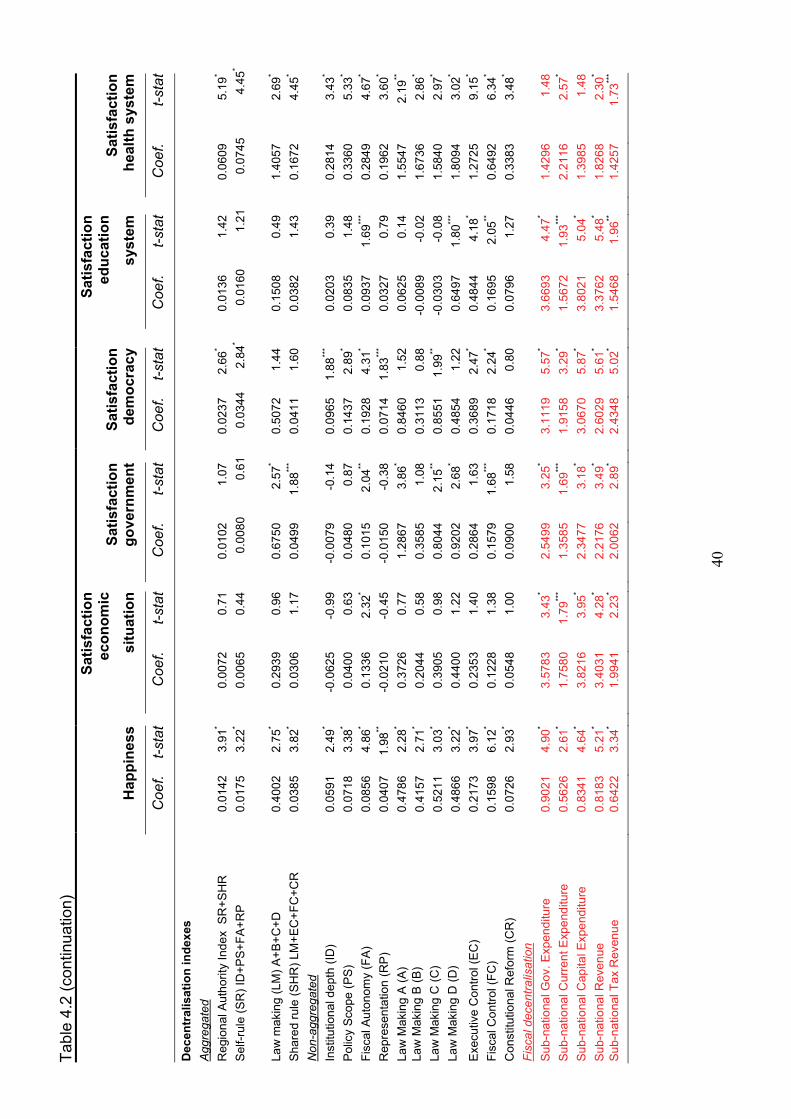
40
Tabl
e 4.
2 (c
ontin
uatio
n)
H
appi
ness
Satis
fact
ion
econ
omic
si
tuat
ion
Satis
fact
ion
gove
rnm
ent
Satis
fact
ion
dem
ocra
cy
Satis
fact
ion
educ
atio
n sy
stem
Satis
fact
ion
heal
th s
yste
m
C
oef.
t-sta
tC
oef.
t-sta
tC
oef.
t-sta
tC
oef.
t-sta
tC
oef.
t-sta
tC
oef.
t-sta
t
Dec
entr
alis
atio
n in
dexe
s
Agg
rega
ted
R
egio
nal A
utho
rity
Inde
x S
R+S
HR
0.
0142
3.91
* 0.
0072
0.71
0.
0102
1.07
0.
0237
2.66
* 0.
0136
1.42
0.
0609
5.19
* S
elf-r
ule
(SR
) ID
+PS
+FA
+RP
0.01
753.
22*
0.00
650.
44
0.00
800.
61
0.03
442.
84*
0.01
601.
21
0.07
45
4.45
*
Law
mak
ing
(LM
) A+B
+C+D
0.
4002
2.75
* 0.
2939
0.96
0.
6750
2.57
* 0.
5072
1.44
0.
1508
0.49
1.
4057
2.69
* S
hare
d ru
le (S
HR
) LM
+EC
+FC
+CR
0.
0385
3.82
* 0.
0306
1.17
0.
0499
1.88
***
0.04
111.
60
0.03
821.
43
0.16
724.
45*
Non
-agg
rega
ted
In
stitu
tiona
l dep
th (I
D)
0.05
912.
49*
-0.0
625
-0.9
9
-0.0
079
-0.1
4
0.09
651.
88**
* 0.
0203
0.39
0.
2814
3.43
* Po
licy
Scop
e (P
S)
0.07
183.
38*
0.04
000.
63
0.04
800.
87
0.14
372.
89*
0.08
351.
48
0.33
605.
33*
Fisc
al A
uton
omy
(FA
) 0.
0856
4.86
* 0.
1336
2.32
* 0.
1015
2.04
**
0.19
284.
31*
0.09
371.
69**
* 0.
2849
4.67
* R
epre
sent
atio
n (R
P)
0.04
071.
98**
-0
.021
0-0
.45
-0
.015
0-0
.38
0.
0714
1.83
***
0.03
270.
79
0.19
623.
60*
Law
Mak
ing
A (A
) 0.
4786
2.28
* 0.
3726
0.77
1.
2867
3.86
* 0.
8460
1.52
0.
0625
0.14
1.
5547
2.19
**
Law
Mak
ing
B (B
) 0.
4157
2.71
* 0.
2044
0.58
0.
3585
1.08
0.
3113
0.88
-0
.008
9-0
.02
1.
6736
2.86
* La
w M
akin
g C
(C)
0.52
113.
03*
0.39
050.
98
0.80
442.
15**
0.
8551
1.99
**
-0.0
303
-0.0
8
1.58
402.
97*
Law
Mak
ing
D (D
) 0.
4866
3.22
* 0.
4400
1.22
0.
9202
2.68
* 0.
4854
1.22
0.
6497
1.80
***
1.80
943.
02*
Exec
utiv
e C
ontro
l (EC
) 0.
2173
3.97
* 0.
2353
1.40
0.
2864
1.63
0.
3689
2.47
* 0.
4844
4.18
* 1.
2725
9.15
* Fi
scal
Con
trol (
FC)
0.15
986.
12*
0.12
281.
38
0.15
791.
68**
* 0.
1718
2.24
* 0.
1695
2.05
**
0.64
926.
34*
Con
stitu
tiona
l Ref
orm
(CR
) 0.
0726
2.93
* 0.
0548
1.00
0.
0900
1.58
0.
0446
0.80
0.
0796
1.27
0.
3383
3.48
* Fi
scal
dec
entra
lisat
ion
S
ub-n
atio
nal G
ov. E
xpen
ditu
re
0.90
214.
90*
3.57
833.
43*
2.54
993.
25*
3.11
195.
57*
3.66
934.
47*
1.42
961.
48
Sub
-nat
iona
l Cur
rent
Exp
endi
ture
0.
5626
2.61
* 1.
7580
1.79
***
1.35
851.
69**
* 1.
9158
3.29
* 1.
5672
1.93
***
2.21
162.
57*
Sub
-nat
iona
l Cap
ital E
xpen
ditu
re
0.83
414.
64*
3.82
163.
95*
2.34
773.
18*
3.06
705.
87*
3.80
215.
04*
1.39
851.
48
Sub-
natio
nal R
even
ue
0.81
835.
21*
3.40
314.
28*
2.21
763.
49*
2.60
295.
61*
3.37
625.
48*
1.82
682.
30*
Sub-
natio
nal T
ax R
even
ue
0.64
223.
34*
1.99
412.
23*
2.00
622.
89*
2.43
485.
02*
1.54
681.
96**
1.42
571.
73**
*

41
R2 w
ithin
0.01
14
0.
0954
0.07
30
0.
0326
0.03
86
0.
0621
R
2 bet
wee
n
0.20
80
0.
1231
0.08
02
0.
0999
0.05
34
0.
0714
R
2 ove
rall
0.
8719
0.69
68
0.
4901
0.67
61
0.
4750
0.49
79
Frac
tion
of v
aria
nce
due
to u
ct
0.
2956
0.23
51
0.
1388
0.19
61
0.
1068
0.17
53
Sam
ple
size
101,
409
110,
214
108,
622
108,
175
105,
551
109,
405
Sig
nific
ant a
t * 1
perc
ent,
** 5
perc
ent a
nd **
* 10
perc
ent l
evel

42
Tabl
e 4.
3: D
ecen
tralis
atio
n-SW
B e
last
iciti
es.
H
appi
ness
Ec
onom
ic
situ
atio
nG
over
nmen
tD
emoc
racy
Ed
ucat
ion
syst
emH
ealth
sy
stem
Agg
rega
ted
Reg
iona
l Aut
horit
y In
dex
SR
+SH
R
0.
0229
0.05
22
0.13
65S
elf-r
ule
(SR
) ID
+PS
+FA
+RP
0.
0237
0.06
36
0.14
04La
w m
akin
g (L
M) A
+B+C
+D
0.01
010.
0285
0.
0492
Sha
red
rule
(SH
R) L
M+E
C+F
C+C
R
0.00
980.
0213
0.
0590
Non
-agg
rega
ted
Inst
itutio
nal d
epth
(ID
) 0.
0213
0.04
74
0.14
09Po
licy
Scop
e (P
S)
0.02
030.
0555
0.
1322
Fisc
al A
uton
omy
(FA
) 0.
0207
0.05
170.
0412
0.06
35
0.02
960.
0957
Rep
rese
ntat
ion
(RP
) 0.
0192
-0.0
119
0.04
59
0.12
84La
w M
akin
g A
(A)
0.00
08
0.00
58La
w M
akin
g B
(B)
0.00
710.
0103
0.
0397
Law
Mak
ing
C (C
) 0.
0101
0.02
27
0.04
28La
w M
akin
g D
(D)
0.00
720.
0228
0.
0126
0.03
72Ex
ecut
ive
Con
trol (
EC)
0.00
580.
0135
0.
0170
0.04
76Fi
scal
Con
trol (
FC)
0.01
020.
0170
0.01
50
0.01
420.
0579
Con
stitu
tiona
l Ref
orm
(CR
) 0.
0074
0.
0477
Fisc
al d
ecen
tralis
atio
n
S
ub-n
atio
nal G
ov. E
xpen
ditu
re
0.04
330.
2748
0.20
530.
2035
0.
2299
Sub
-nat
iona
l Cur
rent
Exp
endi
ture
0.
0359
0.17
940.
1454
0.16
65
0.13
050.
1959
Sub-
natio
nal C
apita
l Exp
endi
ture
0.
0745
0.54
620.
3519
0.37
33
0.44
350.
1735
Sub-
natio
nal R
even
ue
0.02
630.
1748
0.11
940.
1139
0.
1415
Sub-
natio
nal T
ax R
even
ue
0.03
120.
1551
0.16
360.
1612
0.
0982
0.09
62
Not
e: O
nly
elas
ticiti
es d
eriv
ed fr
om s
igni
fican
t coe
ffici
ents
in ta
ble
7 ar
e re
porte
d.

43
5 Decentralisation and Inequality
5.1 Introduction In this section, we address the relationship between fiscal and political decentralisation, income inequality and level of development within regions. Using Moderated Multiple Regression analysis applied to survey responses from more than 100,000 individuals in the European Union (EU), it addresses two main questions. First, whether decentralisation in western Europe has an effect on within regional interpersonal inequality. Second, whether this possible relationship is mediated by the level of economic development of the region. This section considers interpersonal inequalities within regions only (dependent Variable) and the results of the analysis show that greater fiscal and political decentralisation is associated with lower interpersonal income inequality, but that this relationship is far from linear. As regional income rises, further decentralisation is connected to a lower decrease or even to an increase in inequality. This finding is robust to the measurement and definition of income inequality, as well as to the weighting of the spatial units by their population size. In terms of causation, the findings suggest the potential for particular forms of decentralisation to ameliorate inter-personal income inequalities under certain conditions and that this capability is strongly determined by overall levels of development. There has been no shortage of interest on the economic implications of the decentralisation of power and resources to lower tiers of government. The overwhelming majority of the analyses have been macro-approaches concerned with the impact of decentralisation on territories – mainly regions and countries (Rodríguez-Pose, and Ezcurra 2010). There has been, however, much less interest on the potential influence of decentralisation at a micro level. The impact of decentralisation on individuals has been almost completely overlooked by the literature. One exception is Morelli and Seaman (2007) who found that decentralisation increased interpersonal inequality, although the study did not clarify the factors behind this relationship.
5.2 Decentralisation, income inequality and level of development Decentralisation of powers and resources to lower tiers of government can – under different circumstances and in different contexts – contribute to both increase and reduce interpersonal inequalities. Decentralisation can reduce inter-personal inequalities in the following ways:
• Exploiting the information advantage over central government and increase the degree of efficiency in the allocation of resources better matched to the preferences of local citizens (Tiebout, 1956; Oates, 1972).
• Bringing government closer to the people and providing better information about local preferences to inform the optimal mix of local policies (Lessmann, 2000).

44
• Promoting greater voice, transparency and participation through enhanced accountability to local citizens
• Limiting the opportunities for corruption and interest group capture of the returns of public policies through greater transparency and accountability (Weingast, 2009).
Conversely, decentralisation can be argued to increase inter-personal inequalities in the following ways:
• Weakening the capacity of central government to play an equalising role to achieve balanced distributions of income through social and territorial transfers from the rich to the poor (Oates, 1972).
• Diversity and variation in the availability and quality of public services between places generates unequal individual access and provision regardless of preferences – the so-called ‘postcode lottery’ issue in the context of England.
• Sub-national institutions are likely to attract less skilled and capable officials and decision-makers and can be less efficient at policy design and delivery (Prud'homme, R. 1995).
• Increasing social fragmentation and inequality can result if local vested interests are powerful and accountability is weak – a situation most likely to happen in less developed and less equal territories (Neyapti, 2006).
Whether decentralisation is good or bad for inter-personal inequality may be highly dependent upon the level of development of a territory. The reasons for this include:
• Poor territories with relative greater needs face greater budget constraints than richer territories with relatively less need and intergovernmental grants can constitute the main source of local revenues. Greater decentralisation can curtail these equalisation transfers from richer to poorer areas and poorer places can end up with inadequate independent resources to tackle local inequality and develop meaningful fiscal autonomy (Weingast, 2009).
• The greater capacity of richer local and regional authorities to rely on their own revenues means that they are often in a better shape to address inequality problems and a ‘threshold level of economic development’ exists at which fiscal decentralisation becomes attractive and more likely to deliver a reduction in inequality (Oates, 2006).
As a consequence, poorer areas can be argued to be limited in their ability to deliver greater interpersonal equality. Although when there are strong inefficiencies within a system and these are properly addressed by decentralisation processes and under-utilised resources are tapped, it may be the case that the efficiency gains may be greater in those areas where the inefficiencies were originally larger (Rodríguez-Pose, and Ezcurra 2010). If such efficiency gains are put to good use, interpersonal inequality would decrease

45
faster in less developed than in more developed areas, although large institutional and capacity constraints may operate in an opposite direction. Overall, little is known about the potential implications of decentralisation for interpersonal inequality and that the potential factors at play can derive either in greater or in lower inequality. The relationship is also likely to be influenced by the level of development of a region or a locality. Hence the questions of whether decentralisation has an effect on within regional interpersonal inequality and whether this possible relationship is mediated by the level of economic development of the region remain open and have to be addressed from an empirical perspective.
5.3 Research methodology We use a Moderated Multiple Regression (MMR) analysis to examine whether regional per-capita income intervenes in the relationship between fiscal and political decentralisation and income inequality within regions11. In other words, we examine whether the magnitude of this relation varies across different development levels and plot the relationship between decentralisation and income inequality at high and low levels of regional per-capita income. The econometric specification is based on panel data analysis in order to reduce measurement error on income inequalities, to minimise potential problems of omitted variable bias, to increase degrees of freedom, and to improve the accuracy of the parameter estimates. The econometric specification uses available data at regional and national levels (see Table 5.1)12. Regional variables are based either on micro or macro data. Regional variables based on micro data are extracted from the European Community Household Panel (ECHP) data survey, while regional variables based on macro data stem from Eurostat’s Regio dataset. National variables are extracted from the World Bank and the work by Hooghe et al. (2008). The resulting dataset includes data for 102 regions at NUTS I or II level from 13 countries in Western Europe between 1995 and 2000, the only years for which the ECHP is available (NUTS I: Austria, Belgium, Denmark, France, Germany, Greece, Ireland, Italy, Luxemburg, Spain and Sweden; NUTS II: Portugal and the United Kingdom).
11 Further details on the research methodology, including the econometric specification, data and variables, are contained in Tselios et al. (2010). 12 Robust data at the local scale was not available.
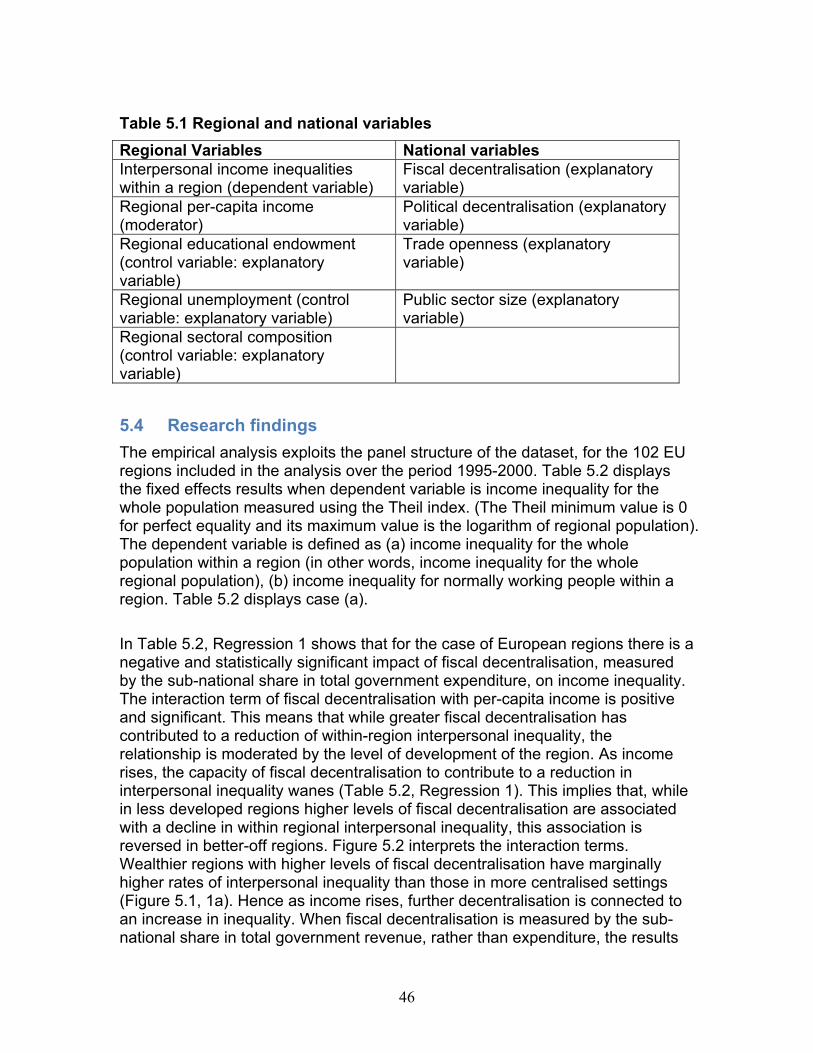
46
Table 5.1 Regional and national variables Regional Variables National variables Interpersonal income inequalities within a region (dependent variable)
Fiscal decentralisation (explanatory variable)
Regional per-capita income (moderator)
Political decentralisation (explanatory variable)
Regional educational endowment (control variable: explanatory variable)
Trade openness (explanatory variable)
Regional unemployment (control variable: explanatory variable)
Public sector size (explanatory variable)
Regional sectoral composition (control variable: explanatory variable)
5.4 Research findings The empirical analysis exploits the panel structure of the dataset, for the 102 EU regions included in the analysis over the period 1995-2000. Table 5.2 displays the fixed effects results when dependent variable is income inequality for the whole population measured using the Theil index. (The Theil minimum value is 0 for perfect equality and its maximum value is the logarithm of regional population). The dependent variable is defined as (a) income inequality for the whole population within a region (in other words, income inequality for the whole regional population), (b) income inequality for normally working people within a region. Table 5.2 displays case (a). In Table 5.2, Regression 1 shows that for the case of European regions there is a negative and statistically significant impact of fiscal decentralisation, measured by the sub-national share in total government expenditure, on income inequality. The interaction term of fiscal decentralisation with per-capita income is positive and significant. This means that while greater fiscal decentralisation has contributed to a reduction of within-region interpersonal inequality, the relationship is moderated by the level of development of the region. As income rises, the capacity of fiscal decentralisation to contribute to a reduction in interpersonal inequality wanes (Table 5.2, Regression 1). This implies that, while in less developed regions higher levels of fiscal decentralisation are associated with a decline in within regional interpersonal inequality, this association is reversed in better-off regions. Figure 5.2 interprets the interaction terms. Wealthier regions with higher levels of fiscal decentralisation have marginally higher rates of interpersonal inequality than those in more centralised settings (Figure 5.1, 1a). Hence as income rises, further decentralisation is connected to an increase in inequality. When fiscal decentralisation is measured by the sub-national share in total government revenue, rather than expenditure, the results
47
are generally similar. This may be simply due because both proxies for fiscal decentralisation are highly correlated (correlation coefficient of 0.9858). As shown in Regression 2 in Table 5.2, greater decentralisation is associated with lower inequality, and this relationship wanes as income rises. The main difference of using local and regional revenue rather than expenditure as a proxy for fiscal decentralisation is that, as regional income rises, further decentralisation is not connected to an increase in inequality, but to a lower decrease in interpersonal inequality than at lower levels of income (Figure 5.1b). Hence, and in contrast to what could have been expected from the discussion in the theoretical section, the relationship between decentralisation and income inequality is negative for less developed European regions, although this effect peters out as regional income rises. When we turn to the potential impact of political decentralisation on income inequality (Table 5.2, Regressions 3-5), the regression results show once again a negative and statistically significant coefficient on decentralisation for all proxies (self-rule, shared-rule, and (Regional Authority Index) RAI-total) and a positive and statistically significant coefficient on the interaction term of decentralisation with per-capita income. A greater degree of political decentralisation – regardless of how it is measured – is associated with lower levels of income inequality. As in the case of fiscal decentralisation, the decentralisation-inequality relationship is sensitive to the level of development of the region concerned. For less developed regions, it is negative, with political decentralisation contributing to a reduction of interpersonal inequalities, when self-rule and RAI-total are used as proxies of political decentralisation. In richer regions, in contrast, higher levels of self-rule and RAI-total are associated with an increase in interpersonal inequality (Figure 5.1, 1c and 1e). When shared-rule is used as the proxy for political decentralisation, higher levels of decentralisation lead to a decline in interpersonal disparities in both low and high income regions, although the slope of the decline is greater for poorer than for richer regions (Figure 5.1, 1d). As discussed above, the control variables included in the model also have an influence over within region inequality levels. Income inequality can be affected not only by the national factors of fiscal and political decentralisation, but also by the trade openness and the public sector size, as well as by the unemployment rate, the sectoral structure of the region, and by the level of education of the population. In Table 5.2, Regressions 6 and 7 examine the association between trade openness and income inequality, as well as between public sector size and inequality, and whether these associations are moderated by regional economic development. The results indicate that these associations are not as clear cut as could have been expected in theory. Apart from the coefficient on the interaction term of trade openness with income per capita, which is positive and statistically significant, no other coefficient is significant, meaning that the association between trade and public sector size, on the one hand, and within region income inequality, on the other, is weaker than what could have been expected. The
48
unemployment rate, the sectoral structure of the region, and, to a much lesser extent, the level of education of the population display a much stronger association with the level of regional interpersonal inequality (Table 5.2, Regressions 1-11). The regression coefficients highlight that the higher the percentage of locals with tertiary education, the lower the income inequality. Regional unemployment increases, as expected, income inequality and a rise in the added value per capita of agriculture and industry is associated with a decrease in inequality, while the impact of services is unclear. Regressions 8-9 display the combined impact of fiscal and political decentralisation on interpersonal income inequality within regions. The results highlight that the association between fiscal decentralisation and inequality is stronger and more robust than that of political decentralisation and inequality: the coefficients of political decentralisation (RAI-total) are not robust to the inclusion of the fiscal decentralisation variables and become insignificant. In contrast, the fiscal decentralisation variables remain highly significant with the same coefficients as described above. The analysis was recalculated using weighted regressions (Regressions 10-11). The use of population weights allows us to control for the regional and national size as it may hide greater heterogeneity and thus the possibility for larger local governments to undertake widely different policies than in smaller, more homogeneous, and compact regions and countries. The regression results using weighted variables show the robustness of our previous results. Once again, greater decentralisation is associated with lower inequality, but as income rises, further decentralisation is connected to an increase or to a lower decrease in inequality. The outliers were checked and omitted producing virtually no effect on the results. The above findings are also robust to changing the measure (the Gini index, the squared coefficient of variation and the Atkinson index) and the definition of income inequality (income inequality for normally working people).
5.5 Conclusions and policy implications By using micro data in order to measure the level of interpersonal inequality for the regions of western Europe, we have been able to address whether decentralisation matters for the evolution of within regional interpersonal inequality and whether this relationship is mediated by the level of development of the region. The results of our Moderated Multiple Regression analysis highlight that the influence of decentralisation on interpersonal inequality is much stronger than expected. Although the direction of the relationship between both factors was uncertain, the results of the analysis here demonstrates that greater fiscal – more than political – decentralisation is associated with lower income inequality. They also suggest that this relationship is highly influenced by the level of development of the region to which authority and funds are being decentralised. However, the sign of the relationship counters most theoretical predictions. Against the view that worse-off regions would be disadvantaged because of capacity and funding constraints, which could prevent them from effectively

49
implementing policies which could reduce interpersonal inequality, it is precisely these less well-off regions which seem to be benefiting the most from the inequality-reducing effects of fiscal decentralisation processes. There is no identifiable threshold level because as income rises, the association declines and even becomes positive, with some higher income regions displaying a higher degree of interpersonal inequality than their more centralised counterparts13. It is not possible to allocate particular regions to specific categories because our results are based on NUTS I or II level and the regression results depict the 'average' trend for the Western European countries. There appears to be potential, then, for particular kinds of decentralisation to address inter-personal income inequalities in specific contexts and this capability is influenced by overall levels of development. Although given the exploratory nature of the analysis, its results should be considered with caution especially in extending its findings from the regional to the local levels, the policy implications of its findings suggest:
• Increased fiscal – more than political – decentralisation should be considered given its positive association with lower levels of income inequality.
• Less well-off regions in particular could benefit from the inequality-reducing effects of enhanced fiscal decentralisation.
• Consideration needs to be given to how further decentralisation might affect the high levels of inter-personal inequality evident within already highly decentralised and high income regions.
In contrast to the studies which have focused on aggregate outcomes about the impact of greater levels of autonomy on aggregate growth and on inter-territorial disparities, the focus on the impacts of decentralisation on individuals creates a potentially richer and useful field for the study of the implications of changing the scales at which policies are implemented. If decentralisation is all about delivering better policies to individuals, looking precisely at those individuals may offer a more accurate evaluation of its outcomes.
13 It should be noted that inter-regional income inequality is an important component of the inequality-decentralisation relationship (Rodríguez-Pose and Tselios, 2009).

50
Tabl
e 5.
2: F
ixed
Effe
cts:
Dep
ende
nt v
aria
ble
is in
com
e in
equa
lity
for t
he w
hole
pop
ulat
ion
(1
) (2
) (3
) (4
) (5
) (6
) (7
) (8
) (9
) (1
0)
(wei
ghte
d)
(11)
(w
eigh
ted )
Inco
me
per
capi
ta
-0.0
203
(0.0
050)
***
-0.0
191
(0.0
058)
***
0.00
80
(0.0
044)
* 0.
0142
(0
.002
5)**
* 0.
0069
(0
.003
9)*
0.00
95
(0.0
044)
**
0.02
23
(0.0
145)
0.
0338
(0
.015
9)**
0.
0162
(0
.016
4)
0.01
57
(0.0
030)
***
0.01
30
(0.0
033)
***
Fisc
al
dece
ntra
lisat
ion
(exp
)
-1.9
969
(0.2
609)
***
-2.0
669
(0.3
340)
***
-0
.803
7 (0
.220
3)**
*
Inte
ract
ion:
In
com
e pe
r ca
pita
x F
isca
l de
cent
ralis
atio
n (e
xp)
0.14
70
(0.0
189)
***
0.16
96
(0.0
249)
***
0.
0229
(0
.007
2)**
*
Fisc
al
dece
ntra
lisat
ion
(rev)
-2
.141
9 (0
.305
6)**
*
-2
.071
2 (0
.416
5)**
*
-0.8
005
(0.2
729)
***
Inte
ract
ion:
In
com
e pe
r ca
pita
x F
isca
l de
cent
ralis
atio
n (re
v)
0.
1322
(0
.022
3)**
*
0.
1507
(0
.031
5)**
*
0.01
86
(0.0
100)
*
Polit
ical
de
cent
ralis
atio
n (s
elf-r
ule)
-0.0
100
(0.0
046)
**
Inte
ract
ion:
In
com
e pe
r ca
pita
x
Polit
ical
de
cent
ralis
atio
n (s
elf-r
ule)
0.00
08
(0.0
004)
**
Polit
ical
de
cent
ralis
atio
n (s
hare
d ru
le)
-0
.061
6 (0
.021
3)**
*
Inte
ract
ion:
In
com
e pe
r ca
pita
x
Polit
ical
de
cent
ralis
atio
n (s
hare
d ru
le)
0.
0031
(0
.000
9)**
*
Polit
ical
-0
.010
3
-0
.000
9 -0
.000
3 0.
0019
0.
0011

51
dece
ntra
lisat
ion
(RA
I tot
al)
(0.0
036)
***
(0.0
041)
(0
.004
2)
(0.0
017)
(0
.001
7)
Inte
ract
ion:
In
com
e pe
r ca
pita
x
Polit
ical
de
cent
ralis
atio
n (R
AI t
otal
)
0.00
08
(0.0
003)
***
0.00
03
(0.0
003)
0.
0003
(0
.000
3)
-0.0
000
(0.0
000)
0.
0000
(0
.000
0)
Trad
e op
enne
ss
-0
.001
9 (0
.001
2)
-0
.001
2 (0
.001
4)
-0.0
013
(0.0
014)
0.
0008
(0
.000
7)
0.00
06
(0.0
008)
In
tera
ctio
n:
Inco
me
per
capi
ta x
Tra
de
open
ness
0.
0001
(0
.000
1)**
0.00
01
(0.0
001)
0.
0001
(0
.000
1)
-0.0
000
(0.0
000)
-0
.000
0 (0
.000
0)
Pub
lic s
ecto
r si
ze
-0.0
107
(0.0
081)
0.
0261
(0
.010
2)**
0.
0167
(0
.010
5)
-0.0
002
(0.0
044)
0.
0004
(0
.004
6)
Inte
ract
ion:
In
com
e pe
r ca
pita
x P
ublic
se
ctor
siz
e
-0.0
003
(0.0
007)
-0
.003
3 (0
.000
9)**
* -0
.002
3 (0
.000
9)**
-0
.000
3 (0
.000
1)**
* -0
.000
3 (0
.000
1)**
*
Seco
ndar
y (b
ase:
prim
ary)
-0
.031
4 (0
.036
7)
-0.0
314
(0.0
363)
-0
.014
9 (0
.037
8)
-0.0
360
(0.0
382)
-0
.020
3 (0
.037
6)
-0.0
237
(0.0
371)
0.
0111
(0
.038
3)
-0.0
512
(0.0
389)
-0
.043
6 (0
.039
0)
0.01
70
(0.0
391)
-0
.005
7 (0
.039
3)
Terti
ary
-0.0
283
(0.0
352)
-0
.082
1 (0
.040
5)**
-0
.033
0 (0
.037
0)
-0.0
091
(0.0
387)
-0
.027
6 (0
.037
1)
-0.0
367
(0.0
386)
-0
.062
8 (0
.037
0)*
-0.0
680
(0.0
408)
* -0
.089
1 (0
.044
6)**
-0
.024
0 (0
.039
7)
-0.0
522
(0.0
415)
U
nem
ploy
men
t 0.
2315
(0
.132
3)*
0.26
25
(0.1
373)
* 0.
2530
(0
.136
0)*
0.34
10
(0.1
367)
**
0.27
15
(0.1
358)
**
0.18
89
(0.1
375)
0.
2894
(0
.134
9)**
0.
2253
(0
.134
7)*
0.27
17
(0.1
398)
* 0.
2469
(0
.144
0)*
0.25
58
(0.1
455)
* Ag
ricul
ture
-0
.007
4 (0
.032
4)
-0.0
410
(0.0
322)
-0
.063
2 (0
.032
6)*
-0.0
716
(0.0
320)
**
-0.0
633
(0.0
324)
* -0
.060
8 (0
.032
5)*
-0.0
565
(0.0
326)
* -0
.019
4 (0
.032
3)
-0.0
516
(0.0
329)
-0
.059
8 (0
.034
1)*
-0.0
685
(0.0
342)
**
Indu
stry
-0
.017
4 (0
.004
5)**
* -0
.020
5 (0
.004
5)**
* -0
.019
4 (0
.004
8)**
* -0
.017
4 (0
.004
9)**
* -0
.018
1 (0
.004
8)**
* -0
.020
0 (0
.004
7)**
* -0
.025
3 (0
.004
8)**
* -0
.017
8 (0
.004
7)**
* -0
.020
5 (0
.004
9)**
* -0
.012
3 (0
.004
9)**
-0
.012
9 (0
.005
0)**
*Se
rvic
es
0.00
12
(0.0
019)
0.
0019
(0
.002
0)
0.00
09
(0.0
021)
0.
0012
(0
.002
0)
0.00
11
(0.0
021)
-0
.002
2 (0
.002
2)
0.00
05
(0.0
020)
-0
.000
9 (0
.002
1)
-0.0
003
(0.0
022)
-0
.002
5 (0
.002
4)
-0.0
024
(0.0
025)
Ti
me-
dum
mie
s Y
ES
Y
ES
Y
ES
Y
ES
Y
ES
Y
ES
Y
ES
Y
ES
Y
ES
Y
ES
Y
ES
C
onst
ant
0.76
97
(0.0
630)
***
0.88
75
(0.0
869)
***
0.44
37
(0.0
459)
***
0.40
17
(0.0
417)
***
0.44
76
(0.0
402)
***
0.48
04
(0.0
912)
***
0.58
15
(0.1
528)
***
0.39
71
(0.2
114)
* 0.
6247
(0
.220
6)**
* 0.
4822
(0
.095
4)**
* 0.
5393
(0
.097
4)**
*O
bser
vatio
ns
566
566
586
586
586
586
586
566
566
566
566
R-s
quar
ed
0.36
21
0.34
32
0.27
63
0.29
30
0.28
19
0.28
50
0.28
67
0.38
77
0.36
10
0.29
45
0.28
76
LM te
st
519.
45
(0.0
000)
52
1.46
(0
.000
0)
578.
75
(0.0
000)
63
4.61
(0
.000
0)
586.
40
(0.0
000)
63
9.47
(0
.000
0)
616.
00
(0.0
000)
60
7.13
(0
.000
0)
312.
39
(0.0
000)
49
6.17
(0
.000
0)
479.
54
(0.0
000)
S
igni
fican
t at *
1 pe
rcen
t, **
5 pe
rcen
t and
*** 1
0 pe
rcen
t lev
el

52
Figure 5.2: Interpretation of the interactions 1a: Regression 1
0.2
0.3
0.4
0.5
0.6
0.7
Low fiscaldecentralisation (exp)
High fiscaldecentralisation (exp)
Inco
me
ineq
ualit
y
Low income per capitaHigh income per capita
1b: Regression 2
0.2
0.3
0.4
0.5
0.6
0.7
Low fiscaldecentralisation (rev)
High fiscaldecentralisation (rev)
Inco
me
ineq
ualit
y
Low income per capitaHigh income per capita

53
1c: Regression 3
0.2
0.3
0.4
0.5
0.6
0.7
Low politicaldecentralisation (self-
rule)
High politicaldecentralisation (self-
rule)
Inco
me
ineq
ualit
y
Low income per capitaHigh income per capita
1d: Regression 4
0.20.25
0.30.35
0.40.45
0.50.55
0.60.65
0.7
Low politicaldecentralisation (shared
rule)
High politicaldecentralisation (shared
rule)
Inco
me
ineq
ualit
y
Low income per capitaHigh income per capita

54
1e: Regression 5
0.2
0.3
0.4
0.5
0.6
0.7
Low politicaldecentralisation (rai total)
High politicaldecentralisation (rai total)
Inco
me
ineq
ualit
y
Low income per capitaHigh income per capita

55
6 Conclusions and policy implications
This report has sought to examine the evidence about the impacts of decentralisation in order to inform government policy concerning England in relation to decentralisation, localism and the ‘Big Society’. We have sought to situate the study in the international principally peer-reviewed literature which typically concerns the decentralisation of authority from national to sub-national (mainly regional) governments. We have been less concerned about spatial scale than we have about what we can learn about decentralisation as a general principle in the rescaling of the state. The findings of the study demonstrate that there are many different types of decentralisation at various spatial scales and embodying a range of powers and resources. Moreover, the context and conditions of the design, rationale and implementation of decentralisation strongly shape its effects. As a result, in the literature, the impacts of decentralisation on issues such as the efficiency and accessibility of local services and on local growth, appear ambiguous and inconclusive. Indeed, looking at the evidence in the round, our analysis accords with Treisman’s argument who suggests that:
… it is hard to reach any general conclusions about whether political – or administrative, or fiscal – decentralisation will improve or impair the quality of government and economic performance. They will have many effects, driving in different directions on different dimensions. These effects depend on numerous conditions, many of which are difficult to disentangle in theory and identify in practice. As one would expect, empirical studies have found almost no solid, general results about the consequences of decentralisation. Decentralizing government in a particular place and time is very much a leap into the dark (Treisman, 2007: 274).
Our study attempts to address the difficulties identified by Treisman by providing a detailed review of the limited range of empirical analyses and evidence of the impact of decentralisation on the efficiency of local services. This review demonstrates a range of contradictory conclusions from which it is very difficult to draw general lessons for policy. Disentangling the impacts of decentralisation at particular spatial scales (e.g. regional versus local) proves to be especially difficult and the literature rarely preoccupies itself with this distinction. Most existing studies are mainly concerned variously with measuring impacts at the sub-national scale – for example of Spanish Autonomous Communities, Swiss Cantons and Italian Regions – and only in a few cases with the municipality and not all with neighbourhoods. We observe the inherent difficulties of measuring the impacts of decentralisation which partly explain the apparently contradictory results from various studies and also the difficulties of comparing between cases selected from different national contexts. For this reason we use a novel approach to address two specific issues where research on the impacts of decentralisation has to date been limited, but are especially relevant to government’s current emphasis upon the individual and highly local forms of decentralisation. The novelty of our approach is that it focuses on the impact of decentralisation on the individual rather than the performance of territorial jurisdictions. This has a number of advantages. First, it focuses attention on decentralisation as a principle rather than seeking to disentangle its impacts at different spatial scales. Second, current government policy debates are especially

56
concerned with the impacts of decentralisation on individuals. The analyses reported in this study represent the first attempt to address this question directly. With our focus on the individual in mind, we examine the impacts of decentralisation on subjective wellbeing (SWB) and inter-personal inequality and level of development. For subjective wellbeing, we find a positive effect of political and fiscal decentralisation on satisfaction and happiness. This establishes a relationship whereby citizens appear to be happy not only with the transfer of resources – which is an indicator of the capacity of local governments to implement policies - but also with the ability to conduct policies at the local level – which is represented here by the transfer of powers to sub-national governments. The association between greater decentralisation and happiness is also, with the exception of satisfaction with the health system, more strongly associated with more abstract constructs, such as satisfaction with government or democracy or overall happiness, than with more concrete ones, as satisfaction with the economy or with the education system. The fiscal dimension, which represents a more concrete dimension of decentralisation, is wholly connected with satisfaction and happiness. The results reveal that citizens appear to be happy with the principle that their local governments can have a say on their daily politics and policies and with their actual capacity to deliver. Overall, the results highlight that both political and fiscal decentralisation matter, but that it is this latter dimension of decentralisation which seems to be more relevant for citizens. Decentralisation matters positively for the satisfaction of individuals with political institutions and with the specific delivery of some public goods and services. The overall level of resources is important too – even overriding level of decision-making, for example, in relation to education. Given these relationships, it is feasible, then, to envisage a causal relationship between policies from decentralised governments and individual happiness. For income inequality and level of development, the results of the analysis demonstrate that greater fiscal – more than political – decentralisation is associated with lower inter-personal income inequality. They also suggest that this relationship is highly influenced by the level of development of the region to which authority and funds are being decentralised. Against the view that worse-off regions would be disadvantaged because of capacity and funding constraints, which could prevent them from effectively implementing policies which could reduce interpersonal inequality, it is precisely these less well-off regions which seem to be benefiting the most from the inequality-reducing effects of fiscal decentralisation processes. As income rises, the association declines and even becomes positive, with some higher income regions displaying a higher degree of interpersonal inequality than their more centralised counterparts. Given these findings, it is feasible to suggest the potential for specific kinds of decentralisation to address inter-personal income inequalities in particular contexts and that overall levels of development are critical in shaping this capacity. These results cast powerful light on two key areas of the government policy debate. There is evidence to suggest that decentralisation can contribute to an improved sense of citizen well-being and that concerns that, in particular contexts, decentralisation will generate increased inequality may have been overstated. What are the policy implications of these findings? Any policy implications must be highly qualified given the different kinds of decentralisation and the conditional nature of its
57
operation that makes it highly dependent upon the context in which it is introduced. In addition, given the exploratory nature of the analysis, the results should be considered with caution in shaping policy in specific cases especially in directly attributing causation, given the strength of quantitative analysis in identifying and measuring the extant relationships, and extending its findings from the regional to the local level. With these caveats in mind our research allows us to suggest the following policy issues. There is a need for much greater clarity in the definition, specification and rationale of exactly what kind and degree of decentralisation is planned by the government in England, and what its precise aims goals are: Is it seeking to make services more efficient or more accountable? Is the aim to improve subjective wellbeing? Is the goal to reducing levels of inter-personal inequality? In particular, the relationships between decentralisation and its spatial scale need to be explained and clarified with greater care. Although government may not be seeking a prescriptive template, the principles of the particular kinds of decentralisation it is seeking need to reflect what the review and evidence here demonstrates: decentralisation can have positive (and negative) impacts at various spatial scales and but current policy focuses only the local scale as the source of gains in efficiency and accountability. The case for the government’s particular kind of decentralisation needs clearer explanation and stronger evidence. Moreover, the evidence on the impacts of decentralisation mainly concerns the performance of sub-national jurisdictions (e.g. regions, provinces, municipalities) with very little treatment of issues that could be seen as proxies of localism as understood in current debates about the governance of England. The particular role of local government in the government’s decentralisation programme needs much clearer specification. As a recent review noted, it is unclear whether the decentralisation within this version of localism ends at the local authority level or whether it begins from this level to communities and neighbourhoods14. The results reported here strongly suggest that, internationally, citizens are positive in the context of especially the fiscal dimensions and capacities of decentralised institutions at the sub-national level and associate decentralised institutions with higher levels of personal subjective well-being. As a key decentralised institution in the English context, local government has a critical role in articulating and representing the potential of the kinds of decentralisation and localism that the government seeks. This role then begs the question of whether and how local government can be enabled and supported to undertake this task given its particular level of fiscal decentralisation in England. In addition, as government seeks decentralisation beneath the level of local government, this raises the question of how such decentralisation processes unfold when focused upon the spatial scales of communities and neighbourhoods or even at the level of individual citizens. These issues require further investigation and review of the available evidence. If subjective well-being is emerging as a central focus of government policy then the evidence reported here suggests decentralisation could play a significant role in its improvement. However, the nature and extent of decentralisation and the resources attached to it would seem to be critical in determining the chances of its success.
14 See Deloitte (2011).

58
Our findings suggest that increased fiscal – more than political – decentralisation should be considered given its positive association with lower levels of income inequality. Less well-off places in particular could benefit from the inequality-reducing effects of enhanced fiscal decentralisation. Moreover, consideration needs to be given to how further decentralisation will the high levels of inter-personal inequality within already highly decentralised and high income localities. Finally, given the claims being made for its potential impacts, more attention and clarity on assessment and evaluation of the government’s strategy on decentralisation and localism will be welcomed, particularly in relation to the pros and cons identified in this report.
59
7 Bibliography
Adam, A., M. D. Delis, et al. (2008). "Fiscal Decentralization and Public Sector Efficiency: Evidence from OECD Countries." CESifo Working Paper Series Working Paper No. 2364., CESifo: Munich. Afonso, A., L. Schuknecht, and Tanzi, V (2005). "Public sector efficiency: An international comparison." Public Choice 123(3): 321-347. Ahmad, J; Devarajan, S; Khemani, S and Shah, S (2008) “Decentralisation and service delivery”. In Ahmad, E and Brosio, G (Eds.) Handbook of Fiscal Federalism. Aldershot: Edward Elgar. Andrews, R. and S. Martin (2007). "Has Devolution Improved Public Services?" Public Money & Management 27(2): 149-156. Balaguer-Coll, M. T., Prior, D. and Tortosa-Ausina, E (2009). "Decentralization and efficiency of local government." The Annals of Regional Science 45(3): 571-601. Baumol, W. J. (1967). "Macroeconomics of Unbalanced Growth: The Anatomy of Urban Crisis." The American Economic Review 57( 3): 415. Besley, T. and S. Coate (1999). "Centralised versus Decentralised Provision of Public Goods: A Political Economy Analysis." NBER working paper 7084 Cambridge, MA: National Bureau of Economic Research. Bjørnskov, C, Dreher, A and Fischer, J (2008a) “Cross-country determinants of life satisfaction: exploring different determinants across groups in society”, Social Choice and Welfare, 30: 119–173 Bjornskov, C., Dreher, A. and Fischer, J. A. V. (2010) “Formal institutions and subjective well-being: Revisiting the cross-country evidence”, European Journal of Political Economy, 26, 4, 419-430 Boetti, L., M. Piacenza, et al. (2010). "Decentralization And Local Governments’ Performance: How Does Fiscal Autonomy Affect Spending Efficiency." University of Turin, Department Of Economics And Public Finance “G. Prato” Working Paper Series No. 11, March. Bradhan, P. and D. Mookherjee (1998). "Expenditure decentralisation and the delivery of public services in developing countries." Center for International and Development Economics Research, Berkeley, California CIDER Working Paper C98-104. Berkeley: Berkeley University Brenner, N. (2009). "Open questions on state rescaling." Cambridge Journal of Regions, Economy and Society 2: 123–139. Breton, A. and R. Wintrobe (1975). "The Equilibrium Size of a Budget-maximizing Bureau: A Note on Niskanen's Theory of Bureaucracy." Journal of Political Economy 83(1): 195-207. Burki, SJ; Perry, G and Dillinger, WR (1999) Beyond the Center. Decentralising the State. Washington, DC: World Bank. Cameron, D. (2010) PM Speech on Wellbeing, 25 November, Number10.gov.uk

60
Cohen, J. M. and S. B. Peterson (1996). "Methodological Issues in the Analysis of Decentralization." Harvard Institute for International Development, Discussion Paper No. 555. Cambridge, MA: Harvard University. Collins, C. and A. Green (1994). "Decentralization and primary health care: some negative implications in developing countries." International Journal of Health Services 24: 459-75. Deloitte (2001) A Little Local Difficulty: The Challenges of Making Localism Work, Deloitte: London. Department for Communities and Local Government (2007). "Communities and Local Government Economics Paper 1: A Framework for Intervention." DCLG: London. Diaz-Serrano, L. and A. Rodríguez-Pose (2011) “Decentralisation, happiness and the perception of institutions”, SERC Discussion Paper. London: Spatial Economics Research Centre. Drèze, J. and A. Sen (2002). "Democratic Practice and Social Inequality in India." Journal of Asian and African Studies 37(6): 6-37. Elazar, D., Ed. (1987). Exploring Federalism. Tuscaloosa, University of Alabama Press. Epple, D. and T. Nechyba (2004). "Fiscal Decentralisation." in J.V. Henderson and J-F Thisse (Eds.) Handbook of Regional and Urban Economics. Aldershot: Edward Elgar Ezcurra, R. and P. Pascual (2008). "Fiscal Decentralisation and Regional Disparities: Evidence from Several European Union Countries." Environment and Planning A 40: 1185-1201. Firebaugh G (2003): The New Geography of Global Income Inequality. Harvard University Press: Cambridge, MA. Freinkman, L. and A. Plekhanov (2009). "Fiscal decentralisation and the quality of public services in Russian regions." European Bank for Reconstruction and Development Working Paper No. 111. London: EBRD Frey, B.S. (2005) “Functional, Overlapping, Competing Jurisdictions: Redrawing the Geographic Borders of Administration.” European Journal of Law Reform, 5(3/4): 543-555. Frey, B.S. and Stutzer, A (2000) “Happiness, Economy and Institutions”, The Economic Journal, 110, 466: 918 – 938 Gabszewicz, J. and Thisse, J. F. (1979). "Price Competition, Quality and Income Disparities." Journal of Economic Theory 20: 340-359. Helliwell, J.F. & S. Wang (2010) Trust and well-being. NBER Working Paper 15911.Cambridge: National Bureau of Economic Research HMG (2010a) Decentralisation and the Localism Bill: An Essential Guide. London: Her Majesty’s Government HMG (2010b) Local Growth. London: Her Majesty’s Government. Hooghe, L., G. Marks, et al. (2008). "Patterns of Regional Authority." Regional and Federal Studies 18(2-3): 167-181.

61
Hooghe, L and Marks G (2009) “Does Efficiency Shape the Territorial Structure of Government?” Annual Review of Political Science, 12: 225-41 Hotelling, H. (1929). "Stability in Competition." Economic Journal 39: 41-57. Houghton, J. (2005). "Place and the implications of `the local' for sustainability: an investigation of the Ugu District Municipality in South Africa." Geoforum 36(4): 418-428. Jessop, B. (2002). Globalization and the National State. In S. Aaronowitz and P. Bratsis (Eds.) Rethinking the State: Miliband, Poulantzas and State Theory. Minneapolis, University of Minnesota Press: 185-220. Jones, M., M. Goodwin and Jones, R. (2005). "State Modernisation, Devolution and Economic Governance: An Introduction and Guide to Debate." Regional Studies 39(4): 397-403. Keating, M., P. Cairney, and Hepburn, E (2009). "Territorial policy communities and devolution in the UK." Cambridge Journal of Regions, Economy and Society 2: 51–66. Klugman, J. (1994): Decentralisation: A survey of literature from a human development perspective. New York: United Nations Development Programme Occasional Paper 13 Human Development Report Office. Kornai, J. (1979). "Resource-Constrained Versus Demand-Constrained Systems." Econometrica 47(4): 801-819. Kornai, J., Maskin, E. and Roland, G (2003). "Understanding the Soft Budget Constraint." Journal of Economic Literature 41: 1095-1136. Lessmann, C. (2009). "Fiscal Decentralisation and Regional Disparity: Evidence from Cross-Section and Panel data." Environment and Planning A 41: 2455-2473. Lobao, L., R. Martin and A. Rodriguez-Pose (2009). "Rescaling the state: new modes of institutional–territorial organisation." Cambridge Journal of Regions, Economy and Society 2: 3-12. Loughlin, J. (2001). "Les experiences de devolution du Royaume-Uni'." Geoeconomie,19. Madison, J. (1787). "The Union as a Safeguard Against Domestic Faction and Insurrection (The Same Subject Continued)." The New York Packet November 23. Martinez-Vazquez, J. and A. Timofeev (2009). "A fiscal perspective of state rescaling." Cambridge Journal of Regions, Economy and Society 2: 85-105. Migué, J. L. and G. Bélanger (1974). "Toward a general theory of managerial discretion." Public Choice 17(27-47). Mills, A. (1994). "Decentralisation and accountability in the health sector from an international perspective: what are the choices?" Public Administration and Development 14: 281-92. Montesquieu, Baron de, (1748). The Spirit of Laws Trans. Thomas Nugent, revised by J. V. Prichard, "Based on a public domain edition published in 1914 by G. Bell & Sons, Ltd., London. Rendered into HTML and text by Jon Roland of The Constitution Society.") Accessed May 20, 2010
62
Morelli, C., and P. Seaman 2007. “Devolution and Inequality: A Failure to Create a Community of Equals?” Transactions of the Institute of British Geographers 32:523-538. Neyapti, B (2006) “Revenue decentralization and income distribution”, Economics Letters 92 (2006) 409–416 Niskanen, W. A. (1975). "Bureaucrats and Politicians." Journal of Law and Economics 18(3): 617-643 Oates, W. E. (1972). Fiscal Federalism. New York, Harcourt Brace Jovanovich. Oates, W. E. (1999). “An essay on fiscal federalism”, Journal of Economic Literature, 37, 3, 1120-49. Oates, W. E. (2006). "On the Theory and Practice of Fiscal Decentralization." Institute for Federalism and Intergovernmental Relations IFIR Working Paper No. 2006-05. OECD (2001). Devolution and Globalisation. Implications for Local Decision-Makers. Paris: OECD. Pike, A., A. Rodríguez-Pose, J. Tomaney, G. Torrisi and V. Tselios (2010) In search of the 'economic dividend' of devolution: spatial disparities, spatial economic policy and decentralisation in the UK. SERC Discussion Papers, Spatial Economics Research Centre (SERC), London School of Economics and Political Sciences: London. Prud’homme, R. (1995). "On the dangers of decentralisation." World Bank Policy Research WP 1252. Washington, DC: World Bank Revelli, F. (2009). "Spend more, get more? An inquiry into English local government performance." Oxford Economic Papers 62(1): 185-207. Rodríguez-Pose, A. and Ezcurra R. (2010). "Is fiscal decentralisation harmful for economic growth? Evidence from the OECD countries ", Unpublished Paper, London School of Economics. Rodríguez-Pose, A. and N. Gill (2005). "On the 'Economic Dividend' of Devolution." Regional Studies 39(4): 405-420. Rodríguez-Pose A, Sandall R, (2008), "From identity to the economy: analysing the evolution of the decentralisation discourse" Environment and Planning C: Government and Policy 26(1) 54 – 72 Rodríguez-Pose, A., Tijmstra, S. A. R. (2009). "Fiscal decentralisation, efficiency, and growth." Environment and Planning 41: 2041-2062. Rondinelli, D. A.; Nellis, J. R. and Cheema, S (1984). "Decentralization in Developing Countries: A Review of Recent Experience." World Bank Staff Working Paper No.581. Washington, DC: World Bank. Sala-i-Martin XX (2002): Disturbing 'Rise' of Global Income Inequality. Discussion Paper Series, No. 0102-44, Department of Economics, Columbia University, New York.

63
Schneider, A. (2003). "Decentralisation: Conceptualisation and Measurement." Studies in Comparative International Development 38(3): 32-56. Sear, C. and K. Parry (2011) Localism Bill: Local government and community empowerment, Research Paper 11/02, London: House of Commons Library. Tiebout, C. (1956). "A pure theory of local expenditures." Journal of Political Economy 64: 416-424. Tomaney, J., et al. (2009). "The transformation of the state? Assessing the impacts of new public management in Norway." Oslo: Norwegian Institute of Urban and Regional Research. Torrisi, G., A. Pike, J. Tomaney and V. Tselios (2010). "Defining and Measuring Decentralisation: A Critical Review." Unpublished Paper, CURDS, Newcastle University: Newcastle Upon Tyne. Treisman, D. (2002). "Defining and Measuring Decentralization: A Global Perspective." Unpublished manuscript. Treisman, D (2007) The Architecture of Government. Rethinking Political Decentralization. Cambridge: Cambridge University Press Tselios, V., Rodríguez-Pose, A., Pike, A., Tomaney, J. and Torrisi, G. (2010) Income Inequality, Regional Development and Decentralisation in Western Europe, SERC Discussion Paper, forthcoming. London: Spatial Economics Research Centre. Voigt, S. and Blume, L. (2009) The economic effects of federalism and decentralization – A cross-country assessment. CESifo Working Paper No: 2766, CESifo: Munich. Walker, J. L. (1969) “The Diffusion of Innovations among the American States,” American Political Science Review 63, September, 37-46 Weingast, B. R. (2009). "Second generation fiscal federalism: The implications of fiscal incentives." Journal of Urban Economics 65: 279-273. World Bank (2000) World Development Report 2000/1: Attacking Poverty. Oxford: Oxford University Press/Washington DC: World Bank.