december 31, 2017 t. rowe price prmtx media ...individual.troweprice.com/gcfiles/pdf/armtf.pdf ·...
TRANSCRIPT

PRMTX
TTMIX
ANNuAlREPORT
December 31, 2017
Media & Telecommunications Fund
Media & Telecommunications Fund–I Class
T. Rowe PRICe
The fund invests in foreign and U.S. companies that are primarily engaged in the media, technology, and telecommunication services sectors.

REPORTS ON THE WEB
Sign up for our Email Program, and you can begin to receive updated fund reports and prospectuses online rather than through the mail. Log in to your account at troweprice.com for more information.
HIGHLIGHTS
• Mediaandtelecommunicationsstocksperformedwellin2017,withInternet-relatedcompaniesagainoutpacingtraditionalfirmsbyawidemargin.
• TheMedia&TelecommunicationsFund’semphasisoninnovationanddisruptionhelpediteasilybeatitsLipperbenchmarkandbuildonitsrecordofsuperiorrelativeperformance.
• ManyofourtopInternet-relatedholdingscontinuedtodefytheskepticsandgrowatapacethatisalmostunprecedentedforcompaniesoftheirsize.
• WehavealargepositioninChineseInternetfirms,whichhaveprovedespeciallyinnovativeandarepoisedtochallengetheirU.S.counter-partsastheyexpandglobally.
T. Rowe Price Media & Telecommunications Fund
TheviewsandopinionsinthisreportwerecurrentasofDecember31,2017.They are not guarantees of performance or investment results andshouldnotbe takenas investmentadvice. Investmentdecisionsreflectavarietyof factors,and themanagers reserve the right tochange theirviews about individual stocks, sectors, and the markets at any time.As a result, the views expressed should not be relied upon as a fore-castof the fund’s future investment intent.Thereport iscertifiedunderthe Sarbanes-Oxley Act, which requiresmutual funds and other publiccompanies to affirm that, to the best of their knowledge, the informa-tionintheirfinancialreportsisfairlyandaccuratelystatedinallmaterialrespects.

T. Rowe Price Media & Telecommunications Fund
Manager’s Letter
1
Fellow Shareholders
Media and telecommunications stocks performed well in 2017. After a feint toward
value-oriented stocks at the end of 2016, investors turned back toward favoring
companies with the best growth prospects, in media and telecom and elsewhere.
This benefited our heavy emphasis on the leading firms within our investment
universe, most of which are leveraging the Internet to upend their markets. Below,
I describe the reasons many of these top firms can now be found in China and how our
fund’s large position in Chinese Internet companies is a recognition of their unique
competitive advantages.
PERFORMANCE COMPARISON
The Media & Telecommunications Fund returned 32.99% in the 12 months ended December 31, 2017, with about a third of that gain coming in the second half of the year. The fund again handily outpaced the Lipper Telecommunication Funds Average, and its long-term
relative performance remained exceptional, making it Lipper’s top-ranked fund in its category over the standard longer-term time periods ended in December. Based on cumulative total return, Lipper ranked the Media & Telecommunications Fund 2 of 34 (behind only its
TotalReturnPeriodsEnded12/31/17 6Months 12Months
Media&TelecommunicationsFund 10.97% 32.99%
Media&TelecommunicationsFund–IClass 11.03 33.12
LipperTelecommunicationFundsAverage 4.87 9.92
Performance Comparison

2
I Class counterpart), 1 of 33, 1 of 32, and 1 of 23 telecommunication funds for the 1-, 3-, 5-, and 10-year periods ended December 31, 2017, respectively. Returns for I Class shares varied, reflecting their different fee structure. (Past performance cannot guarantee future results.)
MARKET ENVIRONMENT
Stocks continued their ascent into record territory in the six months since our last report. Investors were encouraged by a pickup in growth in the U.S., as well as the first synchronized global expansion since the initial recovery from the financial crisis. The healthy economic environment fostered strong gains in corporate profits, and both second- and third-quarter earnings for the S&P 500 Index overall came in substantially better than expected. The Federal Reserve raised short-term rates by a quarter point in December, as was widely expected, but investors were encouraged that Fed officials signaled that they would continue to move slowly in raising rates. Finally, Republicans’ success in tax reform efforts, including a steep cut in corporate tax rates, appeared to provide another leg up for the markets late in the year.
Media and telecommunications stocks recorded solid gains in the period and for the fund’s fiscal year as a whole, although returns varied widely among various segments of the Lipper Science and Technology Funds Index. Internet stocks were especially strong, rising nearly 49% over the year, eclipsed only by the small IT services and information services segments, which gained 58% and 66%, respectively. The telecom services segment, which represents well over half of the index, was less robust, rising by less than 12%. Media stocks also trailed, gaining 13%.
Our sector was particularly notable for merger and acquisition activity—both scuttled and successful—in the back half of 2017. In November, AT&T put its acquisition of Time Warner on hold after Justice Department officials demanded that the merged company divest itself of either DirecTV, which is part of AT&T, or Turner Broadcasting System, a division of Time Warner. Wireless carriers Sprint and T-Mobile US called off their own merger in late October, unable to agree on its terms. Finally, Walt Disney announced a deal in December to acquire the majority of Twenty-First Century Fox’s entertainment assets, including its movie studio and cable networks. (Please refer to the fund’s portfolio of investments for a complete list of our holdings and the amount each represents in the portfolio.)
3
PORTFOLIO REVIEW
The fund recorded strong gains over a wide range of its holdings in its fiscal year, but the performance of our large positions in leading Internet firms stood out, as has often been the case in recent years. Our top two contributors were the top two Internet retailers in the world, Amazon.com and China’s Alibaba Group Holding. Amazon continued to beat revenue expectations in its retail business, while also seeing stellar growth in its cloud-computing operation, Amazon Web Services. Investors were pleased by the integration of Amazon’s acquisition of Whole Foods, and the company continued to impress us and others with its well-executed moves into advertising, video streaming, logistics, and seemingly whatever other market it targeted. Alibaba surprised investors by continuing to grow revenues by roughly 60%, while maintaining profit margins of nearly 40%—a remarkable achievement for a company of its size. We were also able to share in Alibaba’s success through our position in Altaba, a holding company built out of the assets of the former Yahoo! that owns roughly 15% of Alibaba. Altaba, which also holds a sizable position in Yahoo! Japan, is a direct beneficiary of the recent tax reform, as it will pay a much lower rate on the sale of either position.
The portfolio includes another U.S.-China pairing in social media and advertising firms Facebook and Tencent Holdings, both of which also contributed heavily to results. Facebook defied skeptics by seeing continued acceleration in revenue growth. Tencent, with over 900 million users in China, also surprised on the upside, thanks largely to spectacular growth in mobile gaming revenues—a market in which it is the global leader. Alphabet, Google’s parent company, beat analyst expectations for advertising growth, while also doing a better job of controlling expenses. Internet travel provider Priceline performed well as it beat expectations earlier in 2017 but pulled back a bit after not topping guidance for third-quarter results by as much as investors have come to expect—a high bar, indeed. Still, the stock was one of our top contributors for the year.
We received lesser but still substantial contributions from our telecom positions. Cellular tower operators American Tower and Crown Castle International performed well as wireless carriers continued to invest in building up their networks to handle video. The companies got a further boost from the dissolution of the T-Mobile and Sprint merger, which had led to worries that the deal would result in consolidation of the two companies’ tower leases. Despite a brief
4
pullback following the end of its merger talks, T-Mobile performed well for the fund for the year as a whole as investors continued to reward the company for seizing market share from Verizon and AT&T, in particular.
Our media holdings produced mixed results. We saw good results from Comcast after the cable giant appeared to be retaining video customers while enjoying success in its high-speed broadband business. European cable operator Liberty Global remained a disappointment for us, but the stock rallied in early December following the announcement of a $2 billion share repurchase. We hope that the company will eventually enjoy better results from its bundled Internet and video service and, better yet, might follow through on a rumored partnership with European telecom firm Vodafone. Discovery Communications was a successful investment for us over many years, but like many pay TV media firms, Discovery has seen advertising revenues fall due to cord-cutting customers turning to streaming video. After meaning-fully reducing our position over the past few years, we eliminated our remaining holding in 2017.
Conversely, our significant investment in the media industry’s main disruptor, Netflix, again rewarded us handsomely. Netflix rose sharply in July after reporting exceptionally strong subscriber gains in the previous quarter, overcoming historical seasonality with a content slate heavy on returning original hit shows. In the following quarter, the company reported particularly strong growth in international subscriptions, which have been rising at roughly a 40% annual pace. Disney and Twenty-First Century Fox also contributed to
results, and both stocks performed well following the announcement of Disney’s deal to acquire Fox’s assets.
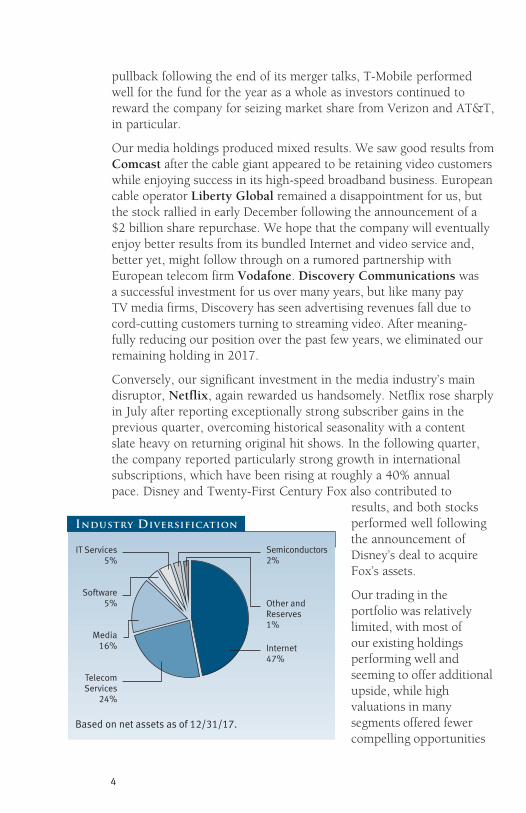
Our trading in the portfolio was relatively limited, with most of our existing holdings performing well and seeming to offer additional upside, while high valuations in many segments offered fewer compelling opportunities
TelecomServices
24%
Other and Reserves1%
Software5%
IT Services5%
Media16% Internet
47%
Semiconductors2%
Based on net assets as of 12/31/17.
Industry Diversification

5
to add new positions. We initiated a position in Sea, an Internet platform company operating in Southeast Asia, which we believe is well positioned to gain share in the region’s online gaming market. Additionally, Sea’s e-commerce business could be a source of long-term growth. We also took a position in China Literature, a Tencent subsidiary, following its November initial public offering. The company is the leading player in China’s fast-growing online literature market and has an enviable position due to its market-leading intellectual property portfolio consisting of 6.4 million writers and 9.6 million literary works.
OUTLOOK: CHINA’S INTERNET PLATFORMS PREPARE TO TAKE ON THE WORLd
For the past several decades, investors seeking out the world’s most innovative technology companies have not had to broaden their search much beyond the U.S., and Silicon Valley, in particular. Several factors have been behind U.S. dominance, chief among them access to capital through venture funds and other vehicles. Cultural factors have also been at work, with a tolerance for risk taking and a willingness to tolerate failure being especially important. Finally, success has built on itself, as talent has been recruited from around the world to Silicon Valley and other tech centers around the country. Pockets of such innovation have existed in Asia, Europe, and elsewhere, but not at the same level of intensity. Given these advantages, it is not surprising that the commercialization of the Internet in the early 1990s took place in the U.S.
The creation of the Internet has been a revolution comparable in many ways to the industrial revolution, but with its own unique characteristics. Typically, when technology gives birth to a new revolution, a group of companies form to create foundational infrastructure, as in the case of railroads or telephone networks. In these earlier examples, success in one region was replicated in another—so railroad and telephone operators in Italy or India, for example, could copy the technologies and business methods pioneered in England and the U.S.
In the case of the Internet, on the other hand, U.S. firms have expanded themselves, leaving no room for a separate Italian version of Facebook or Indian version of Google. A lack of physical constraints has been one factor favoring the expansion of U.S. firms, as software can move across borders much more easily than physical infrastructure. The Internet

6
also relies on scale in users and data, leading to network effects that make it much more difficult for regional players to compete. Finally, despite occasional clashes between Google and the European Union, for example, U.S. firms have benefited from the lack of a protectionist response from most other countries. Thus, in many ways, the Internet has widened the technological lead of the U.S.—even if many of its visionaries, such as the developer of the world’s first website, Englishman Tim Berners-Lee, have come from beyond its shores.
China is a notable and crucial exception to this pattern. Indeed, the Chinese Internet players are the globally leading innovators in many areas. It did not start off this way. We have been going to China for many years to observe the local media and telecom market—including
the efforts of both the local players and the U.S.-based platform companies. As recently as a decade ago, most of the Chinese Internet companies were simply copying their U.S. counterparts. That has since changed. One of the key reasons why is that China’s Internet companies have come along earlier in the maturation of the Chinese economy, giving them a cleaner slate for exploring the new technology’s possibilities. There is less legacy infrastructure in the way, enabling the Internet companies to quickly achieve higher penetra-tions of a core market and capitalize on opportunities
to participate in many different areas of the economy. A good example of this is the payments industry, an area where U.S. Internet firms have had muted success. Conversely, Alibaba and Tencent have made huge strides in arguably becoming the Chinese equivalents of Visa and MasterCard in the U.S.
While it is true that the Internet has arrived early in the economic development of many other countries as well, China has also been uniquely capable of recreating many of the other attributes that have been afforded to the U.S. technology companies. Most importantly, the Chinese tech sector has emulated Silicon Valley in fostering a culture of innovation with plenty of access to capital and a tolerance for failure. Additionally, while the U.S. companies have been able to reach significant scale as they have expanded internationally, China’s huge population has also enabled Chinese Internet firms to achieve massive scale within their own borders. At the same time, homegrown Chinese firms have a better understanding of Chinese consumers, whose buying habits are evolving rapidly as the country urbanizes and grows richer.
…ThEChInESE
InTERnETPLAyERS
AREThEgLObALLy
LEADIngInnOvATORS
InMAnyAREAS.
7
Due to the aforementioned dynamics, the Chinese Internet platforms have achieved scale on par with their U.S. counterparts and have been able to aggregate more areas of influence and build more comprehensive ecosystems domestically. As a result, they have gained knowledge and know-how in areas where the U.S. companies are not as experienced. This not only makes their platforms more robust and enables them to participate in a larger portion of the economy, but it also makes it harder for U.S. companies to compete against them—not just in China, but also potentially in neutral territory outside the U.S. and Chinese markets. In the future, I think we will see more head-to-head competition between U.S. and Chinese companies in markets such as in Southeast Asia.
With this potential competition in mind, it is worth commenting on the often suggested notion that the Chinese Internet players only won because they benefited from their government’s protection in their home market. While there is an element of truth to this, this factor risks overstatement. The Chinese government does block outside competition, in many cases, or otherwise makes it difficult for foreign firms to succeed. In the most blatant examples, services such as Facebook and YouTube are completely banned. In the case of Amazon, however, the Chinese government did not play any significant role in its failure in China. Indeed, I would argue that Amazon lost fair and square to the local players, Alibaba and JD.com, which prevailed on the basis of superior strategy and execution. Alibaba and JD were both extremely aggressive competitors, long-term oriented, well capitalized, and led by managers who better understood the market and the Chinese consumer.
Of course, the role of the Chinese government is also a concern due to the possibility that it will take control of the large Internet platform firms. While we take this risk seriously, we think it is unlikely any time soon because of the role these companies are playing in helping modernize the Chinese economy. As the influence of the Chinese economy grows and spreads elsewhere in Asia and around the world—and begins to rival that of the U.S.—we believe Chinese officials are unlikely to throttle this important driver. Indeed, you could make the argument that a government backlash against these firms is less likely to happen in China than in the U.S. In my last letter, I described the threat of heightened regulation in the U.S., where average citizens have suffered from stagnant wages and feel like they have been left behind as the big technology companies have

8
flourished. In China, on the other hand, gross domestic product per capita has increased almost tenfold over the past two decades, and the International Monetary Fund is anticipating another 50% increase over the next five years. Not surprisingly, most Chinese citizens are very satisfied with the trend in their economic situation.
With this view guiding us, we have built large positions in a handful of Chinese Internet companies that we believe will be the foundational infrastructure providers for the new economy in China, and potentially beyond. (Chinese Internet stocks accounted for 14.5% of total assets as of December 31, 2017.) This positioning paid off for us handsomely over the past year, with these positions (excluding China Literature, which was added in November) gaining 83.1% on a weighted average basis. I am confident that more opportunities lie ahead.
In closing, I should note that our ability to invest in these far-flung companies relies a good deal on the efforts of our team in Hong Kong, as well the research of T. Rowe Price’s industry-specific analysts in Baltimore, Asia, and elsewhere. I look forward to reporting to you on our collective efforts in six months.
Thank you for your continued support and confidence in T. Rowe Price.
Respectfully submitted,
Paul D. Greene IIChairman of the fund’s Investment Advisory Committee
January 16, 2018
The committee chairman has day-to-day responsibility for managing the portfolio and works with committee members in developing and executing the fund’s investment program.

9
T. Rowe Price Media & Telecommunications Fund
Risks of Investing in the Fund
Fundsthatinvestonlyinspecificindustriesmayexperiencegreatervolatilitythanfundsinvestinginabroadrangeofindustries.Technologystocks,historically,haveexperiencedunusuallywidepriceswings,bothupanddown.Thepotentialforwidevariationinperformancereflectsthespecialriskscommontocompaniesintherapidlychangingfieldoftechnology.Forexample,productsorservicesthatatfirstappearpromisingmaynotprovecommerciallysuccessfulandmaybecomeobsoletequickly.Earningsdisappointmentsandintensecompetitionformarketsharecanresultinsharppricedeclines.
Glossary
Gross domestic product: Thetotalmarketvalueofallgoodsandservicesproducedinacountryinagivenyear.
Lipper averages:TheaveragesofavailablemutualfundperformancereturnsforspecifiedperiodsincategoriesdefinedbyLipperInc.
S&P 500 Index:Anunmanagedindexthattracksthestocksof500primarilylarge-capU.S.companies.

10
T. Rowe Price Media & Telecommunications Fund
TWENTY-FIVE LARGEST HOLdINGS
Percentof netAssets 12/31/17
Amazon.com 10.9%Alibabagroupholding 6.3Facebook 6.3Priceline 5.6Alphabet 5.6
AmericanTower 5.5CrownCastleInternational 5.3T-MobileUS 5.0Comcast 4.6Tencentholdings 4.2
PayPalholdings 3.0Libertyglobal 2.9verizonCommunications 2.6CharterCommunications 2.2SbACommunications 2.2
Ctrip.comInternational 2.1netflix 1.9Equinix 1.6baidu 1.5vodafone 1.3
Libertybroadband 1.3Iliad 1.2Twenty-FirstCenturyFox 1.2Qualcomm 1.2Altaba 1.2
Total 86.7%
note:Theinformationshowndoesnotreflectanyexchange-tradedfunds(ETFs),cashreserves,orcollateralforsecuritieslendingthatmaybeheldintheportfolio.
Portfolio Highlights
11
T. Rowe Price Media & Telecommunications Fund
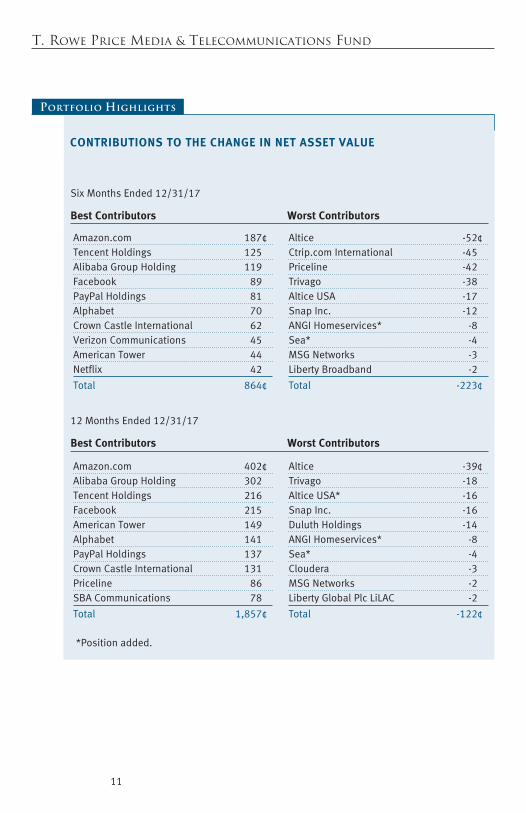
CONTRIBUTIONS TO THE CHANGE IN NET ASSET VALUE
SixMonthsEnded12/31/17
Best Contributors Worst Contributors
Amazon.com 187¢Tencentholdings 125Alibabagroupholding 119Facebook 89PayPalholdings 81Alphabet 70CrownCastleInternational 62verizonCommunications 45AmericanTower 44netflix 42
Total 864¢
Altice -52¢Ctrip.comInternational -45Priceline -42Trivago -38AlticeUSA -17SnapInc. -12AngIhomeservices* -8Sea* -4MSgnetworks -3Libertybroadband -2
Total -223¢
12MonthsEnded12/31/17
Best Contributors Worst Contributors
Amazon.com 402¢Alibabagroupholding 302Tencentholdings 216Facebook 215AmericanTower 149Alphabet 141PayPalholdings 137CrownCastleInternational 131Priceline 86SbACommunications 78
Total 1,857¢
Altice -39¢Trivago -18AlticeUSA* -16SnapInc. -16Duluthholdings -14AngIhomeservices* -8Sea* -4Cloudera -3MSgnetworks -2LibertyglobalPlcLiLAC -2
Total -122¢
*Positionadded.
Portfolio Highlights

T. Rowe Price Media & Telecommunications Fund
Performance and Expenses
12
S&P 500 Index $22,603
Media & Telecommunications Fund $32,933
As of 12/31/17
12/07 12/1312/1212/1112/1012/0912/08 12/1712/14
M E D I A & T E L ECO M M U N I C AT I O N S F U N D
Lipper Telecommunication Funds Average $14,857
10,000
16,000
22,000
28,000
34,000
$40,000
Note: Performance for the I Class will vary due to its differing fee structure. See returnstable below.
12/15 12/16
Growth of $10,000
Thischartshowsthevalueofahypothetical$10,000investmentinthefundoverthepast10fiscalyearperiodsorsinceinception(forfundslacking10-yearrecords).Theresultiscomparedwithbenchmarks,whichmayincludeabroad-basedmarketindexandapeergroupaverageorindex.Marketindexesdonotincludeexpenses,whicharedeductedfromfundreturnsaswellasmutualfundaveragesandindexes.
Since InceptionPeriodsEnded12/31/17 1year 5years 10years Inception Date
Media&TelecommunicationsFund 32.99% 18.61% 12.66% – –
Media&TelecommunicationsFund–IClass 33.12 – – 24.64% 3/23/16
Current performance may be higher or lower than the quoted past performance, which cannot guarantee future results. Share price, principal value, and return will vary, and you may have a gain or loss when you sell your shares. For the most recent month-end perfor-mance, please visit our website (troweprice.com) or contact a T. Rowe Price representative at 1-800-225-5132, or for I Class shares, 1-800-638-8790.
Thistableshowshowthefundwouldhaveperformedeachyearifitsactual(orcumula-tive)returnsfortheperiodsshownhadbeenearnedataconstantrate.Averageannualtotalreturnfiguresincludechangesinprincipalvalue,reinvesteddividends,andcapitalgaindistributions.Returnsdonotreflecttaxesthattheshareholdermaypayonfunddistributionsortheredemptionoffundshares.Whenassessingperformance,investorsshouldconsiderbothshort-andlong-termreturns.
Average Annual Compound Total Return

13
T. Rowe Price Media & Telecommunications Fund
Media&TelecommunicationsFund 0.79%
Media&TelecommunicationsFund–IClass 0.67
Theexpenseratioshownisasofthefund’sfiscalyearended12/31/16.Thisnumbermayvaryfromtheexpenseratioshownelsewhereinthisreportbecauseitisbasedonadifferenttimeperiodand,ifapplicable,includesacquiredfundfeesandexpensesbutdoesnotincludefeeorexpensewaivers.
Expense Ratio
Fund Expense Example
Asamutualfundshareholder,youmayincurtwotypesofcosts:(1)transactioncosts,suchasredemptionfeesorsalesloads,and(2)ongoingcosts,includingmanagementfees,distributionandservice(12b-1)fees,andotherfundexpenses.Thefollowingexampleisintendedtohelpyouunderstandyourongoingcosts(indollars)ofinvestinginthefundandtocomparethesecostswiththeongoingcostsofinvestinginothermutualfunds.Theexampleisbasedonaninvestmentof$1,000investedatthebeginningofthemostrecentsix-monthperiodandheldfortheentireperiod.
Pleasenotethatthefundhastwoshareclasses:Theoriginalshareclass(InvestorClass)chargesnodistributionandservice(12b-1)fee,andtheIClasssharesarealsoavailabletoinstitutionallyorientedclientsandimposeno12b-1oradministrativefeepayment.Eachshareclassispresentedseparatelyinthetable.
Actual ExpensesThefirstlineofthefollowingtable(Actual)providesinformationaboutactualaccountvaluesandexpensesbasedonthefund’sactualreturns.youmayusetheinformationonthisline,togetherwithyouraccountbalance,toestimatetheexpensesthatyoupaidovertheperiod.Simplydivideyouraccountvalueby$1,000(forexample,an$8,600accountvaluedividedby$1,000=8.6),thenmultiplytheresultbythenumberonthefirstlineundertheheading“ExpensesPaidDuringPeriod”toestimatetheexpensesyoupaidonyouraccountduringthisperiod.
Hypothetical Example for Comparison PurposesTheinformationonthesecondlineofthetable(hypothetical)isbasedonhypotheticalaccountvaluesandexpensesderivedfromthefund’sactualexpenseratioandanassumed5%peryearrateofreturnbeforeexpenses(notthefund’sactualreturn).youmaycomparetheongoingcostsofinvestinginthefundwithotherfundsbycontrastingthis5%hypotheticalexampleandthe5%hypotheticalexamplesthatappearintheshareholderreportsoftheotherfunds.Thehypotheticalaccountvaluesandexpensesmaynotbeusedtoestimatetheactualendingaccountbalanceorexpensesyoupaidfortheperiod.

14
T. Rowe Price Media & Telecommunications Fund
Fund Expense Example (continued)
Note:T.RowePricechargesanannualaccountservicefeeof$20,generallyforaccountswithlessthan$10,000.ThefeeiswaivedforanyinvestorwhoseT.RowePricemutualfundaccountstotal$50,000ormore;accountselectingtoreceiveelectronicdeliveryofaccountstatements,transactionconfirmations,prospectuses,andshareholderreports;oraccountsofaninvestorwhoisaT.RowePricePersonalServicesorEnhancedPersonalServicesclient(enrollmentintheseprogramsgenerallyrequiresT.RowePriceassetsofatleast$250,000).Thisfeeisnotincludedintheaccompanyingtable.Ifyouaresubjecttothefee,keepitinmindwhenyouareestimatingtheongoingexpensesofinvestinginthefundandwhencomparingtheexpensesofthisfundwithotherfunds.
youshouldalsobeawarethattheexpensesshowninthetablehighlightonlyyourongoingcostsanddonotreflectanytransactioncosts,suchasredemptionfeesorsalesloads.Therefore,thesecondlineofthetableisusefulincomparingongoingcostsonlyandwillnothelpyoudeterminetherelativetotalcostsofowningdifferentfunds.Totheextentafundchargestransactioncosts,however,thetotalcostofowningthatfundishigher.
beginning Ending ExpensesPaid Accountvalue Accountvalue DuringPeriod* 7/1/17 12/31/17 7/1/17to12/31/17
Investor ClassActual $1,000.00 $1,109.70 $4.09
hypothetical(assumes5%returnbeforeexpenses) 1,000.00 1,021.32 3.92
I ClassActual 1,000.00 1,110.30 3.56
hypothetical(assumes5%returnbeforeexpenses) 1,000.00 1,021.83 3.41
*Expensesareequaltothefund’sannualizedexpenseratioforthe6-monthperiod,multipliedbytheaverageaccountvalueovertheperiod,multipliedbythenumberofdaysinthemostrecentfiscalhalfyear(184),anddividedbythedaysintheyear(365)toreflectthehalf-yearperiod.TheannualizedexpenseratiooftheInvestorClasswas0.77%,andtheIClasswas0.67%.
Media & Telecommunications Fund

15
T. Rowe Price Media & Telecommunications Fund
Financial Highlights For a share outstanding throughout each period
The accompanying notes are an integral part of these financial statements.
Investor Class
Year Ended
12/31/17
12/31/16
12/31/15
12/31/14
12/31/13
NET ASSET VALUE
Beginning of period
$ 74.25
$ 70.61
$ 65.07
$ 69.46
$ 53.30
Investment activities
Net investment income (loss)(1)
0.01
(0.02)
0.16
1.52
0.22
Net realized and unrealized gain / loss
24.48
5.32
7.64
1.13
21.30
Total from investment activities
24.49
5.30
7.80
2.65
21.52
Distributions
Net investment income
(0.01)
(0.02)
(0.14)
(1.60)
(0.21)
Net realized gain
(2.26)
(1.64)
(2.12)
(5.44)
(5.15)
Total distributions
(2.27)
(1.66)
(2.26)
(7.04)
(5.36)
NET ASSET VALUE
End of period $ 96.47 $ 74.25 $ 70.61 $ 65.07 $ 69.46
Ratios/Supplemental Data Total return(2) 32.99% 7.49% 12.00% 4.14% 40.78%
Ratio of total expenses to average net assets
0.78%
0.79%
0.79%
0.80%
0.80%
Ratio of net investment income (loss) to average net assets
0.02%
(0.03)%
0.23%
2.17%
0.35%
Portfolio turnover rate
7.3%
15.7%
13.5%
24.7%
53.8%
Net assets, end of period
(in millions)
$ 4,722
$ 3,689
$ 3,573
$ 3,182
$ 3,329
(1) Per share amounts calculated using average shares outstanding method. (2) Total return reflects the rate that an investor would have earned on an investment in the fund
during each period, assuming reinvestment of all distributions.

16
T. Rowe Price Media & Telecommunications Fund
Financial Highlights For a share outstanding throughout each period
The accompanying notes are an integral part of these financial statements.
I Class
Year Ended
12/31/17
3/23/16(1)
Through
12/31/16
NET ASSET VALUE
Beginning of period
$ 74.31
$ 68.38
Investment activities
Net investment income(2)
0.12
0.14
Net realized and unrealized gain / loss
24.49
7.45
Total from investment activities
24.61
7.59
Distributions
Net investment income
(0.12)
(0.02)
Net realized gain
(2.26)
(1.64)
Total distributions
(2.38)
(1.66)
NET ASSET VALUE
End of period $ 96.54 $ 74.31
Ratios/Supplemental Data Total return(3) 33.12% 11.08%
Ratio of total expenses to average net assets
0.66%
0.67%(4)
Ratio of net investment income to average net assets
0.14%
0.26%(4)
Portfolio turnover rate
7.3%
15.7%
Net assets, end of period
(in thousands)
$ 134,913
$ 88,543
(1) Inception date (2) Per share amounts calculated using average shares outstanding method. (3) Total return reflects the rate that an investor would have earned on an investment in the
fund during each period, assuming reinvestment of all distributions. Total return is not annualized for periods less than one year.
(4) Annualized

T. Rowe Price Media & Telecommunications Fund December 31, 2017
Portfolio of Investments ‡ Shares $ Value
(Cost and value in $000s)
17
COMMON STOCKS 98.1%
INFORMATION SERVICES 0.0%
Data Services 0.0%
Oanda, Acquisition Date: 8/24/07 - 7/2/14, Cost $429 (1)(2)(3) 15,041 213
Total Information Services 213
INTERNET 46.1%
Internet Media/ Advertising 18.4%
Alphabet, Class A (3) 79,050 83,271
Alphabet, Class C (3) 179,853 188,198
Baidu, ADR (3) 312,196 73,119
China Literature (HKD) (3) 1,036,200 11,081
Facebook, Class A (3) 1,733,100 305,823
NAVER (KRW) 6,196 5,034
Sea, ADR (3)(4) 1,114,200 14,852
Snap Inc. (3) 575,646 8,410
Tencent Holdings (HKD) 3,964,700 205,205
894,993
Internet Retail 18.8%
Alibaba Group Holding, ADR (3) 1,774,934 306,052
Altaba (3)(4) 839,300 58,625
Amazon.com (3) 453,000 529,770
Duluth Holdings, Class B (3)(4) 981,000 17,511
911,958
Internet Services 8.9%
ANGI Homeservices, Class A (3)(4) 2,093,368 21,897
Cargurus (3)(4) 88,738 2,660
Ctrip.com International, ADR (3) 2,258,000 99,578
Despegar.com (3)(4) 223,281 6,136
Houzz, Acquisition Date: 6/3/14, Cost $1,400 (1)(2)(3) 186,860 2,107
Priceline (3) 157,772 274,167
Redfin (3)(4) 111,800 3,502

T. Rowe Price Media & Telecommunications Fund
Shares $ Value
(Cost and value in $000s)
18
Redfin, Acquisition Date: 11/7/13 - 5/5/17, Cost $3,990 (1)(3) 545,981 16,245
Trivago, ADR (3)(4) 1,172,889 8,022
434,314
Total Internet 2,241,265
IT SERVICES 5.0%
IT Services 2.0%
Amadeus IT, A Shares (EUR) 203,439 14,640
Equinix, REIT 174,756 79,203
93,843
Processors 3.0%
PayPal Holdings (3) 1,997,300 147,041
147,041
Total IT Services 240,884
MEDIA 16.3%
Cable/Satellite 11.2%
Charter Communications, Class A (3) 317,609 106,704
Comcast, Class A 5,543,500 222,017
Liberty Broadband, Class C (3) 756,416 64,416
Liberty Global, Series C (3) 4,144,521 140,251
Liberty Global Plc LiLAC, Class C (3) 665,156 13,230
546,618
Media & Entertainment 5.1%
Altice, Class A (EUR) (3) 1,372,969 14,398
Altice, Class B (EUR) (3) 753,985 7,995
Altice USA, Class A (3)(4) 1,096,506 23,279
Central European Media Enterprises, Class A (3) 1,756,526 8,168
MSG Networks (3) 443,415 8,979
Netflix (3) 490,280 94,114
Twenty-First Century Fox, Class A 1,731,800 59,799

T. Rowe Price Media & Telecommunications Fund
Shares $ Value
(Cost and value in $000s)
19
Walt Disney 272,600 29,307
246,039
Total Media 792,657
SEMICONDUCTORS 2.1%
Digital Semiconductors 2.1%
NVIDIA 162,900 31,521
Qualcomm 920,060 58,902
Xilinx 193,100 13,019
Total Semiconductors 103,442
SOFTWARE 4.9%
Applications Software 1.5%
Atlassian, Class A (3) 739,599 33,666
Salesforce.com (3) 190,900 19,516
Workday (3) 216,100 21,986
75,168
Enterprise Software 0.4%
Coupa Software (3)(4) 593,193 18,519
18,519
Infrastructure Software 0.7%
Microsoft 322,400 27,578
MongoDB (3)(4) 131,663 3,908
MongoDB, Class B, Lock-up Shares, Acquisition Date: 10/2/13 Cost $3,228 (1)(3) 96,502 2,721
34,207
Software & Services 0.1%
Dropbox, Class A, Acquisition Date: 11/7/14 Cost $3,270 (1)(2)(3) 171,173 2,005
Dropbox, Class B, Acquisition Date: 5/1/12, Cost $754 (1)(2)(3) 83,278 975
2,980

T. Rowe Price Media & Telecommunications Fund
Shares $ Value
(Cost and value in $000s)
20
Systems Software 2.2%
ServiceNow (3) 432,549 56,400
VeriSign (3)(4) 428,500 49,038
105,438
Total Software 236,312
TELECOM SERVICES 23.7%
European Telecom 2.6%
Iliad (EUR) 251,633 60,295
Vodafone (GBP) 20,707,070 65,455
125,750
Towers 13.5%
American Tower, REIT 1,872,500 267,150
Crown Castle International, REIT 2,340,268 259,793
Sarana Menara Nusantara (IDR) 82,395,300 24,272
SBA Communications, REIT (3) 646,300 105,580
656,795
U.S. Wireless 7.6%
T-Mobile US (3) 3,795,196 241,033
Verizon Communications 2,368,776 125,379
366,412
Total Telecom Services 1,148,957
Total Common Stocks (Cost $2,102,035) 4,763,730

T. Rowe Price Media & Telecommunications Fund
Shares $ Value
(Cost and value in $000s)
21
PREFERRED STOCKS 0.1%
INTERNET 0.1%
Internet Retail 0.1%
Flipkart, Series G, Acquisition Date: 12/17/14 - 12/12/17 Cost $4,140 (1)(2)(3) 34,565 4,092
Total Preferred Stocks (Cost $4,140) 4,092
CONVERTIBLE PREFERRED STOCKS 1.4%
INTERNET 1.1%
Internet Services 1.1%
Airbnb, Series D, Acquisition Date: 4/16/14 Cost $5,109 (1)(2)(3) 125,499 14,690
Airbnb, Series E, Acquisition Date: 7/14/15 Cost $3,047 (1)(2)(3) 32,734 3,832
Houzz, Series D, Acquisition Date: 6/3/14, Cost $4,200 (1)(2)(3) 560,560 6,321
Uber Technologies, Series E, Acquisition Date: 12/5/14 Cost $6,573 (1)(2)(3) 197,272 6,801
Uber Technologies, Series G, Acquisition Date: 12/3/15 Cost $7,293 (1)(2)(3) 149,523 5,155
Vroom, Series F, Acquisition Date: 6/30/17 - 11/27/17 Cost $11,025 (1)(2)(3) 646,332 11,025
Xiaoju Kuaizhi, Class A-17, Acquisition Date: 10/19/15 Cost $3,572 (1)(2)(3) 130,241 6,633
Total Internet 54,457
SOFTWARE 0.3%
Applications Software 0.1%
Plex Systems, Series B, Acquisition Date: 6/9/14 Cost $3,508 (1)(2)(3) 1,528,887 2,446
2,446

T. Rowe Price Media & Telecommunications Fund
Shares $ Value
(Cost and value in $000s)
22
Enterprise Software 0.1%
Domo, Series D, Acquisition Date: 1/31/14 Cost $3,003 (1)(2)(3) 726,554 4,519
4,519
Software & Services 0.1%
Dropbox, Series A, Acquisition Date: 5/1/12, Cost $936 (1)(2)(3) 103,417 1,211
Dropbox, Series A-1, Acquisition Date: 5/1/12 Cost $4,597 (1)(2)(3) 508,002 5,949
Total Software & Services 7,160
Total Software 14,125
Total Convertible Preferred Stocks (Cost $52,862) 68,582
SHORT-TERM INVESTMENTS 0.2%
Money Market Funds 0.2%
T. Rowe Price Treasury Reserve Fund, 1.25% (5)(6) 12,408,450 12,408
Total Short-Term Investments (Cost $12,408) 12,408
SECURITIES LENDING COLLATERAL 2.2%
Investments in a Pooled Account through Securities Lending Program with State Street Bank 2.2%
Short-Term Funds 2.2%
T. Rowe Price Short-Term Fund, 1.49% (5)(6) 10,695,780 106,958
Total Investments through Securities Lending Program with State Street Bank 106,958
Total Securities Lending Collateral (Cost $106,958) 106,958
Total Investments in Securities
102.0% of Net Assets (Cost $2,278,403) $ 4,955,770

T. Rowe Price Media & Telecommunications Fund
23
‡ Shares are denominated in U.S. dollars unless otherwise noted. (1)
Security cannot be offered for public resale without first being registered under the Securities Act of 1933 and related rules ("restricted security"). Acquisition date represents the day on which an enforceable right to acquire such security is obtained and is presented along with related cost in the security description. The fund has registration rights for certain restricted securities. Any costs related to such registration are borne by the issuer. The aggregate value of restricted securities (excluding 144A holdings) at period-end amounts to $96,940 and represents 2.0% of net assets.
(2) Level 3 in fair value hierarchy. See Note 2. (3) Non-income producing (4)
All or a portion of this security is on loan at December 31, 2017 -- total value of such securities at period-end amounts to $156,578. See Note 3.
(5) Seven-day yield (6) Affiliated Company
ADR American Depositary Receipts EUR Euro GBP British Pound HKD Hong Kong Dollar IDR Indonesian Rupiah
KRW South Korean Won REIT
A domestic Real Estate Investment Trust whose distributions pass-through with original tax character to the shareholder

T. Rowe Price Media & Telecommunications Fund
24
The accompanying notes are an integral part of these financial statements.
Affiliated Companies
($000s)
The fund may invest in certain securities that are considered affiliated companies. As defined by the 1940 Act, an affiliated company is one in which the fund owns 5% or more of the outstanding voting securities, or a company that is under common ownership or control. The following securities were considered affiliated companies for all or some portion of the year ended December 31, 2017. Net realized gain (loss), investment income, change in net unrealized gain/loss, and purchase and sales cost reflect all activity for the period then ended.
Affiliate
Net Realized Gain(Loss)
Change in NetUnrealizedGain/Loss
InvestmentIncome
T. Rowe Price Treasury Reserve Fund $ — $ — $ 419 T. Rowe Price Short-Term Fund — — —++ Totals $ —# $ — $ 419+ Supplementary Investment Schedule Affiliate
Value12/31/16
PurchaseCost
SalesCost
Value12/31/17
T. Rowe Price Treasury Reserve Fund $ 191,345 ¤ ¤ $ 12,408 T. Rowe Price Short-Term Fund — ¤ ¤ 106,958 $ 119,366^
# Capital gain/loss distributions from mutual funds represented $0 of the net realized gain (loss).
++ Excludes earnings on securities lending collateral, which are subject to rebates and fees as described in Note 3.
+ Investment income comprised $419 of dividend income and $0 of interest income. ¤ Purchase and sale information not shown for cash management funds. ^ The cost basis of investments in affiliated companies was $119,366.

25
T. Rowe Price Media & Telecommunications Fund December 31, 2017
The accompanying notes are an integral part of these financial statements.
($000s, except shares and per share amounts)
Statement of Assets and Liabilities
Assets
Investments in securities, at value (cost $2,278,403) $ 4,955,770
Receivable for investment securities sold 8,261
Receivable for shares sold 5,413
Dividends and interest receivable 2,762
Other assets 53,932
Total assets 5,026,138
Liabilities
Obligation to return securities lending collateral 160,778
Payable for shares redeemed 5,011
Investment management fees payable 2,613
Due to affiliates 291
Payable to directors 3
Other liabilities 314
Total liabilities 169,010
NET ASSETS $ 4,857,128 Net Assets Consist of:
Undistributed net investment income $ 179
Accumulated undistributed net realized gain 3,686
Net unrealized gain 2,677,385
Paid-in capital applicable to 50,348,587 shares of $0.0001 par value capital stock outstanding; 1,000,000,000 shares authorized 2,175,878
NET ASSETS $ 4,857,128 NET ASSET VALUE PER SHARE
Investor Class ($4,722,215,315 / 48,951,156 shares outstanding) $ 96.47
I Class ($134,912,997 / 1,397,431 shares outstanding) $ 96.54

T. Rowe Price Media & Telecommunications Fund
($000s)
Statement of Operations
26
Theaccompanyingnotesareanintegralpartofthesefinancialstatements.
Year Ended
12/31/17Investment Income (Loss)
Income Dividend $ 32,116 Securities lending 2,918
Total income 35,034
Expenses Investment management 28,259 Shareholder servicing
Investor Class $ 5,182 I Class 2 5,184
Prospectus and shareholder reports Investor Class 126 I Class 7 133
Custody and accounting 275 Registration 112 Legal and audit 54 Directors 15 Miscellaneous 184
Total expenses 34,216
Net investment income 818
Realized and Unrealized Gain / Loss
Net realized gain (loss) Securities 99,416 Foreign currency transactions (11)
Net realized gain 99,405
Change in net unrealized gain / loss
Securities 1,113,750 Other assets and liabilities denominated in foreign currencies 21
Change in net unrealized gain / loss 1,113,771
Net realized and unrealized gain / loss 1,213,176
INCREASE IN NET ASSETS FROM OPERATIONS $ 1,213,994

T. Rowe Price Media & Telecommunications Fund
($000s)
27
Statement of Changes in Net Assets
Year Ended
12/31/17 12/31/16Increase (Decrease) in Net Assets
Operations Net investment income (loss) $ 818 $ (878) Net realized gain 99,405 117,462 Change in net unrealized gain / loss 1,113,771 146,643 Increase in net assets from operations 1,213,994 263,227
Distributions to shareholders
Net investment income Investor Class (478) (977) I Class (161) (24)
Net realized gain Investor Class (108,309) (80,031) I Class (3,028) (1,918)
Decrease in net assets from distributions (111,976) (82,950)
Capital share transactions*
Shares sold Investor Class 594,191 446,822 I Class 30,567 92,215
Distributions reinvested Investor Class 104,149 77,750 I Class 3,041 1,866
Shares redeemed Investor Class (738,813) (592,114) I Class (15,096) (2,903)
Increase (decrease) in net assets from capital share transactions (21,961) 23,636
Net Assets
Increase during period 1,080,057 203,913 Beginning of period 3,777,071 3,573,158
End of period $ 4,857,128 $ 3,777,071
Undistributed net investment income 179 –
T. Rowe Price Media & Telecommunications Fund
28
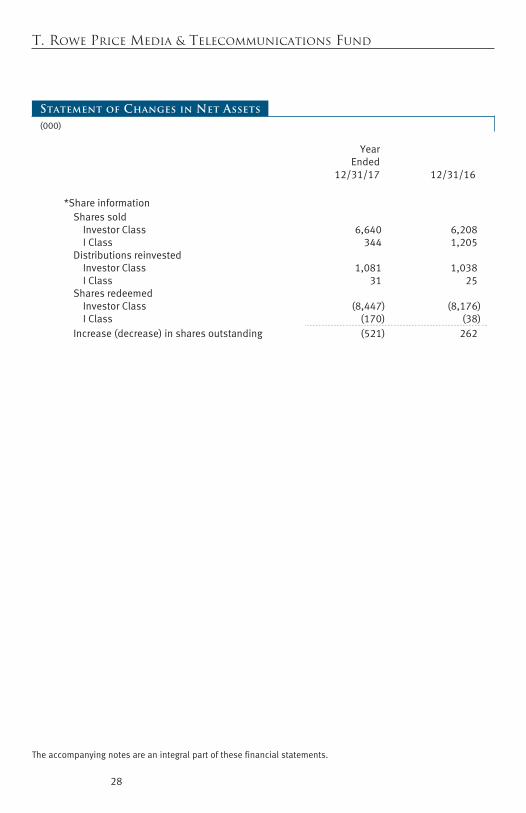
(000)
Statement of Changes in Net Assets
Year Ended
12/31/17 12/31/16 *Share information
Shares sold Investor Class 6,640 6,208 I Class 344 1,205
Distributions reinvested Investor Class 1,081 1,038 I Class 31 25
Shares redeemed Investor Class (8,447) (8,176) I Class (170) (38)
Increase (decrease) in shares outstanding (521) 262
Theaccompanyingnotesareanintegralpartofthesefinancialstatements.

29
T. Rowe Price Media & Telecommunications Fund December 31, 2017
Notes to Financial Statements
T. Rowe Price Media & Telecommunications Fund, Inc. (the fund) is registered under the Investment Company Act of 1940 (the 1940 Act) as a diversified, open-end management investment company. The fund seeks to provide long-term capital growth through the common stocks of media, technology, and telecommunications companies. The fund has two classes of shares: the Media & Telecommunications Fund (Investor Class) and the Media & Telecommunications Fund–I Class (I Class). I Class shares generally are available only to investors meeting a $1,000,000 minimum investment or certain other criteria. Each class has exclusive voting rights on matters related solely to that class; separate voting rights on matters that relate to both classes; and, in all other respects, the same rights and obligations as the other class.
NOTE 1 - SIGNIFICANT ACCOUNTING POLICIES
Basis of Preparation The fund is an investment company and follows accounting and reporting guidance in the Financial Accounting Standards Board (FASB) Accounting Standards Codification Topic 946 (ASC 946). The accompanying financial statements were prepared in accordance with accounting principles generally accepted in the United States of America (GAAP), including, but not limited to, ASC 946. GAAP requires the use of estimates made by management. Management believes that estimates and valuations are appropriate; however, actual results may differ from those estimates, and the valuations reflected in the accompanying financial statements may differ from the value ultimately realized upon sale or maturity.
Investment Transactions, Investment Income, and distributions Investment transactions are accounted for on the trade date basis. Income and expenses are recorded on the accrual basis. Realized gains and losses are reported on the identified cost basis. Dividends received from mutual fund investments are reflected as dividend income; capital gain distributions are reflected as realized gain/loss. Dividend income and capital gain distributions are recorded on the ex-dividend date. Income tax-related interest and penalties, if incurred, are recorded as income tax expense. Distributions from REITs are initially recorded as dividend income and, to the extent such represent a return of capital or capital gain for tax purposes, are reclassified when such information becomes available. Income distributions are declared and paid by each class annually. Distributions to shareholders are recorded on the ex-dividend date. A capital gain distribution may also be declared and paid by the fund annually.
30
T. Rowe Price Media & Telecommunications Fund
Currency Translation Assets, including investments, and liabilities denominated in foreign currencies are translated into U.S. dollar values each day at the prevailing exchange rate, using the mean of the bid and asked prices of such currencies against U.S. dollars as quoted by a major bank. Purchases and sales of securities, income, and expenses are translated into U.S. dollars at the prevailing exchange rate on the respective date of such transaction. The portion of the results of operations attributable to changes in foreign exchange rates on investments is not bifurcated from the portion attributable to changes in market prices. The effect of changes in foreign currency exchange rates on realized and unrealized security gains and losses is reflected as a component of security gains and losses.
Class Accounting Shareholder servicing, prospectus, and shareholder report expenses incurred by each class are charged directly to the class to which they relate. Expenses common to both classes, investment income, and realized and unrealized gains and losses are allocated to the classes based upon the relative daily net assets of each class. To the extent any expenses are waived or reimbursed in accordance with an expense limitation (see Note 5), the waiver or reimbursement is charged to the applicable class or allocated across the classes in the same manner as the related expense.
Rebates Subject to best execution, the fund may direct certain security trades to brokers who have agreed to rebate a portion of the related brokerage commission to the fund in cash. Commission rebates are reflected as realized gain on securities in the accompanying financial statements and totaled $6,000 for the year ended December 31, 2017.
New Accounting Guidance In March 2017, the FASB issued amended guidance to shorten the amortization period for certain callable debt securities, held at a premium. The guidance is effective for fiscal years and interim periods beginning after December 15, 2018. Adoption will have no effect on the fund’s net assets or results of operations.
On August 1, 2017, the fund implemented amendments to Regulation S-X, issued by the Securities and Exchange Commission, which require standardized, enhanced disclosures, particularly related to derivatives, in investment company financial statements. Adoption had no effect on the fund’s net assets or results of operations.

31
T. Rowe Price Media & Telecommunications Fund
Indemnification In the normal course of business, the fund may provide indemnification in connection with its officers and directors, service providers, and/or private company investments. The fund’s maximum exposure under these arrangements is unknown; however, the risk of material loss is currently considered to be remote.
NOTE 2 - VALUATION
The fund’s financial instruments are valued and each class’s net asset value (NAV) per share is computed at the close of the New York Stock Exchange (NYSE), normally 4 p.m. ET, each day the NYSE is open for business. However, the NAV per share may be calculated at a time other than the normal close of the NYSE if trading on the NYSE is restricted, if the NYSE closes earlier, or as may be permitted by the SEC.
Fair Value The fund’s financial instruments are reported at fair value, which GAAP defines as the price that would be received to sell an asset or paid to transfer a liability in an orderly transaction between market participants at the measurement date. The T. Rowe Price Valuation Committee (the Valuation Committee) is an internal committee that has been delegated certain responsibilities by the fund’s Board of Directors (the Board) to ensure that financial instruments are appropriately priced at fair value in accordance with GAAP and the 1940 Act. Subject to oversight by the Board, the Valuation Committee develops and oversees pricing-related policies and procedures and approves all fair value determinations. Specifically, the Valuation Committee establishes procedures to value securities; determines pricing techniques, sources, and persons eligible to effect fair value pricing actions; oversees the selection, services, and performance of pricing vendors; oversees valuation-related business continuity practices; and provides guidance on internal controls and valuation-related matters. The Valuation Committee reports to the Board and has representation from legal, portfolio management and trading, operations, risk management, and the fund’s treasurer.
Various valuation techniques and inputs are used to determine the fair value of financial instruments. GAAP establishes the following fair value hierarchy that categorizes the inputs used to measure fair value:
Level 1 – quoted prices (unadjusted) in active markets for identical financial instruments that the fund can access at the reporting date
32
T. Rowe Price Media & Telecommunications Fund
Level 2 – inputs other than Level 1 quoted prices that are observable, either directly or indirectly (including, but not limited to, quoted prices for similar financial instruments in active markets, quoted prices for identical or similar financial instruments in inactive markets, interest rates and yield curves, implied volatilities, and credit spreads)
Level 3 – unobservable inputs
Observable inputs are developed using market data, such as publicly available information about actual events or transactions, and reflect the assumptions that market participants would use to price the financial instrument. Unobservable inputs are those for which market data are not available and are developed using the best information available about the assumptions that market participants would use to price the financial instrument. GAAP requires valuation techniques to maximize the use of relevant observable inputs and minimize the use of unobservable inputs. When multiple inputs are used to derive fair value, the financial instrument is assigned to the level within the fair value hierarchy based on the lowest-level input that is significant to the fair value of the financial instrument. Input levels are not necessarily an indication of the risk or liquidity associated with financial instruments at that level but rather the degree of judgment used in determining those values.
Valuation Techniques Equity securities listed or regularly traded on a securities exchange or in the over-the-counter (OTC) market are valued at the last quoted sale price or, for certain markets, the official closing price at the time the valuations are made. OTC Bulletin Board securities are valued at the mean of the closing bid and asked prices. A security that is listed or traded on more than one exchange is valued at the quotation on the exchange determined to be the primary market for such security. Listed securities not traded on a particular day are valued at the mean of the closing bid and asked prices for domestic securities and the last quoted sale or closing price for international securities.
For valuation purposes, the last quoted prices of non-U.S. equity securities may be adjusted to reflect the fair value of such securities at the close of the NYSE. If the fund determines that developments between the close of a foreign market and the close of the NYSE will affect the value of some or all of its portfolio securities, the fund will adjust the previous quoted prices to reflect what it believes to be the fair value of the securities as of the close of the NYSE. In deciding whether it is necessary to adjust quoted prices to reflect fair value, the fund reviews a variety of factors, including developments in foreign markets, the performance of U.S. securities markets, and the performance of instruments trading in U.S. markets that represent foreign securities and baskets of foreign

33
T. Rowe Price Media & Telecommunications Fund
securities. The fund may also fair value securities in other situations, such as when a particular foreign market is closed but the fund is open. The fund uses outside pricing services to provide it with quoted prices and information to evaluate or adjust those prices. The fund cannot predict how often it will use quoted prices and how often it will determine it necessary to adjust those prices to reflect fair value. As a means of evaluating its security valuation process, the fund routinely compares quoted prices, the next day’s opening prices in the same markets, and adjusted prices.
Actively traded equity securities listed on a domestic exchange generally are categorized in Level 1 of the fair value hierarchy. Non-U.S. equity securities generally are categorized in Level 2 of the fair value hierarchy despite the availability of quoted prices because, as described above, the fund evaluates and determines whether those quoted prices reflect fair value at the close of the NYSE or require adjustment. OTC Bulletin Board securities, certain preferred securities, and equity securities traded in inactive markets generally are categorized in Level 2 of the fair value hierarchy.
Investments in mutual funds are valued at the mutual fund’s closing NAV per share on the day of valuation and are categorized in Level 1 of the fair value hierarchy. Assets and liabilities other than financial instruments, including short-term receivables and payables, are carried at cost, or estimated realizable value, if less, which approximates fair value.
Thinly traded financial instruments and those for which the above valuation procedures are inappropriate or are deemed not to reflect fair value are stated at fair value as determined in good faith by the Valuation Committee. The objective of any fair value pricing determination is to arrive at a price that could reasonably be expected from a current sale. Financial instruments fair valued by the Valuation Committee are primarily private placements, restricted securities, warrants, rights, and other securities that are not publicly traded.
Subject to oversight by the Board, the Valuation Committee regularly makes good faith judgments to establish and adjust the fair valuations of certain securities as events occur and circumstances warrant. For instance, in determining the fair value of an equity investment with limited market activity, such as a private placement or a thinly traded public company stock, the Valuation Committee considers a variety of factors, which may include, but are not limited to, the issuer’s business prospects, its financial standing and performance, recent investment transactions in the issuer, new rounds of financing, negotiated transactions of significant size between other investors in the company, relevant market valuations of peer companies, strategic events

34
T. Rowe Price Media & Telecommunications Fund
affecting the company, market liquidity for the issuer, and general economic conditions and events. In consultation with the investment and pricing teams, the Valuation Committee will determine an appropriate valuation technique based on available information, which may include both observable and unobservable inputs. The Valuation Committee typically will afford greatest weight to actual prices in arm’s length transactions, to the extent they represent orderly transactions between market participants, transaction information can be reliably obtained, and prices are deemed representative of fair value. However, the Valuation Committee may also consider other valuation methods such as market-based valuation multiples; a discount or premium from market value of a similar, freely traded security of the same issuer; or some combination. Fair value determinations are reviewed on a regular basis and updated as information becomes available, including actual purchase and sale transactions of the issue. Because any fair value determination involves a significant amount of judgment, there is a degree of subjectivity inherent in such pricing decisions, and fair value prices determined by the Valuation Committee could differ from those of other market participants. Depending on the relative significance of unobservable inputs, including the valuation technique(s) used, fair valued securities may be categorized in Level 2 or 3 of the fair value hierarchy.
Valuation Inputs The following table summarizes the fund’s financial instruments, based on the inputs used to determine their fair values on December 31, 2017:
($000s) Level 1 Level 2 Level 3 Total Value
Quoted Prices
Significant Observable
Inputs
Significant Unobservable
Inputs
InvestmentsinSecurities,except: $ 119,366 $ — $ — $ 119,366
CommonStocks 4,331,089 427,341 5,300 4,763,730
PreferredStocks — — 4,092 4,092
ConvertiblePreferredStocks — — 68,582 68,582
Total $ 4,450,455 $ 427,341 $ 77,974 $ 4,955,770
There were no material transfers between Levels 1 and 2 during the year ended December 31, 2017.

35
T. Rowe Price Media & Telecommunications Fund
Following is a reconciliation of the fund’s Level 3 holdings for the year ended December 31, 2017. Gain (loss) reflects both realized and change in unrealized gain/loss on Level 3 holdings during the period, if any, and is included on the accompanying Statement of Operations. The change in unrealized gain/loss on Level 3 instruments held at December 31, 2017, totaled $4,733,000 for the year ended December 31, 2017. Transfers into and out of Level 3 are reflected at the value of the financial instrument at the beginning of the period. During the year, transfers out of Level 3 were because observable market data became available for the security.
($000s) BeginningBalance1/1/17
Gain (Loss)duringPeriod
TotalPurchases
TotalSales
TransfersOut of
Level 3
EndingBalance
12/31/17
InvestmentsinSecurities
CommonStocks $ 4,085 $ 1,257 $ — $ — $ (42) $ 5,300
PreferredStocks 3,847 1,025 — (780) — 4,092
ConvertiblePreferredStocks 77,949 2,425 11,025 — (22,817) 68,582
TotalLevel3 $ 85,881 $ 4,707 $ 11,025 $ (780) $ (22,859) $ 77,974
NOTE 3 - OTHER INVESTMENT TRANSACTIONS
Consistent with its investment objective, the fund engages in the following practices to manage exposure to certain risks and/or to enhance performance. The investment objective, policies, program, and risk factors of the fund are described more fully in the fund’s prospectus and Statement of Additional Information.
Emerging Markets The fund may invest, either directly or through investments in T. Rowe Price institutional funds, in securities of companies located in, issued by governments of, or denominated in or linked to the currencies of emerging market countries; at period-end, approximately 15% of the fund’s net assets were invested in emerging markets. Emerging markets generally have economic structures that are less diverse and mature, and political systems that are less stable, than developed countries. These markets may be subject
36
T. Rowe Price Media & Telecommunications Fund
to greater political, economic, and social uncertainty and differing regulatory environments that may potentially impact the fund’s ability to buy or sell certain securities or repatriate proceeds to U.S. dollars. Such securities are often subject to greater price volatility, less liquidity, and higher rates of inflation than U.S. securities.
Restricted Securities The fund may invest in securities that are subject to legal or contractual restrictions on resale. Prompt sale of such securities at an acceptable price may be difficult and may involve substantial delays and additional costs.
Securities Lending The fund may lend its securities to approved borrowers to earn additional income. Its securities lending activities are administered by a lending agent in accordance with a securities lending agreement. Security loans generally do not have stated maturity dates, and the fund may recall a security at any time. The fund receives collateral in the form of cash or U.S. government securities, valued at 102% to 105% of the value of the securities on loan. Collateral is maintained over the life of the loan in an amount not less than the value of loaned securities; any additional collateral required due to changes in security values is delivered to the fund the next business day. Cash collateral is invested in accordance with investment guidelines approved by fund management. Additionally, the lending agent indemnifies the fund against losses resulting from borrower default. Although risk is mitigated by the collateral and indemnification, the fund could experience a delay in recovering its securities and a possible loss of income or value if the borrower fails to return the securities, collateral investments decline in value, and the lending agent fails to perform. Securities lending revenue consists of earnings on invested collateral and borrowing fees, net of any rebates to the borrower, compensation to the lending agent, and other administrative costs. In accordance with GAAP, investments made with cash collateral are reflected in the accompanying financial statements, but collateral received in the form of securities is not. At December 31, 2017, the value of loaned securities was $156,578,000 the value of cash collateral and related investments was $160,778,000.
Other Purchases and sales of portfolio securities other than short-term securities aggregated $352,416,000 and $320,046,000, respectively, for the year ended December 31, 2017.

37
T. Rowe Price Media & Telecommunications Fund
NOTE 4 - FEdERAL INCOME TAXES
No provision for federal income taxes is required since the fund intends to continue to qualify as a regulated investment company under Subchapter M of the Internal Revenue Code and distribute to shareholders all of its taxable income and gains. Distributions determined in accordance with federal income tax regulations may differ in amount or character from net investment income and realized gains for financial reporting purposes. Financial reporting records are adjusted for permanent book/tax differences to reflect tax character but are not adjusted for temporary differences.
The fund files U.S. federal, state, and local tax returns as required. The fund’s tax returns are subject to examination by the relevant tax authorities until expiration of the applicable statute of limitations, which is generally three years after the filing of the tax return but which can be extended to six years in certain circumstances. Tax returns for open years have incorporated no uncertain tax positions that require a provision for income taxes.
Reclassifications to paid-in capital relate primarily to a tax practice that treats a portion of the proceeds from each redemption of capital shares as a distribution of taxable net investment income or realized capital gain. For the year ended December 31, 2017, the following reclassifications were recorded to reflect tax character (there was no impact on results of operations or net assets):
Undistributednetrealizedgain $ (6,419)
Paid-incapital 6,419
($000s)
Distributions during the years ended December 31, 2017 and December 31, 2016, were characterized for tax purposes as follows:
($000s)
december 312017 2016
Ordinaryincome $ 4,088 $ 1,500
Long-termcapitalgain 107,888 81,450
Totaldistributions $ 111,976 $ 82,950

38
T. Rowe Price Media & Telecommunications Fund
At December 31, 2017, the tax-basis cost of investments, including derivatives and components of net assets were as follows:
Costofinvestments $ 2,289,986
Unrealizedappreciation $ 2,729,444
Unrealizeddepreciation (63,642)
netunrealizedappreciation(depreciation) 2,665,802
Undistributedordinaryincome 1,379
Undistributedlong-termcapitalgain 14,069
Paid-incapital 2,175,878
netassets $ 4,857,128
($000s)
The difference between book-basis and tax-basis net unrealized appreciation (depreciation) is attributable to the deferral of losses from wash sales and the realization of gains/losses on passive foreign investment companies for tax purposes.
NOTE 5 - RELATEd PARTY TRANSACTIONS
The fund is managed by T. Rowe Price Associates, Inc. (Price Associates), a wholly owned subsidiary of T. Rowe Price Group, Inc. (Price Group). The investment management agreement between the fund and Price Associates provides for an annual investment management fee, which is computed daily and paid monthly. The fee consists of an individual fund fee, equal to 0.35% of the fund’s average daily net assets, and a group fee. The group fee rate is calculated based on the combined net assets of certain mutual funds sponsored by Price Associates (the group) applied to a graduated fee schedule, with rates ranging from 0.48% for the first $1 billion of assets to 0.265% for assets in excess of $650 billion. The fund’s group fee is determined by applying the group fee rate to the fund’s average daily net assets. At December 31, 2017, the effective annual group fee rate was 0.29%.
The I Class is subject to an operating expense limitation (I Class limit) pursuant to which Price Associates is contractually required to pay all operating expenses of the I Class, excluding management fees, interest,

39
T. Rowe Price Media & Telecommunications Fund
expenses related to borrowings, taxes, brokerage, and other non-recurring expenses permitted by the investment management agreement, to the extent such operating expenses, on an annualized basis, exceed 0.05% of average net assets. This agreement will continue until April 30, 2018, and may be renewed, revised, or revoked only with approval of the fund’s Board. The I Class is required to repay Price Associates for expenses previously paid to the extent the class’s net assets grow or expenses decline sufficiently to allow repayment without causing the class’s operating expenses (after the repayment is taken into account) to exceed both: (1) the expense limitation in place at the time such amounts were paid; and (2) the class’s current expense limitation. However, no repayment will be made more than three years after the date of a payment or waiver. For the year ended December 31, 2017, the I Class operated below its expense limitation.
In addition, the fund has entered into service agreements with Price Associates and two wholly owned subsidiaries of Price Associates (collectively, Price). Price Associates provides certain accounting and administrative services to the fund. T. Rowe Price Services, Inc. provides shareholder and administrative services in its capacity as the fund’s transfer and dividend-disbursing agent. T. Rowe Price Retirement Plan Services, Inc. provides subaccounting and recordkeeping services for certain retirement accounts invested in the Investor Class and I Class. For the year ended December 31, 2017, expenses incurred pursuant to these service agreements were $86,000 for Price Associates; $2,182,000 for T. Rowe Price Services, Inc.; and $717,000 for T. Rowe Price Retirement Plan Services, Inc. The total amount payable at period-end pursuant to these service agreements is reflected as Due to Affiliates in the accompanying financial statements.
The fund may invest its cash reserves in certain open-end management investment companies managed by Price Associates and considered affiliates of the fund: the T. Rowe Price Government Reserve Fund or the T. Rowe Price Treasury Reserve Fund, organized as money market funds, or the T. Rowe Price Short-Term Fund, a short-term bond fund (collectively, the Price Reserve Funds). The Price Reserve Funds are offered as short-term investment options to mutual funds, trusts, and other accounts managed by Price Associates or its affiliates and are not available for direct purchase by members of the public. Cash collateral from securities lending is invested in the T. Rowe Price Short-Term Fund. The Price Reserve Funds pay no investment management fees.

40
T. Rowe Price Media & Telecommunications Fund
The fund may participate in securities purchase and sale transactions with other funds or accounts advised by Price Associates (cross trades), in accordance with procedures adopted by the fund’s Board and Securities and Exchange Commission rules, which require, among other things, that such purchase and sale cross trades be effected at the independent current market price of the security. During the year ended December 31, 2017, the fund had no purchases or sales cross trades with other funds or accounts advised by Price Associates.
NOTE 6 - SUBSEQUENT EVENT
Effective May 1, 2018, the fund’s name will change to the T. Rowe Price Communications & Technology Fund and the fund will adopt a new policy of investing at least 80% of its net assets in securities of communications and technology companies, a change from investing at least 80% of its net assets in securities of media and telecommunications under the current fund name. The objective of the fund will not change.
41
T. Rowe Price Media & Telecommunications Fund
Report of Independent Registered Public Accounting Firm
To the Board of directors and Shareholders of T. Rowe Price Media & Telecommunications Fund, Inc.
Opinion on the Financial Statements
We have audited the accompanying statement of assets and liabilities, including the portfolio of investments, of T. Rowe Price Media & Telecommunications Fund, Inc. (the “Fund”) as of December 31, 2017, the related statement of operations for the year ended December 31, 2017, the statement of changes in net assets for each of the two years in the period ended December 31, 2017, including the related notes, and the financial highlights for each of the periods indicated therein (collectively referred to as the “financial statements”). In our opinion, the financial statements present fairly, in all material respects, the financial position of the Fund as of December 31, 2017, the results of its operations for the year then ended, the changes in its net assets for each of the two years in the period ended December 31, 2017 and the financial highlights for each of the periods indicated therein, in conformity with accounting principles generally accepted in the United States of America.
Basis for Opinion
These financial statements are the responsibility of the Fund’s management. Our responsibility is to express an opinion on the Fund’s financial statements based on our audits. We are a public accounting firm registered with the Public Company Accounting Oversight Board (United States) (“PCAOB”) and are required to be independent with respect to the Fund in accordance with the U.S. federal securities laws and the applicable rules and regulations of the Securities and Exchange Commission and the PCAOB.
We conducted our audits of these financial statements in accordance with the standards of the PCAOB. Those standards require that we plan and perform the audit to obtain reasonable assurance about whether the financial statements are free of material misstatement, whether due to error or fraud.

42
T. Rowe Price Media & Telecommunications Fund
Report of Independent Registered Public Accounting FirmReport of Independent Registered Public Accounting Firm (continued)
Our audits included performing procedures to assess the risks of material misstatement of the financial statements, whether due to error or fraud, and performing procedures that respond to those risks. Such procedures included examining, on a test basis, evidence regarding the amounts and disclosures in the financial statements. Our audits also included evaluating the accounting principles used and significant estimates made by management, as well as evaluating the overall presentation of the financial statements. Our procedures included confirmation of securities owned as of December 31, 2017 by correspondence with the custodians and transfer agent. We believe that our audits provide a reasonable basis for our opinion.
PricewaterhouseCoopers LLPBaltimore, MarylandFebruary 15, 2018
We have served as the auditor of one or more investment companies in the T. Rowe Price group of investment companies since 1973.

43
T. Rowe Price Media & Telecommunications Fund
Tax Information (Unaudited) for the Tax Year Ended 12/31/17
WeareprovidingthisinformationasrequiredbytheInternalRevenueCode.Theamountsshownmaydifferfromthoseelsewhereinthisreportbecauseofdifferencesbetweentaxandfinancialreportingrequirements.
Thefund’sdistributionstoshareholdersincluded:
• $3,732,000fromshort-termcapitalgains.
• $114,023,000fromlong-termcapitalgains,subjecttoalong-termcapitalgainstaxrateofnotgreaterthan20%.
Fortaxablenon-corporateshareholders,$4,436,000ofthefund’sincomerepresentsqualifieddividendincomesubjecttoalong-termcapitalgainstaxrateofnotgreaterthan20%.
Forcorporateshareholders,$4,436,000ofthefund’sincomequalifiesforthedividends-receiveddeduction.
AdescriptionofthepoliciesandproceduresusedbyT.RowePricefundsandportfoliostodeterminehowtovoteproxiesrelatingtoportfoliosecuritiesisavailableineachfund’sStatementofAdditionalInformation.youmayrequestthisdocumentbycalling1-800-225-5132orbyaccessingtheSEC’swebsite,sec.gov.
Thedescriptionofourproxyvotingpoliciesandproceduresisalsoavailableonourcorporatewebsite.Toaccessit,pleasevisitthefollowingWebpage:
https://www3.troweprice.com/usis/corporate/en/utility/policies.html
Scrolldowntothesectionnearthebottomofthepagethatsays,“ProxyvotingPolicies.”ClickontheProxyvotingPolicieslinkintheshadedbox.
Eachfund’smostrecentannualproxyvotingrecordisavailableonourwebsiteandthroughtheSEC’swebsite.ToaccessitthroughT.RowePrice,visitthewebsitelocationshownabove,andscrolldowntothesectionnearthebottomofthepagethatsays,“ProxyvotingRecords.”ClickontheProxyvotingRecordslinkintheshadedbox.
Information on Proxy Voting Policies, Procedures, and Records
ThefundfilesacompletescheduleofportfolioholdingswiththeSecuritiesandExchangeCommissionforthefirstandthirdquartersofeachfiscalyearonFormn-Q.Thefund’sFormn-QisavailableelectronicallyontheSEC’swebsite(sec.gov);hardcopiesmaybereviewedandcopiedattheSEC’sPublicReferenceRoom,100FSt.n.E.,Washington,DC20549.FormoreinformationonthePublicReferenceRoom,call1-800-SEC-0330.
How to Obtain Quarterly Portfolio Holdings

44
T. Rowe Price Media & Telecommunications Fund
yourfundisoverseenbyaboardofDirectors(board)thatmeetsregularlytoreviewawidevarietyofmattersaffectingorpotentiallyaffectingthefund,includingperformance,investmentprograms,compliancematters,advisoryfeesandexpenses,serviceproviders,andbusinessandregulatoryaffairs.Theboardelectsthefund’sofficers,whoarelistedinthefinaltable.Atleast75%oftheboard’smembersareindependentofT.RowePriceAssociates,Inc.(T.RowePrice),anditsaffiliates;“inside”or“interested”directorsareemployeesorofficersofT.RowePrice.Thebusinessaddressofeachdirectorandofficeris100EastPrattStreet,baltimore,Maryland21202.TheStatementofAdditionalInformationincludesadditionalinformationaboutthefunddirectorsandisavailablewithoutchargebycallingaT.RowePricerepresentativeat1-800-638-5660.
Independent directors
Name(Year of Birth)Year Elected*[Number of T. Rowe PricePortfolios Overseen]
Principal Occupation(s) and directorships of Public Companies and Other Investment Companies during the Past Five Years
bruceW.Duncan(1951)2013[191]
ChiefExecutiveOfficerandDirector(2009toDecember2016),Chairmanoftheboard(January2016topresent),andPresident(2009toSeptember2016),FirstIndustrialRealtyTrust,anownerandoperatorofindustrialproperties;Chairmanoftheboard(2005toSeptember2016)andDirector(1999toSeptember2016),Starwoodhotels&Resorts,ahotelandleisurecompany;Director,bostonProperties(May2016topresent);Director,MarriottInternational,Inc.(September2016topresent)
RobertJ.gerrard,Jr.(1952)2012[191]
AdvisoryboardMember,PipelineCrisis/WinningStrategies,acollaborativeworkingtoimproveopportunitiesforyoungAfricanAmericans(1997topresent)
PaulF.Mcbride(1956)2013[191]
AdvisoryboardMember,vizziaTechnologies(2015topresent)
*Eachindependentdirectorservesuntilretirement,resignation,orelectionofasuccessor.
About the Fund’s Directors and Officers

45
T. Rowe Price Media & Telecommunications Fund
Independent directors (continued)
Name(Year of Birth)Year Elected*[Number of T. Rowe PricePortfolios Overseen]
Principal Occupation(s) and directorships of Public Companies and Other Investment Companies during the Past Five Years
CeciliaE.Rouse,Ph.D.(1963)2012[191]
Dean,WoodrowWilsonSchool(2012topresent);ProfessorandResearcher,PrincetonUniversity(1992topresent);MemberofnationalAcademyofEducation(2010topresent);Director,MDRC,anonprofiteducationandsocialpolicyresearchorganization(2011topresent);ResearchAssociateofLaborStudiesProgram(2011to2015)andboardMember(2015topresent),nationalbureauofEconomicResearch(2011topresent);ChairofCommitteeontheStatusofMinoritygroupsintheEconomicProfession(2012topresent);vicePresident(2015topresent),AmericanEconomicAssociation
Johng.Schreiber(1946)2001[191]
Owner/President,CentaurCapitalPartners,Inc.,arealestateinvestmentcompany(1991topresent);Cofounder,Partner,andCochairmanoftheInvestmentCommittee,blackstoneRealEstateAdvisors,L.P.(1992to2015);Director,generalgrowthProperties,Inc.(2010to2013);Director,blackstoneMortgageTrust,arealestatefinancecompany(2012to2016);DirectorandChairmanoftheboard,brixmorPropertygroup,Inc.(2013topresent);Director,hiltonWorldwide(2013topresent);Director,hudsonPacificProperties(2014to2016)
MarkR.Tercek(1957)2009[191]
PresidentandChiefExecutiveOfficer,ThenatureConservancy(2008topresent)
*Eachindependentdirectorservesuntilretirement,resignation,orelectionofasuccessor.

46
T. Rowe Price Media & Telecommunications Fund
Inside directors
Name(Year of Birth)Year Elected*[Number of T. Rowe Price Portfolios Overseen]
Principal Occupation(s) and directorships of Public Companies and Other Investment Companies during the Past Five Years
EdwardC.bernard(1956)2006[191]
DirectorandvicePresident,T.RowePrice;viceChairmanoftheboard,Director,andvicePresident,T.RowePricegroup,Inc.;Chairmanoftheboard,Director,andvicePresident,T.RowePriceInvestmentServices,Inc.,andT.RowePriceServices,Inc.;ChairmanoftheboardandDirector,T.RowePriceRetirementPlanServices,Inc.;Chairmanoftheboard,ChiefExecutiveOfficer,Director,andPresident,T.RowePriceInternationalandT.RowePriceTrustCompany;Chairmanoftheboard,allfunds
RobertW.Sharps,CFA,CPA**(1971)2017[135]
vicePresident,T.RowePrice,T.RowePricegroup,Inc.,andT.RowePriceTrustCompany
*Eachinsidedirectorservesuntilretirement,resignation,orelectionofasuccessor.**EffectiveApril1,2017,brianC.RogerswasreplacedbyRobertW.Sharpsasaninsidedirectorof
certainPriceFunds.
Officers
Name (Year of Birth)Position Held With Media & Telecommunications Fund Principal Occupation(s)
Darrelln.braman(1963)vicePresidentandSecretary
vicePresident,PricehongKong,PriceSingapore,T.RowePrice,T.RowePricegroup,Inc.,T.RowePriceInternational,T.RowePriceInvestmentServices,Inc.,andT.RowePriceServices,Inc.
Pauly.Cho(1986)vicePresident
vicePresident,T.RowePriceandT.RowePricegroup,Inc.;formerly,student,TheWhartonSchool,UniversityofPennsylvania(to2015);InvestmentAnalyst,MaverickCapital(to2013)
gregoryDunham,CFA(1974)vicePresident
vicePresident,T.RowePriceandT.RowePricegroup,Inc.;formerly,Analyst,goldmanSachs(to2015)
Unlessotherwisenoted,officershavebeenemployeesofT.RowePriceorT.RowePriceInternationalforatleast5years.
47
T. Rowe Price Media & Telecommunications Fund
Officers (continued)
Name (Year of Birth)Position Held With Media & Telecommunications Fund Principal Occupation(s)
DavidJ.Eiswert,CFA(1972)vicePresident
vicePresident,T.RowePrice,T.RowePricegroup,Inc.,andT.RowePriceInternational
henryM.Ellenbogen(1973)vicePresident
vicePresident,T.RowePrice,T.RowePricegroup,Inc.,andT.RowePriceTrustCompany
Josephb.Fath,CPA(1971)vicePresident
vicePresident,T.RowePrice,T.RowePricegroup,Inc.,andT.RowePriceTrustCompany
JohnR.gilner(1961)ChiefComplianceOfficer
ChiefComplianceOfficerandvicePresident,T.RowePrice;vicePresident,T.RowePricegroup,Inc.,andT.RowePriceInvestmentServices,Inc.
PaulD.greeneII(1978)President
vicePresident,T.RowePriceandT.RowePricegroup,Inc.
PaulJ.Krug,CPA(1964)vicePresident
vicePresident,T.RowePrice,T.RowePricegroup,Inc.,andT.RowePriceTrustCompany
JacquelineL.Liu(1979)vicePresident
vicePresident,PricehongKongandT.RowePricegroup,Inc.;formerly,InvestmentAnalyst,FidelityInternationalhongKongLimited(to2014)
DanielMartino,CFA(1974)vicePresident
vicePresident,T.RowePriceandT.RowePricegroup,Inc.
CatherineD.Mathews(1963)TreasurerandvicePresident
vicePresident,T.RowePrice,T.RowePricegroup,Inc.,andT.RowePriceTrustCompany
PhilipA.nestico(1976)vicePresident
vicePresident,T.RowePriceandT.RowePricegroup,Inc.
DavidOestreicher(1967)vicePresident
Director,vicePresident,andSecretary,T.RowePriceInvestmentServices,Inc.,T.RowePriceRetirementPlanServices,Inc.,T.RowePriceServices,Inc.,andT.RowePriceTrustCompany;ChiefLegalOfficer,vicePresident,andSecretary,T.RowePricegroup,Inc.;vicePresidentandSecretary,T.RowePriceandT.RowePriceInternational;vicePresident,PricehongKongandPriceSingapore
Unlessotherwisenoted,officershavebeenemployeesofT.RowePriceorT.RowePriceInternationalforatleast5years.

48
T. Rowe Price Media & Telecommunications Fund
Officers (continued)
Name (Year of Birth)Position Held With Media & Telecommunications Fund Principal Occupation(s)
JohnW.Ratzesberger(1975)vicePresident
vicePresident,T.RowePrice,T.RowePricegroup,Inc.,andT.RowePriceTrustCompany;formerly,northAmericanheadofListedDerivativesOperation,MorganStanley(to2013)
Shannonh.Rauser(1987)AssistantSecretary
Employee,T.RowePrice
CoreyD.Shull,CFA(1983)vicePresident
vicePresident,T.RowePriceandT.RowePricegroup,Inc.
JamesStillwagon(1982)vicePresident
vicePresident,T.RowePrice;formerly,Partner,CatRockCapital(to2016);ManagingDirector,LonePineCapital(to2015);ManagingDirector,Media&Telecommunicationsgroup,MaverickCapital(to2013)
verenaE.Wachnitz,CFA(1978)vicePresident
vicePresident,T.RowePricegroup,Inc.,andT.RowePriceInternational
MeganWarren(1968)vicePresident
vicePresident,T.RowePrice,T.RowePricegroup,Inc.,T.RowePriceRetirementPlanServices,Inc.,T.RowePriceServices,Inc.,andT.RowePriceTrustCompany;formerly,ExecutiveDirector,JPMorganChase(to2017)
JustinP.White(1981)vicePresident
vicePresident,T.RowePriceandT.RowePricegroup,Inc.
ChristopherS.Whitehouse(1972)vicePresident
vicePresident,T.RowePricegroup,Inc.,andT.RowePriceInternational
ErnestC.yeung,CFA(1979)vicePresident
Director,ResponsibleOfficer,andvicePresident,PricehongKong;vicePresident,T.RowePricegroup,Inc.
WenliZheng(1979)vicePresident
vicePresident,PricehongKongandT.RowePricegroup,Inc.
Unlessotherwisenoted,officershavebeenemployeesofT.RowePriceorT.RowePriceInternationalforatleast5years.

This page intentionally left blank.

This page intentionally left blank.

This page intentionally left blank.

This page intentionally left blank.

This page intentionally left blank.

F121-050 2/18
STOCK FUNdSdomestic Blue Chip GrowthCapital Appreciation‡
Capital OpportunityDiversified Mid-Cap GrowthDividend GrowthEquity IncomeEquity Index 500Extended Equity Market IndexFinancial ServicesGrowth & IncomeGrowth StockHealth Sciences‡
Media & TelecommunicationsMid-Cap Growth‡
Mid-Cap Value‡
New America GrowthNew EraNew Horizons‡
QM U.S. Small & Mid-Cap Core EquityQM U.S. Small-Cap Growth EquityQM U.S. Value EquityReal EstateScience & TechnologySmall-Cap Stock‡
Small-Cap ValueTax-Efficient Equity Total Equity Market IndexU.S. Large-Cap CoreValue
ASSET ALLOCATION FUNdSBalanced Global AllocationPersonal Strategy BalancedPersonal Strategy GrowthPersonal Strategy IncomeReal AssetsSpectrum GrowthSpectrum IncomeSpectrum InternationalTarget Date Fundsˆ
BONd FUNdSdomestic TaxableCorporate IncomeCredit OpportunitiesFloating RateGNMA High Yield‡
Inflation Protected BondLimited Duration Inflation
Focused BondNew IncomeShort-Term BondTotal ReturnUltra Short-Term BondU.S. Bond Enhanced IndexU.S. High YieldU.S. Treasury IntermediateU.S. Treasury Long-Term
domestic Tax-FreeCalifornia Tax-Free BondGeorgia Tax-Free BondIntermediate Tax-Free High YieldMaryland Short-Term Tax-Free BondMaryland Tax-Free BondNew Jersey Tax-Free BondNew York Tax-Free BondSummit Municipal IncomeSummit Municipal IntermediateTax-Free High YieldTax-Free IncomeTax-Free Short-IntermediateVirginia Tax-Free Bond
MONEY MARKET FUNdSTaxableCash Reserves1
Government Money2
U.S. Treasury Money2
MONEY MARKET FUNdS (cont.)Tax-FreeCalifornia Tax-Free Money1
Maryland Tax-Free Money1
New York Tax-Free Money1
Summit Municipal Money Market1
Tax-Exempt Money1
INTERNATIONAL/GLOBAL FUNdSStockAfrica & Middle EastAsia OpportunitiesEmerging EuropeEmerging Markets StockEmerging Markets Value StockEuropean Stock Global ConsumerGlobal Growth StockGlobal IndustrialsGlobal Real EstateGlobal StockGlobal Technology‡
International Concentrated EquityInternational DiscoveryInternational Equity IndexInternational StockInternational Value EquityJapanLatin AmericaNew AsiaOverseas StockQM Global Equity
BondDynamic Global BondEmerging Markets BondEmerging Markets Corporate BondEmerging Markets Local Currency BondGlobal High Income BondGlobal Multi-Sector BondInternational BondInternational Bond (USD Hedged)
T.RowePriceInvestmentServices,Inc.100EastPrattStreetbaltimore,MD21202
Thispagecontainssupplementaryinformationthatisnotpartoftheshareholderreport.
T. Rowe Price Mutual Funds
201802-365997
Call 1-800-225-5132 to request a prospectus or summary prospectus; each includes investment objectives, risks, fees, expenses, and other information that you should read and consider carefully before investing. ‡Subjecttocertainexceptions,thefundiscurrentlyclosedtonewinvestorsandnewaccounts.
ˆTheTargetDateFundsareinclusiveoftheRetirementFunds,theTargetFunds,andtheRetirementbalancedFund.
1 Retail Funds: You could lose money by investing in the Fund. Although the Fund seeks to preserve the value of your investment at $1.00 per share, it cannot guarantee it will do so. Beginning October 14, 2016, the Fund may impose a fee upon the sale of your shares or may temporarily suspend your ability to sell shares if the Fund’s liquidity falls below required minimums because of market conditions or other factors. An investment in the Fund is not insured or guaranteed by the Federal Deposit Insurance Corporation or any other government agency. The Fund’s sponsor has no legal obligation to provide financial support to the Fund, and you should not expect that the sponsor will provide financial support to the Fund at any time.
2 Government Funds: You could lose money by investing in the Fund. Although the Fund seeks to preserve the value of your investment at $1.00 per share, it cannot guarantee it will do so. An investment in the Fund is not insured or guaranteed by the Federal Deposit Insurance Corporation or any other government agency. The Fund’s sponsor has no legal obligation to provide financial support to the Fund, and you should not expect that the sponsor will provide financial support to the Fund at any time.