december 31, 2015 - tmx tsx | tsxv · december 31, 2015 indices december 31 close previous close...
TRANSCRIPT

For more information, email [email protected] Visit our blog at <http://exchange.tmx.com/>
December 31, 2015
Indices December 31 Close Previous Close Change % Change
S&P/TSX Composite Index 13,009.95 13,142.29 -132.33 -1.01 %
S&P/TSX 60 Index 764.54 773.50 -8.96 -1.16 %
S&P/TSX Venture Composite Index 525.66 520.86 4.79 0.92 %
S&P/TSX Completion Index 826.43 830.72 -4.29 -0.52 %
S&P/TSX Smallcap Index 487.34 487.33 0.01 0.00 %
Unchanged Decliners Advancers S&P/TSX Composite Index
84 153 3
Return Constituent
Top 10 Advancers
BTE 8.74%POU 5.88%PGF 5.15%ECA 4.77%BIR 4.12%MEG 3.75%CEU 3.47%SGY 3.43%TOG 3.41%PD 3.40%
S&P/TSX Composite Index S&P/TSX Composite Index
Return Constituent
Top 10 Decliners
CMG -5.67%AIM -3.59%SAP -3.16%BNS -3.00%MRU -2.98%RBA -2.74%SPB -2.71%MDA -2.71%CJR.B -2.61%BCB -2.50%
Index Contribution Constituent
Top 10 Index Detractors
RY -17.01BNS -16.55TD -11.35MFC -6.74CNR -6.43BCE -5.84BAM.A -4.60BMO -4.39SLF -3.94CM -3.82
Index Contribution Constituent
Top 10 Index Contributors
ENB 2.88ECA 2.15CCO 0.66PPL 0.65BPY.UN 0.63WCP 0.62BBD.B 0.61CPG 0.60BTE 0.60CVE 0.60
S&P/TSX Composite Index
Sector # of Index Weight Market Cap Index
Constituents ($B) Contribution
S&P/TSX Composite Index - Sectors Returns
Energy 55 18.16 $301.87 14.16%
Utilities 12 2.30 $37.67 -2.74%
Health Care 5 3.17 $51.87 -3.78%
Information Technology
13 3.22 $52.52 -6.07%
Materials 46 9.46 $155.33 -8.52%
Industrials 23 8.26 $135.32 -9.28%
Consumer Discretionary
26 6.92 $113.04 -10.93%
Telecommunication Services
4 5.45 $88.61 -11.26%
Consumer Staples 10 4.54 $73.49 -11.58%
Financials 46 38.52 $626.14 -82.34%
240 100.00 $1,635.86 -132.33S&P/TSX Composite Index
%
Energy
Utilities
Health Care
Info Tech
Materials
Industrials
Cons Disc
Telecomm
Cons Staples
Financials
-0.7% -0.6% -0.5% -0.4% -0.3% -0.2% -0.1% 0.0% 0.1% 0.2%
This report is published by TSX Inc. TSX Inc. does not guarantee either the completeness or the accuracy of this information. The information contained in this report is provided for informational purposes only and you agree not to rely upon the information contained in this report for any trading, business or financial purpose. These sheets are printed in Canada and issued by TSX Inc. under the express condition, to which everyone receiving or making use thereof assents, that no liability shall be incurred by TSX Inc. or its affiliated companies or any other vendor or donor, including, without limitation, for reliance on or for any errors or inaccuracies in this report. Neither TMX Group Limited, TSX Inc., nor any of their affiliated companies, guarantees the completeness of the information contained in this document and are not responsible for any errors or omission in or your use of, or reliance on, the information. This publication is under copyright. © 2015 TSX Inc. All rights reserved. Do not copy, distribute, sell or modify this publication without the prior written consent of TSX Inc. www.tmx.com/trading
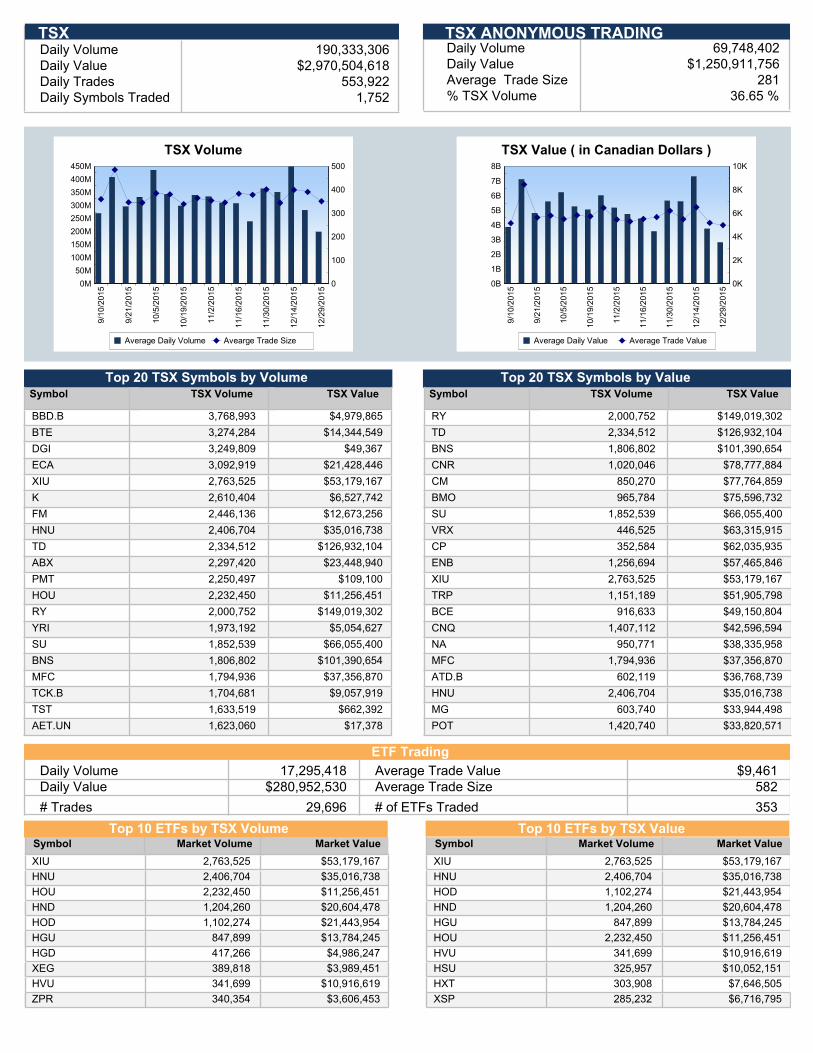
190,333,306$2,970,504,618
553,922
Daily VolumeDaily ValueDaily TradesDaily Symbols Traded 1,752
Daily VolumeDaily ValueAverage Trade Size% TSX Volume
69,748,402 $1,250,911,756
281 36.65 %
TSX TSX ANONYMOUS TRADING
0B
1B
2B
3B
4B
5B
6B
7B
8B
0K
2K
4K
6K
8K
10K
9/1
0/2
015
9/2
1/2
015
10/5
/2015
10/1
9/2
015
11/2
/2015
11/1
6/2
015
11/3
0/2
015
12/1
4/2
015
12/2
9/2
015
Average Daily Value Average Trade Value
TSX Value ( in Canadian Dollars )
0M
50M
100M
150M
200M
250M
300M
350M
400M
450M
0
100
200
300
400
500
9/1
0/2
015
9/2
1/2
015
10/5
/2015
10/1
9/2
015
11/2
/2015
11/1
6/2
015
11/3
0/2
015
12/1
4/2
015
12/2
9/2
015
Average Daily Volume Avearge Trade Size
TSX Volume
Top 20 TSX Symbols by Volume Top 20 TSX Symbols by Value Symbol TSX Volume TSX Value
BBD.B 3,768,993 $4,979,865
BTE 3,274,284 $14,344,549
DGI 3,249,809 $49,367
ECA 3,092,919 $21,428,446
XIU 2,763,525 $53,179,167
K 2,610,404 $6,527,742
FM 2,446,136 $12,673,256
HNU 2,406,704 $35,016,738
TD 2,334,512 $126,932,104
ABX 2,297,420 $23,448,940
PMT 2,250,497 $109,100
HOU 2,232,450 $11,256,451
RY 2,000,752 $149,019,302
YRI 1,973,192 $5,054,627
SU 1,852,539 $66,055,400
BNS 1,806,802 $101,390,654
MFC 1,794,936 $37,356,870
TCK.B 1,704,681 $9,057,919
TST 1,633,519 $662,392
AET.UN 1,623,060 $17,378
Symbol TSX Volume TSX Value
RY 2,000,752 $149,019,302
TD 2,334,512 $126,932,104
BNS 1,806,802 $101,390,654
CNR 1,020,046 $78,777,884
CM 850,270 $77,764,859
BMO 965,784 $75,596,732
SU 1,852,539 $66,055,400
VRX 446,525 $63,315,915
CP 352,584 $62,035,935
ENB 1,256,694 $57,465,846
XIU 2,763,525 $53,179,167
TRP 1,151,189 $51,905,798
BCE 916,633 $49,150,804
CNQ 1,407,112 $42,596,594
NA 950,771 $38,335,958
MFC 1,794,936 $37,356,870
ATD.B 602,119 $36,768,739
HNU 2,406,704 $35,016,738
MG 603,740 $33,944,498
POT 1,420,740 $33,820,571
$280,952,530 17,295,418
29,696
$9,461 582
353
Daily VolumeDaily Value
# Trades
Average Trade ValueAverage Trade Size
# of ETFs Traded
ETF Trading
Symbol Market Volume Market Value
XIU 2,763,525 $53,179,167
HNU 2,406,704 $35,016,738
HOU 2,232,450 $11,256,451
HND 1,204,260 $20,604,478
HOD 1,102,274 $21,443,954
HGU 847,899 $13,784,245
HGD 417,266 $4,986,247
XEG 389,818 $3,989,451
HVU 341,699 $10,916,619
ZPR 340,354 $3,606,453
Top 10 ETFs by TSX Volume Top 10 ETFs by TSX Value Symbol Market Volume Market Value
XIU 2,763,525 $53,179,167
HNU 2,406,704 $35,016,738
HOD 1,102,274 $21,443,954
HND 1,204,260 $20,604,478
HGU 847,899 $13,784,245
HOU 2,232,450 $11,256,451
HVU 341,699 $10,916,619
HSU 325,957 $10,052,151
HXT 303,908 $7,646,505
XSP 285,232 $6,716,795
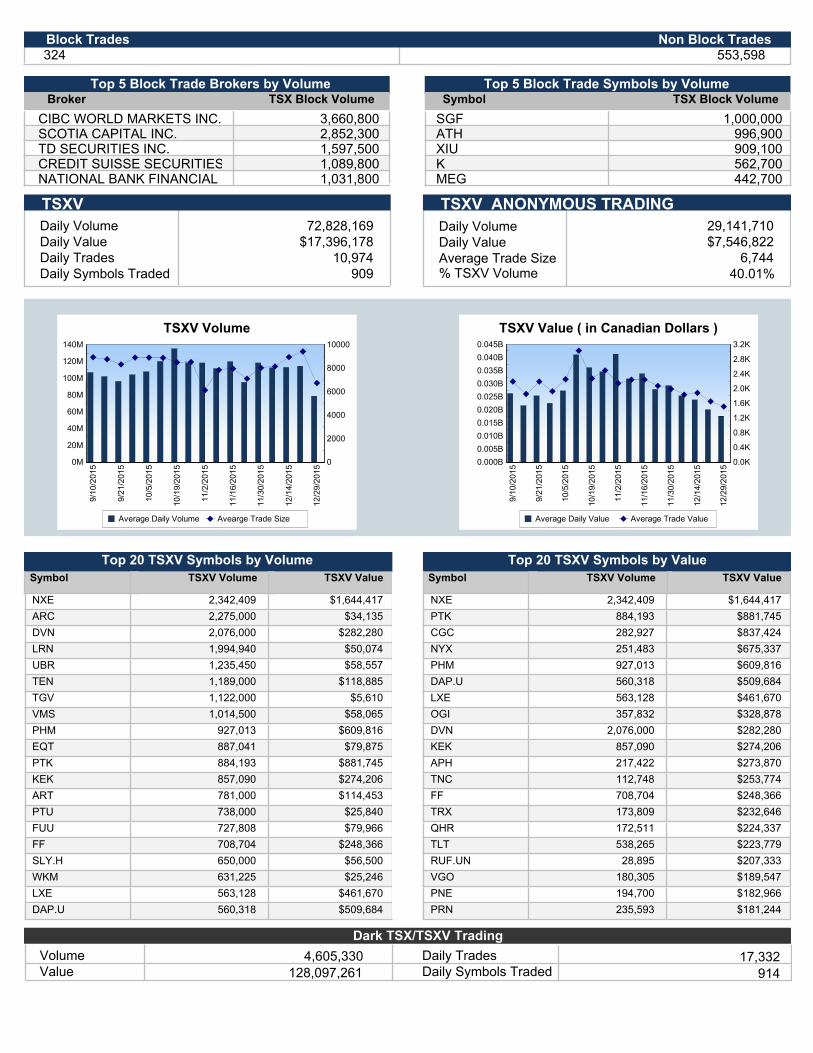
324 553,598 Block Trades Non Block Trades
3,660,800 CIBC WORLD MARKETS INC. 2,852,300 SCOTIA CAPITAL INC. 1,597,500 TD SECURITIES INC. 1,089,800 CREDIT SUISSE SECURITIES (CANADA), INC. 1,031,800 NATIONAL BANK FINANCIAL INC.
Top 5 Block Trade Brokers by Volume Top 5 Block Trade Symbols by Volume
SGF 1,000,000 ATH 996,900 XIU 909,100 K 562,700 MEG 442,700
Broker TSX Block Volume Symbol TSX Block Volume
29,141,710 $7,546,822
6,744 40.01%
Daily VolumeDaily ValueAverage Trade Size% TSXV Volume
72,828,169$17,396,178
10,974
Daily VolumeDaily ValueDaily TradesDaily Symbols Traded 909
TSXV ANONYMOUS TRADING TSXV
0M
20M
40M
60M
80M
100M
120M
140M
0
2000
4000
6000
8000
10000
9/1
0/2
015
9/2
1/2
015
10/5
/2015
10/1
9/2
015
11/2
/2015
11/1
6/2
015
11/3
0/2
015
12/1
4/2
015
12/2
9/2
015
Average Daily Volume Avearge Trade Size
TSXV Volume
0.000B
0.005B
0.010B
0.015B
0.020B
0.025B
0.030B
0.035B
0.040B
0.045B
0.0K
0.4K
0.8K
1.2K
1.6K
2.0K
2.4K
2.8K
3.2K
9/1
0/2
015
9/2
1/2
015
10/5
/2015
10/1
9/2
015
11/2
/2015
11/1
6/2
015
11/3
0/2
015
12/1
4/2
015
12/2
9/2
015
Average Daily Value Average Trade Value
TSXV Value ( in Canadian Dollars )
Top 20 TSXV Symbols by Volume Top 20 TSXV Symbols by Value
Symbol TSXV Volume TSXV Value
NXE 2,342,409 $1,644,417
ARC 2,275,000 $34,135
DVN 2,076,000 $282,280
LRN 1,994,940 $50,074
UBR 1,235,450 $58,557
TEN 1,189,000 $118,885
TGV 1,122,000 $5,610
VMS 1,014,500 $58,065
PHM 927,013 $609,816
EQT 887,041 $79,875
PTK 884,193 $881,745
KEK 857,090 $274,206
ART 781,000 $114,453
PTU 738,000 $25,840
FUU 727,808 $79,966
FF 708,704 $248,366
SLY.H 650,000 $56,500
WKM 631,225 $25,246
LXE 563,128 $461,670
DAP.U 560,318 $509,684
Symbol TSXV Volume TSXV Value
NXE 2,342,409 $1,644,417
PTK 884,193 $881,745
CGC 282,927 $837,424
NYX 251,483 $675,337
PHM 927,013 $609,816
DAP.U 560,318 $509,684
LXE 563,128 $461,670
OGI 357,832 $328,878
DVN 2,076,000 $282,280
KEK 857,090 $274,206
APH 217,422 $273,870
TNC 112,748 $253,774
FF 708,704 $248,366
TRX 173,809 $232,646
QHR 172,511 $224,337
TLT 538,265 $223,779
RUF.UN 28,895 $207,333
VGO 180,305 $189,547
PNE 194,700 $182,966
PRN 235,593 $181,244
Dark TSX/TSXV Trading
VolumeValue Daily Symbols Traded
Daily Trades 17,332 4,605,330 128,097,261 914