december 2017 audit committee meeting - texas documents/board_meeting_audit... · audit committee...
TRANSCRIPT

Audit Committee Meeting
Teacher Retirement System of Texas 1000 Red River Street, Austin, Texas 78701-2698
December 2017

NOTE: The Board of Trustees (Board) of the Teacher Retirement System of Texas will not consider or act upon any item before the Audit Committee (Committee) at this meeting of the Committee. This meeting is not a regular meeting of the Board. However, because the full Audit Committee constitutes a quorum of the Board, the meeting of the Committee is also being posted as a meeting of the Board out of an abundance of caution.
TEACHER RETIREMENT SYSTEM OF TEXAS BOARD OF TRUSTEES
AND AUDIT COMMITTEE
(Mr. Moss, Chairman; Ms. Charleston; Mr.Corpus; Dr. Gibson, Committee Members)
All or part of the December 15, 2017, meeting of the TRS Audit Committee and Board of Trustees may be held by telephone or video conference call as authorized under Sections 551.130 and 551.127 of the Texas Government Code. The Board intends to have a quorum and the presiding officer physically present at the following location, which will be open to the public during the open portions of the meeting: 1000 Red River, Austin, Texas 78701 in the TRS East Building, 5th Floor, Boardroom.
AGENDA
December 15, 2017 – 8:00 a.m. TRS East Building, 5th Floor, Boardroom
1. Call roll of Committee members
2. Approve minutes of September 22, 2017 Audit Committee meeting – Christopher Moss 3. Receive State Auditor’s Office reports – Michael Clayton, Anca Pinchas, Sarah Puerto,
Kathy Ann Moe, and Sharon Schneider, State Auditor’s Office (SAO) A. Audit of Comprehensive Annual Financial Report (CAFR) (for fiscal year ending
August 31, 2017) B. Audit of Incentive Compensation at Selected Agencies (for TRS plan year ending
September 30, 2016) C. Classification compliance audit of information technology positions at selected
education agencies 4. Receive Grant Thornton report for financial audit of TRS Investment Company (TRICOT)
(for fiscal year ending August 31, 2017) – Bhakti Patel, Grant Thornton 5. Receive review reports for TRS health plan and pharmacy plan administration for TRS-Care
and TRS-ActiveCare – Yimei Zhao, Jeff Bain, and Chase Dierschke; Amy Quertermous, John Meka, Keith Gall, and Carol Hamilton, Truven Health Analytics
A. Results overview of TRS-Care and TRS-ActiveCare health plan and pharmacy benefit administration review reports for the most recent audit cycle
B. Review report of TRS-Care health plan administration by Aetna for September 1, 2015 to August 31, 2016
C. Review report of TRS-ActiveCare health plan administration by Aetna for September 1, 2015 to August 31, 2016
D. Review report of TRS-Care pharmacy plan administration by ESI for September 1, 2015 to August 31, 2016
E. Review report of TRS-Care drug benefit administration of the Employer Group Waiver Plan (EGWP) by ESI for January 1, 2015 to December 31, 2015

NOTE: The Board of Trustees (Board) of the Teacher Retirement System of Texas will not consider or act upon any item before the Audit Committee (Committee) at this meeting of the Committee. This meeting is not a regular meeting of the Board. However, because the full Audit Committee constitutes a quorum of the Board, the meeting of the Committee is also being posted as a meeting of the Board out of an abundance of caution.
F. Review report of TRS-ActiveCare pharmacy plan administration by Caremark Rx for September 1, 2015 to August 31, 2016
6. Receive TRS Compliance reports – Heather Traeger 7. Receive Internal Audit reports
A. Quarterly TRS compliance testing (Agreed-Upon Procedures) – Hugh Ohn and Heather Traeger
B. Prior audit and consulting recommendations - Amy Barrett C. Internal Audit Annual Report – Amy Barrett
8. Discuss or consider Internal Audit administrative reports and matters related to governance,
risk management, internal control, compliance violations, fraud, regulatory reviews or investigations, fraud risk areas, audits for the annual internal audit plan, or auditors' ability to perform duties – Christopher Moss and Amy Barrett

TAB 2

1
TEACHER RETIREMENT SYSTEM OF TEXAS AUDIT COMMITTEE MEETING MINUTES
SEPTEMBER 22, 2017 The Audit Committee of the Board of Trustees of the Teacher Retirement System of Texas met on September 22, 2017, in the boardroom located on the fifth floor of the TRS East Building offices at 1000 Red River Street, Austin, Texas.
Committee Members present: Mr. Chris Moss, Chair Ms. Karen Charleston Mr. David Corpus Dr. Greg Gibson Other Board Members present: Mr. Joe Colonnetta Mr. John Elliott Mr. David Kelly Ms. Dolores Ramirez Others present: Brian Guthrie, TRS Toma Miller, TRS Ken Welch, TRS Anandhi Mani, TRS Carolina de Onis, TRS Simin Pang, TRS Amy Barrett, TRS Art Mata, TRS Don Green, TRS Cari Casey, TRS Barbie Pearson, TRS Rodrigo Dominguez, TRS Heather Traeger, TRS Sylvia Bell, TRS Katherine Farrell, TRS Michael Clayton, SAO Hugh Ohn, TRS Anca Pinchas, SAO Jan Engler, TRS Kelly Ngaide, SAO Lih-Jen Lan, TRS Danielle Valkner, PwC Nick Ballard, TRS Audit Committee Chair Mr. Moss called the meeting to order at 8:05 a.m.
1. Call roll of Committee members.
Ms. Farrell called the roll. A quorum was present.
2. Consider the approval of the proposed minutes of the July 13, 2017 committee meeting – Committee Chair Mr. Chris Moss.
On a motion by Mr. Corpus, seconded by Dr. Gibson, the proposed minutes for the July 13, 2017 Audit Committee meeting were approved as presented.
2
3. Receive State Auditor’s Office presentations A. Planned audits of TRS’ Comprehensive Annual Financial Report (CAFR)
including work on Other Post-Employment Benefits (OPEB) for Fiscal Year 2017 – Michael Clayton and Anca Pinchas, State Auditor’s Office
Ms. Anca Pinchas stated the purpose of the audit was to issue an opinion on the Teacher Retirement System for the fiscal year 2017 financial statements. She said there are three deliverables of this audit to be issued in November 2017: an independent auditor’s report, the report of internal controls and the report to the Legislative Audit Committee. She reported the Audit began in August 2017.
B. Results of the Audit of TRS’ Fiscal Year 2016 Employer Pension Liability Allocation Schedules – Kelley Ngaide, State Auditor’s Office
Ms. Kelly Ngaide reported on the 2016 schedule of employers’ proportionate shares and schedule of pension amounts by employer. She said an unqualified audit opinion on the pension liability schedules was issued and there were no written findings for management. Mr. Michael Clayton discussed the new standards, GASB 74 and 75, in the coming years that will look very similar to GASB 67 and GASB 68.
4. Receive Investment Compliance reports – Heather Traeger Ms. Heather Traeger reported on the ethics and fraud monitoring. Ms. Traeger stated that, during the reporting period, her office had looked into three items, all of which had been resolved. Additionally, the one pending item from last report was resolved as well. Ms. Traeger noted that there had been three conflict determination requests from contractors. Ms. Traeger said in each of these cases there was a determination of no conflict. Ms. Traeger reported there were compliance violations in the last quarter pursuant to the ethics policy. In two instances, ethic training was not completed by the required annual basis. She stated one employee had retired prior to training being completed and the other employee was out on medical leave. Ms. Traeger stated they were working with HR to develop new policies related to training.
5. Receive Internal Audit Compliance Testing and Investment Management Division reports
A. Quarterly TRS compliance testing (Agreed-Upon Procedures) – Hugh Ohn and Heather Traeger
Mr. Ohn stated the report title has changed for it now includes more TRS related policies and procedures. Mr. Ohn reported everything was clean except for one item which was considered a minor compliance exception which was the compliance violation Ms. Traeger previously reported on to the Board.

3
B. Private equity fee pilot project – Hugh Ohn; Danielle Valkner, PwC Ms. Amy Barrett introduced Ms. Danielle Valkner with PricewaterhouseCoopers, PwC, who had partnered with TRS on the pilot of the private equity fee audits. Mr. Ohn stated the project objectives was to examine private equity fee calculation processes and practices, and based on the examination of those practices, develop standard audit programs to test future private equity fee calculation reviews and audits. Mr. Ohn described the criteria they used in selecting a manager and funds to review. Ms. Valkner provided information on the funds structure and the types of fees that are incurred. She said the deliverables for this project was basic project management tools, the engagement letter, document requests lists and agendas for the meetings. Mr. Ohn stated for next steps is to expand the fee audits to multiple managers in the future. He recommended starting with more desk types of reviews. Ms. Barrett stated the recommendation was to expand to more private equity funds and more private equity managers but with a des review focus.
C. Commission credits and contractual allowance audit – Hugh Ohn and Sylvia Bell
Mr. Ohn provided background information on soft dollars and commission credits. Mr. Ohn then described the process for how commission credits and commission recapture agreements (CRAs) work. Mr. Ohn stated the audit objective was a standard one, whether controls are working effectively to achieve business objectives and the audit scope included were commission sharing agreements (CSAs), CRAs and State Street Bank contractual allowance. He said the combined amount of these three programs was about $24.4 million per year. Mr. Ohn stated regarding the audit results, there were no significant control weaknesses. He said opportunities to enhance existing controls were identified and made three recommendations. Ms. Sylvia Bell reported on the management action plan regarding the three recommendations.
6. Receive Internal Audit Benefit Services Division reports – Jan Engler, Nick Ballard, Art Mata and Barbie Pearson
A. Annual benefits testing (Agreed-Upon Procedures) Ms. Barret reported this is where the large sum of annuity payments are tested to ensure that everything is operating acceptable. She said there was only one exception and that it was a very clean audit.
B. Employer audit reports (Dallas ISD and Pleasanton ISD) C. Employer audit of pension and TRS-Care surcharges (30 ISDs)
Ms. Jan Engler introduced the team that worked on the employer audit reports. Mr. Nick Ballard provided background on the scope of the different types of audits performed. Mr. Ballard stated the issue around recordkeeping for return-to-work retirees and ensuring that they were correctly reported to TRS was an issue for the Dallas ISD and a common issue for many of the school districts audited this year. He said other common issues identified were TRS retirees working as substitutes, independent contractors or employees working for a third party entity or working for a staffing firm at the school district. For Pleasanton ISD, Mr. Ballard said an issue concerning the calculation of contributions for statutory minimum and no-OASDI was identified. He said for each of the school districts audited they have received a management response. In each case,

4
management agreed with the findings and committed to working with the benefit reporting team to correct reports where necessary. Ms. Barbie Pearson and Ms. Jennifer Dujka discussed what TRS has always done and some new items to help provide reporting entities with information and training regarding employment after retirement.
D. Higher education pilot and audit program development Mr. Ballard stated in 2017 the audit program was tailored to address issues specific to institutions of higher education (higher ed). He said the pilot project worked with University of Texas at San Antonio and University of Texas Health Science Center at San Antonio. Mr. Ballard reported that there is no formal audit report but two outcomes were identified. Mr. Art Mata discussed the higher ed audit manual, the self-assessment tool and outreach efforts internal audit is conducting. Mr. Mata reported the manual was completed as of August 31, 2017 but with the new TRUST system updates are required and are projecting to have the update by the end of this year.
7. Receive Internal Audit Executive Division reports
A. Trust expense allocation audit – Nick Ballard Mr. Ballard provided the objective of the trust expense allocation audit as whether that allocation process for the various funds that TRS manages is defined reasonable and implemented accurately. Mr. Ballard reported that management controls are operating effectively to ensure that costs are allocated to each of the funds and the 403(b) certification program appropriately. He said there were no significant findings but they did identify opportunities for management to strengthen controls to ensure allocation of costs continue to be done appropriately going forward. Mr. Ballard said the first recommendation was that management develop a comprehensive cost allocation policy that emphasize the fiduciary duty to ensure equitable allocation of costs to each of the funds that TRS manages. The second recommendation is that management develop procedures to implement the comprehensive cost allocation policy, along with defined rules and procedures for department managers and the determination and approval of rates used for facilities costs. Mr. Don Green provided a management response that agreed 100 percent with what Mr. Ballard reported. He said CAPPS has functionality built into it that will help automate the cost allocation discussed. Mr. Green said that until CAPPS is implemented though, there does need to be a more formalized process.
B. Executive Performance Incentive Pay calculation testing (Agreed-Upon Procedures) – Toma Miller
Ms. Barrett reported the testing of the calculations for the executive performance incentive pay plan regarding were correct.
C. Internal Audit Quality Assurance and Improvement Program (QAIP) self-assessment – Amy Barrett

5
Ms. Barrett reported that the self-assessment found they were in compliance with all of the audit standards this year.
D. Status of prior audit and consulting recommendations – Amy Barrett Ms. Barrett reported adequate progress was being made on all outstanding items. She said two items that are outstanding shall be completed by FY 2018.
8. Consider recommendations to the Board of Trustees for the Proposed Audit Plan for Fiscal Year 2018 – Amy Barrett.
Ms. Barrett presented the Audit plan to the Committee stating it was the roadmap for internal audit. She described the different project internal audit performs ranging from traditional audits to consulting projects. She reviewed the audits proposed for fiscal year 20118. On a motion by Dr. Gibson, seconded by Mr. Corpus, the Committee unanimously approved to recommend to the Board of Trustees approval of the proposed audit plan for fiscal year 2018, as presented by staff.
9. Discuss or consider Internal Audit administrative reports and matters related to
governance, risk management, internal control, compliance violations, fraud, regulatory reviews or investigations, fraud risk areas, audits for the annual internal audit plan, or auditors' ability to perform duties – Christopher Moss and Amy Barrett
Without further discussion, the meeting adjourned at 10:11 a.m. APPROVED BY THE AUDIT COMMITTEE OF THE BOARD OF TRUSTEES OF THE TEACHER RETIREMENT SYSTEM OF TEXAS ON THE 15th DAY OF DECEMBER 2017.
______________________________ _________________ Christopher Moss Date Chair, Audit Committee Board of Trustees Teacher Retirement Systems of Texas

TAB 3

TAB 3A

Robert E. Johnson Building Phone: (512) 936-9500 1501 North Congress Avenue P.O. Box 12067 Fax: (512) 936-9400 Austin, Texas 78701 Austin, Texas 78711-2067 Internet: www.sao.texas.gov
SAO Report No. 18-005
A Report on
The Audit of Teacher Retirement System’s Fiscal Year 2017 Financial Statements
November 27, 2017
Members of the Legislative Audit Committee:
In our audit report dated November 20, 2017, we concluded that the Teacher Retirement System’s (the System) basic financial statements for fiscal year 2017 were materially correct and presented in accordance with accounting principles generally accepted in the United States of America. The System published our audit report as part of its basic financial statements, which it intends to post on its Web site at https://www.trs.texas.gov/Pages/about_publications.aspx.
We also issued a report on internal control over financial reporting and on compliance and other matters as required by auditing standards (that report, including responses from management, is presented in the attachment to this letter). In that report, auditors determined that the System should strengthen controls to help ensure the completeness and accuracy of the active employee census data that employers submit.
Our procedures were not intended to provide an opinion on internal control over financial reporting or to provide an opinion on compliance with laws and regulations. Accordingly, we do not express an opinion on the effectiveness of the System’s internal control over financial reporting or on compliance with laws and regulations.
Testing of Plan Member Census Data
Auditors conducted census data testing for fiscal year 2017 (see text box for the key data elements tested) as part of this audit. The completeness and accuracy of employees’ census data is important because the System uses that data to calculate the System’s liabilities for pensions and other post employment benefits.
Auditors implemented a risk-based approach for selecting employers (including school districts, charter schools, and higher education institutions) for fiscal year 2017 census data testing as required by American Institute of Certified Public Accountants (AICPA) guidance. That resulted in auditors selecting 91 employers for which census data was tested. (A list of the employers selected for testing is presented in the attachment to this letter.) Testing included reviewing documentation to verify that the census data that the employers submitted to the System was accurate.
Active Employee Census Data
Active employee census data is key demographic data that affects the actuarial estimate of the pension liability amount that the System presents in its financial statements.
Key data elements include:
Name.
Date of birth.
Service credits.
Pensionable earnings.
Gender.
Employment Status.
Source: Chapter 13 in State and Local Governments – Audit and Accounting Guide, American Institute of Certified Public Accountants.

Members of the Legislative Audit Committee November 27, 2017 Page 2 Based on the testing performed, auditors determined that the underlying census data was materially complete and accurate to support the System’s plan’s financial statement amounts. That was reflected as part of our unmodified audit opinion on the System’s financial statements for fiscal year 2017. For fiscal year 2016, auditors tested the System’s census data using the same methodology described above and concluded that the data was materially complete and accurate. The System posted information on census data testing performed on its Web site at http://trs.texas.gov.
Additionally, auditors will be issuing an opinion later this fiscal year on the System’s fiscal year 2017 pension liability allocation schedules. Those schedules provide employers with the information they need to record their share of the pension liability in their financial statements, in accordance with AICPA requirements. Auditors previously issued an opinion on the System’s pension liability allocation schedules for fiscal year 2016. The System published our audit opinion, along with the pension liability allocation schedules, on its Web site at https://www.trs.texas.gov/Pages/re_gasb_67_68.aspx.
Other Issues
Auditors communicated certain issues that were not material or significant to the audit objectives separately in writing to the System’s management.
As required by auditing standards, we will also communicate to the System’s Board of Trustees certain matters related to the conduct of a financial statement audit.
We appreciate the System’s cooperation during this audit. If you have any questions, please contact Michael Owen Clayton, CPA, CISA, CFE, CIDA Audit Manager, or me at (512) 936-9500.
Sincerely,
Lisa R. Collier, CPA, CFE, CIDA First Assistant State Auditor
Attachment
cc: The Honorable Greg Abbott, Governor Members of the Teacher Retirement System Board of Trustees
Mr. R. David Kelly, Chairman Ms. Dolores Ramirez, Vice Chair Ms. T. Karen Charleston Mr. Joe Colonnetta Mr. David Corpus Mr. John Elliott Dr. Greg Gibson Mr. Christopher Moss
Mr. Brian Guthrie, Executive Director, Teacher Retirement System

This document is not copyrighted. Readers may make additional copies of this report as needed. In addition, most State Auditor’s Office reports may be downloaded from our Web site: www.sao.texas.gov. In compliance with the Americans with Disabilities Act, this document may also be requested in alternative formats. To do so, contact our report request line at (512) 936-9500 (Voice), (512) 936-9400 (FAX), 1-800-RELAY-TX (TDD), or visit the Robert E. Johnson Building, 1501 North Congress Avenue, Suite 4.224, Austin, Texas 78701. The State Auditor’s Office is an equal opportunity employer and does not discriminate on the basis of race, color, religion, sex, national origin, age, or disability in employment or in the provision of services, programs, or activities. To report waste, fraud, or abuse in state government call the SAO Hotline: 1-800-TX-AUDIT.

Attachment A Report on the Audit of the Teacher Retirement System’s Fiscal Year 2016 Financial Statements
SAO Report No. 18-005 November 2017
Page 1
Attachment
Section 1
List of Employers Selected for Census Data Testing
Table 1 lists the 91 employers for which auditors tested the accuracy of census data to determine whether that data was materially complete and accurate to support the Teacher Retirement System’s plan’s financial statement amounts.1
Table 1
List of Employers Selected for Census Data Testing for Fiscal Year 2017
Alvarado Independent School District
Anahuac Independent School District
Argyle Independent School District
Bandera Independent School District
Bay City Independent School District
Bishop Consolidated Independent School District
Bonham Independent School District
Brady Independent School District
Brownfield Independent School District
Brownsboro Independent School District
Brownsville Independent School District
Bushland Independent School District
Central Texas College
Cisco Independent School District
City View Independent School District
Coastal Bend College
Coldspring-Oakhurst Consolidated Independent School District
Commerce Independent School District
Conroe Independent School District
Crowley Independent School District
Cuero Independent School District
Dallas Independent School District
Dayton Independent School District
Deer Park Independent School District
East Chambers Independent School District
Edcouch-Elsa Independent School District
Edinburg Consolidated Independent School District
Ferris Independent School District
1 Auditors followed the American Institute of Certified Public Accountants’ sampling guide methodology and selected a representative population of employees from each employer selected for testing.

Attachment A Report on the Audit of the Teacher Retirement System’s Fiscal Year 2016 Financial Statements
SAO Report No. 18-005 November 2017
Page 2
List of Employers Selected for Census Data Testing for Fiscal Year 2017
Fort Worth Independent School District
Gladewater County Line Independent School District
Glen Rose Independent School District
Goose Creek Consolidated Independent School District
Granbury Independent School District
Greenville Independent School District
Groveton Independent School District
Hillsboro Independent School District
Houston Independent School District
Humble Independent School District
Jacksboro Independent School District
Jim Hogg County Independent School District
Joshua Independent School District
Junction Independent School District
Kermit Independent School District
Klein Independent School District
La Joya Independent School District
La Porte Independent School District
Life School
Livingston Independent School District
Llano Independent School District
Mission Consolidated Independent School District
Montgomery Independent School District
Muleshoe Independent School District
Navasota Independent School District
Northwest Independent School District
Pharr-San Juan-Alamo Independent School District
Pine Tree Independent School District
Plano Independent School District
Princeton Independent School District
Promise Community School
Red Oak Independent School District
Region 1 Education Service Center
Region 10 Education Service Center
Region 16 Education Service Center
Rio Hondo Independent School District
Royal Independent School District
Royse City Independent School District
San Angelo Independent School District
San Elizario Independent School District
Santa Fe Independent School District
Snyder Independent School District
Southwest High School
Southwest Texas Junior College
Stafford Municipal School District
Taylor Independent School District

Attachment A Report on the Audit of the Teacher Retirement System’s Fiscal Year 2016 Financial Statements
SAO Report No. 18-005 November 2017
Page 3
List of Employers Selected for Census Data Testing for Fiscal Year 2017
Temple College
Terrell Independent School District
Texas A&M Transportation Institute
Texas A&M University System
Texas City Independent School District
The University of Texas at Austin
The University of Texas Health Science Center at San Antonio
The University of Texas Health Science Center at Tyler
The University of Texas M.D. Anderson Cancer Center
The University of Texas Southwestern Medical Center
Tomball Independent School District
Trinity Basin Preparatory
United Independent School District
West Orange Cove Consolidated Independent School District
White Settlement Independent School District
Whitehouse Independent School District
Winters Independent School District

Attachment A Report on the Audit of the Teacher Retirement System’s Fiscal Year 2016 Financial Statements
SAO Report No. 18-005 November 2017
Page 4
Section 2
Report on Internal Control Over Financial Reporting and on Compliance and Other Matters as Required by Auditing Standards

Attachment A Report on the Audit of the Teacher Retirement System’s Fiscal Year 2016 Financial Statements
SAO Report No. 18-005 November 2017
Page 5

Attachment A Report on the Audit of the Teacher Retirement System’s Fiscal Year 2016 Financial Statements
SAO Report No. 18-005 November 2017
Page 6

Attachment A Report on the Audit of the Teacher Retirement System’s Fiscal Year 2016 Financial Statements
SAO Report No. 18-005 November 2017
Page 7

Attachment A Report on the Audit of the Teacher Retirement System’s Fiscal Year 2016 Financial Statements
SAO Report No. 18-005 November 2017
Page 8

Attachment A Report on the Audit of the Teacher Retirement System’s Fiscal Year 2016 Financial Statements
SAO Report No. 18-005 November 2017
Page 9

Required Communication with Those Charged with Governance
Based on the Audit of the Teacher Retirement System’s Fiscal Year 2017 Financial Statements
Page 1 of 3
We have audited the financial statements of the Teacher Retirement System for the year ended
August 31, 2017, and have issued our report thereon dated November 20, 2017. Professional
standards require that we provide you with the following information related to our audit.
No. Item Comments
1 The Auditor’s Responsibilities Under Generally Accepted Auditing Standards
As stated in our engagement letter dated May 10, 2017, our responsibility, as described by professional standards, is to express an opinion about whether the financial statements prepared by management, with your oversight, are prepared, in all material respects, in accordance with generally accepted accounting principles. Our audit of the financial statements does not relieve management or those charged with governance of their responsibilities.
2
Planned Scope and Timing of the Audit
We performed the audit according to the planned scope and timing previously communicated to you in our engagement letter dated May 10, 2017.
3 Corrected and Uncorrected Misstatements
Professional standards require us to accumulate all known and likely misstatements identified during the audit, other than those the auditor believes are trivial, and communicate them to the appropriate level of management.
Auditors identified no misstatements requiring correction during this audit.
4 Other Information in Documents Containing Audited Financial Statements, Supplementary Information, and/or Required Supplementary Information
Our financial statement audit opinion applies to the basic financial statements, which include the accompanying notes. We also applied certain limited auditing procedures to the Other Supplementary Information and concluded that such information was fairly stated in all material respects in relation to the basic financial statements taken as a whole.
We did not opine on Management’s Discussion and Analysis (MD&A) and Required Supplementary Information. However, we performed limited procedures related to this information, which consisted of making inquiries of management regarding the methods of its measurement and presentation, and comparing the information for consistency with management’s responses to our inquiries, the basic financial statements, and other knowledge we obtained during our audit of the basic financial statements.

Required Communication with Those Charged with Governance
Based on the Audit of the Teacher Retirement System’s Fiscal Year 2017 Financial Statements
Page 2 of 3
No. Item Comments
5 Management Representations
We have requested certain representations from management that are included in the management representation letter dated November 20, 2017. We also requested a representation letter dated November 20, 2017, from the Teacher Retirement System’s general counsel regarding the existence of certain contingent liabilities that might require disclosure in the financial statements.
6 Qualitative Aspects of the Entity’s Significant Accounting Practices
Management is responsible for the selection and use of appropriate accounting policies. The significant accounting policies used by the Teacher Retirement System are described in Note 1 to the financial statements.
The implementation of GASB 74 led to changes in the financial statements and disclosures related to other post-employment benefits.
We noted no transactions entered into by the Teacher Retirement System during the year for which there is a lack of authoritative guidance or consensus. There are no significant transactions that have been recognized in the financial statements in a period that differs from when the transactions occurred.
7 Significant Difficulties Encountered During the Audit
We did not encounter any restrictions in performing our procedures or gaining access to individuals or records. Management and staff provided us with all of the information and support we requested.
8 Other Audit Findings or Issues
We generally discuss a variety of matters, including the application of accounting principles and auditing standards, with management each year. Those discussions occurred in the normal course of the audit.
We identified the following significant deficiency in controls: The System should strengthen controls to help ensure the completeness and accuracy of the active employee census data that employers submit. Auditors identified other less significant matters that were communicated to TRS management during the audit.
9 Disagreements with Management
We did not encounter any disagreements with management during the course of the audit.
For purposes of this letter, professional standards define a disagreement with management as a financial accounting, reporting, or auditing matter, whether or not resolved to our satisfaction, that could be significant to the financial statements or the auditor’s report.

Required Communication with Those Charged with Governance
Based on the Audit of the Teacher Retirement System’s Fiscal Year 2017 Financial Statements
Page 3 of 3
No. Item Comments
10 Management’s Consultations with Other Accountants
In some cases, management may decide to consult with other accountants about auditing and accounting matters, similar to obtaining a “second opinion” on certain situations. If a consultation involves application of an accounting principle to the Teacher Retirement System financial statements or a determination of the type of auditor’s opinion that may be expressed on those statements, our professional standards require the consulting accountant to check with us to determine that the consultant has all the relevant facts.
To our knowledge, there were no such consultations with other accountants.
11 Significant Findings or Issues Discussed, or Subject to Correspondence, with Management
Prior to and throughout our audit engagement, we had routine discussions, or engaged in correspondence, with management regarding the Teacher Retirement System and application of accounting principles and auditing standards.
12 Independence
The State Auditor’s Office is independent to conduct the audit of Teacher Retirement System’s fiscal year 2017 financial statements. It is the State Auditor’s Office’s policy to conduct all projects in an environment free of any threats that impair independence.
13 Fraud, Abuse, or Noncompliance with Laws and Regulations, Contracts or Grant Agreements
Auditing standards require auditors to exercise professional skepticism and increased awareness to detect potential violations, fraud, and abuse.
We did not find evidence that fraud, abuse, or noncompliance with laws and regulations, contracts or grant agreements, had, or might have, occurred.
This information is intended solely for the use of the Board of Trustees of the Teacher Retirement System
of Texas and management of the Teacher Retirement System and is not intended to be and should not be
used by anyone other than these specified parties.

TAB 3B

An Audit Report on Incentive Compensation at the Permanent School Fund, General Land Office, Employees
Retirement System, and Teacher Retirement System
Report No. 18-001; Released September 2017 Page 1 of 3
Background
Plan year 2016 was the first year that TRS implemented its executive performance incentive pay plan.
TRS awarded $ 5,275,578 to 141 employees.

An Audit Report on Incentive Compensation at the Permanent School Fund, General Land Office, Employees
Retirement System, and Teacher Retirement System
Report No. 18-001; Released September 2017 Page 2 of 3
Overall Conclusion
TRS calculated and paid incentive compensation in accordance with their policies and procedures for plan year 2016.
TRS calculated and paid executive incentive compensation in accordance with its executive performance incentive pay plan (separate from the TRS plan cited above). However, it should strengthen controls over its executive incentive compensation calculation and review process by:
o TRS did not have formal, detailed policies and procedures that required it to document the calculation and review processes for its executive performance incentive pay plan
o TRS did not verify source documentation from a third party for one input into its incentive compensation calculation; however, auditors determined that the input TRS used in that calculation was accurate.

An Audit Report on Incentive Compensation at the Permanent School Fund, General Land Office, Employees
Retirement System, and Teacher Retirement System
Report No. 18-001; Released September 2017 Page 3 of 3
Overall
Summary of Chapters and Related Issue Ratings a
Chapter Title Issue Rating
4-A TRS Calculated and Paid Plan Year 2016 Incentive Compensation in Accordance with Its Policies and Procedures
Low
4-B TRS Calculated and Paid Plan Year 2016 Executive Performance Incentive Compensation in Accordance with Its Policies and Procedures, But It Should Strengthen Controls Over Its Calculation and Review Process
Low
a Auditors used professional judgement and rated the audit findings identified in this report. The issue ratings were determined based on the degree of risk or effect of the findings in relation to the audit objective(s). A description of the issue ratings and other factors considered are included in Appendix 2 of the audit report.
State Auditor’s Office reports are available on the Internet at http://www.sao.texas.gov/.
An Audit Report on
Incentive Compensation at the Permanent School Fund,
General Land Office, Employees Retirement System, and Teacher Retirement System
September 2017 Report No. 18-001
An Audit Report on
Incentive Compensation at the Permanent School Fund, General Land Office, Employees Retirement System, and Teacher Retirement System
SAO Report No. 18-001 September 2017
This audit was conducted in accordance with Texas Government Code, Section 321.0132.
For more information regarding this report, please contact Michael Clayton, Audit Manager, or Lisa Collier, First Assistant State Auditor, at (512) 936-9500.
Overall Conclusion
The Permanent School Fund (PSF) of the Texas Education Agency, the General Land Office (GLO), the Employees Retirement System (ERS), and the Teacher Retirement System (TRS) calculated and paid incentive compensation in accordance with their policies and procedures for plan year 2016.
Plan year 2016 was the first year that TRS implemented its executive performance incentive pay plan.1 TRS calculated and paid executive incentive compensation in accordance with its executive performance incentive pay plan. However, it should strengthen controls over its executive incentive compensation calculation and review process by (1) developing formal, detailed calculation and review procedures and (2) verifying all source documentation that it uses in its incentive compensation calculation.
Auditors communicated other, less significant issues in writing separately to management of the PSF, GLO, ERS, and TRS.
1 TRS’s executive performance incentive pay plan is separate from the incentive compensation plan that TRS had already been administering prior to plan year 2016 and continues to administer.
Incentive Compensation for Plan Year 2016
Through their incentive compensation plans for plan year 2016, the PSF, GLO, ERS, and TRS awarded a total of $10,607,058 in incentive compensation to 263 employees. Specifically:
The PSF awarded $2,385,729 to 49 employees.
GLO awarded $289,691 to 4 employees.
ERS awarded $2,656,060 to 69 employees.
TRS awarded $5,275,578 to 141 employees.
Sources: The PSF, GLO, ERS, and TRS.

An Audit Report on Incentive Compensation at the Permanent School Fund, General Land Office, Employees Retirement System, and Teacher Retirement System
SAO Report No. 18-001
ii
Table 1 presents a summary of the findings in this report and the related issue ratings. (See Appendix 2 for more information about the issue rating classifications and descriptions.)
Table 1
Summary of Chapters/Subchapters and Related Issue Ratings
Chapter/ Subchapter Title Issue Rating a
1 The PSF Calculated and Paid Plan Year 2016 Incentive Compensation in Accordance with Its Policies and Procedures
Low
2 GLO Calculated and Paid Plan Year 2016 Incentive Compensation in Accordance with Its Policies and Procedures
Low
3 ERS Calculated and Paid Plan Year 2016 Incentive Compensation in Accordance with Its Policies and Procedures
Low
4-A TRS Calculated and Paid Plan Year 2016 Incentive Compensation in Accordance with Its Policies and Procedures
Low
4-B TRS Calculated and Paid Plan Year 2016 Executive Performance Incentive Compensation in Accordance with Its Policies and Procedures, But It Should Strengthen Controls Over Its Calculation and Review Process
Low
a A chapter/subchapter is rated Priority if the issues identified present risks or effects that if not addressed could critically affect the audited entity’s ability to effectively administer the program(s)/function(s) audited. Immediate action is required to address the noted concern and reduce risks to the audited entity.
A chapter/subchapter is rated High if the issues identified present risks or effects that if not addressed could substantially affect the audited entity’s ability to effectively administer the program(s)/function(s) audited. Prompt action is essential to address the noted concern and reduce risks to the audited entity.
A chapter/subchapter is rated Medium if the issues identified present risks or effects that if not addressed could moderately affect the audited entity’s ability to effectively administer program(s)/function(s) audited. Action is needed to address the noted concern and reduce risks to a more desirable level.
A chapter/subchapter is rated Low if the audit identified strengths that support the audited entity’s ability to administer the program(s)/functions(s) audited or the issues identified do not present significant risks or effects that would negatively affect the audited entity’s ability to effectively administer the program(s)/function(s) audited.
Summary of Management’s Response
At the end of the TRS chapter in this report, auditors made recommendations to address the issues identified during this audit. TRS agreed with the recommendations in this report.
Audit Objective and Scope
The objective of this audit was to determine whether the PSF, GLO, ERS, and TRS calculate and pay incentive compensation in accordance with policies and procedures.
The scope of this audit covered incentive compensation plan years ending August 31, 2016, at the PSF and ERS; June 30, 2016, at GLO; and September 30, 2016, and June 30, 2016, at TRS.

Contents
Detailed Results
Chapter 1 The PSF Calculated and Paid Plan Year 2016 Incentive Compensation in Accordance with Its Policies and Procedures ............................................................. 1
Chapter 2 GLO Calculated and Paid Plan Year 2016 Incentive Compensation in Accordance with Its Policies and Procedures ............................................................. 3
Chapter 3 ERS Calculated and Paid Plan Year 2016 Incentive Compensation in Accordance with Its Policies and Procedures ............................................................. 5
Chapter 4 TRS Calculated and Paid Plan Year 2016 Incentive Compensation Awards in Accordance with Its Policies and Procedures, But It Should Strengthen Controls Over Its Executive Performance Incentive Pay Plan Calculation and Review Process ..................................... 8
Appendices
Appendix 1 Objective, Scope, and Methodology .............................. 12
Appendix 2 Issue Rating Classifications and Descriptions .................... 16
Appendix 3 Related State Auditor’s Office Work ............................. 17

An Audit Report on Incentive Compensation at the Permanent School Fund, General Land Office, Employees Retirement System, and Teacher Retirement System
SAO Report No. 18-001 September 2017
Page 1
Detailed Results
Chapter 1
The PSF Calculated and Paid Plan Year 2016 Incentive Compensation in Accordance with Its Policies and Procedures
The Permanent School Fund (PSF) of the Texas Education Agency calculated and paid incentive compensation for its plan year ended August 31, 2016, in accordance with its policies and procedures.
The PSF awarded a total of $2,385,729 in incentive compensation to 49 employees. The PSF awarded the most incentive compensation to its chief investment officer, who was awarded $205,849 payable during a 3-year period. That $205,849 represented 8.6 percent of the $2,385,729 in total incentive compensation that the PSF awarded.
The PSF calculates incentive compensation based on an employee’s achievement of goals related to total fund performance and the performance of the employee’s assigned asset classes. Except for the performance of certain asset classes that are measured since their inception using an internal rate of return calculation, fund and asset class performance are calculated on a three-year rolling average performance period. The PSF calculates investment returns for its incentive compensation plan on a gross-of-fees-paid-to-external-manager basis (see text box for more information on gross-of-fees and net-of-fees).
The PSF awards incentive compensation if investment performance exceeds selected benchmarks. Total fund investment performance exceeded the target benchmark by 0.45 percent (45 basis points) for the three-year period from September 1, 2013, to August 31, 2016 (see text box for more information on basis points).
The PSF pays incentive compensation awards in installments over time. Specifically, for most employees, the PSF pays 50 percent of an incentive compensation award for the current plan year, 25 percent of that award in the next year, and 25 percent of that
award in the third year. As a result, payments to employees may consist of partial awards from three years.
2 Chapter 1 is rated Low because the audit identified strengths that support the audited entity’s ability to administer the
program(s)/functions(s) audited or the issues identified do not present significant risks or effects that would negatively affect the audited entity’s ability to effectively administer the program(s)/function(s) audited.
Chapter 1 Rating:
Low 2
Gross-of-Fees and Net-of-Fees
The PSF calculates investment returns for its incentive compensation plan on a gross-of-fees-paid-to-external-manager basis.
Gross-of-fees indicates that the effect of fees has not been reflected in a return; net-of-fees indicates that the effect of fees has been reflected in a return.
Sources: The PSF and the CFA Institute Web site at http://www.cfapubs.org/doi/full/10.2469/ipmn.v2011.n1.1.
Basis Points
One basis point is 0.01 percent or one one-hundredth of a percentage point.
Source: Morningstar, Inc. Web site at http://www.morningstar.com/InvGlossary/basis_point_definition_what_is.aspx.

An Audit Report on Incentive Compensation at the Permanent School Fund, General Land Office, Employees Retirement System, and Teacher Retirement System
SAO Report No. 18-001 September 2017
Page 2
Table 2 shows the positions eligible to earn incentive compensation in the PSF incentive compensation plan and the incentive compensation awards for each position for plan year 2016.
Table 2
PSF Incentive Compensation Awards for Plan Year 2016
Eligible Position Incentive Compensation Award
or Award Range
Chief Investment Officer $205,849
Deputy Chief Investment Officer and Director of Fixed Income $150,214
Director of Private Markets $136,321
Director of Equities $138,366
Director of Global Risk Control Strategies $115,680
Deputy Executive Administrator $114,052
Portfolio Manager I-IV / Risk Manager $19,688 to $105,432
Investment Analyst I - IV / Risk Analyst $25,846 to $47,034
Director of Investment Operations $53,003
Director of Operational Due Diligence $47,920
Director of Finance $41,671
Director of Legal and Compliance $46,876
Financial Analyst I - IV $4,383 to $15,876
Accountant I - VII $18,175
Attorney I - VI $18,400
Director of Investment Technology $26,734
Systems Analyst I - VII $5,195 to $9,027
Program Specialist I - VII $4,855
Staff Services Officer I - V $2,122
Executive Assistant I - III Position was vacant
Source: The PSF.
An Audit Report on Incentive Compensation at the Permanent School Fund, General Land Office, Employees Retirement System, and Teacher Retirement System
SAO Report No. 18-001 September 2017
Page 3
Chapter 2
GLO Calculated and Paid Plan Year 2016 Incentive Compensation in Accordance with Its Policies and Procedures
The General Land Office (GLO) calculated and paid incentive compensation for its plan year ended June 30, 2016, in accordance with its policies and procedures.
GLO awarded a total of $289,691 in incentive compensation to 4 employees. GLO awarded the most incentive compensation to its director of PSF investments, who was awarded $216,051 payable during a 2-year period. That $216,051 represented 74.6 percent of the $289,691 in total incentive compensation that GLO awarded.
The GLO incentive compensation plan compares investment performance of the total fund with a target benchmark on a one-year, three-year, and five-year basis. GLO calculates incentive compensation based on an employee’s achievement of an investment performance component (60 percent) and a qualitative performance component (40 percent) that is tied to employee job performance during the performance period.
GLO calculates investment returns for its incentive compensation plan on a gross-of-fees-paid-to-external-manager basis (see text box for more information on gross-of-fees and net-of-fees). Investment portfolio performance exceeded the benchmark, and that triggered the awarding of incentive compensation. Total fund investment performance:
Exceeded the target benchmark by 5.63 percent (563 basis points) for the five-year period from July 1, 2011, to June 30, 2016.
Exceeded the target benchmark by 4.03 percent (403 basis points) for the three-year period from July 1, 2013, to June 30, 2016.
Exceeded the target benchmark by 2.29 percent (229 basis points) for the one-year period from July 1, 2015, to June 30, 2016.
GLO pays incentive compensation awards in installments over time. Specifically, it pays 50 percent of an award on December 1 following the end
3 Chapter 2 is rated Low because the audit identified strengths that support the audited entity’s ability to administer the
program(s)/functions(s) audited or the issues identified do not present significant risks or effects that would negatively affect the audited entity’s ability to effectively administer the program(s)/function(s) audited.
Chapter 2 Rating:
Low 3
Gross-of-Fees and Net-of-Fees
GLO calculates investment returns for its incentive compensation plan on a gross-of-fees-paid-to-external-manager basis.
Gross-of-fees indicates that the effect of fees has not been reflected in a return; net-of-fees indicates that the effect of fees has been reflected in a return.
Sources: The GLO and the CFA Institute Web site at http://www.cfapubs.org/doi/full/10.2469/ipmn.v2011.n1.1.
An Audit Report on Incentive Compensation at the Permanent School Fund, General Land Office, Employees Retirement System, and Teacher Retirement System
SAO Report No. 18-001 September 2017
Page 4
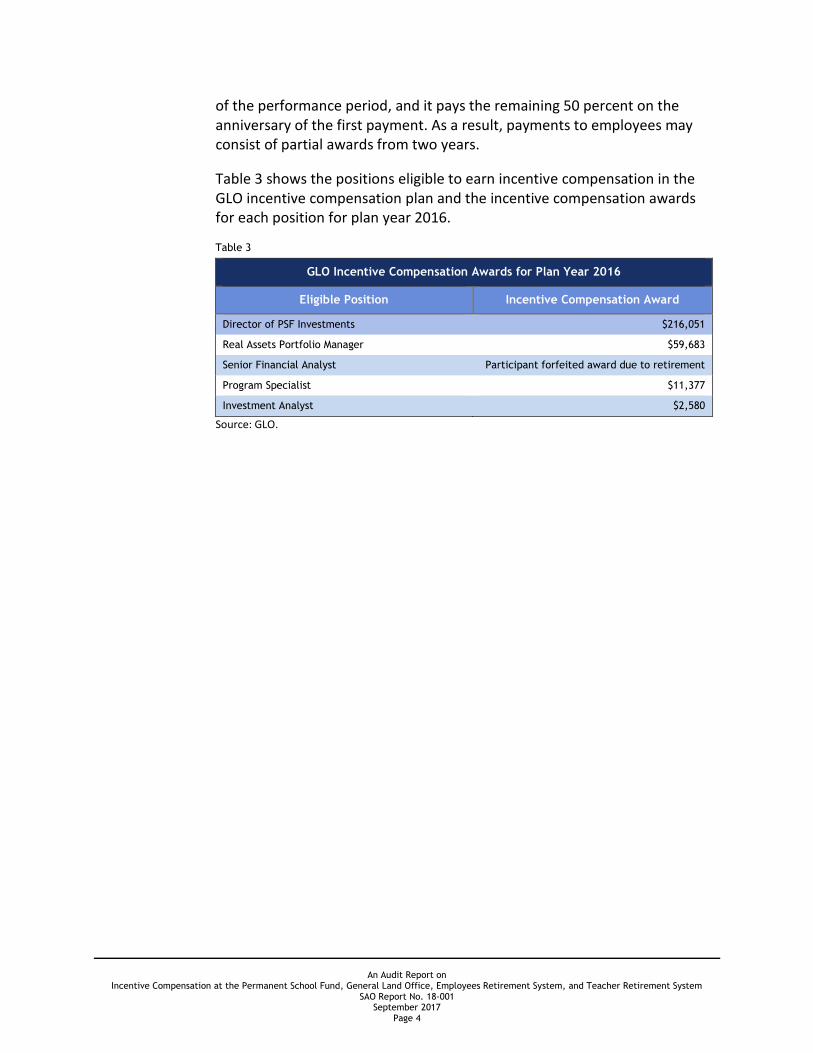
of the performance period, and it pays the remaining 50 percent on the anniversary of the first payment. As a result, payments to employees may consist of partial awards from two years.
Table 3 shows the positions eligible to earn incentive compensation in the GLO incentive compensation plan and the incentive compensation awards for each position for plan year 2016.
Table 3
GLO Incentive Compensation Awards for Plan Year 2016
Eligible Position Incentive Compensation Award
Director of PSF Investments $216,051
Real Assets Portfolio Manager $59,683
Senior Financial Analyst Participant forfeited award due to retirement
Program Specialist $11,377
Investment Analyst $2,580
Source: GLO.

An Audit Report on Incentive Compensation at the Permanent School Fund, General Land Office, Employees Retirement System, and Teacher Retirement System
SAO Report No. 18-001 September 2017
Page 5
Chapter 3
ERS Calculated and Paid Plan Year 2016 Incentive Compensation in Accordance with Its Policies and Procedures
The Employees Retirement System (ERS) calculated and paid incentive compensation for its plan year ended August 31, 2016, in accordance with its policies and procedures.
ERS awarded a total of $2,656,060 in incentive compensation to 69 employees. ERS awarded the most incentive compensation to an asset class portfolio director, who was awarded $149,511 payable during a 3-year period. That $149,511 represented 5.6 percent of the $2,656,060 in total incentive compensation that ERS awarded. Effective September 1, 2015, the members of the ERS board of trustees gave approval for the executive director (who was appointed on June 1, 2015) to participate in the incentive compensation plan for fiscal year 2016.
ERS awards incentive compensation based on a combination of quantitative (75 percent) and qualitative (25 percent) performance goals. It awards a quantitative performance component based on overall participant goals, with a minimum of 25 percent of overall participant goals to be evaluated based on relative trust fund performance. Of the 69 employees who received incentive compensation, 28 did not achieve any quantitative goals; therefore, their incentive compensation was based solely on the achievement of their qualitative goals.
In managing the trust fund, the Investments Division assigns individual investment professionals responsibility for managing subcategories of asset classes, individual portfolios, and individual research coverage. ERS uses a qualitative performance component in the areas of individual achievement, position-specific performance objectives, and ERS’s strategic and operational goals.
4 Chapter 3 is rated Low because the audit identified strengths that support the audited entity’s ability to administer the
program(s)/functions(s) audited or the issues identified do not present significant risks or effects that would negatively affect the audited entity’s ability to effectively administer the program(s)/function(s) audited.
Chapter 3 Rating:
Low 4

An Audit Report on Incentive Compensation at the Permanent School Fund, General Land Office, Employees Retirement System, and Teacher Retirement System
SAO Report No. 18-001 September 2017
Page 6
ERS calculates the investment performance goals based on (1) an employee’s achievement of benchmarks related to the relative trust fund performance and (2) the performance of the employee’s individual assigned asset classes for one-year, three-year, and five-year periods, depending on the employee’s length of service. ERS calculates total trust fund performance returns for its incentive compensation plan on a net-of-fees-paid-to-external-managers basis (see text box for more information on gross-of-fees and net-of-fees). If the one-year, three-year, or five-year investment performance exceed the target benchmarks, ERS takes that into account in each employee’s overall participant goals component.
ERS did not outperform its target benchmarks for plan year 2016 for the one-year and three-year periods; however, it
outperformed its target benchmark for the five-year period. In addition, participants received incentive compensation based on other quantitative goals related to subcategories of asset classes, individual portfolios, or individual research coverage, as well as qualitative goals. The total relative trust fund investment performance:
Exceeded the target benchmark by 0.0005 percent (.05 basis points) for the five-year period from September 1, 2011, to August 31, 2016.
Was less than the target benchmark by 0.18 percent (18 basis points) for the three-year period from September 1, 2013, to August 31, 2016.
Was less than the target benchmark by 1.81 percent (181 basis points) for the one-year period from September 1, 2015, to August 31, 2016.
ERS pays incentive compensation awards in installments over time. Specifically, for most employees, ERS pays 50 percent of an incentive compensation award for the current plan year, 25 percent of that award in the next year, and 25 percent of that award in the third year. As a result, payments to employees may consist of partial awards from three years. ERS pays investment operations team members in 2 installments of 50 percent each, and investment administrative support team members in 1 installment.
Gross-of-Fees and Net-of-Fees
ERS calculates total trust fund performance returns for its incentive compensation plan on a net-of-fees-paid-to-external-managers basis. Gross-of-fees indicates that the effect of fees has not been reflected in a return; net-of-fees indicates that the effect of fees has been reflected in a return.
Sources: The ERS Incentive Compensation Plan for Key Investment Professionals and Leadership Employees and the CFA Institute Web site at http://www.cfapubs.org/doi/full/10.2469/ipmn.v2011.n1.1.
An Audit Report on Incentive Compensation at the Permanent School Fund, General Land Office, Employees Retirement System, and Teacher Retirement System
SAO Report No. 18-001 September 2017
Page 7
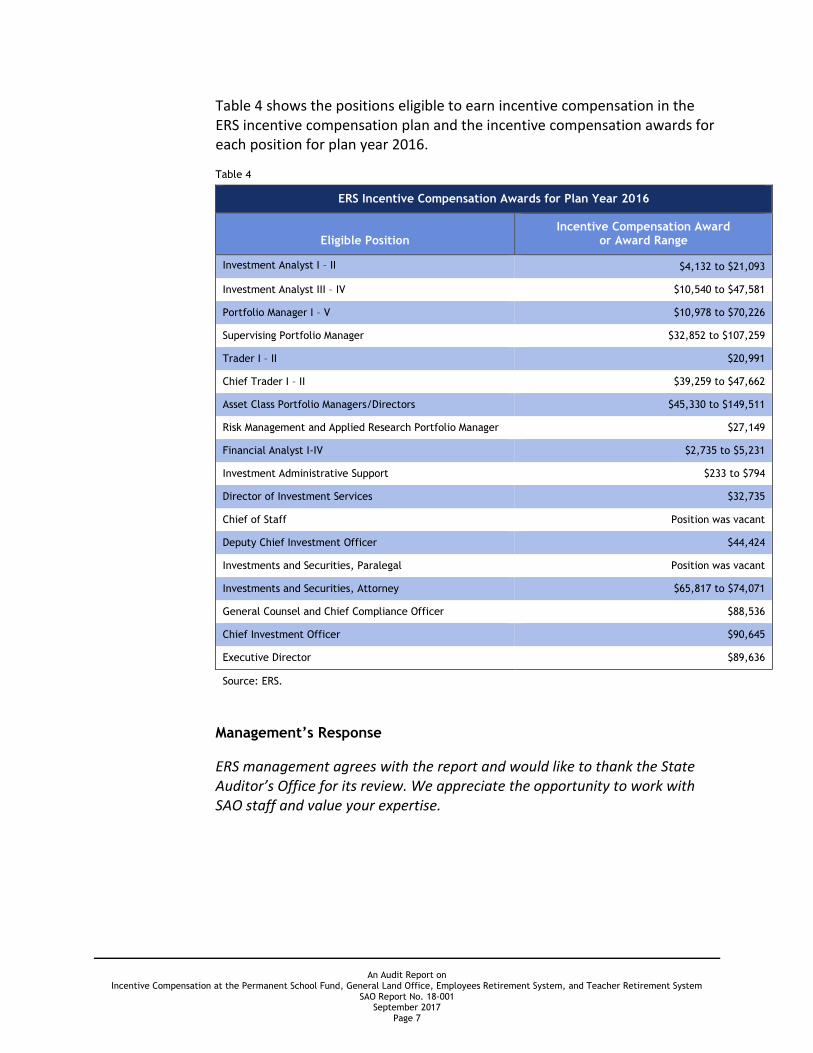
Table 4 shows the positions eligible to earn incentive compensation in the ERS incentive compensation plan and the incentive compensation awards for each position for plan year 2016.
Table 4
ERS Incentive Compensation Awards for Plan Year 2016
Eligible Position Incentive Compensation Award
or Award Range
Investment Analyst I – II $4,132 to $21,093
Investment Analyst III – IV $10,540 to $47,581
Portfolio Manager I – V $10,978 to $70,226
Supervising Portfolio Manager $32,852 to $107,259
Trader I – II $20,991
Chief Trader I – II $39,259 to $47,662
Asset Class Portfolio Managers/Directors $45,330 to $149,511
Risk Management and Applied Research Portfolio Manager $27,149
Financial Analyst I-IV $2,735 to $5,231
Investment Administrative Support $233 to $794
Director of Investment Services $32,735
Chief of Staff Position was vacant
Deputy Chief Investment Officer $44,424
Investments and Securities, Paralegal Position was vacant
Investments and Securities, Attorney $65,817 to $74,071
General Counsel and Chief Compliance Officer $88,536
Chief Investment Officer $90,645
Executive Director $89,636
Source: ERS.
Management’s Response
ERS management agrees with the report and would like to thank the State Auditor’s Office for its review. We appreciate the opportunity to work with SAO staff and value your expertise.

An Audit Report on Incentive Compensation at the Permanent School Fund, General Land Office, Employees Retirement System, and Teacher Retirement System
SAO Report No. 18-001 September 2017
Page 8
Chapter 4
TRS Calculated and Paid Plan Year 2016 Incentive Compensation Awards in Accordance with Its Policies and Procedures, But It Should Strengthen Controls Over Its Executive Performance Incentive Pay Plan Calculation and Review Process
The Teacher Retirement System (TRS) calculated and paid incentive compensation in accordance with its policies and procedures for plan year 2016. TRS also calculated and paid executive incentive compensation in accordance with its executive performance incentive pay plan. However, it should strengthen controls over its executive incentive compensation calculation and review process by (1) developing formal, detailed calculation and review procedures and (2) verifying all source documentation that it uses in its incentive compensation calculation.
Chapter 4-A
TRS Calculated and Paid Plan Year 2016 Incentive Compensation in Accordance with Its Policies and Procedures
TRS calculated and paid incentive compensation for its plan year ended September 30, 2016, in accordance with its policies and procedures.
TRS awarded a total of $5,266,028 in incentive compensation to 140 employees (excluding $9,550 awarded to the executive director as part of the separate executive performance incentive pay plan discussed in Chapter 4-B). TRS awarded the most incentive compensation to its chief investment officer, who was awarded $237,023 payable during a 2-year period. That $237,023 represented 4.5 percent of the $5,266,028 in total incentive compensation that TRS paid.
The TRS incentive compensation plan is based on a combination of investment performance and qualitative performance. The investment performance component compares investment performance with benchmarks (50 percent) and the performance of peer groups (30 percent). The qualitative performance component (20 percent) assesses performance in a variety of areas such as candor, curiosity, accountability, teamwork and leadership, and constructive work environment.
The TRS incentive compensation plan measures investment performance for both benchmark and peer group categories on both a 1-year (33 percent)
5 Chapter 4-A is rated Low because the audit identified strengths that support the audited entity’s ability to administer the
program(s)/functions(s) audited or the issues identified do not present significant risks or effects that would negatively affect the audited entity’s ability to effectively administer the program(s)/function(s) audited.
Chapter 4-A Rating:
Low 5

An Audit Report on Incentive Compensation at the Permanent School Fund, General Land Office, Employees Retirement System, and Teacher Retirement System
SAO Report No. 18-001 September 2017
Page 9
and 3-year (67 percent) basis. If investment performance exceeds the benchmarks or the peer group performance, that triggers the awarding of incentive compensation. TRS calculates investment returns for its incentive compensation plan on a net-of-fees-paid-to-external-managers basis (see text box for more information on gross-of-fees and net-of-fees). In addition, internal public markets portfolio and sector managers are measured by their respective assigned regions and sectors. The total fund investment performance:
Exceeded the benchmark by 0.22 percent (22 basis points) for the 3-year period from October 1, 2013, to September 30, 2016.
Was less than the benchmark by 0.35 percent (35 basis points) for the 1-year period from October 1, 2015, to September 30, 2016.
TRS pays incentive compensation awards in installments over time. Specifically, it pays 50 percent of an award approximately on February 1 following the end of the performance period, and it pays the remaining 50 percent approximately on the anniversary of the first payment. As a result, payments to employees may consist of partial awards from two years.
Table 5 shows the positions eligible to earn incentive compensation in the TRS incentive compensation plan and the incentive compensation awards for each position for plan year 2016.
Table 5
TRS Incentive Compensation Awards for Plan Year 2016
Eligible Positions Incentive Compensation Award
or Award Range
Chief Investment Officer $ 237,023
Deputy Chief Investment Officer $153,501
Senior Managing Director $86,159 to $124,856
Managing Director $91,811 to $116,267
Senior Director $50,250 to $109,260
Director $54,390 to $83,751
Senior Investment Manager $34,416 to $69,449
Investment Manager $27,106 to $50,345
Senior Associate $2,653 to $34,521
Associate $918 to $21,787
Senior Analyst $6,636 to $12,194
Analyst $2,321 to $7,279
Gross-of-Fees and Net-of-Fees
TRS calculates investment returns for its incentive compensation plan on a net-of-fees-paid-to-external-managers basis. Gross-of-fees indicates that the effect of fees has not been reflected in a return; net-of-fees indicates that the effect of fees has been reflected in a return.
Sources: TRS and the CFA Institute Web site at http://www.cfapubs.org/doi/full/10.2469/ipmn.v2011.n1.1.

An Audit Report on Incentive Compensation at the Permanent School Fund, General Land Office, Employees Retirement System, and Teacher Retirement System
SAO Report No. 18-001 September 2017
Page 10
TRS Incentive Compensation Awards for Plan Year 2016
Eligible Positions Incentive Compensation Award
or Award Range
Junior Analyst $3,597
Administrative Assistants $113 to $1,052
Source: TRS.
Chapter 4-B
TRS Calculated and Paid Plan Year 2016 Executive Performance Incentive Compensation in Accordance with Its Policies and Procedures, But It Should Strengthen Controls Over Its Calculation and Review Process
In November 2015, the TRS board of trustees approved the implementation of an executive performance incentive pay plan (separate from the incentive compensation plan discussed in Chapter 4-A) and approved the executive director to be a participant. Plan year 2016 (specifically, December 1, 2015, through June 30, 2016) was the first year that TRS implemented its executive performance incentive pay plan. The subsequent performance period began on July 1, 2016, and ended on June 30, 2017.
TRS calculated and paid executive incentive compensation for its plan year 2016 in accordance with its executive performance incentive pay plan. However, it did not have formal, detailed policies and procedures for the calculation and review process for its executive performance incentive pay plan that required TRS to document its calculation and review processes. In addition, TRS did not verify source documentation from a third party for one input into its incentive compensation calculation; however, auditors determined that the input TRS used in that calculation was accurate. Those issues increase the risk of making inaccurate award payouts due to undetected mistakes in the inputs, calculations, and review process.
The TRS board of trustees may add to or remove individual positions from participation in the executive performance incentive pay plan at any time. The TRS executive director was the only participant for the 2016 performance period. TRS awarded $9,550 in incentive pay to its executive director. TRS pays executive incentive compensation in installments over time. Specifically, it pays 50 percent of an award on approximately October 1
6 Chapter 4-B is rated Low because the audit identified strengths that support the audited entity’s ability to administer the
program(s)/functions(s) audited or the issues identified do not present significant risks or effects that would negatively affect the audited entity’s ability to effectively administer the program(s)/function(s) audited.
Chapter 4-B Rating:
Low 6

An Audit Report on Incentive Compensation at the Permanent School Fund, General Land Office, Employees Retirement System, and Teacher Retirement System
SAO Report No. 18-001 September 2017
Page 11
following the end of the performance period, and it pays the remaining 50 percent on approximately the anniversary of the first payment.
The TRS executive performance incentive pay plan is based on four main qualitative performance categories: member satisfaction (25 percent), leadership effectiveness (25 percent), operational effectiveness (25 percent), and employee satisfaction (25 percent). The executive performance incentive compensation calculation does not include a category for investment performance.
Recommendations
TRS should:
Develop formal written policies and procedures for its executive performance incentive pay plan compensation calculation and review process.
Verify all source documentation that it uses in its executive performance incentive compensation calculation.
Management’s Response
TRS agrees with both audit recommendations. Management has already taken steps to develop written policies and procedures for its executive performance incentive pay plan compensation calculation and review process, including controls surrounding verification of all source documentation used in the executive performance incentive compensation calculation. An initial draft of the Incentive Compensation Plan's calculation and review procedures have been completed and TRS expects to have a finalized document by December 31, 2017.

An Audit Report on Incentive Compensation at the Permanent School Fund, General Land Office, Employees Retirement System, and Teacher Retirement System
SAO Report No. 18-001 September 2017
Page 12
Appendices
Appendix 1
Objective, Scope, and Methodology
Objective
The objective of this audit was to determine whether the Permanent School Fund (PSF) of the Texas Education Agency, the General Land Office (GLO), the Employees Retirement System (ERS), and the Teacher Retirement System (TRS) calculate and pay incentive compensation in accordance with their policies and procedures.
Scope
The scope of this audit covered incentive compensation plan years ending August 31, 2016, at the PSF and ERS; June 30, 2016, at GLO; and September 30, 2016, and June 30, 2016, at TRS.
Methodology
The audit methodology included collecting information and documentation from the audited agencies; reviewing incentive compensation plans, policies, procedures, and other guidance related to incentive compensation; and analyzing and evaluating data and the results of tests.
Auditors tested sample items to determine whether selected recipients were eligible to receive incentive compensation payments, payment calculation data inputs were correct, payment calculations were correct based on the terms of the incentive compensation plans, and payment amounts distributed to recipients were properly recorded and matched amounts calculated for each recipient.
Auditors reviewed incentive compensation plans, calculations, personnel files, payroll data, and externally calculated fund performance results to determine whether the audited agencies calculated and paid incentive compensation in accordance with their policies and procedures. Auditors also tested access controls over the spreadsheets and data that the audited agencies used to calculate incentive compensation.
Data Reliability and Completeness
Auditors assessed the reliability of the incentive compensation award data used in this audit by tracing the data to supporting documentation and by reviewing access to the data. Auditors verified the completeness of the incentive compensation award data by comparing pay calculation

An Audit Report on Incentive Compensation at the Permanent School Fund, General Land Office, Employees Retirement System, and Teacher Retirement System
SAO Report No. 18-001 September 2017
Page 13
information in the incentive compensation award spreadsheets the audited agencies used to calculate payments to payment data in the Uniform Statewide Accounting System and the Uniform Statewide Payroll/Personnel System. Auditors determined that the incentive compensation award data was sufficiently reliable for the purposes of this audit.
Sampling Methodology
Auditors selected risk-based samples of incentive compensation awards for testing for the ERS and TRS incentive compensation plans. Auditors tested the entire population of incentive compensation awards for the PSF incentive compensation plan, the GLO incentive compensation plan, and the TRS executive performance incentive pay plan.
Information collected and reviewed included the following:
Incentive compensation plan documentation at the PSF, GLO, ERS, and TRS.
TRS and ERS board of trustees meeting minutes.
Incentive compensation payment calculation spreadsheets for incentive compensation plan years ending August 31, 2016, at the PSF and ERS; June 30, 2016, at GLO; and September 30, 2016, and June 30, 2016, at TRS.
Incentive compensation recipients’ personnel files.
Payroll data related to incentive compensation recipients.
Investment performance reports from custodian banks.
Procedures and tests conducted included the following:
Interviewed management and key personnel at the PSF, GLO, ERS, and TRS.
Tested and recalculated incentive compensation awards for recipients of incentive compensation for incentive compensation plan years ending August 31, 2016, at the PSF and ERS; June 30, 2016, at GLO; and September 30, 2016, and June 30, 2016, at TRS.
Verified that incentive compensation award payments matched award calculations.
Reviewed and tested compliance with the audited agencies’ policies and procedures.

An Audit Report on Incentive Compensation at the Permanent School Fund, General Land Office, Employees Retirement System, and Teacher Retirement System
SAO Report No. 18-001 September 2017
Page 14
Reviewed access controls over the spreadsheets and data that the audited agencies used to calculate incentive compensation.
Criteria used included the following:
Texas Education Agency Permanent School Fund Division Performance Incentive Pay Plan, effective September 1, 2015.
General Land Office Performance Incentive Pay Plan, effective July 1, 2015.
Employees Retirement System of Texas Incentive Compensation Plan for Key Investment Professionals and Leadership Employees, effective September 1, 2015.
Teacher Retirement System of Texas Performance Incentive Pay Plan, effective October 1, 2015.
Teacher Retirement System of Texas Executive Performance Incentive Pay Plan, effective December 1, 2015.
Section 44, Article III, Texas Constitution and related statutes.
Rider 13, page III-33, and Rider 22, pages III-9 and III-10, General Appropriations Act (84th Legislature).
Texas attorney general opinions related to incentive compensation.
Teacher Retirement System of Texas Performance Incentive Calculation and Verification, revised April 23, 2015.
Employees Retirement System of Texas Incentive Compensation Plan – Procedure Reference.
Employees Retirement System of Texas Incentive Compensation Plan Calculations Finance Process.
Project Information
Audit fieldwork was conducted from March 2017 through August 2017. We conducted this performance audit in accordance with generally accepted government auditing standards. Those standards require that we plan and perform the audit to obtain sufficient, appropriate evidence to provide a reasonable basis for our findings and conclusions based on our audit objectives. We believe that the evidence obtained provides a reasonable basis for our findings and conclusions based on our audit objectives.

An Audit Report on Incentive Compensation at the Permanent School Fund, General Land Office, Employees Retirement System, and Teacher Retirement System
SAO Report No. 18-001 September 2017
Page 15
The following members of the State Auditor’s staff performed the audit:
Sarah Jane M. Puerto, CFE (Project Manager)
Bianca F. Pineda, CGAP (Assistant Project Manager)
Doug Stearns, CISA
George D. Eure, CPA (Quality Control Reviewer)
Michael Owen Clayton, CPA, CISA, CFE, CIDA (Audit Manager)

An Audit Report on Incentive Compensation at the Permanent School Fund, General Land Office, Employees Retirement System, and Teacher Retirement System
SAO Report No. 18-001 September 2017
Page 16
Appendix 2
Issue Rating Classifications and Descriptions
Auditors used professional judgement and rated the audit findings identified in this report. Those issue ratings are summarized in the report chapters/sub-chapters. The issue ratings were determined based on the degree of risk or effect of the findings in relation to the audit objective.
In determining the ratings of audit findings, auditors considered factors such as financial impact; potential failure to meet program/function objectives; noncompliance with state statute(s), rules, regulations, and other requirements or criteria; and the inadequacy of the design and/or operating effectiveness of internal controls. In addition, evidence of potential fraud, waste, or abuse; significant control environment issues; and little to no corrective action for issues previously identified could increase the ratings for audit findings. Auditors also identified and considered other factors when appropriate.
Table 6 provides a description of the issue ratings presented in this report.
Table 6
Summary of Issue Ratings
Issue Rating Description of Rating
Low The audit identified strengths that support the audited entity’s ability to administer the program(s)/functions(s) audited or the issues identified do not present significant risks or effects that would negatively affect the audited entity’s ability to effectively administer the program(s)/function(s) audited.
Medium Issues identified present risks or effects that if not addressed could moderately affect the audited entity’s ability to effectively administer program(s)/function(s) audited. Action is needed to address the noted concern(s) and reduce risks to a more desirable level.
High Issues identified present risks or effects that if not addressed could substantially affect the audited entity’s ability to effectively administer the program(s)/function(s) audited. Prompt action is essential to address the noted concern(s) and reduce risks to the audited entity.
Priority Issues identified present risks or effects that if not addressed could critically affect the audited entity’s ability to effectively administer the program(s)/function(s) audited. Immediate action is required to address the noted concern(s) and reduce risks to the audited entity.

An Audit Report on Incentive Compensation at the Permanent School Fund, General Land Office, Employees Retirement System, and Teacher Retirement System
SAO Report No. 18-001 September 2017
Page 17
Appendix 3
Related State Auditor’s Office Work
Related State Auditor’s Office Work
Number Product Name Release Date
16-030 An Audit Report on Incentive Compensation at the Permanent School Fund, General Land Office, Employees Retirement System, and Teacher Retirement System
June 2016
15-032 An Audit Report on Incentive Compensation at Selected Agencies May 2015
14-033 An Audit Report on Incentive Compensation at the Teacher Retirement System, the Permanent School Fund, the General Land Office, and the Employees Retirement System
May 2014
13-033 An Audit Report on Incentive Compensation at the Teacher Retirement System, the Permanent School Fund, and the Employees Retirement System
April 2013

Copies of this report have been distributed to the following:
Legislative Audit Committee The Honorable Dan Patrick, Lieutenant Governor, Joint Chair The Honorable Joe Straus III, Speaker of the House, Joint Chair The Honorable Jane Nelson, Senate Finance Committee The Honorable Robert Nichols, Member, Texas Senate The Honorable John Zerwas, House Appropriations Committee The Honorable Dennis Bonnen, House Ways and Means Committee
Office of the Governor The Honorable Greg Abbott, Governor
Employees Retirement System Members of the Employees Retirement System Board of Trustees Mr. I. Craig Hester, Chair Mr. Doug Danzeiser, Vice Chair Ms. Ilesa Daniels Ms. Cydney Donnell Ms. Catherine Melvin Ms. Jeanie Wyatt Mr. Porter Wilson, Executive Director
General Land Office The Honorable George P. Bush, Land Commissioner and Chairman of the School Land Board Members of the School Land Board Mr. Gilbert Burciaga Mr. Scott Rohrman
Permanent School Fund Members of the State Board of Education Ms. Donna Bahorich, Chair Mr. Marty Rowley, Vice Chair Mr. Ruben Cortez Jr., Secretary Mr. Lawrence A. Allen Jr. Ms. Erika Beltran Mr. David Bradley Ms. Barbara Cargill Dr. Keven Ellis Ms. Patricia Hardy Mr. Tom Maynard Ms. Sue Melton-Malone Mr. Ken Mercer Ms. Geraldine Miller Ms. Georgina Perez Ms. Marisa B. Perez-Diaz Mr. Mike Morath, Commissioner of Education

Teacher Retirement System Members of the Teacher Retirement System Board of Trustees Mr. R. David Kelly, Chair Ms. Dolores Ramirez, Vice Chair Ms. T. Karen Charleston Mr. Joe Colonnetta Mr. David Corpus Mr. John Elliott Dr. Greg Gibson Mr. Christopher Moss Mr. Brian Guthrie, Executive Director

This document is not copyrighted. Readers may make additional copies of this report as needed. In addition, most State Auditor’s Office reports may be downloaded from our Web site: www.sao.texas.gov. In compliance with the Americans with Disabilities Act, this document may also be requested in alternative formats. To do so, contact our report request line at (512) 936-9500 (Voice), (512) 936-9400 (FAX), 1-800-RELAY-TX (TDD), or visit the Robert E. Johnson Building, 1501 North Congress Avenue, Suite 4.224, Austin, Texas 78701. The State Auditor’s Office is an equal opportunity employer and does not discriminate on the basis of race, color, religion, sex, national origin, age, or disability in employment or in the provision of services, programs, or activities. To report waste, fraud, or abuse in state government call the SAO Hotline: 1-800-TX-AUDIT.

TAB 3C

A Classification Compliance Audit Report on Information Technology Positions at Selected Education Agencies
Report No. 18-701; Released October 2017 Page 1 of 4
Background
The objective of this classification compliance audit was to determine whether the selected education agencies conformed to the State’s Position Classification Plan by ensuring proper classification of employees. The agencies self-reported the classification information on which this audit focused.

A Classification Compliance Audit Report on Information Technology Positions at Selected Education Agencies
Report No. 18-701; Released October 2017 Page 2 of 4
Overall Conclusion
Auditors rated the audit findings as noted below.
Summary of Chapters and Related Issue Ratings a
Chapter Title Issue Rating
1 Information Technology Occupational Category at Selected Education Agencies Low
2-A Analysis of Misclassified Employees at the Teacher Retirement System Low
a Auditors used professional judgement and rated the audit findings identified in this report. The issue ratings were determined based on the degree of risk or effect of the findings in relation to the audit objective(s). A description of the issue ratings and other factors considered are included in Appendix 2 of the audit report.
A Classification Compliance Audit Report on Information Technology Positions at Selected Education Agencies
Report No. 18-701; Released October 2017 Page 3 of 4
Information Technology Occupational Category at Selected Education Agencies
The Information Technology occupational category includes job classification series such as programmers, systems analysts, network specialists, and data base administrators.
Those job classification series and other job classification series performing information technology work are among those that may grow faster than other job classification series in the State’s Position Classification Plan.

A Classification Compliance Audit Report on Information Technology Positions at Selected Education Agencies
Report No. 18-701; Released October 2017 Page 4 of 4
Analysis of Misclassified Employees at TRS
Of the 97 employees tested at the Teacher Retirement System (TRS), 80 (82.5 percent) were correctly classified.
TRS took appropriate action to address the 17 misclassified employees and reclassified the employees into different job classification series.
There was no cost associated with reclassifying the employees.
State Auditor’s Office reports are available on the Internet at http://www.sao.texas.gov/.
A Classification Compliance Audit Report on
Information Technology Positions at Selected Education Agencies
October 2017 Report No. 18-701

A Classification Compliance Audit Report on
Information Technology Positions at Selected Education Agencies
SAO Report No. 18-701 October 2017
This audit was conducted in accordance with Texas Government Code, Sections 654.036 and 654.038.
For more information regarding this report, please contact John Young, Audit Manager, or Lisa Collier, First Assistant State Auditor, at (512) 936-9500.
Overall Conclusion
A total of 279 (86.9 percent) of the 321 employees tested were classified correctly in accordance with the State’s Position Classification Plan. Employees tested included those classified within the Information Technology occupational category, as well as others performing similar work, at the following four education agencies:
Teacher Retirement System (TRS).
Texas Education Agency (TEA).
Texas School for the Blind and Visually Impaired (TSBVI).
Texas School for the Deaf (TSD).
The agencies self-reported the classification information on which this audit focused.
The agencies have taken or reported they will take appropriate action to address the 42 misclassified employees by:
Reclassifying 37 employees into a different job classification series. For example, TSD reclassified a systems analyst to a program specialist.
Reclassifying 5 employees within the same job classification series but at a higher salary group.
There was no cost associated with the agencies’ addressing the misclassified employees. No employees received a decrease in salary as a result of this audit.
Background Information
Texas Government Code, Sections 654.036 (2) and (3), specify that the State Auditor’s Office’s State Classification Team “shall advise and assist state agencies in equitably and uniformly applying the [state position classification] plan and conduct classification compliance audits to ensure conformity with the plan.”
The audit summarized in this report focused on four agencies in Article III (Education) of the General Appropriations Act.
Definitions
Occupational Category - An occupational category is a broad series of job families characterized by the nature of work performed. Currently, the Position Classification Plan covers 27 occupational categories (for example, Social Services, Medical and Health, and Criminal Justice).
Job Classification - An individual job within a job classification series. Each job classification has a corresponding salary group assignment appropriate for the type and level of work being performed.
Job Classification Series - A hierarchical structure of jobs arranged into job classification titles involving work of the same nature but requiring different levels of responsibility.
Reclassification – The act of changing a position from one job classification to another job classification that better reflects the level or type of work being performed.

A Classification Compliance Audit Report on Information Technology Positions at Selected Education Agencies
SAO Report No. 18-701
ii
Table 1 summarizes the misclassifications identified during this audit.
Table 1
Summary of Employee Tested by Agency
Agency Number Agency Name
Number of Employees
Tested
Number of Employees
Misclassified
Percent of Employees
Misclassified
323 Teacher Retirement System
97 17 17.5%
701 Texas Education Agency 201 21 10.4%
771 Texas School for the Blind and Visually Impaired
14 2 14.3%
772 Texas School for the Deaf
9 2 22.2%
Totals 321 42 13.1%
Table 2 presents a summary of the findings in this report and the related issue ratings. (See Appendix 2 for more information about the issue rating classifications and descriptions.)
Table 2
Summary of Chapters/Subchapters and Related Issue Ratings
Chapter/ Subchapter Title Issue Rating a
1 Information Technology Occupational Category at Selected Education Agencies Low
2-A Analysis of Misclassified Employees at the Teacher Retirement System Low
2-B Analysis of Misclassified Employees at the Texas Education Agency Low
2-C Analysis of Misclassified Employees at the Texas School for the Blind and Visually Impaired
Low
2-D Analysis of Misclassified Employees at the Texas School for the Deaf Low
a A chapter/subchapter is rated Priority if the issues identified present risks or effects that if not addressed could critically affect the audited entity’s ability to effectively administer the program(s)/function(s) audited. Immediate action is required to address the noted concern and reduce risks to the audited entity.
A chapter/subchapter is rated High if the issues identified present risks or effects that if not addressed could substantially affect the audited entity’s ability to effectively administer the program(s)/function(s) audited. Prompt action is essential to address the noted concern and reduce risks to the audited entity.
A chapter/subchapter is rated Medium if the issues identified present risks or effects that if not addressed could moderately affect the audited entity’s ability to effectively administer program(s)/function(s) audited. Action is needed to address the noted concern and reduce risks to a more desirable level.
A chapter/subchapter is rated Low if the audit identified strengths that support the audited entity’s ability to administer the program(s)/functions(s) audited or the issues identified do not present significant risks or effects that would negatively affect the audited entity’s ability to effectively administer the program(s)/function(s) audited.

A Classification Compliance Audit Report on Information Technology Positions at Selected Education Agencies
SAO Report No. 18-701
iii
Summary of Management’s Response
At the end of Chapter 2-B, the State Auditor’s Office made a recommendation to TEA management to address the issues identified during this audit. TEA agreed with the recommendation.
Audit Objective and Scope
The objective of this classification compliance audit was to determine whether agencies are conforming to the State’s Position Classification Plan by ensuring proper classification of employees.
The scope of this audit included 321 employees within the Information Technology occupational category, as well as others performing similar work, at four agencies in Article III (Education) of the General Appropriations Act as of March 27, 2017. The agencies audited included TRS, TEA, TSBVI, and TSD.

Contents
Detailed Results
Chapter 1 Information Technology Occupational Category at Selected Education Agencies ........................................ 1
Chapter 2 Analysis of Employees Classified in the Information Technology Occupational Category at Selected Education Agencies .................................................... 3
Appendices
Appendix 1 Objective, Scope, and Methodology .............................. 10
Appendix 2 Issue Rating Classifications and Descriptions .................... 13

A Classification Compliance Audit Report on Information Technology Positions at Selected Education Agencies SAO Report No. 18-701
October 2017 Page 1
Detailed Results
Chapter 1
Information Technology Occupational Category at Selected Education Agencies
A total of 279 (86.9 percent) of 321 employees classified in the Information Technology occupational category at the Teacher Retirement System (TRS), the Texas Education Agency (TEA), the Texas School for the Blind and Visually
Impaired (TSBVI), and the Texas School for the Deaf (TSD), as well as employees identified as performing similar work but classified in other job classification series at those agencies, were classified correctly in accordance with the State’s Position Classification Plan.
The Information Technology occupational category includes job classification series such as programmers, systems analysts, network specialists, and data base administrators. Those job classification series and other job classification series performing information technology work are among those that may grow faster than other job classification series in the State’s Position Classification Plan (see text box). Table 3 on the next page lists the number of misclassified employees in each job classification series within the Information Technology occupational category, as well as employees performing similar work in another occupational category. The four agencies
have taken or reported they will take appropriate action to resolve the 42 misclassified employees (see Chapter 2).
1 Chapter 1 is rated Low because the audit identified strengths that support the audited entities’ ability to administer the program(s)/functions(s) audited or the issues identified do not present significant risks or effects that would negatively affect the audited entities’ ability to effectively administer the program(s)/function(s) audited.
Chapter 1 Rating:
Low 1
High-growth Jobs
According to the U.S. Bureau of Labor Statistics, employment of information technology occupations is projected to grow 12 percent from 2014 to 2024, faster than the average for all occupations. That high growth is attributed, in part, to a greater emphasis on cloud computing, the collection and storage of big data, and the continued demand for mobile computing.
Source: https://www.bls.gov/ooh/computer-and-information-technology/home.htm
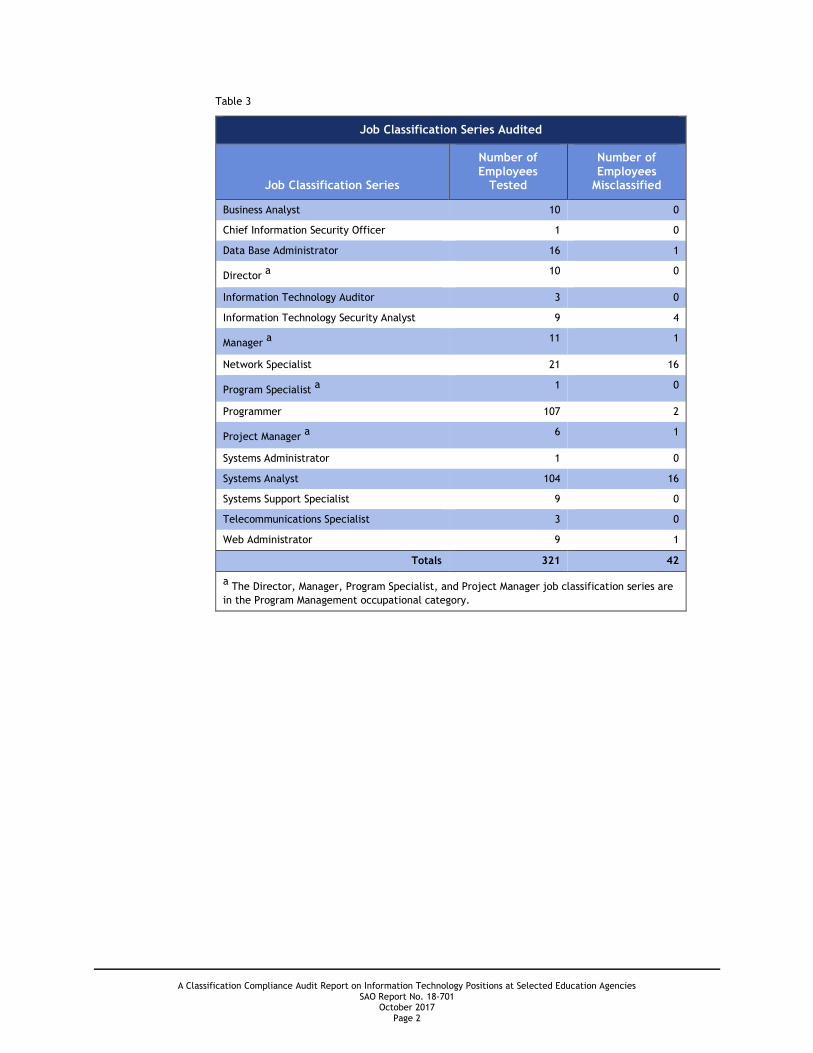
A Classification Compliance Audit Report on Information Technology Positions at Selected Education Agencies SAO Report No. 18-701
October 2017 Page 2
Table 3
Job Classification Series Audited
Job Classification Series
Number of Employees
Tested
Number of Employees
Misclassified
Business Analyst 10 0
Chief Information Security Officer 1 0
Data Base Administrator 16 1
Director a 10 0
Information Technology Auditor 3 0
Information Technology Security Analyst 9 4
Manager a 11 1
Network Specialist 21 16
Program Specialist a 1 0
Programmer 107 2
Project Manager a 6 1
Systems Administrator 1 0
Systems Analyst 104 16
Systems Support Specialist 9 0
Telecommunications Specialist 3 0
Web Administrator 9 1
Totals 321 42
a The Director, Manager, Program Specialist, and Project Manager job classification series are in the Program Management occupational category.

A Classification Compliance Audit Report on Information Technology Positions at Selected Education Agencies SAO Report No. 18-701
October 2017 Page 3
Chapter 2
Analysis of Employees Classified in the Information Technology Occupational Category at Selected Education Agencies
As discussed in Chapter 1, the State Auditor’s Office identified 42 employees within the Information Technology occupational category, as well as others performing similar work, who were misclassified. The four agencies audited have taken or reported they will take appropriate action to resolve the 42 misclassified employees identified.
Appropriate job classifications are important in determining salary rates that are competitive for the nature of the work performed. Misclassified employees may result in an agency underpaying or overpaying employees for the nature of work being performed.
Table 4 summarizes the number of employees tested and misclassified at each agency.
Table 4
Summary of Employees Tested by Agency
Agency Number Agency Name
Number of Employees
Tested
Number of Employees
Misclassified
Percent of Employees
Misclassified
323 Teacher Retirement System
97 17 17.5%
701 Texas Education Agency 201 21 10.4%
771 Texas School for the Blind and Visually Impaired
14 2 14.3%
772 Texas School for the Deaf 9 2 22.2%
Totals 321 42 13.1%
Misclassified Employees
The four agencies have taken or reported that they will take the following actions to address the 42 employees who were misclassified:
Reclassify 37 employees into a different job classification series. For example, TSD reclassified a systems analyst to a program specialist.
Reclassify 5 employees within the same job classification series but at a higher salary group.
Of the 42 misclassified employees, 37 (88.1 percent) were misclassified because the agencies did not use a more appropriate job classification series.

A Classification Compliance Audit Report on Information Technology Positions at Selected Education Agencies SAO Report No. 18-701
October 2017 Page 4
The agencies have reclassified or reported that they will reclassify the misclassified employees without changing their salaries. No employees will receive a reduction in salary as a result of the reclassifications.

A Classification Compliance Audit Report on Information Technology Positions at Selected Education Agencies SAO Report No. 18-701
October 2017 Page 5
Chapter 2-A
Analysis of Misclassified Employees at the Teacher Retirement System
Of the 97 employees tested at the Teacher Retirement System (TRS), 80 (82.5 percent) were correctly classified. TRS took appropriate action to address the 17 misclassified employees and reclassified those employees into different job classification series (see Table 5). There was no cost associated with reclassifying the employees. To protect the confidentiality of the employees who were misclassified, each employee was assigned an employee number.
Table 5
Employees Reclassified into a Different Job Classification Series at TRS
Employee Number
Job Classification Title Before Reclassification
Job Classification Title After Reclassification
1 Network Specialist V Systems Administrator V
2 Network Specialist III Systems Administrator III
4 Network Specialist VI Systems Administrator VI
8 Network Specialist V Systems Administrator V
11 Network Specialist II Systems Administrator II
14 Network Specialist II Systems Administrator II
33 Network Specialist IV Systems Administrator IV
42 Systems Analyst VI Information Technology Security Analyst III
46 Network Specialist V Systems Administrator V
47 Network Specialist V Systems Administrator V
51 Network Specialist VI Systems Administrator VI
57 Network Specialist II Systems Administrator II
63 Network Specialist II Systems Administrator II
66 Network Specialist V Systems Administrator V
79 Network Specialist V Systems Administrator V
83 Network Specialist II Systems Administrator II
87 Network Specialist II Systems Administrator II
2 Chapter 2-A is rated Low because the audit identified strengths that support the audited entity’s ability to administer the
program(s)/functions(s) audited or the issues identified do not present significant risks or effects that would negatively affect the audited entity’s ability to effectively administer the program(s)/function(s) audited.
Chapter 2-A Rating:
Low 2

A Classification Compliance Audit Report on Information Technology Positions at Selected Education Agencies SAO Report No. 18-701
October 2017 Page 6
Chapter 2-B
Analysis of Misclassified Employees at the Texas Education Agency
Of the 201 employees tested at the Texas Education Agency (TEA), 180 (89.6 percent) were correctly classified. TEA asserted that it will take appropriate action to address the 21 misclassified employees. Specifically, TEA asserted that it will:
Reclassify 18 of the 201 employees into a different job classification series (see Table 6).
Reclassify 3 of the 201 employees into the same job classification series with a higher salary group (see Table 7).
TEA asserted that there will be no cost associated with reclassifying the employees and no employee will receive a reduction in salary as a result of the reclassifications.
Table 6 shows the 18 employees that TEA has asserted that it will reclassify into a different job classification series. To protect the confidentiality of the employees who were misclassified, each employee was assigned an employee number.
Table 6
Employees to Be Reclassified into a Different Job Classification Series at TEA
Employee Number
Job Classification Title Before Reclassification
Job Classification Title After Reclassification
7 Systems Analyst V Business Analyst III
13 Information Technology Security Analyst III Cybersecurity Analyst II
38 Systems Analyst V Business Analyst III
48 Systems Analyst V Programmer V
51 Systems Analyst VI Manager V
52 Systems Analyst V Programmer V
60 Systems Analyst V Business Analyst III
63 Information Technology Security Analyst I Systems Analyst V
74 Information Technology Security Analyst II Cybersecurity Analyst II
86 Information Technology Security Analyst II Cybersecurity Analyst II
92 Systems Analyst V Business Analyst III
102 Systems Analyst V Business Analyst III
119 Systems Analyst V Business Analyst III
147 Systems Analyst V Programmer V
3 Chapter 2-B is rated Low because the audit identified strengths that support the audited entity’s ability to administer the
program(s)/functions(s) audited or the issues identified do not present significant risks or effects that would negatively affect the audited entity’s ability to effectively administer the program(s)/function(s) audited.
Chapter 2-B Rating:
Low 3

A Classification Compliance Audit Report on Information Technology Positions at Selected Education Agencies SAO Report No. 18-701
October 2017 Page 7
Employees to Be Reclassified into a Different Job Classification Series at TEA
Employee Number
Job Classification Title Before Reclassification
Job Classification Title After Reclassification
160 Systems Analyst V Programmer V
165 Systems Analyst VI Manager V
189 Manager V Information Security Officer
204 Project Manager IV Director II
Table 7 shows the 3 employees that TEA asserted that it will reclassify within the same job classification series with a higher salary group.
Table 7
Employees to Be Reclassified Within the Same Job Classification Series With a Higher Salary Group at TEA
Employee Number
Job Classification Title Before Reclassification
Job Classification Title After Reclassification
3 Systems Analyst III Systems Analyst IV
100 Programmer III Programmer IV
142 Data Base Administrator V Data Base Administrator VI
Recommendation
TEA should complete all reclassifications for employees identified as misclassified during this audit and notify the employees.
Management’s Response
TEA agrees with the recommendations to complete all reclassifications for employees identified as misclassified during this audit and notify the employees. 18 employees will be reclassified into a different job classification series and 3 employees will be reclassified with the same job classification series but at a higher salary group. No employee will receive a decrease in salary as a result of this audit. The employees affected will be notified of this change.
Person Responsible: Interim Human Resources Director
Completion Date: 1/31/2018 or sooner, if applicable.

A Classification Compliance Audit Report on Information Technology Positions at Selected Education Agencies SAO Report No. 18-701
October 2017 Page 8
Chapter 2-C
Analysis of Misclassified Employees at the Texas School for the Blind and Visually Impaired
Of the 14 employees tested at the Texas School for the Blind and Visually Impaired (TSBVI), 12 (85.7 percent) were correctly classified. TSBVI took appropriate action to address the two misclassified employees and reclassified those employees into the same job classification series but in job classifications with a higher salary group (see Table 8). There was no cost associated with reclassifying the employees. To protect the confidentiality of the employees who were misclassified, each employee was assigned an employee number.
Table 8
Employees Reclassified Within the Same Job Classification Series With a Higher Salary Group at TSBVI
Employee Number Job Classification Title Before Reclassification
Job Classification Title After Reclassification
1 Web Administrator II Web Administrator III
12 Programmer III Programmer IV
4 Chapter 2-C is rated Low because the audit identified strengths that support the audited entity’s ability to administer the
program(s)/functions(s) audited or the issues identified do not present significant risks or effects that would negatively affect the audited entity’s ability to effectively administer the program(s)/function(s) audited.
Chapter 2-C Rating:
Low 4

A Classification Compliance Audit Report on Information Technology Positions at Selected Education Agencies SAO Report No. 18-701
October 2017 Page 9
Chapter 2-D
Analysis of Misclassified Employees at the Texas School for the Deaf
Of the 9 employees tested at the Texas School for the Deaf (TSD), 7 (77.8 percent) were correctly classified. TSD took appropriate action to address the 2 misclassified employees and reclassified both employees into a different job classification series (see Table 9). There was no cost associated with reclassifying the employees. To protect the confidentiality of the employees who were misclassified, each employee was assigned an employee number.
Table 9
Employees Reclassified into a Different Job Classification Series at TSD
Employee Number Job Classification Title Before Reclassification
Job Classification Title After Reclassification
2 Systems Analyst II Program Specialist III
5 Systems Analyst VI Director I
5 Chapter 2-D is rated Low because the audit identified strengths that support the audited entity’s ability to administer the
program(s)/functions(s) audited or the issues identified do not present significant risks or effects that would negatively affect the audited entity’s ability to effectively administer the program(s)/function(s) audited.
Chapter 2-D Rating:
Low 5

A Classification Compliance Audit Report on Information Technology Positions at Selected Education Agencies SAO Report No. 18-701
October 2017 Page 10
Appendices
Appendix 1
Objective, Scope, and Methodology
Objective
The objective of this classification compliance audit was to determine whether agencies are conforming to the State’s Position Classification Plan by ensuring proper classification of employees.
Scope
The scope of this audit covered 321 employees within the Information Technology occupational category, as well as others performing similar work, at four agencies in Article III (Education) of the General Appropriations Act as of March 27, 2017. The agencies audited included the Teacher Retirement System (TRS), the Texas Education Agency (TEA), the Texas School for the Blind and Visually Impaired (TSBVI), and the Texas School for the Deaf (TSD).
Methodology
The audit methodology included collecting information and documentation, reviewing and analyzing surveys completed by employees at the four agencies and verified by their supervisors, and conducting interviews with management at the four agencies.
The State Auditor’s Office’s State Classification Team evaluates jobs on a “whole job” basis to determine proper job classifications. The determinations are primarily based on a comparison of duties and responsibilities of the majority of work being performed against the state job description.
When determining proper classification, the State Classification Team does not focus on specific differences between one level and the next level in a job classification series (for example, Programmer I versus Programmer II). Instead, the State Classification Team considers whether an employee is appropriately classified within broad responsibility levels, such as Staff Programmer (Programmer I, Programmer II, and Programmer III positions) as compared to Senior Programmer (Programmer IV, Programmer V, and Programmer VI positions).
The State Classification Team used an automated job evaluation process. The State Classification Team populated a database with information regarding the employees whose positions were tested. Employees at the

A Classification Compliance Audit Report on Information Technology Positions at Selected Education Agencies SAO Report No. 18-701
October 2017 Page 11
four agencies verified the information to ensure that all employees within the audit scope were included. Employees at the four agencies were then asked to complete online surveys describing the work they perform and the percentage of time they spend performing their duties. Supervisors were asked to review and verify employees’ survey responses.
Completed survey results were entered into an automated job evaluation system, which made an initial determination of whether the employees were appropriately classified. The State Classification Team reviewed all surveys to determine and validate the proper classification of employees. The State Classification Team made follow-up calls or sent clarification emails to gather additional information to determine the proper classification of employees. Each agency then had the opportunity to review and address potential misclassifications.
Data Reliability and Completeness
The State Auditor’s Office determined that the data in the Classification Compliance Audit System was reliable for the purposes of this audit.
Information collected and reviewed included the following:
Surveys completed by employees and verified by their supervisors.
Correspondence from the human resources offices and supervisors at the four agencies.
Procedures and tests conducted included the following:
Interviewed management at the four agencies’ human resources offices regarding the classification of employees.
Performed follow-up calls and sent emails to the four agencies to validate proper classification of employees and to gather additional information to resolve discrepancies.
Criteria used included the following:
Texas Government Code, Chapter 654.
State job descriptions.

A Classification Compliance Audit Report on Information Technology Positions at Selected Education Agencies SAO Report No. 18-701
October 2017 Page 12
Project Information
Audit fieldwork was conducted from March 2017 through September 2017. We conducted this performance audit in accordance with generally accepted government auditing standards. Those standards require that we plan and perform the audit to obtain sufficient, appropriate evidence to provide a reasonable basis for our findings and conclusions based on our audit objectives. We believe that the evidence obtained provides a reasonable basis for our findings and conclusions based on our audit objectives.
The following members of the State Auditor’s staff performed the audit:
Kathy-Ann Moe, MBA (Project Manager)
Juan R. Sanchez, MPA, CIA, CGAP (Assistant Project Manager)
Sharon Schneider, CCP, PHR, SHRM-CP
Michelle Ann Duncan Feller, CPA, CIA (Quality Control Reviewer)
John Young, MPAff (Audit Manager)

A Classification Compliance Audit Report on Information Technology Positions at Selected Education Agencies SAO Report No. 18-701
October 2017 Page 13
Appendix 2
Issue Rating Classifications and Descriptions
Auditors used professional judgement and rated the audit findings identified in this report. Those issue ratings are summarized in the report chapters/sub-chapters. The issue ratings were determined based on the degree of risk or effect of the findings in relation to the audit objective(s).
In determining the ratings of audit findings, auditors considered factors such as financial impact; potential failure to meet program/function objectives; noncompliance with state statute(s), rules, regulations, and other requirements or criteria; and the inadequacy of the design and/or operating effectiveness of internal controls. In addition, evidence of potential fraud, waste, or abuse; significant control environment issues; and little to no corrective action for issues previously identified could increase the ratings for audit findings. Auditors also identified and considered other factors when appropriate.
Table 10 provides a description of the issue ratings presented in this report.
Table 10
Summary of Issue Ratings
Issue Rating Description of Rating
Low The audit identified strengths that support the audited entity’s ability to administer the program(s)/functions(s) audited or the issues identified do not present significant risks or effects that would negatively affect the audited entity’s ability to effectively administer the program(s)/function(s) audited.
Medium Issues identified present risks or effects that if not addressed could moderately affect the audited entity’s ability to effectively administer program(s)/function(s) audited. Action is needed to address the noted concern(s) and reduce risks to a more desirable level.
High Issues identified present risks or effects that if not addressed could substantially affect the audited entity’s ability to effectively administer the program(s)/function(s) audited. Prompt action is essential to address the noted concern(s) and reduce risks to the audited entity.
Priority Issues identified present risks or effects that if not addressed could critically affect the audited entity’s ability to effectively administer the program(s)/function(s) audited. Immediate action is required to address the noted concern(s) and reduce risks to the audited entity.

Copies of this report have been distributed to the following:
Legislative Audit Committee The Honorable Dan Patrick, Lieutenant Governor, Joint Chair The Honorable Joe Straus III, Speaker of the House, Joint Chair The Honorable Jane Nelson, Senate Finance Committee The Honorable Robert Nichols, Member, Texas Senate The Honorable John Zerwas, House Appropriations Committee The Honorable Dennis Bonnen, House Ways and Means Committee
Office of the Governor The Honorable Greg Abbott, Governor
Teacher Retirement System Members of the Teacher Retirement System Board of Trustees
Mr. R. David Kelly, Chair Ms. Dolores Ramirez, Vice Chair Ms. T. Karen Charleston Mr. Joe Colonnetta Mr. David Corpus Mr. John Elliott Dr. Greg Gibson Mr. Christopher Moss
Mr. Brian Guthrie, Executive Director
Texas Education Agency Members of the State Board of Education
Ms. Donna Bahorich, Chair Mr. Marty Rowley, Vice Chair Mr. Ruben Cortez Jr., Secretary Mr. Lawrence A. Allen Jr. Ms. Erika Beltran Mr. David Bradley Mrs. Barbara Cargill Dr. Keven Ellis Ms. Patricia Hardy Mr. Tom Maynard Ms. Sue Melton-Malone Mr. Ken Mercer Ms. Geraldine Miller Ms. Georgina C. Perez Ms. Marisa B. Perez-Diaz
Mr. Mike Morath, Commissioner of Education

Texas School for the Blind and Visually Impaired Members of the School for the Blind and Visually Impaired Board of Trustees
Mr. Joseph Muniz, Board President Ms. Mary Alexander, Board Vice President Dr. Anne Corn Ms. Caroline K. Daley Mr. Bobby Druesedow, Jr. Mr. Michael Garrett Mr. Michael Hanley Mr. Bruce Lee Sonnenberg
Mr. Bill Daugherty, Superintendent
Texas School for the Deaf Members of the School for the Deaf Governing Board
Mr. Eric Hogue, President Dr. Shawn Saladin, Vice President Ms. Angie Wolf, Secretary Ms. Sha Cowan Mr. Ryan Hutchison Mr. Tyran P. Lee Ms. Susan Ridley Mr. David Saunders
Ms. Claire Bugen, Superintendent

This document is not copyrighted. Readers may make additional copies of this report as needed. In addition, most State Auditor’s Office reports may be downloaded from our Web site: www.sao.texas.gov. In compliance with the Americans with Disabilities Act, this document may also be requested in alternative formats. To do so, contact our report request line at (512) 936-9500 (Voice), (512) 936-9400 (FAX), 1-800-RELAY-TX (TDD), or visit the Robert E. Johnson Building, 1501 North Congress Avenue, Suite 4.224, Austin, Texas 78701. The State Auditor’s Office is an equal opportunity employer and does not discriminate on the basis of race, color, religion, sex, national origin, age, or disability in employment or in the provision of services, programs, or activities. To report waste, fraud, or abuse in state government call the SAO Hotline: 1-800-TX-AUDIT.

TAB 4

Presentation to the Board of Trustees for the year
ended August 31, 2017
December 15, 2017
Presented by: Dan Barron and Bhakti Patel

Presentation to the Board of Trustees and Audit Committee of the Texas Teacher Retirement System 2
To achieve our global vision, we capitalize on our strengths by
embracing the following values:
• Unite through global Collaboration
• Demonstrate Leadership in all we do
• Promote a consistent culture of Excellence
• Act with Agility
• Ensure deep Respect for people
• Take Responsibility for our actions
Our values serve as the foundation of each step we take toward achieving our
vision. They guide our decision-making and provide a framework for our people
to make correct and appropriate choices.
Our Values are CLEARR

Responsibilities

Presentation to the Board of Trustees and Audit Committee of the Texas Teacher Retirement System 4
Our Responsibilities
We are responsible for:
Performing an audit under US GAAS of the financial statements
prepared by management, with your oversight
Forming and expressing an opinion about whether the financial
statements are presented fairly, in all material respects in
accordance with US GAAP
Communicating specific matters to you on a timely basis; we do
not design our audit for this purpose.
An audit provides reasonable, not absolute, assurance that the
financial statements do not contain material misstatements due
to fraud or error. It does not relieve you or management of your
responsibilities. Our respective responsibilities are described
further in our engagement letter.

Presentation to the Board of Trustees and Audit Committee of the Texas Teacher Retirement System 5
Those Charged with Governance
and Management Responsibilities
Those Charged with Governance
Those charged with governance are responsible for:
• Overseeing the financial reporting process
• Setting a positive tone at the top and challenging the
company’s activities in the financial arena
• Discussing significant accounting and internal control matters
with management
• Informing us about fraud or suspected fraud, including its views
about fraud risks
• Informing us about other matters that are relevant to our audit,
such as:
– Entity strategies and related business risks that
may result in heightened risks of material
misstatement
– Matters warranting particular audit attention
– Significant communications with regulators
– Matters related to the effectiveness of internal
control and your oversight responsibilities
– Your views regarding our current
communications and your actions regarding
previous communications
ManagementManagement is responsible for:
• Preparing and fairly presenting the financial statements in
accordance with US GAAP
• Designing, implementing, evaluating, and maintaining
effective internal control over financial reporting
• Communicating significant accounting and internal control
matters to those charged with governance
• Providing us with unrestricted access to all persons and all
information relevant to our audit
• Informing us about fraud, illegal acts, significant deficiencies,
and material weaknesses
• Adjusting the financial statements, including disclosures, to
correct material misstatements
• Informing us of subsequent events
• Providing us with written representations

Audit Scope & Results

Presentation to the Board of Trustees and Audit Committee of the Texas Teacher Retirement System 7
Materiality
Materiality is the magnitude of an omission or
misstatement that likely influences a reasonable person's
judgment. It is ordinarily evaluated against relevant
financial statement benchmark(s).
We believe that total revenue is the relevant
benchmark(s) for the company.
Financial statement items greater than materiality are
within our audit scope. Other accounts or classes of
transactions less than materiality may be in our scope if
qualitative risk factors are present (for example, related
party relationships or significant unusual transactions).

Presentation to the Board of Trustees and Audit Committee of the Texas Teacher Retirement System 8
Areas of Audit Focus
Areas of focus Results
• Expenses
• Revenues
• Taxes
• Tax Liability
All balances were determined to be materially stated based on Grant
Thornton's audit procedures.
The following provides an overview of the areas of significant audit focus based on our risk assessments.

Presentation to the Board of Trustees and Audit Committee of the Texas Teacher Retirement System 9
Disagreements with management
We had no disagreements with management, whether or not satisfactorily resolved, about matters that individually or in the aggregate could be
significant to TRICOT’s financial statements or the auditor’s report.
Management's consultations with other accountants
We are not aware of any consultations by management with other accountants regarding accounting or auditing matters.
Significant issues discussed with management
No significant discussions with management outside of the normal course of the audit.
Other Required Communications

Presentation to the Board of Trustees and Audit Committee of the Texas Teacher Retirement System 10
Other Required Communications (continued)
Significant difficulties encountered during the audit
We did not encounter any significant difficulties during the audit.
Related parties and related party transactions
No significant related party transactions noted that were not properly recorded or disclosed.

Presentation to the Board of Trustees and Audit Committee of the Texas Teacher Retirement System 11
Other Required Communications (continued)
Modifications to the auditor's report
No modifications noted.
Other findings or issues
No other findings or issues.
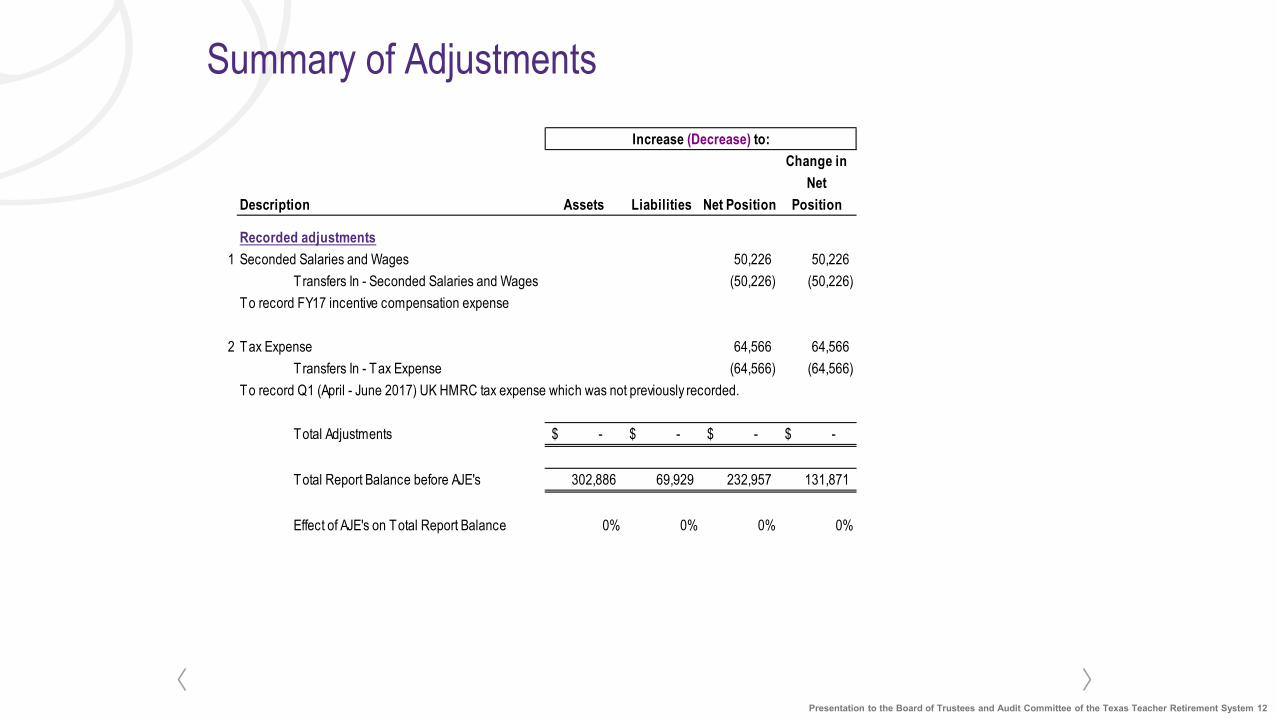
Presentation to the Board of Trustees and Audit Committee of the Texas Teacher Retirement System 12
Assets Liabilities Net Position
Change in
Net
Position
Recorded adjustments
1 Seconded Salaries and Wages 50,226 50,226
T ransfers In - Seconded Salaries and Wages (50,226) (50,226)
To record FY17 incentive compensation expense
2 Tax Expense 64,566 64,566
T ransfers In - Tax Expense (64,566) (64,566)
To record Q1 (April - June 2017) UK HMRC tax expense which was not previously recorded.
Total Adjustments -$ -$ -$ -$
Total Report Balance before AJE's 302,886 69,929 232,957 131,871
Effect of AJE's on Total Report Balance 0% 0% 0% 0%
Increase (Decrease) to:
Description
Summary of Adjustments

Presentation to the Board of Trustees and Audit Committee of the Texas Teacher Retirement System 13
Management believes the unrecorded
adjustments are immaterial to the financial
statements.
Assets Liabilities Net Position
Change in
Net
Position
Unrecorded adjustments
1 NET POSITION (32,022) (32,022)
ACCOUNTS PAYABLE 32,022
DUE FROM TRS OF TEXAS 32,022
NET POSITION 32,022 32,022
To reverse tax expense booked in current year for July and August 2016.
Reversing effect of prior year unrecorded adjustment 1,673 1,673
Total Passed Adjustments 32,022$ 32,022$ 1,673$ 1,673$
Total Balance 302,886 69,929 232,957 131,871
Effect of Passed Adjustments on Classifications 11% 46% 1% 1%
Increase (Decrease) to:
Description
Summary of Passed Adjustments
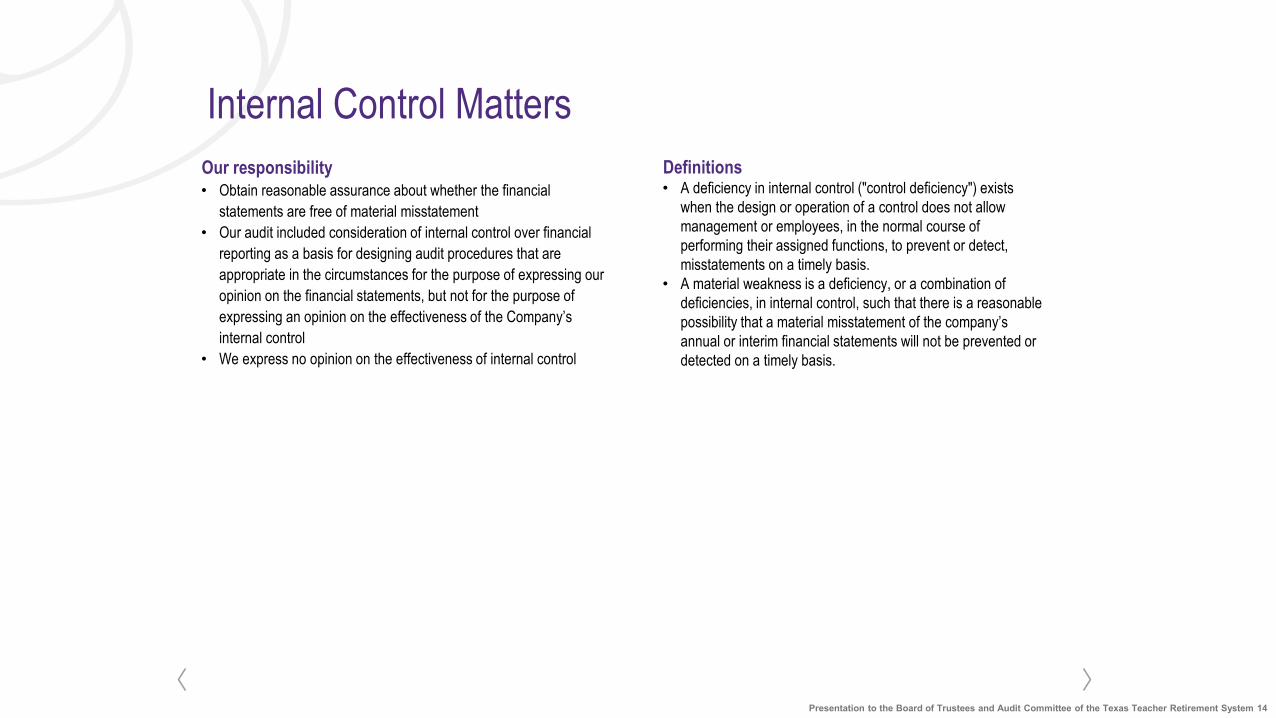
Presentation to the Board of Trustees and Audit Committee of the Texas Teacher Retirement System 14
Our responsibility• Obtain reasonable assurance about whether the financial
statements are free of material misstatement
• Our audit included consideration of internal control over financial
reporting as a basis for designing audit procedures that are
appropriate in the circumstances for the purpose of expressing our
opinion on the financial statements, but not for the purpose of
expressing an opinion on the effectiveness of the Company’s
internal control
• We express no opinion on the effectiveness of internal control
Definitions• A deficiency in internal control ("control deficiency") exists
when the design or operation of a control does not allow
management or employees, in the normal course of
performing their assigned functions, to prevent or detect,
misstatements on a timely basis.
• A material weakness is a deficiency, or a combination of
deficiencies, in internal control, such that there is a reasonable
possibility that a material misstatement of the company’s
annual or interim financial statements will not be prevented or
detected on a timely basis.
Internal Control Matters
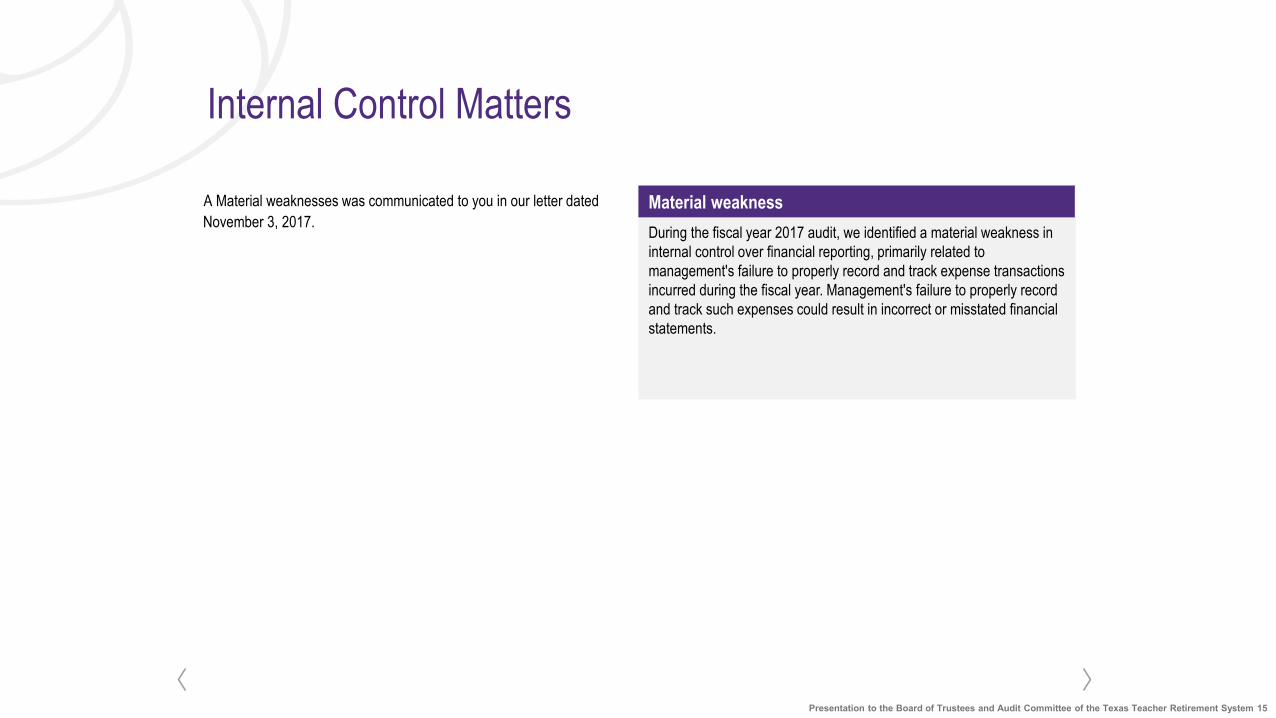
Presentation to the Board of Trustees and Audit Committee of the Texas Teacher Retirement System 15
Material weakness
During the fiscal year 2017 audit, we identified a material weakness in
internal control over financial reporting, primarily related to
management's failure to properly record and track expense transactions
incurred during the fiscal year. Management's failure to properly record
and track such expenses could result in incorrect or misstated financial
statements.
A Material weaknesses was communicated to you in our letter dated
November 3, 2017.
Internal Control Matters

Quality of Accounting Practices
and Alternative Treatments

Presentation to the Board of Trustees and Audit Committee of the Texas Teacher Retirement System 17
Quality of Accounting Practices
and Alternative Treatments
Accounting policies
• Consistent and appropriate accounting policies and their application
• No changes in accounting policies from prior year
Accounting estimates
• TRS employee salaries allocations
• Intercompany expense allocations
• Depreciation expense
We performed tests to satisfy ourselves that the amounts were free from material misstatement

Presentation to the Board of Trustees and Audit Committee of the Texas Teacher Retirement System 18
Quality of Accounting Practices
and Alternative Treatments (continued)
Disclosures
• We have assessed the financial statements and disclosures for clarity and completeness.
• Footnote disclosures in the financial statements appear overall to be neutral, consistent, and clear.
Other related matters
None noted

Other Matters

Presentation to the Board of Trustees and Audit Committee of the Texas Teacher Retirement System 20
Value for Fees
Deliverables
Report on the financial statements of the Teacher Retirement Investment Company of Texas, Ltd. ("TRICOT") as of and for the year ended
August 31, 2017
Issue written communications to management and the Audit Committee describing significant deficiencies and/or material weaknesses, if any,
noted during our audit, as applicable

Presentation to the Board of Trustees and Audit Committee of the Texas Teacher Retirement System 21
Commitment to Promote Ethical and
Professional Excellence
We are committed to promoting ethical and professional excellence.
To advance this commitment, we have put in place a phone and
Internet-based hotline system.
The Ethics Hotline (1.866.739.4134) provides individuals a means to
call and report ethical concerns.
The EthicsPoint URL link
• Can be found on our internal website
• Can be accessed from our external website
(https://secure.ethicspoint.com/domain/en/report_custom.asp?clie
ntid=15191)
Disclaimer: EthicsPoint is not meant to act as a substitute for a
company's "whistleblower" obligations.

Presentation to the Board of Trustees and Audit Committee of the Texas Teacher Retirement System 22
www.grantthornton.com
© Grant Thornton LLP
All rights reserved
Grant Thornton LLP is a member firm within Grant Thornton International Ltd. Grant
Thornton International Ltd and the member firms are not a worldwide partnership.
Services are delivered independently by the member firms.
This communication is intended solely for the information and
use of management and the Board of Trustees of the Teacher
Retirement System and is not intended to be and should not be
used by anyone other than these specified parties.

Grant Thornton LLP 111 Congress Avenue Suite 2500 Austin, TX 78701
T 512.692.1200 F 512.692.1201 www.GrantThornton.com
Grant Thornton LLP
U.S. member firm of Grant Thornton International Ltd
Ladies and Gentlemen:
In connection with our audit of Teacher Retirement Investment Company of Texas, Ltd. (the “Company”) financial statements as of August 31, 2017 and for the year then ended, auditing standards generally accepted in the United States of America (“US GAAS”) require that we advise management and the board of trustees (hereinafter referred to as “those charged with governance”) of the following internal control matters identified during our audit.
Our responsibilities
Our responsibility, as prescribed by US GAAS, is to plan and perform our audit to obtain
reasonable assurance about whether the financial statements are free of material misstatement,
whether due to fraud or error. An audit includes consideration of internal control over financial
reporting (hereinafter referred to as “internal control”) as a basis for designing audit procedures
that are appropriate in the circumstances for the purpose of expressing our opinion on the
financial statements, but not for the purpose of expressing an opinion on the effectiveness of
the Company’s internal control. Accordingly, we express no such opinion on internal control
effectiveness.
Identified deficiencies in internal control
We identified the following internal control matters that are of sufficient importance to merit
your attention.
Material weaknesses A deficiency in internal control (“control deficiency”) exists when the design or operation of a
control does not allow management or employees, in the normal course of performing their
assigned functions, to prevent, or detect and correct, misstatements on a timely basis. A
material weakness is a deficiency, or a combination of deficiencies, in internal control, such that
there is a reasonable possibility that a material misstatement of the Company’s financial
statements will not be prevented, or detected and corrected, on a timely basis.
November 3, 2017 Management and Board of Trustees Teacher Retirement Investment Company of Texas, Ltd. Austin, TX

Grant Thornton LLP
U.S. member firm of Grant Thornton International Ltd
2
Our consideration of internal control was not designed to identify all deficiencies in internal
control that, individually or in combination, might be material weaknesses; therefore, material
weaknesses may exist that were not identified. However, we consider the following identified
control deficiency to be a material weakness.
Management of the Company is responsible for the fair presentation of year-end financial
statements in accordance with generally accepted accounting principles. This includes the
responsibility for the design, implementation, and maintenance of internal control relevant to
the preparation and fair presentation of financial statements. During the fiscal year 2017 audit,
we identified a material weakness in internal control over financial reporting, primarily related
to management’s failure to properly record and track expense transactions incurred during the
fiscal year. Management’s failure to properly record and track such expenses could result in
incorrect or misstated financial statements.
We identified two (2) adjusting entries during the audit as a result of management’s lack of
appropriate controls over the financial reporting process. The details of the adjusting entries
(AJEs) are noted below:
AJE #1 – We identified tax expenses that were incurred and paid during the year that
were not included in the general ledger.
AJE #2 – We identified compensation related amounts that were accrued by the
Teacher Retirement System as of August 31, 2017; however the amounts attributable
to the Company were not included in its general ledger.
We noted that the entries above were a result of lack of internal controls over financial
reporting in order to identify material omissions from the Company’s financial statements.
Management corrected the misstatements identified above in the financial statements as of
August 31, 2017.
Recommendations to strengthen internal control
We recommend that the Company and those charged with governance consider the following
actions.
Identify the expenses directly and indirectly related to the Company in order for the
finance department to ensure all expenses have been accounted for in the Company’s
general ledger. Document which revenue stream each expense type corresponds with
in the Company’s policies and procedures.
Document each revenue stream and revenue recognition methodology in the
Company’s policies and procedures.
Perform year end analytics to identify unusual or missing expense and revenue
transactions

Grant Thornton LLP
U.S. member firm of Grant Thornton International Ltd
3
Company response
The Company’s written response to the internal control matters identified herein has not been
subjected to our audit procedures and, accordingly, we express no opinion on it.
Material Weakness in internal control over financial reporting – failure to properly record and track expense transactions incurred during the fiscal year.
AJE #1 – identified tax expenses that were incurred and paid during the year that were not included TRICOT’s general ledger.
Response: Management agrees with this finding. The omitted tax payment was for foreign taxes related to seconded employees in the amount of $64,566 that was paid through the State Treasury by wire to Her Majesty’s Revenue and Customs (HMRC) in London. TRS failed to record the payment into the budget and payment (BEVO) system, which is the system the staff relies upon for cost allocations to TRICOT. There are controls in place such as the BEVO to USAS reconciliation which could have detected the unrecorded payment related to TRICOT. Since the payment occurred late in the fiscal year the reconciling item was not recorded or escalated in time for allocations to TRICOT. The Cash in State Treasury reconciliation did detect the unrecorded entry, and an entry was made to TRS’ general ledger; however, it was not identified as being related to TRICOT. TRICOT will strengthen controls by reviewing reconciliations to ensure they have been completed in a timely manner prior to preparation of financial statements. In addition, use of the JP Morgan bank account involves fewer manual processes and will help to ensure all records remain in sync. TRS created a prefunding procedure for HMRC payments from the JP Morgan bank account. This change was effective October 2017. Procedure documentation will be updated December 2017.
AJE #2 – identified compensation related amounts that were accrued by the Teacher Retirement System as of August 21, 2017; however, the amounts attributable to the Company were not included in its general ledger.
Response: Agree - this item is related to Incentive Compensation. The payout for performance incentive compensation is made over a two-year period, and the second amount is paid out in February of the following year. This expense of $50,226, related to seconded employees of TRS and new to TRICOT this year, was not considered when performing accruals for the current year. Updating expense and revenue procedures on a yearly basis will ensure all expense and revenue items are identified and accounted for in the general ledger. Procedures will be updated December 2017.
* * *
This communication is intended solely for the information and use of management, those
charged with governance, and others within the Company and is not intended to be and should
not be used by anyone other than these specified parties.
Very truly yours,

Grant Thornton LLP 111 Congress Plaza, Suite 2500 Austin, TX 78701
T 512-692-1200 F 512-692-1201 www.GrantThornton.com
Grant Thornton LLP
U.S. member firm of Grant Thornton International Ltd
REPORT OF INDEPENDENT CERTIFIED PUBLIC ACCOUNTANTS
Board of Trustees
Teacher Retirement Investment Company of Texas, Ltd.
Report on the financial statements
We have audited the accompanying financial statements of the Teacher Retirement Investment Company of
Texas, Ltd. (“TRICOT”) as of and for the year ended August 31, 2017 and the related notes to the financial
statements, which collectively comprise TRICOT’s basic financial statements as listed in the table of contents.
Management’s responsibility for the financial statements
Management is responsible for the preparation and fair presentation of these financial statements in accordance
with accounting principles generally accepted in the United States of America; this includes the design,
implementation, and maintenance of internal control relevant to the preparation and fair presentation of
financial statements that are free from material misstatement, whether due to fraud or error.
Auditor’s responsibility
Our responsibility is to express an opinion on these financial statements based on our audit. We conducted our
audit in accordance with auditing standards generally accepted in the United States of America. Those standards
require that we plan and perform the audit to obtain reasonable assurance about whether the financial
statements are free from material misstatement.
An audit involves performing procedures to obtain audit evidence about the amounts and disclosures in the
financial statements. The procedures selected depend on the auditor’s judgment, including the assessment of
the risks of material misstatement of the financial statements, whether due to fraud or error. In making those
risk assessments, the auditor considers internal control relevant to TRICOT’s preparation and fair presentation
of the financial statements in order to design audit procedures that are appropriate in the circumstances, but
not for the purpose of expressing an opinion on the effectiveness of TRICOT’s internal control. Accordingly,
we express no such opinion. An audit also includes evaluating the appropriateness of accounting policies used
and the reasonableness of significant accounting estimates made by management, as well as evaluating the
overall presentation of the financial statements.
We believe that the audit evidence we have obtained is sufficient and appropriate to provide a basis for our
audit opinion.
Grant Thornton LLP
U.S. member firm of Grant Thornton International Ltd
Opinions
In our opinion, the financial statements referred to above present fairly, in all material respects, the financial
position of the Teacher Retirement Investment Company of Texas, Ltd. as of August 31, 2017, and the changes
in financial position for the year then ended in accordance with accounting principles generally accepted in the
United States of America.
Other matters
Required supplementary information
Accounting principles generally accepted in the United States of America require that the Management’s
Discussion and Analysis be presented to supplement the basic financial statements. Such information, although
not a required part of the basic financial statements, is required by the Governmental Accounting Standards
Board who considers it to be an essential part of financial reporting for placing the basic financial statements
in an appropriate operational, economic, or historical context. This required supplementary information is the
responsibility of management. We have applied certain limited procedures to the required supplementary
information in accordance with auditing standards generally accepted in the United States of America. These
limited procedures consisted of inquiries of management about the methods of preparing the information and
comparing the information for consistency with management’s responses to our inquiries, the basic financial
statements, and other knowledge we obtained during our audit of the basic financial statements. We do not
express an opinion or provide any assurance on the information because the limited procedures do not provide
us with sufficient evidence to express an opinion or provide any assurance.
Austin, Texas
November 3, 2017

TAB 5

TAB 5A

PRESENTATION TITLE >>> NAME FEB-09-15
PRESENTATION FOR THE AUDIT COMMITTEE BY:TRS HIB & TRUVEN HEALTH ANALYTICS
DECEMBER 15, 2017

Background of Audited Plans
• Total Enrollment – 156,000
• Three self-funded plans:• Care 1 (18%)
• Care 2 (34%)
• Care 3 (47%)
• Health Plan Administrator:Aetna
• Pharmacy Benefits Manager:Express Scripts
TRS-Care
2
• Total Enrollment – 428,000
• Three self-funded plans:• ActiveCare 1-HD (47%)
• ActiveCare Select (23%)
• ActiveCare 2 (29%)
• Health Plan Administrator:Aetna
• Pharmacy Benefits Manager:CVSHealth/Caremark
TRS-ActiveCare

Truven Health Analytics – TRS Audits
Audit Time Scope• Fiscal Year 2016 (09/01/2015 – 08/31/2016) for most plans, with the following exception of
Medicare Part D plan
• Calendar Year 2016 for the Medicare Part D plan, also called the Employer Group Waiver Plan (EGWP)
Audit Focus • Claim accuracy
• Operation review
• Performance guarantee verification
3

Truven Health Analytics – TRS Audits
Audit Result Summary• All 3 companies performing above acceptable levels on claim adjudication accuracy
• All 3 companies operates within contractual terms
• All 3 companies are accurately reporting performance guarantees
• Insignificant weaknesses were identified and will be discussed by Truven
4

Truven Health Analytics – TRS Audits
Audit Methodology – Claims• Obtain Summary Plan Descriptions (SPDs) and other benefit documentation
• Develop benefit templates based on SPDs
• Obtain claims files from administrators
• Use proprietary software to electronically re-adjudicate 100% of claims– Benefit determinations (coinsurance, copayments, deductibles, etc.)
– Compare to industry standards
5
Administrator Claim Count Paid
Aetna TRS-Care 2,989,702 $743,104,272
Aetna TRS-ActiveCare 4,209,683 $1,350,270,312
ESI – Commercial 3,179,107 $343,690,550
ESI – EGWP 4,729,493 $492,067,084
Caremark 4,468,702 $387,888,405

Truven Health Analytics – TRS Audits
Audit Methodology - Claims (continued)• Potential exceptions grouped into various categories
• Select claims samples from exception categories
• Test claims samples– Medical - on site claims audit and operational review for ActiveCare and Care
– Rx - remote claims audit and operational review for Care Commercial, EGWP, and ActiveCare
– Rx - on site audit of mail order claims for Care Commercial and EGWP
• Evaluate administrator sample responses
• Complete 100% claims analysis based on remaining sample exceptions– “Agree to”
– “Agree to disagree”
6

Truven Health Analytics – TRS Audits
7
TRS-Care Standard Health Plan Administration by Aetna for September 1, 2015 to August 31, 2016• Aetna performing above acceptable levels
• Overall claims findings in dollars are below Truven benchmark (1%-2%)– TRS-Care 0.21% (FY15 – 0.07%)
• Opportunities to clarify benefit intentions– 100% covered services ($79K), copayment application ($83K)
• Other opportunities– Coordination of benefits (COB) ($866K), surgery payments ($276K), duplicate claims ($207K)
• Recommendations– Work with Aetna to clarify intent of benefit design
– Pursue recoveries where appropriate
– Review COB system edits with Aetna

Truven Health Analytics – TRS Audits
TRS-ActiveCare Health Plan Administration by Aetna for September 1, 2015 to August 31, 2016• Aetna performing above acceptable levels
• Overall claims findings in dollars are below Truven benchmark (1%-2%)– TRS-ActiveCare 0.04% (FY15 – 0.04%)
• Opportunities to clarify benefit intentions– 100% covered services ($296K), copayment application ($70K), ineligible services ($163K)
• Recommendations– Work with Aetna to clarify intent of benefit design
– Pursue recoveries where appropriate
8

Truven Health Analytics – TRS Audits
TRS-Care Standard Plan Pharmacy Administration by ESI for September 1, 2015 to August 31, 2016• ESI performing above acceptable levels
• Overall claims findings in dollars are below Truven benchmark (1%-2%)– TRS-Care 0.09% (FY14 – 0.96%) (FY15 – 0.65%)
• Opportunities to clarify benefit intentions– Duplicate claims ($19K) and ineligible benefits ($291K)
• Recommendations– Review duplicate claim reimbursement with ESI
– Clarify intent for ineligible benefits covered without proper protocol review
9
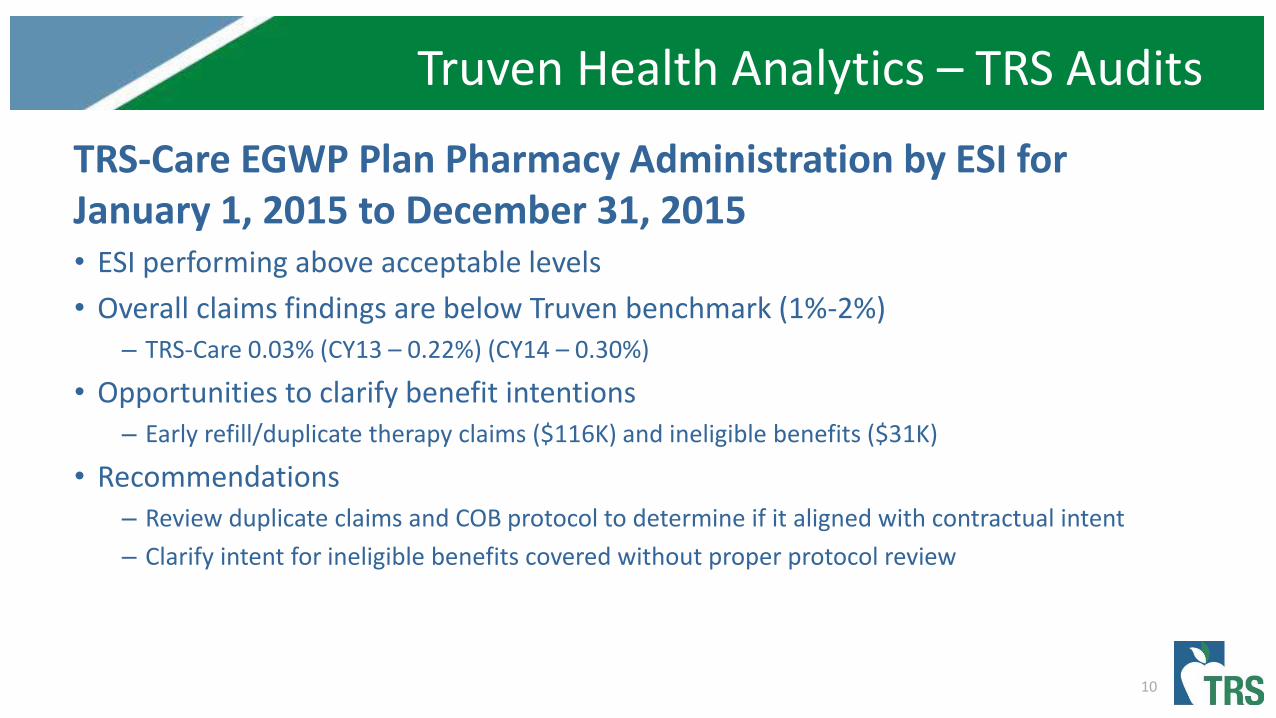
Truven Health Analytics – TRS Audits
TRS-Care EGWP Plan Pharmacy Administration by ESI for January 1, 2015 to December 31, 2015• ESI performing above acceptable levels
• Overall claims findings are below Truven benchmark (1%-2%)– TRS-Care 0.03% (CY13 – 0.22%) (CY14 – 0.30%)
• Opportunities to clarify benefit intentions– Early refill/duplicate therapy claims ($116K) and ineligible benefits ($31K)
• Recommendations– Review duplicate claims and COB protocol to determine if it aligned with contractual intent
– Clarify intent for ineligible benefits covered without proper protocol review
10
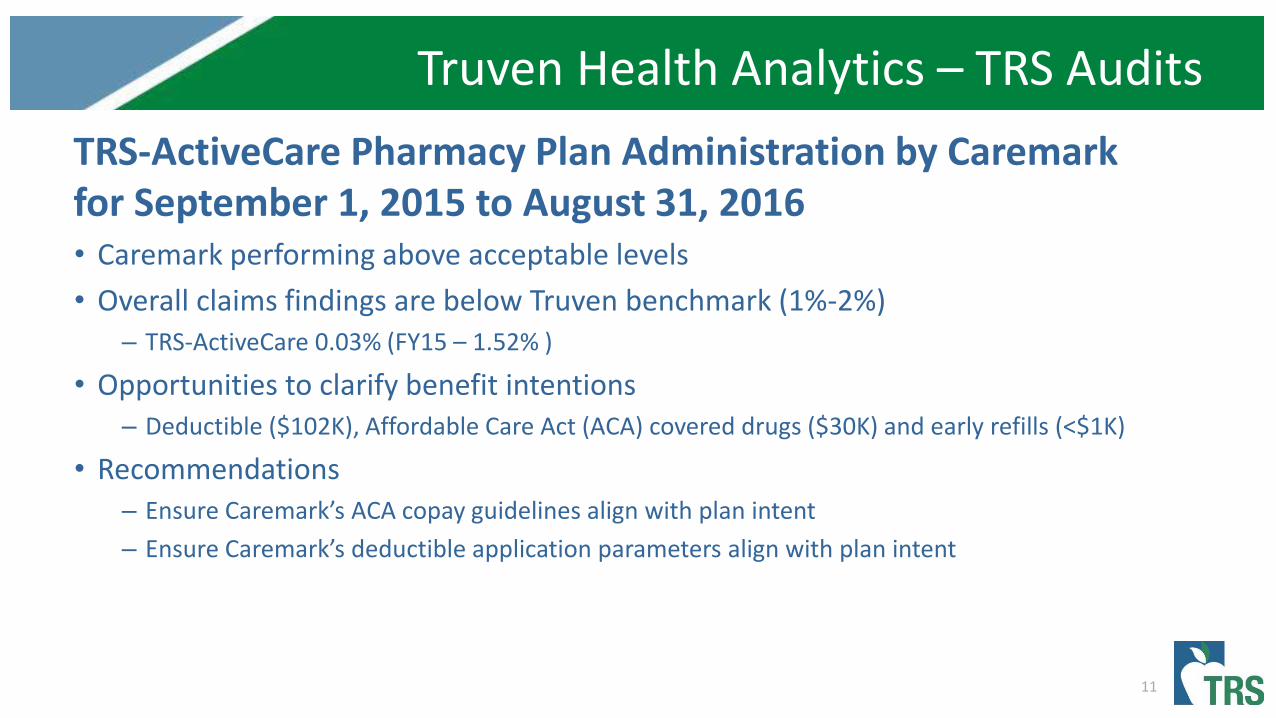
Truven Health Analytics – TRS Audits
TRS-ActiveCare Pharmacy Plan Administration by Caremark for September 1, 2015 to August 31, 2016• Caremark performing above acceptable levels
• Overall claims findings are below Truven benchmark (1%-2%)– TRS-ActiveCare 0.03% (FY15 – 1.52% )
• Opportunities to clarify benefit intentions– Deductible ($102K), Affordable Care Act (ACA) covered drugs ($30K) and early refills (<$1K)
• Recommendations– Ensure Caremark’s ACA copay guidelines align with plan intent
– Ensure Caremark’s deductible application parameters align with plan intent
11

Truven Health Analytics – TRS Audits
Vendor Responses• Vendors agree to some findings but disagree with the others
• Our investigation indicate that most of the findings disagreed by vendors from last year’s audit turned out to be false postive
Management Responses• HIB will research identified potential erroneous claims and seek corrective
actions.
• HIB will work with vendors to resolve underlying control deficiencies to reduce errors going forward.
12

TAB 5B

Teacher Retirement System of Texas Review of Health Plan Administration by Aetna for September 1, 2015, to August 31, 2016
TRS-Care Standard Plan Prepared for: Teacher Retirement System of Texas
December 15, 2017
Submitted by: Truven Health Analytics

©2017 Truven Health Analytics, LLC, Part of the IBM Watson Health business
Review of TRS-Care Plan Proprietary and Confidential
Page 2 December 15, 2017
EXECUTIVE SUMMARY Engagement Overview and Scope The Teacher Retirement System of Texas (TRS) engaged Truven Health Analytics (Truven) to conduct a health claims review to:
Assess the administration of TRS’ self-funded employee health plans by Aetna. Determine whether Aetna is in compliance with the terms of the Administrative Services
Agreement (ASA), Summary Plan Description (SPD), and other applicable documents.
This engagement primarily examined Aetna’s claims adjudication accuracy relative to all claims incurred by TRS’ plan members for TRS-Care Standard plans from September 1, 2015 to August 31, 2016 and paid through November 30, 2016. In addition, Truven was engaged to perform an operational review to assess the policies, procedures, and controls that support the administration of TRS’ health plans and to review the reporting of several performance guarantees in place between TRS and Aetna. The health plans included in the review consist of the following:
TRS-Care 1 TRS-Care 2 TRS-Care 3
From the population of potential exceptions, Truven selected a sample of 150 TRS-Care claims for onsite review. Of the 150 claims reviewed, Truven determined during the onsite review that 124 claims were processed and paid correctly. Of the remaining 26 exceptions, Aetna agreed with Truven’s assessment that there was an exception in processing 24 claims. Based on these 26 exceptions, Truven determined which types of exceptions represented systemic claims processing exceptions. This process resulted in the identification of 8,771 claims and $1,569,782 in total exceptions with $1,249,332 in net overpayments.
The following charts compare the total cost of all exceptions that were identified. The analysis is separated into two categories: exceptions identified based on the Summary Plan Description analysis and those identified based on Industry Standard and Best Practices edits. Of the 150 sample claims reviewed onsite 71 represented SPD potential exceptions and 79 represented Industry Standard and Best Practices potential exceptions.
Summary Plan Description Analysis – TRS-Care
Initial 100% Claims Analysis for SPD Exceptions
Claims Paid % Total Paid
Total claims analyzed 2,989,702 $743,104,272 100%
Claims passing Truven edits 2,843,041 $702,097,804 94.48%
Claims identified for further testing and analysis 146,661 $41,006,468 5.52%
Total claims selected for onsite review 71 $223,957 0.03%

©2017 Truven Health Analytics, LLC, Part of the IBM Watson Health business
Review of TRS-Care Plan Proprietary and Confidential
Page 3 December 15, 2017
Onsite Review Results Claims Financial Impact % of Sample
Total sample claims confirmed as correctly processed
58 $216,663 96.74%
Exceptions identified from sample 13 $7,294 3.26%
Exceptions agreed to by Aetna 12 $6,894 3.08%
“Agree to disagree” exceptions 1 $400 0.18%
Final 100% Claims Analysis Results Claims Financial Impact % Total Paid
Total exceptions identified in claims population 3,748 $219,797 0.03%
Industry Standards and Best Practices Analysis – TRS-Care
Initial 100% Claims Analysis for Industry Standards and Best Practices Exceptions
Claims
Paid
% Total Paid
Total claims analyzed 2,989,702 $743,104,272 100%
Claims passing Truven edits 2,911,816 $621,657,151 83.66%
Claims identified for further testing and analysis 77,886 $121,447,121 16.34%
Total claims selected for onsite review 79 $911,752 0.12%
Onsite Review Results Claims Financial Impact % of Sample
Total sample claims confirmed as correctly processed
66 $899,291 98.63%
Exceptions identified from sample 13 $12,461 1.37%
Exceptions agreed to by Aetna 12 $12,443 1.36%
“Agree to disagree” exceptions 1 $18 0.01%
Final 100% Claims Analysis Results Claims Financial Impact % Total Paid
Total exceptions identified in claims population 5,023 $1,349,985 0.18%
Key Findings The following is a description of the most significant exception categories and includes those categories which represent exceptions which may be systemic within Aetna’s processing system. For further details on the exceptions by category and type, please refer to Section 3, Summary of Findings by Exception Area and Appendix A, Detailed Claims Findings.
Coordination of Benefits Truven identified 2,302 claims identified across the claims population where coordination of benefits (COB) should have been applied based on indicators in the claims file. Medicare was primary on the majority of the COB claims and Aetna paid them as primary. This resulted in overpayment exceptions totaling $866,102 and should be examined further.

©2017 Truven Health Analytics, LLC, Part of the IBM Watson Health business
Review of TRS-Care Plan Proprietary and Confidential
Page 4 December 15, 2017
Surgery Payments Truven uses guidelines established by the Centers for Medicare & Medicaid Services (CMS) and the American Medical Association (AMA) to identify situations where appropriate reductions should be made for claims for surgical procedures. When multiple procedures are performed on the same day, by the same individual physician or other healthcare professional, reduction in reimbursement for the secondary and subsequent procedures should occur. Payment at 100% for secondary and subsequent procedures would represent reimbursement for duplicative components of the primary procedure. The analyses found claims for surgical procedures where reductions were not taken.
In all, there were 1,545 surgical payment claims where appropriate reductions were not applied resulting in an overpayment of $276,137. The surgery payment claims were related to assistant surgeon reduction and multiple surgical reduction. The findings for assistant surgeon reduction totaled approximately $164,000 and the findings for multiple surgical reductions totaled approximately $112,000. Modification of the claims adjudication system to prevent these exceptions would result in future savings for TRS.
Duplicate Claim Payments
There were 1,171 claims where payments were made for duplicate claims services resulting in an overpayment amount of $206,919. In the claim sample, hard duplicate facility edits identified two paid institutional claims with matching provider, patient, date of service, revenue code, procedure, and allowed amount. Hard duplicate physician edits identified two paid professional claims with matching provider, patient, date of service, procedure, modifier and allowed amount. Soft duplicate physician edits identified one paid professional claim with the same HCPCS codes for durable medical equipment. A savings opportunity exists with regards to duplicates.
Copayment Application Truven identified 1,183 claims where either an incorrect copayment amount was applied, or no copayment was taken when one should have been taken. These claims resulted in a total exception amount of $83,268 of which $2,248 were overpayments and $81,020 were underpayments. These results were related to office based services and surgeries in an office. Attention should be focused on ensuring that the correct copayment is taken for these areas.

©2017 Truven Health Analytics, LLC, Part of the IBM Watson Health business
Review of TRS-Care Plan Proprietary and Confidential
Page 5 December 15, 2017
100-Percent Coverage There were 1,623 claims identified throughout the claims population where the SPD provides for 100% coverage (no member liability), however, member liabilities were incorrectly applied. These claims totaled $79,205 in underpayments by TRS but overpayments by members. Based on the sample findings, the claims were related to services provided by Quest Labs and mammograms for members over age 35 which are covered in full for specific benefit plans. Truven recommends that internal claims processing edits be modified to adhere to the SPD benefit provisions for TRS.
Recommendations Request and review financial and claim impact analyses for all “Agreed To” exceptions and other
exceptions where Aetna was not properly adjudicating claims according to the SPD language. Where applicable, recoveries should be pursued.
Work with Aetna to clarify the intent of all the plan design features identified as exceptions. Aetna should address the issues identified that are related to the correct application of member
liability such as coinsurance and copayment to assure that members are assessed the correct amount and that claims are paid correctly for claims that require coinsurance as well as claims that are covered at 100%.
Aetna should institute edits in the claims processing system to assure that other party liability is reviewed and payment made based on primacy rules. Truven recommends that this includes additional COB training for processors, if necessary.
Aetna should review the process for multiple surgical reductions and assistant surgery reductions by instituting edits in the claims system to assure correct reductions are applied. Additional processor training is also recommended.
Exception Categories Compared to Industry Benchmarks The following chart compares Aetna’s experience for the identified exception categories to that of other Health Plans (Benchmark Exception Rate). The benchmarks are based on the claims counts for the exception category. The exception rate identified on the Aetna claims is below that of other commercial and government health plans audited by Truven with the exception of Duplicate Claim Payment.
Benchmarks – TRS-Care
Exception Category
Benchmark Exception Rate
Aetna Exception Rate FY2016
Aetna Score
100 Percent Coverage 1.70% 0.054% Below average exception rate
Coinsurance Application
4.14% 0.001% Below average exception rate
Copayment Application 4.28% 0.040% Below average exception rate
Duplicate Claims Payment
0.03% 0.039% Above average exception rate
Ineligible Services 0.35% 0.031% Below average exception rate
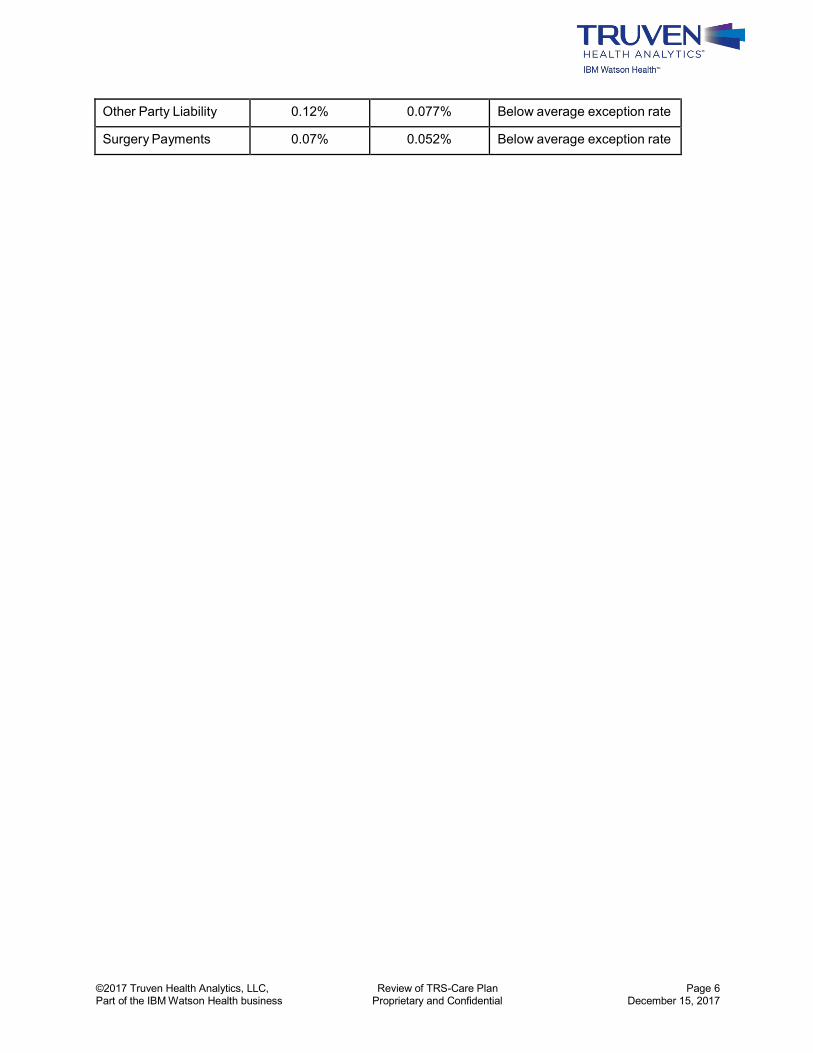
©2017 Truven Health Analytics, LLC, Part of the IBM Watson Health business
Review of TRS-Care Plan Proprietary and Confidential
Page 6 December 15, 2017
Other Party Liability 0.12% 0.077% Below average exception rate
Surgery Payments 0.07% 0.052% Below average exception rate

TAB 5C

Teacher Retirement System of Texas Review of Health Plan Administration by Aetna for September 1, 2015, to August 31, 2016
TRS-ActiveCare Prepared for: Teacher Retirement System of Texas
December 15, 2017
Submitted by: Truven Health Analytics, LLC

©2017 Truven Health Analytics, LLC, Part of the IBM Watson Health business
Review of TRS-ActiveCare Plan Proprietary and Confidential
Page 2 December 15, 2017
EXECUTIVE SUMMARY
Engagement Overview and Scope The Teacher Retirement System of Texas (TRS) engaged Truven Health Analytics (Truven) to conduct a health claims review to:
Assess the administration of TRS’s self-funded employee health plans by Aetna. Determine if Aetna is in compliance with the terms of the Administrative Services Agreement
(ASA), Summary Plan Description (SPD), and other applicable documents.
This engagement primarily examined Aetna’s claims adjudication accuracy relative to all claims incurred by TRS’s ActiveCare plan members from September 1, 2015 to August 31, 2016 and paid through November 30, 2016. In addition, Truven was engaged to perform an operational review to assess the policies, procedures, and controls that support the administration of TRS’s health plans and to review the reporting of several performance guarantees in place between TRS and Aetna. The health plans included in the review included the following:
TRS-ActiveCare 1-HD TRS-ActiveCare Select TRS- ActiveCare 2
From the population of potential exceptions, Truven selected a sample of 151 claims for onsite review that consisted of 151 claims for TRS-ActiveCare. Of the 151 claims reviewed, we determined during the onsite review that 131 claims were processed and paid correctly. Of the remaining 20 exceptions, Aetna agreed with Truven’s assessment that there was an exception in processing the claim on 18 claims.
Based on these 20 exceptions, Truven determined which types of exceptions represented systemic claims processing exceptions. For these exception categories, 100% of the claims identified are considered exceptions. This process resulted in the identification of 14,213 claims and $587,974 in total exceptions resulting in ($57,703) in net underpayments.
The following charts compare the total cost of all exceptions that were identified. The analysis is separated into two categories: exceptions identified based on the SPD analysis and those identified based on Industry Standard and Best Practices edits. Of the 151 sample claims reviewed onsite 85 represented potential SPD exceptions and 66 represented potential Industry Standard and Best Practices exceptions.
SPD Analysis – TRS-ActiveCare
Initial 100% Claims Analysis for SPD Exceptions
Claims Paid % Total Paid
Total claims analyzed 4,209,683 $1,350,270,312 100%
Claims passing Truven edits 3,914,991 $1,212,282,408 89.78%
Claims identified for further testing and analysis 294,692 $137,987,904 10.22%
Total claims selected for onsite review 85 $338,548 0.03%

©2017 Truven Health Analytics, LLC, Part of the IBM Watson Health business
Review of TRS-ActiveCare Plan Proprietary and Confidential
Page 3 December 15, 2017
Onsite Review Results Claims Financial Impact % of Sample
Total sample claims confirmed as correctly processed
69
$321,437
94.95%
Exceptions identified from sample 16 $17,111 5.05%
Exceptions agreed to by Aetna 15 $7,628 2.25%
“Agree to disagree” exceptions 1 $5 2.80%
Final 100% Claims Analysis Results Claims Financial Impact % Total Paid
Total exceptions identified in claims population 14,209 $554,216 0.04%
Industry Standards and Best Practices Analysis – TRS-ActiveCare
Initial 100% Claims Analysis for Industry Standards and Best Practices Exceptions
Claims
Paid
% Total Paid
Total claims analyzed 4,209,683 $1,350,270,312 100%
Claims passing Truven edits 4,084,416 $1,110,228,561 82.22%
Claims identified for further testing and analysis 125,267 $240,041,751 17.78%
Total claims selected for onsite review 66 $1,534,328 0.11%
Onsite Review Results Claims Financial Impact % of Sample
Total sample claims confirmed as correctly processed
62
$1,500,569
97.80%
Exceptions identified from sample 4 $33,758 2.20%
Exceptions agreed to by Aetna 3 $33,758 2.20%
“Agree to disagree” exceptions 1 - -
Final 100% Claims Analysis Results Claims Financial Impact % Total Paid
Total exceptions identified in claims population 4 $33,758 0.00%
Key Findings The following is a description of the most significant exception categories and includes categories representing errors which may be systemic within Aetna’s processing system.
100% Coverage There were 6,926 claims identified throughout the claims population where the SPD provides for 100% coverage (no member liability) but member liabilities were incorrectly applied. These resulted in $296,489 in underpayments. Adherence to the SPD benefit provisions will assure member cost is minimized. These services included mammograms, breast cancer screenings, preventive lab tests, routine medical exams, and routine gynecological exams.

©2017 Truven Health Analytics, LLC, Part of the IBM Watson Health business
Review of TRS-ActiveCare Plan Proprietary and Confidential
Page 4 December 15, 2017
Ineligible Services There were 535 claims for ineligible services identified as being paid incorrectly during the audit period. This resulted in an overpayment of $162,969. Claims for ineligible services should be denied. This represents a recovery opportunity for TRS. The majority of the findings from a financial perspective were for removal of wisdom teeth and outpatient private duty nursing.
Copayment Application There were 3,358 claims where either an incorrect copayment amount was applied, or no copayment was taken when one should have been taken. These claims resulted in an exception amount of $70,625 of which $47,447 were overpayments and $23,178 were underpayments. These results were related to inpatient newborn care and physical therapy.
Recommendations Request and review financial and claim impact analyses for all “Agreed To” exceptions and other
exceptions where Aetna was not properly adjudicating claims according to the SPD language. Where applicable, recoveries should be pursued.
Work with Aetna to clarify the intent of all the plan design features identified as exceptions, with focus on services covered at 100% and non-covered (ineligible) services. Further clarifying language in the SPD related to ineligible services may be helpful. For services, which are typically excluded but where approval for payment may be provided on an exception basis, a prior authorization requirement may be appropriate.
Aetna should address the issues identified that are related to the correct application of member liability such as copayment to assure that members are assessed the correct amount and that claims are paid correctly for claims that require a copayment.
Exception Categories Compared to Industry Benchmarks The following chart compares Aetna’s results for the identified exception categories to that of other Health Plans (Benchmark Error Rate). The benchmarks are based on the claims count for the exception categories. The exception rate identified on the Aetna claims is well below that of other commercial and government health plans audited by Truven.
Benchmarks – TRS-ActiveCare
Exception Category
Benchmark Exception
Rate
Aetna Exception Rate
FY2016
Aetna Score
100-Percent Coverage 1.70% 0.165% Below average exception rate
Coinsurance Application 4.14% 0.089% Below average exception rate
Copayment Application 4.28% 0.078% Below average exception rate
Ineligible Services 0.35% 0.007% Below average exception rate

TAB 5D

Teacher Retirement System of Texas Review of Pharmacy Plan Administration by Express Scripts for September 1, 2015 to August 31, 2016
TRS-Care Prepared for: Teacher Retirement System of Texas December 15, 2017
Submitted by: Truven Health Analytics, LLC

©2017 Truven Health Analytics, LLC, Part of the IBM Watson Health business
Review of Express Scripts Pharmacy Plan Proprietary and Confidential
Page 2 December 15, 2017
EXECUTIVE SUMMARY
Engagement Overview The Teacher Retirement System of Texas (TRS) engaged the services of Truven Health Analytics (Truven) to conduct a pharmacy claims review to assess Express Scripts, Inc.'s (ESI’s) administration of TRS’ self-funded pharmacy plans and determine if ESI complies with the terms of the administrative agreement. This engagement encompassed an audit of ESI to assess the accuracy and appropriateness of its responsibility as the plan’s administrative agent, including the prescription adjudication process, compliance with pricing agreements, contract terms, and review of quality control procedures. Truven performed an electronic audit of all claims adjudicated by ESI from September 1, 2015 through August 31, 2016.
The pharmacy drug plans included in this review consist of the following:
TRS-Care 1 TRS-Care 2 TRS-Care 3
Audit Conclusions The sample claims were reviewed based on ESI’s responses, and 14 exceptions were identified. We evaluated all 3,179,107 claims during the audit review period based on ESI’s responses and identified $310,630 in overpayments. The following chart compares the total cost of all exceptions identified by this audit against the total cost of TRS’ entire claims population.
Overall Audit Results Dollars Paid Claims Paid
Employee/dependent prescription drug claims $343,690,550 3,179,107
Claims sampled $49,721 155
Errors/exceptions identified in claims sample $3,010 14
Total cost of all exceptions identified from the plan design analysis of TRS’ entire claims population (based on the attributes and root causes of Truven’s claims sample findings)
$310,630 729
The financial impact of all exceptions identified through this review is overpayments of $310,630, representing 0.09% of TRS’ total spend. Based on the results of our review, we have several recommendations that we believe, if implemented, would improve the overall claims processing accuracy rate and could result in savings to TRS. Summary of Key Findings The following summarizes our key findings identified in the entire TRS claims population.
Duplicate claims: Claims were processed for the same members and the same products on the same day. ESI has noted during the sample review that they determined there was a sorting issue that occurred during claims processing that allowed duplicate claims to pay during the audit scope. ESI’s account team agreed to work with TRS on reimbursement for claims that were paid outside of contract terms.

©2017 Truven Health Analytics, LLC, Part of the IBM Watson Health business
Review of Express Scripts Pharmacy Plan Proprietary and Confidential
Page 3 December 15, 2017
Ineligible Services: Claims were processed for bulk ingredient compound products that were excluded per the contract. The claims did not follow the proper PA protocol.
Recommendations The following summarizes our recommendations based on findings identified in the entire TRS claims population.
Duplicate claims: We recommend TRS work with ESI’s account team regarding reimbursement for duplicate claims that were paid outside of contract terms.
Ineligible Services: We recommend TRS work with ESI to determine why claims were processed for bulk ingredient excluded products not covered by the plan and without the proper protocol review. As these drugs cannot be consumed in the form dispensed the only use is in compound form.

TAB 5E

Teacher Retirement System of Texas Review of TRS-Care Medicare Part D Pharmacy Benefits Administration by Express Scripts for January 1, 2015 to December 31, 2015 Prepared for: Teacher Retirement System of Texas
December 15, 2017
Submitted by: Truven Health Analytics, LLC

©2017 Truven Health Analytics, LLC, Part of the IBM Watson Health Business
Review of Express Scripts EGWP Pharmacy Plan Proprietary and Confidential
Page 2 December 15,, 2017
EXECUTIVE SUMMARY
Engagement Overview The Teacher Retirement System of Texas (TRS) engaged the services of Truven Health Analytics (Truven) to conduct a pharmacy claims review to assess Express Scripts, Inc.'s (ESI) Employer Group Waiver Plans (EGWP), also called the Medicare Part D plan administration of TRS’ self-funded pharmacy plans and determine if ESI complies with the terms of the administrative agreement. This engagement encompassed an audit of ESI to assess the accuracy and appropriateness of its responsibility as the plan’s administrative agent, including the prescription adjudication process, compliance with pricing agreements, contract terms, and review of quality control procedures. Truven performed an electronic audit of all claims adjudicated by ESI from January 1, 2015 through December 31, 2015.
The pharmacy drug plans included in this review consist of the following:
TRS-Care 2 EGWP TRS-Care 3 EGWP
Audit Conclusions The sample claims were reviewed based on ESI’s responses, and 6 exceptions were identified. We evaluated all 4,729,493 claims during the audit review period based on ESI’s responses and identified $146,834 in overpayments. The following chart compares the total cost of all exceptions identified by this audit against the total cost of TRS’ entire claims population.
Overall Audit Results Dollars Paid Claims Paid
Employee/dependent prescription drug claims $492,067,084 4,729,493
Claims sampled $13,231 79
Errors/exceptions identified in claims sample $832 6
Total cost of all exceptions identified from the plan design analysis of TRS’ entire claims population (based on the attributes and root causes of Truven’s claims sample findings)
$146,834 1,044
The financial impact of all exceptions identified through this review is overpayments of $146,834, representing 0.03% of TRS’ total spend. Based on the results of our review, we have several recommendations that we believe, if implemented, would improve the overall claims processing accuracy rate and could result in savings to TRS.
Summary of Key Findings Duplicate Claims: Claims were processed for the same member, same drug, same strength,
same dose, by the same provider, on the same day. ESI noted the sample claims submitted by Truven could bypass the duplicate edit due to the claims being (COB) coordination of benefits.
Ineligible Services: Claims were improperly billed for bulk ingredient drugs used in pain cream compounds. Because they were not billed as compounds the claims by-passed the compound and prior authorization protocols noted in the contract.

©2017 Truven Health Analytics, LLC, Part of the IBM Watson Health Business
Review of Express Scripts EGWP Pharmacy Plan Proprietary and Confidential
Page 3 December 15,, 2017
Recommendations
Duplicate Claims: We recommend that for true duplicate claims, TRS work with ESI on reimbursement for claims that were paid outside of contractual parameters and intent.
Ineligible Services: We recommend TRS work with ESI to determine why claims were processed for bulk ingredient excluded products not covered by the plan and without the proper protocol review. As these drugs cannot be consumed in the form dispensed the only use is in compound form.

TAB 5F

Teacher Retirement System of Texas Review of Pharmacy Plan Administration by CVS/Caremark for September 1, 2015 to August 31, 2016
TRS-ActiveCare Prepared for: Teacher Retirement System of Texas December 15, 2017
Submitted by: Truven Health Analytics, LLC

©Truven Health Analytics, LLC Part of the IBM Watson Health Business
Page 2 December 15, 2017 Proprietary and Confidential
EXECUTIVE SUMMARY Engagement Overview The Teacher Retirement System of Texas (TRS) engaged the services of Truven Health Analytics (Truven) to conduct a pharmacy claims review to assess CVS/Caremark’s (Caremark) administration of TRS’ self-funded pharmacy plans and determine if Caremark complies with the terms of the administrative agreement. This engagement encompassed an audit of Caremark to assess the accuracy and appropriateness of its responsibility as the plan’s administrative agent, including the prescription adjudication process, compliance with pricing agreements, contract terms, and review of quality control procedures. Truven Health performed an electronic audit of all claims adjudicated by Caremark from September 1, 2015 through August 31, 2016.
The pharmacy drug plans included in this review consisted of the following:
TRS-ActiveCare 1 HD TRS-Active Select TRS-ActiveCare 2
Audit Conclusions The sample claims were reviewed based on Caremark’s responses, and 13 exceptions were identified. Truven Health evaluated all 4,468,702 claims during the audit review period based on Caremark’s responses and identified $132,633 in overpayments. The following chart compares the total cost of all exceptions identified by this audit against the total cost of TRS’ entire claims population.
Overall Audit Results Dollars Paid Claims Paid
Employee/dependent prescription drug claims $387,888,405 4,468,702
Claims sampled $63,928 150
Errors/exceptions identified in claims sample $2,852 13
Total cost of all exceptions identified from the plan design analysis of TRS’ entire claims population (based on the attributes and root causes of Truven’s claims sample findings)
$132,633 775
Summary of Key Findings The following summarizes our key findings based on findings identified in the entire TRS-ActiveCare claims population.
100 Percent coverage: Members were charged copays on Affordable Care Act covered vaccines due to pharmacies submitting claims incorrectly.
Deductible: Member deductibles were bypassed in the claims file submitted to Truven.

©Truven Health Analytics, LLC Part of the IBM Watson Health Business
Page 3 December 15, 2017 Proprietary and Confidential
Early Refill: Claims were filled outside of early refill parameters set in the contract. Most of the findings were for retail claims that were filled prior to the plan design utilization of 75%.
Recommendations The following summarizes our recommendations based on findings identified in the entire TRS- ActiveCare claims population.
100 Percent coverage: Truven Health recommends that Caremark work with TRS to ensure ACA copay guidelines align with their intent. We also recommend that a hard stop edit be put in place to prevent any pharmacies from improperly billing claims for ACA covered products.
Early Refills: A discussion of early refill parameters should be undertaken between Caremark and TRS. Specific parameters should be outlined in detail and agreed upon to ensure early refills occur for valid reasons such as vacation overrides, dosage changes or lost medication. Also, we recommend that hard stop edits be put into place to prevent any claims from being refilled outside of plan utilization parameters. This should be looked at as a cost savings opportunity for TRS.

TAB 6
The information for this agenda item is confidential.

TAB 7

TAB 7A

QUARTERLY TRS COMPLIANCE TESTING INVESTMENT POLICY STATEMENT (IPS), SECURITIES LENDING POLICY (SLP), PERFORMANCE INCENTIVE PAY (PIP) PLAN, WIRE TRANSFER
PROCEDURES, AND ETHICS POLICIES CALENDAR QUARTER ENDED SEPTEMBER 30, 2017, EXCEPT AS NOTED
Legend: Red - Significant to TRS Orange - Significant to Business Objectives Yellow - Other Reportable Exception Green - Positive Test Result/ No Exception
November 28, 2017 Project #18-302
1. Board Reports All required information is reported to the TRS Board of Trustees
2. Investment Selection and Approval Investments made are within delegated limits and established selection criteria
3. Other (IPS, SLP, PIP, Wire Transfers, Other Reporting) Risk limits are followed for other investment programs and activities
4. Ethics Policies Ethics policy requirements are met
Management Responses
Management Assertions
Test Results
Compare Board reports to IPS requirements
Trace sample information included in Board reports to supporting documentation
Obtain evidence of monitoring of the securities lending agent and the program performance
Verify wire transfers are authorized and properly supported
Recalculate Internal Public Markets staff’s PIP alpha for the quarter ended 6/30/2017.
Confirm senior managers’ awareness of any compliance violations
Obtain evidence that executive director’s financial disclosures were made to the Texas Ethics Commission
Obtain evidence that financial service providers filed annual disclosure statements on conflicts of interest
Trace investments approved by the Internal Investment Committee (IIC) to supporting documentation
Compare approval amounts of new investments with IPS limits
Obtain evidence that Placement Agent Questionnaires (PAQs) were received prior to funding approved investments
N/A
Business Objectives
Business Risks
Agreed-Upon Procedures
Board is not informed of key investment decisions and critical information
Risks exceed Board-established tolerances or management policies and procedures
All required information is reported to the Board
Programs are within risk limits and activities follow established policies and procedures
N/A
Ethics policy requirements are not completed
Ethics policies and requirements are being followed
Approvals and fundings exceed delegated limits
Approvals and fundings are within delegated limits and made for qualified managers
All requirements of the IPS, SLP, PIP, and wire transfer procedures were met.
N/A N/A
Financial disclosure requirements were met.
All 15 contractors tested submitted annual disclosure statements, including four firms which submitted after the due date.
All reporting requirements were met.
Documentation provided support for the information tested.
All investments tested were in compliance with statutory and policy approval limits.
PAQs were obtained for all investments tested.

TRS Internal Audit November 28, 2017 Quarterly TRS Compliance Testing Page 1
November 28, 2017 Carolina de Onis, TRS General Counsel Subject: Report on Independent Testing of TRS Compliance We have completed the Quarterly TRS Compliance Testing for the quarter ended September 30, 2017, as included in the Fiscal Year 2018 Audit Plan. The scope of this engagement included the requirements of the Investment Policy Statement (IPS), Securities Lending Policy (SLP), Employee Ethics Policy, Code of Ethics for Contractors, Wire Transfer Procedures, and Performance Incentive Pay (PIP) Plan. We performed the procedures that were agreed to by the TRS Legal & Compliance division. These procedures include tests that supplement the current compliance monitoring procedures performed by State Street Bank and the Chief Compliance Officer. This agreed-upon procedures engagement was performed in accordance with generally accepted government auditing standards contained in the Government Auditing Standards issued by the Comptroller General of the United States. The sufficiency of the agreed-upon procedures performed is solely the responsibility of the specified users of the report. Consequently, we make no representations regarding the sufficiency of the procedures described in Appendix A either for the purpose for which this report has been requested or for any other purpose.
Our testing procedures and results are included in Appendix A. Internal Control Structure We were not engaged to and did not perform an examination of the internal controls nor the operating effectiveness pertaining to the subject areas tested. Accordingly, we do not express an opinion on the suitability of the design of internal controls nor the operating effectiveness of the subject areas tested. Had we performed additional procedures, or had we made an examination of the system of internal control, other matters might have come to our attention that would have been reported to you. This report relates only to the procedures specified below and does not extend to the internal control structure. This report is intended solely for information and use by TRS management, the Board of Trustees, and oversight agencies, and is not intended to be and should not be used by anyone other than those specified parties. However, this report is a matter of public record and its distribution is not limited.

TRS Internal Audit November 28, 2017 Quarterly TRS Compliance Testing Page 2
* * * * *
We express our appreciation to management and key personnel of the Investment Management Division, Investment Accounting, and Legal & Compliance for their cooperation and professionalism shown to us during this quarterly testing. Amy Barrett, CIA, CPA, CISA Hugh Ohn, CIA, CPA, CFA, FRM Chief Audit Executive Director of Investment Audit Services Rodrigo Dominguez Auditor

TRS Internal Audit November 28, 2017 Quarterly TRS Compliance Testing Page 3
APPENDIX A
AGREED-UPON PROCEDURES AND RESULTS
STEP #
BUS.OBJ.
#
TEST PURPOSE TEST DESCRIPTION TEST RESULT MANAGEMENT RESPONSE
1 1 IPS Article 1.7a - 1.7p – Obtain evidence that all requirements were reported to Board of Trustees. Quarterly reporting requirements include investment performance, asset class exposures, and external investments under consideration. Semi-annual reports include outstanding derivatives, leverage, and liquidity positions, and risk limits.
Obtain all information required to be reported to Board of Trustees and compare to reporting requirements per Investment Policy Statement (IPS)
Information required to be reported to Board of Trustees complied with IPS requirements.
No response required
2 2 IPS Article 2.5 – Obtain evidence that the Investment Management Division (IMD) evaluated hedge fund classification
Select sample of approved investments in hedge funds and external managers
Obtain analysis indicating whether each investment is hedge fund or not. If analysis is unavailable, inconclusive, or erroneous, report that result
For any analysis requiring Board approval of classification, obtain Board minutes to test whether approval was obtained
Each of approved investments in hedge funds and external managers tested had analysis indicating whether investment was a hedge fund or not. No Board approval was required.
No response required
3 2 IPS Article 2.6a – Obtain existence of Internal Investment Committee (IIC) approval of all private and relevant public markets fund investments.
For the private and public markets funds approved during the quarter, obtain existence of IIC approval
IIC approval existed for all funds we tested during the quarter.
No response required

TRS Internal Audit November 28, 2017 Quarterly TRS Compliance Testing Page 4
STEP #
BUS.OBJ.
#
TEST PURPOSE TEST DESCRIPTION TEST RESULT MANAGEMENT RESPONSE
4 2 IPS Article 2.6d – Obtain information about the allocation of funds added to previously approved investments for purposes of rebalancing or adjusting risks to ensure that they did not exceed 2% of associated portfolios
Inquire with Investment Operations team whether portfolios were adjusted for the purposes of rebalancing or adjusting risks
Obtain the Quarterly Rebalance Authority tracking spreadsheet and trace amounts to the appropriate Rebalance Authority form to ensure that additional investments or allocations did not exceed 2% of Hedge Fund Portfolio, External Manager Portfolio, or Other Absolute Return Portfolio (as appropriate) per investment on a monthly basis
Additional funds added to previously approved investments for purposes of rebalancing or adjusting risks did not exceed 2% of associated portfolios.
No response required
5 2 IPS Article 12.4 - Obtain evidence of existence of placement agent questionnaire (PAQ) for each new investment selected for testing and test for inclusion in summary report to the Board.
For each investment selected for testing, obtain copies of the placement agent questionnaire (PAQ) to ensure that IMD obtained responses to the questionnaire
Obtain evidence that responses to the questionnaires were compiled and all results reported to the Board at least semi-annually
Each investment tested had a completed questionnaire and was included in the summary report to the Board.
No response required
6 2 IPS Appendix B – Obtain evidence that investments approved are within policy limits.
Select sample of approved investments, obtain tear sheet for each, and observe the approved amounts are within authorized limits a) Initial allocation – .50% b) Additional or follow-on – 1% c) Total Manager Limits – 3% d) Total limit each manager organization – 6%
Trace tear sheet calculations to the supporting documentation to ensure that the above authorized limits were not exceeded by any manager or partner organization
For the sample investments tested, no manager or partner organization exceeded the authorized limits and documentation existed for IMD staff calculations of authorized limits. There were no Special Investment Opportunities.
No response required
7 3 Quarterly Compliance Certification – Obtain evidence
Confirm with the Chief Compliance Officer that she has received compliance certification from IMD management, Legal Investment staff, and
Obtained confirmation from the Chief Compliance Officer. No compliance exceptions were
No response required

TRS Internal Audit November 28, 2017 Quarterly TRS Compliance Testing Page 5
STEP #
BUS.OBJ.
#
TEST PURPOSE TEST DESCRIPTION TEST RESULT MANAGEMENT RESPONSE
that all known compliance violations have been reported.
CIO regarding any known compliance violations occurred during the testing period
identified as a result of the quarterly compliance certification.
8 3 Wire Transfers – Obtain evidence that wire transfers are authorized and properly supported
Obtain wire transfer reports for testing period, select a sample of wire transfers, and trace each to supporting documentation to check amount and appropriate manager authorizations
All wire transfers tested were properly authorized and amounts were supported.
No response required
9 3 Securities Lending Policy – Obtain evidence that IMD reviews the securities lending program and performance of lender.
Obtain evidence from the monthly securities lending program performance reviews conducted by the TRS Asset Allocation team and the Securities Lending Agent that investments in the securities lending program comply with the following policy requirements: Sec 3.1. Securities eligible for lending Sec 3.3. Collateral Received
Only eligible TRS securities were loaned. All collateral received was cash or government securities.
No response required
10 4 Employee Ethics Policy, Section XIII.A – Obtain evidence that the Executive Director filed a personal financial statement with the Texas Ethics Commission
Verify that the Executive Director filed a personal financial statement with the Texas Ethics Commission for the year ended December, 31, 2016, prior to the April 30th deadline.
The Executive Director’s 2016 personal financial statement was filed with the Texas Ethics Commission. The document was dated prior to the April 30th deadline.
No response required
11 4 Code of Ethics for Contractors, Section III.B – Obtain evidence that all TRS brokers, financial advisors, and financial service providers filed annual disclosure statements with TRS General Counsel.
Obtain evidence that all TRS brokers, financial advisors, and financial service providers complied with the Code of Ethics for Contractors by filing annual disclosure statements with the TRS General Counsel. Annual filing deadline is April 15th.
All 15 contractors we tested submitted annual disclosure statements, including four firms which submitted them after the due date.
No response required
12 3 Performance Incentive Pay Plan (PIP) – Verify that investment performance results used in quarterly Internal Public Markets (IPM) portfolio matches
Trace quarterly IPM individual component calculations to investment performance application data and TRS custodian data.
There were no data, employee assignment, or formula errors included in the quarterly IPM individual component calculation spreadsheet. Thus, excess return
No response required

TRS Internal Audit November 28, 2017 Quarterly TRS Compliance Testing Page 6
STEP #
BUS.OBJ.
#
TEST PURPOSE TEST DESCRIPTION TEST RESULT MANAGEMENT RESPONSE
data from performance applications and custodian bank and that the excess return calculations for individual portfolio managers and sector managers are correct
Test whether employee assignments were approved by Senior Director in IPM prior to quarter start by obtaining approval email from Senior Director to Investment Operations Performance Analyst. If any assignment changes are included in the approval, compare the approved changes to the assignments in the quarterly IPM individual component calculations.
Test whether formulas in the quarterly IPM
individual component calculation spreadsheet are correct by recalculating investment return totals by portfolio manager and sector manager, and comparing total investment returns to returns provided by the custodian bank.
calculations for individual portfolio managers and sector managers for the IPM portfolio were correct for the quarter ended March 31, 2017.
Note: Testing procedures for the Investment Policy Statement (IPS), Securities Lending Policy (SLP), Employee Ethics Policy, Code of Ethics for Contractors, and Wire Transfer Procedures are for the activities for the quarter ended September 30, 2017. Testing procedures for the Performance Incentive Pay Plan are for the quarter ended June 30, 2017.

TAB 7B

TRS Internal Audit Summary of Audit Recommendations Status
As of November 2017
December 2017 Board Audit Committee Meeting 1
Project Recommendation Status Issue Type Estimated Date
Revised / Actual Date
17-601 403(b) Provider Compliance Audit
Require Records of Provider’s Verification of License and Qualification As Part of Annual Demonstration Implemented Other
Reportable 8/2017 11/2017
17-305 Commission Credit (soft dollar) Audit
Strengthen monitoring of contractual allowance balances to ensure no available amounts are Lost In Progress Significant
to Business 12/2017
Update commission credit guidelines and procedures required by the policy Implemented Other Reportable 11/2017
Apply consistent processes for access to commission credit payment service Implemented Other Reportable 9/2017
17-306 Funston Evaluation of TRS Real Assets Investment Program
Board should consider adopting a stand-alone Compliance Policy in order to place Board emphasis on the importance of compliance and greater clarity to the respective roles and responsibilities throughout TRS respecting this area.
In Progress Other Reportable 12/2017 4/2018
Significant to Business Objectives
Other Reportable
Past original estimated completion date, and No management action plan or No progress on management action plan
Past original estimated completion date Progress on management action plan
Original estimated completion date has not changed Progress on management action plan
Satisfactory implementation of management action plan or Acceptance of risk by management
Implementation of management action plan pending Internal Audit validation
Past first revised estimated completion date No management action plan or No progress on management action plan
Past first revised estimated completion date Progress on management action plan
Within original or first revised estimated completion date Progress on management action plan
Satisfactory implementation of management action plan or Acceptance of risk by management

TRS Internal Audit Summary of Audit Recommendations Status
As of November 2017
December 2017 Board Audit Committee Meeting 2
Project Recommendation Status Issue Type Estimated Date
Revised / Actual Date
17-306 Funston Evaluation of TRS Real Assets Investment Program (Continue..)
TRS Board should consider several options to improve reporting and coordination of compliance and other oversight activities:
A. Consider whether the ability to use and comprehend the various investment information from all sources provided to trustees would be enhanced by developing a map, or guide, to the various sources and their purpose as a part of trustee training or in a manual.
B. Although overall reporting is robust, TRS may benefit by shifting more regular reporting responsibilities to the Chief Compliance Officer and moving the Chief Audit Executive towards the role of assessing the effectiveness of the compliance function.
Implemented Other
Reportable
A - 5/2017 A – 9/2017
In Progress B – 5/2017 B – 9/2018
The PI program, or other approach, should be used as needed to “wrap” managers with multiple investments to replicate aspects of the Strategic Partner Network (SPN) and secure the best possible terms and deal flow (i.e., to gain benefits similar to strategic partners with those managers).
Implemented Other Reportable 12/2017 9/2017
Real Assets should undertake a cost/benefit analysis of the potential for active direct real estate investing. In Progress Other
Reportable 12/2017 6/2018
17-503 Audit of Trust Expenses Allocation
Develop and implement a written, comprehensive, and approved cost allocation policy that emphasizes the fiduciary duty in the equitable allocation of fund expenses; and that includes definitions, defined roles and responsibilities, and the basis for each allocated cost
In Progress Other Reportable 8/2018
Develop procedures to implement the new comprehensive cost allocation policy that include documented approvals to be obtained for methodologies used and final year-end calculations
In Progress Other Reportable 8/2018
Develop procedures to implement the new comprehensive cost allocation policy that include materiality thresholds for determining whether a year-end adjusting journal entry is required to ensure equitable fund allocations
In Progress Other Reportable 8/2018
Develop procedures to implement the new comprehensive cost allocation policy that include defined roles and processes for the initial and periodic assessment of new capital projects to determine the appropriate method of finance
In Progress Other Reportable 8/2018

TRS Internal Audit Summary of Audit Recommendations Status
As of November 2017
December 2017 Board Audit Committee Meeting 3
Project Recommendation Status Issue Type Estimated Date
Revised / Actual Date
Develop procedures to implement the new comprehensive cost allocation policy that include a routinely reviewed and approved schedule of direct and indirect costs by TRS department
In Progress Other Reportable 8/2018
Develop procedures to implement the new comprehensive cost allocation policy that include defined roles for department managers in the determination and approval of rates used for facilities costs
In Progress Other Reportable 8/2018
Develop procedures to implement the new comprehensive cost allocation policy that include defined roles for department managers in the determination of rates used to allocate indirect costs and in the confirmation that the rates reflect current conditions
In Progress Other Reportable 8/2018
SAO Audits of FY 2014 - 2017 Comprehensive Annual Financial Report
Strengthen controls over census data In Progress Significant 8/2016 03/2018

TRS Internal Audit Summary of Audit Recommendations Status
As of November 2017
December 2017 Board Audit Committee Meeting 4
Status of Reporting Entity Audit Recommendations
Statuses:
Under Legal Services Review – TRS Benefits team has requested Legal Services review before taking any further action In Progress – TRS Benefits team is working with RE on corrections/adjustments Closed – TRS Benefits team has resolved all RE audit findings No Audit Findings – the audit resulted in no audit findings
Audit Project # Audit Report Date Reporting Entity (RE) Status
1 17-401a 6/22/2017 Pleasanton ISD In Progress
2 17-401b 8/31/2017 Dallas ISD In Progress

TAB 7C
Internal Audit Annual Report
Fiscal Year 2017
Teacher Retirement System of Texas 1000 Red River Street, Austin, Texas 78701-2698
October 2017

TEACHER RETIREMENT SYSTEM OF TEXAS
BOARD AUDIT COMMITTEE (As of October 16, 2017)
Christopher Moss, Chair T. Karen Charleston
David Corpus Greg Gibson, Ed.D.
BOARD MEMBERS (As of October 16, 2017)
R. David Kelly, Chair Dolores Ramirez, Vice Chair
T. Karen Charleston Greg Gibson, Ed.D.
John Elliott Joe Colonnetta David Corpus
Christopher Moss
EXECUTIVE DIRECTOR
Brian Guthrie
INTERNAL AUDIT DEPARTMENT
Amy L. Barrett, CIA, CISA, CPA, Chief Audit Executive Jan Engler, CIA, CISA, CFE, Director of Benefit Services
Lih-Jen Lan, CIA, CPA, CISA, CISSP, CCSA, Information Technology (IT) Audit Manager
Hugh Ohn, CFA, CPA, CIA, FRM, Director of Investment Audit Services Toma Miller, CIA, CGAP, Senior Auditor Nick Ballard, CFA, CIA, Senior Auditor
Simin Pang, CIA, CISA, Senior IT Auditor Anandhi Mani, CPA, CIA, Senior Benefits Auditor
Art Mata, CEBS, CPM, Senior Internal Audit Benefit Consultant Carol Casey, CPM, Internal Audit Benefit Consultant
Rodrigo Dominguez, Investment Auditor

October 16, 2017 Honorable Greg Abbott, Governor Members of the Legislative Budget Board Members of the Sunset Advisory Commission Ms. Lisa R. Collier, CPA, First Assistant State Auditor Mr. R. David Kelly, Chair, TRS Board of Trustees Mr. Christopher Moss, Chair, TRS Board Audit Committee Members of the Board of Trustees, Teacher Retirement System of Texas Mr. Brian Guthrie, Executive Director, TRS Attached is the annual report of the Internal Audit department of the Teacher Retirement System of Texas (TRS). This report provides information on the audit plan, assurance, consulting, and advisory projects completed, and other Internal Audit activities. It also meets the annual reporting requirement of the Texas Internal Auditing Act (Texas Government Code, Chapter 2102.009 and Texas Government Code, Sections 2102.015 and 2102.0091). This report includes the following State Auditor’s Office reporting guidelines:
I. Compliance With Texas Government Code, Section 2102.015: Posting the Internal Audit Plan, Internal Audit Annual Report, and Other Audit Information on Internet Website
II. Internal Audit Plan for Fiscal Year 2017 III. Consulting Services and Nonaudit Services Completed IV. External Quality Assurance Review (Peer Review) V. Internal Audit Plan for Fiscal Year 2018 VI. External Audit Services Procured in Fiscal Year 2017 VII. Reporting Suspected Fraud and Abuse
The work performed by TRS Internal Audit contributes toward accountability, integrity, and good management practices within TRS operations. Fiscal year 2017 projects contributed to the improvement of risk management, control, and governance processes. Internal Audit (or those engaged by Internal Audit) issued 12 assurance and 7 agreed-upon procedures reports, followed-up and reported quarterly on the status of all outstanding audit recommendations, and performed advisory services in various areas including TEAM (TRS Enterprise Application Modernization) Program initiatives. For further information about the contents of this report or to request copies of Internal Audit reports, please contact Amy Barrett at (512) 542-6559. Sincerely, Amy L. Barrett, CIA, CISA, CPA Chief Audit Executive

TEACHER RETIREMENT SYSTEM OF TEXAS
INTERNAL AUDIT ANNUAL REPORT
FISCAL YEAR 2017
October 2017

Teacher Retirement System of Texas Internal Audit Annual Report for Fiscal Year 2017
I. Compliance With Texas Government Code, Section 2102.015:
Posting the Internal Audit Plan, Internal Audit Annual Report, and Other Audit Information on Internet Website

Teacher Retire Teacher Retirement System of Texas Internal Audit Annual Report for Fiscal Year 2017 I. Compliance with Texas Government Code, Section 2102.015: Posting the Internal Audit
Plan, Internal Audit Annual Report, and Other Audit information on Internet Web site
Texas Government Code, Section 2102.015 requires state agencies and institutions of higher education, as defined in the statute, to post agency internal audit plans and internal audit annual reports on the agency’s internet website within 30 days of approval. The statute also requires entities to update the posting on the Internet to include a.) a detailed summary of the weaknesses, deficiencies, wrongdoings, or other concerns raised by the audit plan or annual report and b.) a summary of the actions taken to address concerns, if any, that are raised by the audit plan or annual report.
TRS Internal Audit follows the following procedures to ensure compliance with the requirements of Texas Government Code, Section 2102.015:
The TRS Annual Internal Audit Plan is approved each fiscal year by the TRS Board of Trustees as recommended by the TRS Audit Committee. The annual audit plan, as approved by the TRS Board of Trustees, is provided by Internal Audit staff to the TRS Website coordinators and posted to the TRS Website within 30 days of approval.
The TRS Internal Audit Annual Report is prepared annually by Internal Audit staff in accordance with the Texas State Auditor’s Office guidelines by the required deadline. This report, once approved by the Chief Audit Executive, is submitted to the Governor’s Office, the Legislative Budget Board, the Sunset Advisory Commission, the State Auditor’s Office and the TRS Board of Trustees by November 1 of each fiscal year. The annual report is provided by Internal Audit staff to the TRS Website coordinators to post to the TRS Website.
Summaries of the weaknesses, concerns, and actions taken to address concerns in the audit plan or annual report are provided by Internal Audit in the quarterly TRS Audit Committee materials. The audit committee materials provide audit reports completed during each quarter, quarterly status reports on management action on outstanding audit recommendations, and the status of the current fiscal year audit plan. The individual audit reports provide the results, recommendations, and management actions taken to address the audit recommendations. The TRS Audit Committee materials are posted to the TRS Website, after dissemination to TRS Board of Trustees, through an administrative process of board and committee materials prior to the scheduled Board meeting.

Teacher Retirement System of Texas Internal Audit Annual Report for Fiscal Year 2017
II. Internal Audit Plan for Fiscal Year 2017

Fiscal Year 2017 Audit Plan Status As of August 2017
September 2017 Board Audit Committee Meeting 2
Title and Project # Type Status
Executive and Finance
Records Management Audit Follow-Up (17-410) Audit Complete
403(b) Provider Compliance (17-601) Audit Complete
Federal Labor Standards Act (FLSA) Compliance (17-605) Consulting Complete
Coordination for State Auditor’s Office (SAO) Comprehensive Annual Financial Report (CAFR) Audit for Fiscal Year 2016
Advisory Complete
Teacher Retirement Investment Company of Texas (TRICOT) Financial Audit Coordination (Grant Thornton)
Advisory Complete
Testing of Executive Performance Incentive Pay Calculations (17-606) Agreed-Upon Procedures Complete
The University Of Texas at Austin Student Project (17-608) Consulting Complete
Enterprise Risk Management (ERM) Fraud Risk Assessment Advisory Complete
Committee and Workgroup Meetings Participation Advisory Ongoing
Special Requests and Emerging Issues – Healthcare Legislative Changes (17-203) Consulting Ongoing
TEAM Program
TEAM Independent Program Assessment (IPA) Vendor Support Advisory Ongoing
TEAM Committees, Projects and Controls Assessment Participation Advisory Ongoing
Pension Benefits
Annuity Payment Testing for SAO CAFR Audit of FY 2016 (17-100) Audit Complete
Annual Benefits Testing (17-101) Agreed-Upon Procedures Complete
Reporting Entity Audits (6 to 10 ISDs) (17-401s) Audit Completed 2 in FY17
Employer Audit Follow-up (17-402) Audit Complete
Employer Audit of Pension and TRS-Care Surcharges (17-403) Audit Complete
Higher Education Pilot and Audit Program Development (17-404) Advisory Complete
TRS Reporting Entity Website Audit Information and Communication Advisory Ongoing

Fiscal Year 2017 Audit Plan Status As of August 2017
September 2017 Board Audit Committee Meeting 3
Health Care Health Insurance Portability and Accountability Act (HIPAA) Gap Assessment and Validation (17-501) Audit Complete
Trust Expense Allocation Audit (17-503) Audit Complete
TRS-ActiveCare Open Enrollment Readiness Assessment Follow-Up (17-201) Audit Complete
TRS-ActiveCare Eligibility Pilot and Audit Program Development Advisory Deferred due to higher
management priorities
Health Care Vendor Selection Observation Advisory Complete
Health Care Vendor Update Meetings Advisory Ongoing
Information Technology
Contractor Onboarding and Off-boarding (17-502) Audit Complete
Disaster Recovery, Network Penetration Tests; Security Risk Assessment Review Advisory Complete
Investment Management
Private Equity Fees (17-304) Audit Complete
Soft Dollars and Commission Sharing Arrangements (17-305) Audit Complete
Quarterly Investment and Ethics Policies Compliance Testing (17-302)
Agreed-Upon Procedures Complete
Annual Testing of Investment Incentive Pay Plan (17-303) Agreed-Upon Procedures Complete
Investment Fiduciary Audit Coordination Advisory Complete
Investment Committees Attendance Advisory Ongoing
Internal Audit Department
Annual Internal Audit Report (17-603) Audit Complete
Data Analysis Processes Advisory Deferred due to healthcare legislative changes project
Quarterly Audit Recommendations Follow-up Audit Ongoing
ERS Audit Quality Assurance Review Audit Complete
Internal Quality Assurance Review (17-602) Advisory Complete
Fiscal Year 2018 Audit Plan Advisory Complete
Internal Audit Strategic Plan Update Advisory Complete
Audit Committee Meetings Preparation Advisory Ongoing

Teacher Retirement System of Texas Internal Audit Annual Report for Fiscal Year 2017
III. Consulting Services
and Nonaudit Services Completed

Teacher Retirement System of Texas Internal Audit Annual Report for Fiscal Year 2017 III. Consulting Services and Nonaudit Service Completed
During fiscal year 2017, Internal Audit conducted (or hired consultants to conduct) the following
consulting (nonaudit services) projects resulting in formal recommendations to management.
1. Federal Labor Standards Act (FLSA) Compliance
(Project #17-605, PowerPoint presentation to Deputy Executive Director and Human
Resources, June 01, 2017)
Objective: To assess TRS' compliance with the FLSA relating to employee exempt and
non-exempt classification and may perform additional related data analysis.
Performed data analysis to assess compliance with FLSA related to employee exempt and
non-exempt classification, as a result recommendations were made to continue to perform
periodic re-evaluation of employee’s FLSA status, obtain and document
supervisor/manager’s input when performing job duty test; and to document the FLSA
status decision making process
2. The University of Texas at Austin Student Project
(Project #17-608, PowerPoint presentation to Human Resources, dated November 21,
2016)
Objective: To research and present to Human Resources best practices for manager
training.
This was achieved by conducting interviews of TRS staff, surveying of pension fund
peers for best practices and researching methods of manager training. As a result
recommendations were made that manager training should be in-house or local third-
party, last less than two hours per day on a variety of topics including effective
communication, as well as, establishing a one-to-one mentor program.
Internal Audit also performed various advisory (nonaudit services) as listed in section II.

Teacher Retirement System of Texas Internal Audit Annual Report for Fiscal Year 2017
IV. External Quality Assurance Review (Peer Review)


Teacher Retirement System of Texas Internal Audit Annual Report for Fiscal Year 2017
V. Internal Audit Plan for Fiscal Year 2018


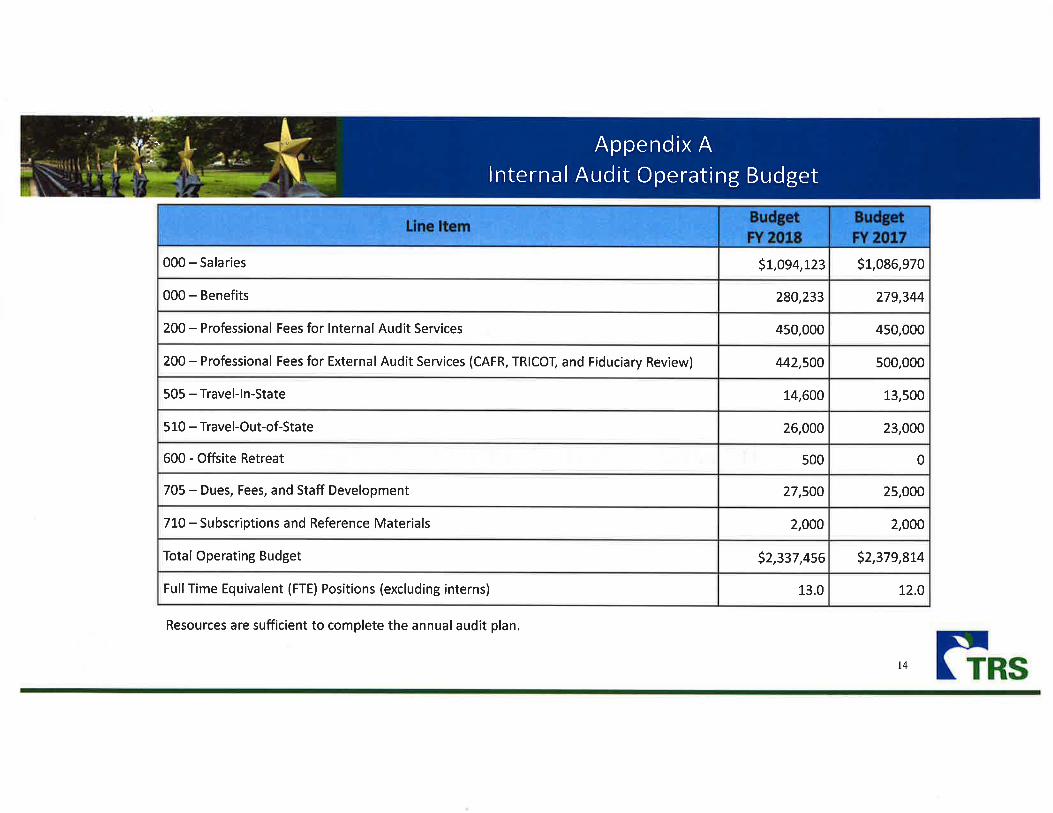


2017 - 2021TRS Internal Audit
Strategic Plan

Mission, Vision, and Stakeholders
Our mission: to enhance and protect organizational value by providing risk-based and objective assurance, advice, and insight
Our vision: to provide trusted assurance and valued advice through our services to primary stakeholders:
Assurance that TRS’ risk management, governance, and control processes support achievement of TRS mission and business objectives
Advice and consultation for improving processes through business partnerships and collaboration
Our primary stakeholders:
TRS Board of Trustees and the Audit Committee of the Board of Trustees
Executive Director and Executive Management
2

Strategic Goals
Our strategic goals were developed to align with the TRS Strategic Plan and Core Values and ensure that we support the changing needs of TRS’ stakeholders in fulfilling fiduciary duties and achieving business goals:
Internal Audit Goal 1: Facilitate Audit Committee governance
TRS Goal 1: Sustain a financially sound pension trust fund
TRS Goal 2: Continue to improve benefit delivery
TRS Goal 3: Facilitate access to competitive, reliable healthcare benefits for our members
Internal Audit Goal 2: Support TRS initiatives
TRS Goal 2: Continue to improve benefit delivery
TRS Core Values
Internal Audit Goal 3: Enhance Internal Audit staff competence and expertise
TRS Goal 4: Attract, retain, and develop highly competent staff
3

Goal 1: Facilitate Audit Committee GovernanceObjective 1: Provide assurance and advice to the Audit Committee and executive management on risk mitigation activities related to the pension and healthcare trusts
Strategy 1Conduct assurance activities relating to the completeness and accuracy of Reporting Entity information submitted to TRS
Strategy 2 Provide assurance on investment risk mitigation activities
Strategy 3 Provide assurance on health care risk mitigation activities
Strategy 4 Coordinate with Enterprise Risk Management (ERM) on risk assessment activities
Strategy 5Collaborate with Compliance Team and Risk Group on risk and compliance monitoring of investment-related activities
Quantitative measurements: Audit project surveys (TRS and Reporting Entities)
TASBO presentation surveys
Chief Audit Executive (CAE) and staff 360 evaluations
Audit plan completion rate
Staff utilization rates 4

Goal 1: Facilitate Audit Committee GovernanceObjective 2: Improve Internal Audit communication
Strategy 1 Refine report format of Internal Audit reports and Audit Committee materials
Strategy 2 Improve delivery of information
Strategy 3 Identify and promote resources within Internal Audit that could be beneficial to TRS
Quantitative measurements:
CAE and staff 360 evaluations
5

Goal 1: Facilitate Audit Committee GovernanceObjective 3: Provide information on effective Audit Committee practices
Strategy 1Obtain and provide information to the Audit Committee on best practices of audit committees
Strategy 2 Consider using Audit Committee self-evaluation tool
Strategy 3 Share governance resources through Diligent
Quantitative measurements:
CAE and staff 360 evaluations
6

Goal 2: Support TRS Initiatives
Objective 1: Support the success of the TEAM Program and Financial Software Implementations
Strategy 1 Facilitate independent oversight for board and external oversight agencies
Strategy 2Provide input and assistance during development and implementation of TRUST (new Benefits system) and new financial system
Strategy 3 Use TRUST and financial system in future audits
Quantitative measurements:
CAE and staff 360 evaluations
7

Goal 2: Support TRS InitiativesObjective 2: Integrate TRS Core Values into Internal Audit activities
Strategy 1Explore opportunities and methods to tie audit findings into TRS Core Values of Customer Satisfaction, Accountability, Ethics, and Excellence
Strategy 2Integrate TRS Core Values of Collaboration/ Teamwork, Respect, and Employee Fulfillment into IA documents
Strategy 3 Establish staff recognition programs
Quantitative measurements:
CAE and staff 360 evaluations
TRS Workplace Survey
8

Goal 3: Enhance Internal Audit Staff Competence and Expertise
Objective 1: Cultivate in-house Subject Matter Experts
Strategy 1 Deepen knowledge of TRS laws (federal and state), rules, and internal policies
Strategy 2 Broaden foundational skills in data analytics
Strategy 3 Define and broaden auditing skills
Quantitative measurements:
TRS project surveys
CAE and staff 360 evaluations
9

Goal 3: Enhance Internal Audit Staff Competence and Expertise
Objective 2: Ensure continued competence and expertise of Internal Audit
Strategy 1 Develop workforce continuity plans
Quantitative measurements:
CAE and staff 360 evaluations
TRS Workplace Survey
HR turnover rates
10

Teacher Retirement System of Texas Internal Audit Annual Report for Fiscal Year 2017
VI. External Audit Services Procured in Fiscal Year 2017

Teacher Retirement System of Texas Internal Audit Annual Report for Fiscal Year 2017
VI. External Audit Services Procured in Fiscal Year 2017
External Audit Services
Procured and Outsourced by Internal Audit
Provided by
Report Date
Contractor Onboarding and Off-Boarding Myers and Stauffer LC 5/2/2017
External Audit Services
Procured by TRS
Provided by
Report
Date
Review of Health Plan Administration Truven Health Analytics In Progress
Comprehensive Annual Financial Report (CAFR) – Fiscal Year 2016
State Auditor’s Office
11/17/2016
Comprehensive Annual Financial Report (CAFR) – Fiscal Year 2017
State Auditor’s Office
In Progress
TRS Investment Company (TRICOT) Financial Audit Fiscal Year 2016
Grant Thornton 12/6/2016
TRS Investment Company (TRICOT) Financial Audit Fiscal Year 2017
Grant Thornton In Progress

Teacher Retirement System of Texas Internal Audit Annual Report for Fiscal Year 2017
VII. Reporting Suspected Fraud and Abuse

Teacher Retirement System of Texas Internal Audit Annual Report for Fiscal Year 2017 VII. Reporting Suspected Fraud and Abuse TRS has taken the following actions to implement the fraud detection and reporting requirements of Section 7.09 of the General Appropriations Act and Section 321.022 of the Texas Government Code:
• Updated in July 2017, TRS Fraud, Waste, and Abuse Policy establishes a fraud, waste, and abuse prevention awareness program that includes employee training and guidelines for reporting suspected fraud, waste, and abuse. Key elements of the policy include definitions, covered acts, reporting procedures of detected or suspected fraud, waste, or abuse, detection and investigation, awareness training, and corrective action.
• The TRS Internet site includes the contact number of the State Auditor’s Office Hotline and a link for reporting instructions.
• Links are available on the TRS Intranet for both the State Auditor’s Office Hotline and the TRS Internal Fraud and Ethics Hotline.
• Administration of the TRS Internal Fraud and Ethics Hotline is vested with the Chief Compliance Officer & Compliance Counsel since fiscal year 2016.
• In compliance with the reporting requirement of fraud, waste, and abuse, TRS reports all instances of suspected fraud, waste, and abuse to SAO.

TAB 8

Chief Audit Executive Goals for FY 2018
Goal 1
Sustain a Financially SoundPension System
Test compliance with investment policies
Coordinate CAFR and TRICOT financial audits
Coordinate TEAM program assessment vendor
activities
Review key TEAM phase 1 controls and participate in
TEAM activities
Analyze full payroll data and provide assurance on
employer reports
Goal 3
Facilitate Access to Competitive,Reliable, Health Care Benefits.
Test implementation of select TRS-Care legislative changes
Follow up on outstanding HIPAA audit
recommendations
1
Test benefit annuity payments
Provide assurance on TRS-Care procurement and
administrative fees
Provide assurance on TRS-ActiveCare billing, procurement,
and administrative fees
Goal 2
Continuously Improve Our Benefit Delivery
-- Planned -- Reported at current Audit Committee or Board -- Work occurred during current quarter
Provide assurance on performance calculations
and private equity fees
December 2017 Board Audit Committee Meeting

Chief Audit Executive Goals for FY 2018
Consult on board reporting timeliness and capital projects
initiations
Communicate on reporting entity audit
issues found
Implement department records management
changes
Participate in hotline triage team
Goal 4
Align Technology to Achieve the TRS Mission
Measure and trend internal audit activities and present on audit value add
Goal 4
Align People to Achievethe TRS Mission
Goal 4
Align Processes to Achieve the TRS Mission
Participate in Executive Council and Risk
Oversight CommitteesAdvise on the CAPPS
project
Re-engineer reporting entity audit processes
Provide assurance on accounting change in management controls
Test investment and executive incentive
compensation
Participate in themanagement
continuity program and nominate staff for
leadership program
Develop new auditor training modules and revisit career paths
Follow up on innovation top 10
Review info security tests and risk assessments
Observe disaster recovery and business
continuity tests
Participate in TRS rules review related to reporting entities
2December 2017 Board Audit Committee Meeting

Internal Audit Goals and Performance Measures Fiscal Year 2018 - 1st Quarter Ending November 2017
December 2017 Board Audit Committee Meeting 3
Target Performance Annual Target
Cumulative Score Activity / Comment Status
Goal 1: Facilitate Audit Committee Governance
1. 80% or more of audit and agreed-upon procedures projects are completed in the fiscal year (80% allows for flexibility due to changes in TRS business practices and special requests)
80% 13% On Task
2. 70% or more of total available department hours (excluding uncontrollable leave) are spent for internal audit staff on direct assurance, consulting, and advisory services
70% 72% On Task
3. 100% of internal audit processes are in accordance with internal auditing standards as reported in the annual quality assurance and improvement (QAIP) report
100% N/A QAIP to be completed in June 2018 N/A
4. 80% (4.0/5.0) or higher score received for audit project client surveys in overall satisfaction 80% 98% On Task
5. 76% (3.8/5.0) or higher score on staff 360 evaluations in accountability, critical thinking, and initiative 76% 79%
Score based on staff 360 evaluations completed in October 2017
Achieved
6. 90% (4.5/5.0) or higher score received for CAE 360 evaluation in “Leads the Agency” (aka Firm Leadership) and “Leads the Team” (aka Managerial Leadership)
90% N/A CAE 360 evaluation to be completed in July 2018 N/A
7. 80% (4.0/5.0) or higher score received for audit project client surveys regarding communication of the audit purpose, results, and reports
80% 98% On Task
8. 80% (4.0/5.0) or higher score on staff 360 evaluations in the area of verbal and written communication and collaborative audit perspective
80% 81% Achieved
9. 100% of relevant current “Tone at the Top” articles uploaded to Diligent 100% 25% On Task
10. One speaker on the topic of the benefits of an effective audit function presents at the February board meeting 1 N/A Presentation to be made at
the February board meeting N/A

Internal Audit Goals and Performance Measures Fiscal Year 2018 - 1st Quarter Ending November 2017
December 2017 Board Audit Committee Meeting 4
Target Performance Annual Target
Cumulative Score Activity / Comment Status
Goal 2: Support TRS Initiatives
1. 86% (4.3/5.0) or higher score for CAE 360 evaluation in contribution goals 86% N/A CAE 360 evaluation to be
completed in July 2018 N/A
2. 80% (4.0/5.0) or higher score received for audit project client surveys in TEAM-related projects, when applicable 80% N/A No formal projects
scheduled N/A
3. 80% (4.0/5.0) or higher score on staff 360 evaluations in the area of organizational awareness 80% 81%
Score based on staff 360 evaluations completed in October 2017
Achieved
4. 83% (5.0/6.0) or higher score for departmental organizational health on the annual Workplace Dynamics Survey 83% N/A Survey results to be
reported in September 2018 N/A
Goal 3: Enhance Internal Audit Staff Competence and Expertise
1. 80% (4.0/5.0) or higher score received for audit project client surveys regarding the usefulness of audit recommendations in improving business processes and controls
80% 92% On Task
2. 80% (4.0/5.0) or higher score on staff 360 evaluations in the area of audit acumen 80% 79% Result due to turnover of
experienced staff Not
Achieved
3. 92% (4.6/5.0) or higher score for CAE 360 evaluation in “Leads the Self” (aka Technical Leadership) 92% NA CAE 360 evaluation to be
completed in July 2018 N/A
4. 100% of audit staff complete annual training plans and obtain a minimum of 40 hours of continuing education credits 100% 0%
Staff expected to complete 40 hours/each towards year end
On Task
5. 100% of audit staff maintain professional certifications or actively pursue certifications and related eligibility requirements 100% 100% On Task
6. 100% of audit staff participate in professional organizations 100% 100% On Task
7. 100% of audit staff acknowledge an understanding of their career path 100% 82%
Survey results indicate that two staff are uncertain of their career path
Below Target
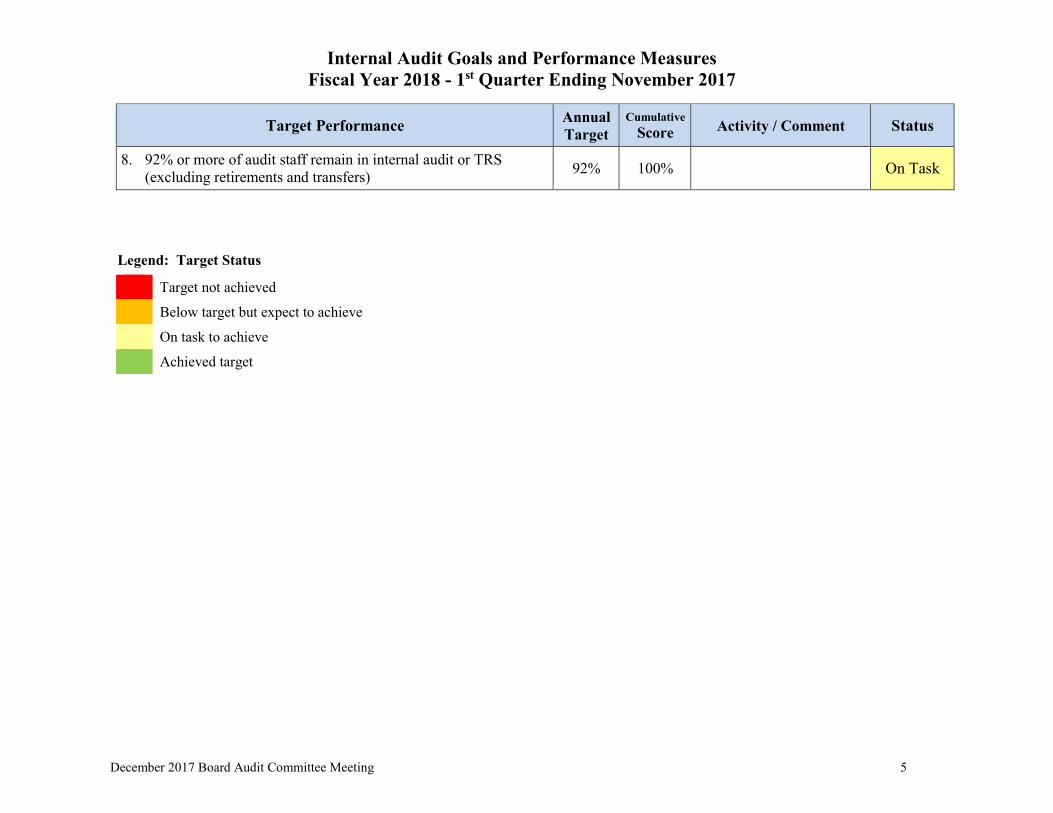
Internal Audit Goals and Performance Measures Fiscal Year 2018 - 1st Quarter Ending November 2017
December 2017 Board Audit Committee Meeting 5
Target Performance Annual Target
Cumulative Score Activity / Comment Status
8. 92% or more of audit staff remain in internal audit or TRS (excluding retirements and transfers) 92% 100% On Task
Legend: Target Status
Target not achieved Below target but expect to achieve On task to achieve Achieved target

Fiscal Year 2018 Audit Plan Status As of November 2017
December 2017 Board Audit Committee Meeting 6
Title and Project # Type Status
Executive and Finance
Board Reporting Process and Materials Review Consulting Complete
General Accounting Change in Management Audit Audit
Capital Improvement planning process Consulting
Coordination for State Auditor’s Office (SAO) Comprehensive Annual Financial Report (CAFR) Audit for Fiscal Year 2017
Advisory Complete
Teacher Retirement Investment Company of Texas (TRICOT) Financial Audit Coordination (Grant Thornton)
Advisory Complete
Testing of Executive Performance Incentive Pay Calculations Agreed-Upon Procedures
New Financial System – CAPPS Implementation Meeting Participation Advisory Ongoing
Committee and Workgroup Meetings Participation Advisory Ongoing
Special Requests and Emerging Issues (TBD) Advisory or Consulting
TEAM Program
TEAM Independent Program Assessment (IPA) Vendor Support Advisory Ongoing
TEAM Committees, Projects and Controls Assessment Participation Advisory Ongoing
Pension Benefits
Annuity Payment Testing for SAO CAFR Audit of FY 2017 Audit Complete
Annual Benefits Testing Agreed-Upon Procedures In progress
Reporting Entity Audits Audit
Employer Audit of Pension and TRS-Care Surcharges Audit
TRS Reporting Entity Website Audit Information and Communication Advisory In Progress

Fiscal Year 2018 Audit Plan Status As of November 2017
December 2017 Board Audit Committee Meeting 7
Health Care
TRS-Care Legislative Change Management Review Consulting In Progress
TRS-ActiveCare Billing, Reporting, and Exceptions Process Audit Audit
TRS-Care and TRS-ActiveCare Vendor Procurement and Oversight Audit Audit
Health Care Administrative Expenses Audit Audit
Health Care Vendor Update Meetings Attendance Advisory Ongoing
Information Technology
Disaster Recovery, Network Penetration Tests; Security Risk Assessment Review Advisory
Investment Management
Private Equity Management Fees and Carried Interest Desk Audits Audit
Performance Calculations Audit Audit
Quarterly Investment and Ethics Policies Compliance Testing Agreed-Upon Procedures 1st Quarter Complete
Annual Testing of Investment Incentive Pay Plan Agreed-Upon Procedures In Progress
Investment Committees Attendance Advisory Ongoing
Internal Audit Department
Annual Internal Audit Report Administrative Complete
Data Analysis Process Buildout Administrative
Quarterly Audit Recommendations Follow-up Administrative Ongoing
Internal Quality Assurance Review Administrative
Fiscal Year 2019 Audit Plan Administrative
Employer Audit Process Re-engineering Administrative In Progress
Internal Audit Staff Training Initiative Administrative
Audit Committee Meetings Preparation Administrative Ongoing

December 2017 Board Audit Committee Meeting 8
Internal Audit Advisory Services1 Fiscal Year 2018 – 1st Quarter
BENEFIT SERVICES
Participated in the TEAM Program o Enterprise Projects Oversight Committee (EPOC) o Organizational Change Management Advisory Group (OCM) o Monthly meetings with TEAM Program Manager and vendor personnel o Independent Program Assessment (IPA) Vendor Coordination
Facilitated discussions on observations around TRUST access controls and segregation of duties
controls
HEALTH INSURANCE BENEFITS (HIB)
Attended the Health Plan Administrator (HPA) and Pharmacy Benefit Manager (PBM) Vendor Quarterly Update Meetings
Attended weekly update calls during the Annual Enrollment Period
INVESTMENT MANAGEMENT DIVISION (IMD)
Attended Internal Investment Committee (IIC) meetings Participated in quarterly Proxy Voting Committee meeting Participated in monthly Securities Lending monitoring calls Liaison for Grant Thornton’s (GT) Fiscal Year 2017 Annual Financial Report Audit of Teacher
Retirement Investment Company of Texas, Ltd. (TRICOT)
FINANCIAL SERVICES
Liaison for the State Auditor’s Office (SAO) Fiscal Year 2017 Comprehensive Annual Financial Report (CAFR) Audit
Participated in project team meetings for new financial system replacement
EXECUTIVE
Facilitated SAO’s Quarterly Update Meetings Participated in the Risk Oversight Committee Participated in Health and Safety Committee Quarterly Meetings Monthly collaboration meetings with Enterprise Risk Management (ERM) management Participated in the Records Management Cross-functional Workgroup
INFORMATION TECHNOLOGY (IT)
Tracking outstanding audit recommendations from HIPAA Gap Assessment Project and Audit of On/Off Boarding Processes of Non-TRS Workers
1 Advisory Services (non-audit services) - The scope of work performed does not constitute an audit under Generally Accepted Government Auditing Standards (GAGAS).

December 2017 Board Audit Committee Meeting 9
Promotions and Certifications
Nick Ballard was promoted to Internal Audit Manager in October. He also passed Part I of the Certified
Internal Auditor exams in November. Professional Organization Activities and Conferences
Simin Pang served as one of the panel judges for the Best Project Award Competition in the IT Audit & Security Course at UT Austin. This competition is one of the ISACA-Austin Academic Projects.
Amy Barrett was elected for another term as Secretary to the Association of Public Pension Fund Auditors (APPFA) Board.
Hugh Ohn, Simin Pang, Rodrigo Dominguez, and Amy Barrett attended the APPFA conference in Sacramento, California, November 6 – 9. Topics covered: controlling costs, real estate investment management, LEAN process improvement, cyber security risks, employer audits, and direct investing.
While in Sacramento, Internal Audit met with State Street accounting and derivatives staff. Hugh Ohn provided an overview of TRS Internal Audit and how we use the information provided by State Street in our work.
Art Mata, Anandhi Mani, and Cari Casey attended the 2017 P2F2 conference in Albuquerque, New Mexico, October 22-25. Topics covered: OPEB Implementation, GASB 67 & 68, Census Data, Cyber Security, Ethics, Fee Transparency in Alternate Funds, SOC Reports and current Federal Legislation and Tax Issues.
Anandhi Mani participated in the P2F2 Conference Speaker Committee
Toma Miller, Art Mata, and Cari Casey volunteered, and Anandhi Mani and Lih-Jen Lan attended, the 2017 Southern Regional Conference for the Institute of Internal Auditors held in Austin, TX, September 17-20. Topics covered: general auditing, IT/data analytics, fraud and ethics, and government and industry trends.
New Hire
New IA Staff - Mary Presley, an experienced TRS IT Quality Assurance Team (QAT) member joined Internal Audit as a Senior IT Consultant in November.
Mary holds a master degree in Computer Education from Johnson and Wales University, Rhodes Island. She also holds two Microsoft certificates: Microsoft Certified Professional (MCP) and Microsoft Certified Application Developer (MCAD). Her work experience includes 10 years in top IT companies such as Verizon, CISCO, and MCI as software engineer and web developer. She then worked for Texas Education Agency (TEA) developing and maintaining five web applications, workflow and FileNet systems for near 10 years. In 2015, she joined TRS QAT team performing QA tests for TEAM TRUST system prior to transfer to Internal Audit.
Internal Audit Staff Accomplishments