december 2002 horizon research, inc. sherri l. fulp 326...
TRANSCRIPT

December 2002
Horizon Research, Inc. Sherri L. Fulp 326 Cloister Court Chapel Hill, NC. 27514
www.horizon-research.com

The 2000 National Survey of Science and Mathematics Education: Status of Elementary School Science Teaching was prepared with support from the National Science Foundation under grant number REC-9814246. These writings do not necessarily reflect he views of the National Science Foundation.
Horizon Research, Inc. 1 Status of Elementary School Science Teaching
Status of Elementary School Science Teaching
Introduction The 2000 National Survey of Science and Mathematics Education was designed to provide up-to-date information and to identify trends in the areas of teacher background and experience, curriculum and instruction, and the availability and use of instructional resources. A total of 5,728 science and mathematics teachers in schools across the United States participated in this survey, a response rate of 74 percent. Among the questions addressed by the survey:
• How well prepared are science and mathematics teachers in terms of both content and pedagogy?
• What are teachers trying to accomplish in their science and mathematics instruction,
and what activities do they use to meet these objectives? The 2000 National Survey is based on a national probability sample of schools and science and mathematics teachers in grades K–12 in the 50 states and the District of Columbia. The sample was designed to allow national estimates of science and mathematics course offerings and enrollment; teacher background preparation; textbook usage; instructional techniques; and availability and use of science and mathematics facilities and equipment. Every eligible school and teacher in the target population had a known, positive probability of being drawn into the sample. This report describes the status of elementary (grades K–5) school science instruction based on the responses of 655 science teachers, 320 grade K–2 teachers and 335 grade 3–5 teachers. Technical detail on the survey sample design, as well as data collection and analysis procedures, is included in the Report of the 2000 National Survey of Science and Mathematics Education (Weiss, Banilower, McMahon, & Smith, 2001). The standard errors for the estimates presented in this report are included in parentheses in the tables. The narrative sections of the report generally point out only those differences which are substantial as well as statistically significant at the 0.05 level or beyond. This status report of elementary school science teaching is organized into major topical areas:
• Characteristics of the elementary school science teaching force in the United States; • Professional development of elementary school science teachers, both needs and
participation; • Elementary school science instruction, in terms of objectives, time spent, and class
activities used; and • Resources available for elementary school science instruction.

Horizon Research, Inc. 2 Status of Elementary School Science Teaching
Characteristics of the
Elementary School Science Teaching Force General Demographics Elementary school science teachers in the United States are predominately white females, as shown in Table 1. Forty-two percent possess a master’s degree. Sixty percent of the elementary school science teaching force is over the age of 40.
Table 1 Characteristics of the
Elementary School Science Teaching Force Percent of Teachers
Grades K–5 Grades K–2 Grades 3–5 Sex
Male 9 (1.4) 3 (1.1) 15 (2.3) Female 91 (1.4) 97 (1.1) 85 (2.3)
Race American Indian or Alaskan Native 1 (0.3) 1 (0.5) 0 (0.3) Asian 1 (0.9) 1 (0.6) 2 (1.3) Black or African-American 5 (0.8) 6 (1.3) 5 (1.1) Hispanic or Latino 4 (1.0) 4 (1.5) 3 (0.9) Native Hawaiian or Other Pacific Islander 0 (0.1) 0 (0.2) 0 (0.0) White 88 (1.7) 87 (2.2) 89 (2.1)
Age < 30 years 20 (2.0) 20 (2.7) 20 (2.4) 31–40 years 20 (1.7) 21 (2.6) 18 (2.4) 41–50 years 33 (2.0) 35 (3.1) 32 (3.1) 50 + years 27 (1.8) 24 (2.6) 30 (3.4)
Experience 0–2 years 15 (1.6) 14 (2.0) 15 (2.5) 3–5 years 15 (1.4) 19 (2.0) 11 (2.1) 6–10 years 16 (1.7) 17 (2.5) 16 (2.0) 11–20 years 27 (1.8) 29 (2.4) 25 (2.5) > 20 years 27 (2.3) 21 (2.3) 33 (3.6)
Master’s Degree Yes 42 (2.5) 35 (3.0) 49 (4.0)
No 58 (2.5) 65 (3.0) 51 (4.0)
Content Preparedness National standards call for the introduction of science content to all students beginning in the early grades. If elementary teachers are going to effectively guide students in their exploration of science concepts, they must themselves have a good understanding of those concepts. The 2002 National Survey uses proxy measures such as majors or number of science courses taken to indicate the extent to which elementary teachers are likely to understand science concepts. As can be seen in Table 2, only 4 percent of elementary school science teachers have undergraduate degrees in science or science education. The majority (86 percent) have majors in education.
Horizon Research, Inc. 3 Status of Elementary School Science Teaching
Table 2
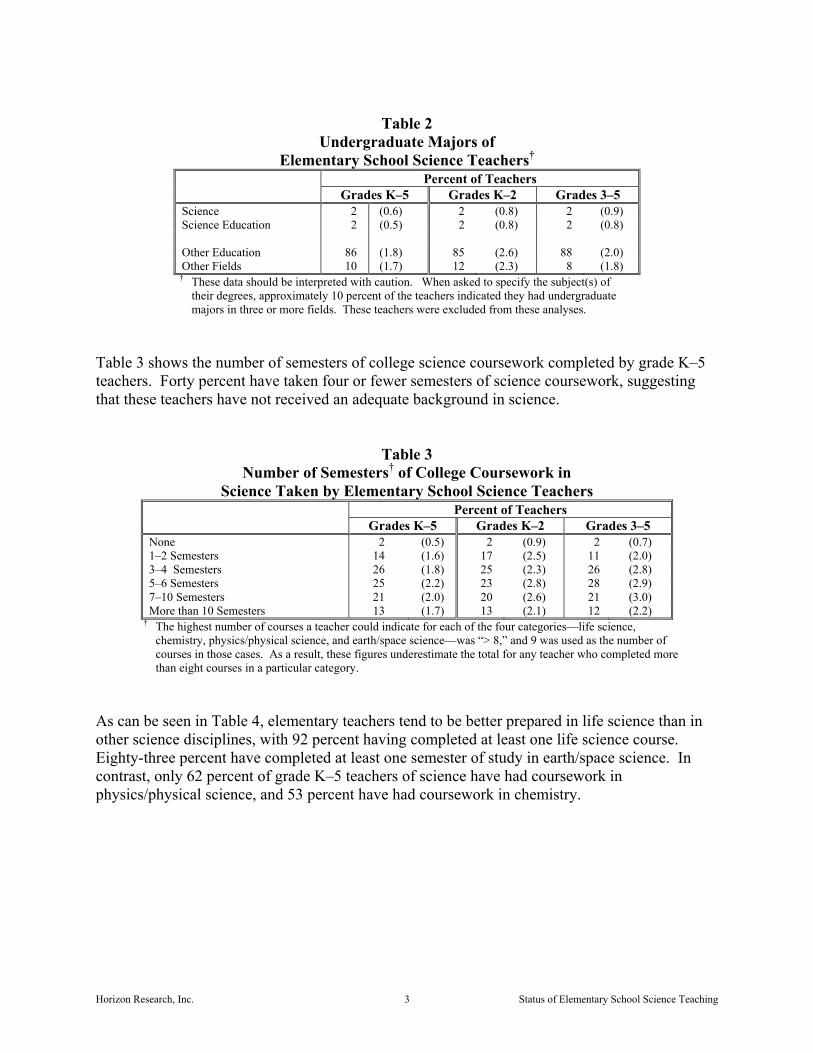
Undergraduate Majors of Elementary School Science Teachers†
Percent of Teachers Grades K–5 Grades K–2 Grades 3–5
Science 2 (0.6) 2 (0.8) 2 (0.9) Science Education 2 (0.5) 2 (0.8) 2 (0.8) Other Education 86 (1.8) 85 (2.6) 88 (2.0) Other Fields 10 (1.7) 12 (2.3) 8 (1.8)
† These data should be interpreted with caution. When asked to specify the subject(s) of their degrees, approximately 10 percent of the teachers indicated they had undergraduate majors in three or more fields. These teachers were excluded from these analyses.
Table 3 shows the number of semesters of college science coursework completed by grade K–5 teachers. Forty percent have taken four or fewer semesters of science coursework, suggesting that these teachers have not received an adequate background in science.
Table 3 Number of Semesters† of College Coursework in
Science Taken by Elementary School Science Teachers Percent of Teachers
Grades K–5 Grades K–2 Grades 3–5 None 2 (0.5) 2 (0.9) 2 (0.7) 1–2 Semesters 14 (1.6) 17 (2.5) 11 (2.0) 3–4 Semesters 26 (1.8) 25 (2.3) 26 (2.8) 5–6 Semesters 25 (2.2) 23 (2.8) 28 (2.9) 7–10 Semesters 21 (2.0) 20 (2.6) 21 (3.0) More than 10 Semesters 13 (1.7) 13 (2.1) 12 (2.2)
† The highest number of courses a teacher could indicate for each of the four categories—life science, chemistry, physics/physical science, and earth/space science—was “> 8,” and 9 was used as the number of courses in those cases. As a result, these figures underestimate the total for any teacher who completed more than eight courses in a particular category.
As can be seen in Table 4, elementary teachers tend to be better prepared in life science than in other science disciplines, with 92 percent having completed at least one life science course. Eighty-three percent have completed at least one semester of study in earth/space science. In contrast, only 62 percent of grade K–5 teachers of science have had coursework in physics/physical science, and 53 percent have had coursework in chemistry.

Horizon Research, Inc. 4 Status of Elementary School Science Teaching
Table 4 Elementary School Science Teachers
Completing Various College Courses, by Topics Percent of Teachers
Grades K–5 Grades K–2 Grades 3–5 Life science
None 8 (1.3) 9 (2.0) 8 (1.6) 1–2 semesters 63 (2.3) 64 (3.3) 61 (2.8) 3–5 semesters 20 (2.0) 18 (2.4) 23 (2.9) 6 or more semesters 8 (1.4) 9 (2.0) 8 (1.7)
Chemistry None 47 (2.4) 51 (2.8) 43 (3.8) 1–2 semesters 44 (2.3) 41 (3.0) 49 (3.3) 3–5 semesters 7 (1.1) 8 (1.6) 6 (1.6) 6 or more semesters 2 (0.5) 1 (0.6) 2 (0.8)
Physics/physical science None 38 (2.2) 40 (3.4) 36 (3.2) 1–2 semesters 51 (2.3) 49 (3.7) 53 (3.2) 3–5 semesters 9 (1.4) 10 (1.7) 9 (1.9) 6 or more semesters 1 (0.5) 1 (0.5) 2 (0.8)
Earth/space science None 17 (1.5) 17 (2.3) 17 (2.4) 1–2 semesters 54 (2.3) 55 (2.8) 53 (3.2) 3–5 semesters 25 (1.8) 24 (2.5) 27 (2.6) 6 or more semesters 4 (0.8) 5 (1.2) 3 (1.0)
Science education None 23 (2.3) 27 (3.3) 19 (2.3) 1–2 semesters 55 (2.6) 53 (3.7) 58 (2.9) 3–5 semesters 16 (1.7) 15 (2.5) 17 (2.4) 6 or more semesters 6 (1.0) 6 (1.4) 6 (1.3)
The National Science Teachers Association (NSTA) has recommended that the preparation of elementary school science teachers include coursework in science education as well as content in life, earth/space, physical, and environmental science (National Science Teachers Association, 1998). Using completion of a college course as a proxy for competency, Table 5 shows that 54 percent of the science teachers in grades K–5 meet those standards, and another 24 percent meet the science education coursework standard but lack one science content course.
Table 5 Elementary School Science Teachers
Meeting NSTA Course-Background Standards Percent of Teachers
Grades K–5 Grades K–2 Grades 3–5 Coursework in each science discipline plus science education 54 (2.4) 49 (3.5) 59 (2.9) Lack science education only 11 (1.8) 13 (2.8) 9 (1.9) Lack one science discipline 24 (1.8) 26 (2.7) 22 (2.7) Lack two science disciplines 9 (1.2) 10 (1.8) 8 (1.7) Lack three science disciplines 2 (0.5) 2 (0.9) 2 (0.7)

Horizon Research, Inc. 5 Status of Elementary School Science Teaching
Elementary school science teachers’ minimal background in science is reflected in the teachers’ perceptions of their own content preparedness. Since elementary teachers are typically responsible for teaching not only science, but also mathematics, reading/language arts, and other academic subjects to one group of students, the survey asked them to rate their content preparedness in each of those subjects. (See Table 6.) Fewer than one-third of elementary teachers reported feeling very well qualified to teach each of the science disciplines. More grade K–5 teachers stated feeling very well qualified to teach life science and earth science than physical science, which is consistent with teacher reports of their college coursework. It is clear that elementary school teachers do not feel equally qualified to teach all academic subjects, with preparedness to teach science paling in comparison to mathematics, language arts, and social studies. Where fewer than 3 in 10 elementary teachers reported feeling well prepared to teach the sciences, 77 percent indicated that they were very well qualified to teach reading/language arts. Large percentages of teachers reported the same high level of qualification to teach mathematics (66 percent) and social studies (52 percent).
Table 6 Elementary School Science Teachers’† Perceptions of
Their Qualifications to Teach Each of a Number of Subjects Percent of Teachers Grades K–5 Grades K–2 Grades 3–5
Not Well Qualified Life Science 10 (1.6) 9 (2.3) 10 (2.1) Earth Science 13 (1.8) 14 (2.7) 11 (2.8) Physical Science 27 (2.7) 25 (3.7) 30 (3.8) Mathematics 1 (0.5) 1 (0.7) 1 (0.9) Reading/Language Arts 1 (0.4) 0 (0.3) 1 (0.7) Social Studies 5 (1.1) 4 (1.5) 7 (1.7)
Adequately Qualified Life Science 63 (2.7) 61 (3.6) 65 (3.7) Earth Science 64 (2.5) 61 (3.2) 68 (4.0) Physical Science 59 (2.8) 59 (4.1) 59 (3.9) Mathematics 33 (1.8) 36 (3.1) 29 (2.8) Reading/Language Arts 22 (2.2) 18 (2.8) 27 (3.1) Social Studies 43 (2.6) 43 (3.1) 42 (3.7)
Very Well Qualified Life Science 28 (2.2) 30 (3.2) 25 (2.9) Earth Science 24 (1.9) 26 (2.4) 21 (3.0) Physical Science 14 (1.5) 16 (2.0) 12 (2.0) Mathematics 66 (1.8) 63 (3.2) 70 (3.0) Reading/Language Arts 77 (2.2) 81 (2.8) 72 (3.1) Social Studies 52 (2.5) 53 (3.1) 51 (3.7)
† Only teachers who indicated they were teaching science, mathematics, reading/language arts, and social studies to one class of students were included in these analyses.
Pedagogical Preparedness The 2000 National Survey asked teachers if they were familiar with the National Research Council (NRC) National Science Education Standards, published in 1996. As can be seen in
Horizon Research, Inc. 6 Status of Elementary School Science Teaching
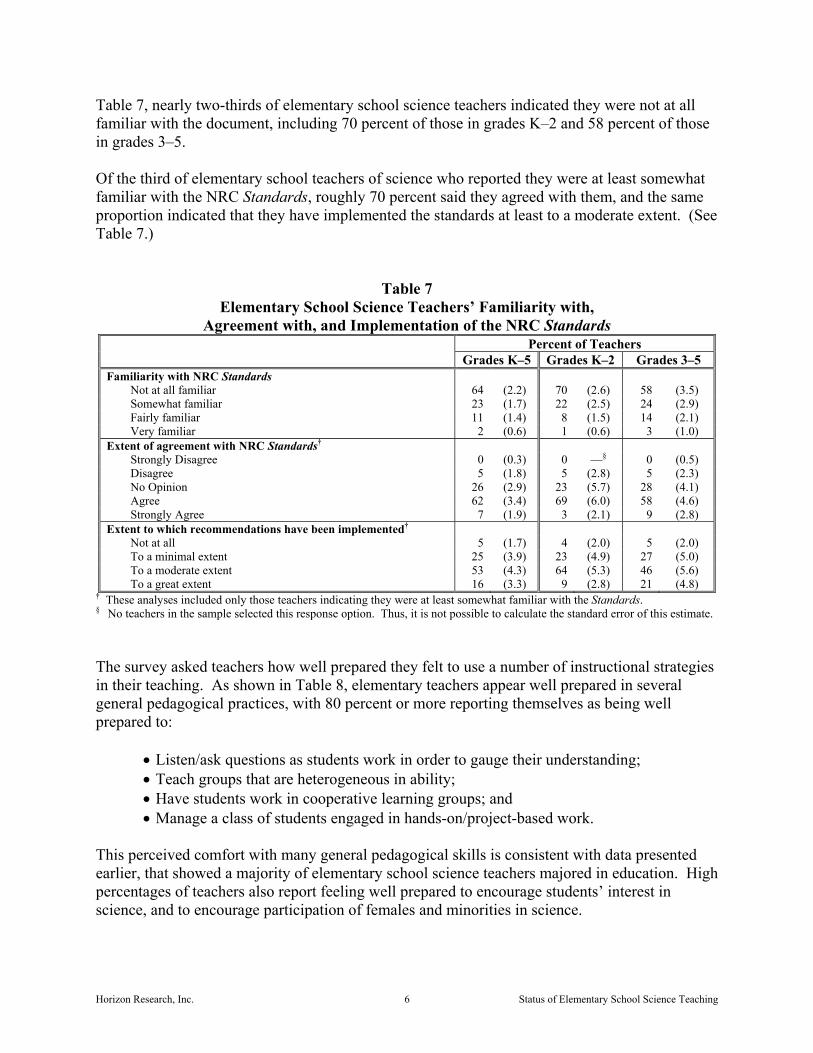
Table 7, nearly two-thirds of elementary school science teachers indicated they were not at all familiar with the document, including 70 percent of those in grades K–2 and 58 percent of those in grades 3–5. Of the third of elementary school teachers of science who reported they were at least somewhat familiar with the NRC Standards, roughly 70 percent said they agreed with them, and the same proportion indicated that they have implemented the standards at least to a moderate extent. (See Table 7.)
Table 7 Elementary School Science Teachers’ Familiarity with,
Agreement with, and Implementation of the NRC Standards Percent of Teachers
Grades K–5 Grades K–2 Grades 3–5 Familiarity with NRC Standards
Not at all familiar 64 (2.2) 70 (2.6) 58 (3.5) Somewhat familiar 23 (1.7) 22 (2.5) 24 (2.9) Fairly familiar 11 (1.4) 8 (1.5) 14 (2.1) Very familiar 2 (0.6) 1 (0.6) 3 (1.0)
Extent of agreement with NRC Standards† Strongly Disagree 0 (0.3) 0 —§ 0 (0.5) Disagree 5 (1.8) 5 (2.8) 5 (2.3) No Opinion 26 (2.9) 23 (5.7) 28 (4.1) Agree 62 (3.4) 69 (6.0) 58 (4.6) Strongly Agree 7 (1.9) 3 (2.1) 9 (2.8)
Extent to which recommendations have been implemented† Not at all 5 (1.7) 4 (2.0) 5 (2.0) To a minimal extent 25 (3.9) 23 (4.9) 27 (5.0) To a moderate extent 53 (4.3) 64 (5.3) 46 (5.6) To a great extent 16 (3.3) 9 (2.8) 21 (4.8)
† These analyses included only those teachers indicating they were at least somewhat familiar with the Standards. § No teachers in the sample selected this response option. Thus, it is not possible to calculate the standard error of this estimate. The survey asked teachers how well prepared they felt to use a number of instructional strategies in their teaching. As shown in Table 8, elementary teachers appear well prepared in several general pedagogical practices, with 80 percent or more reporting themselves as being well prepared to:
• Listen/ask questions as students work in order to gauge their understanding; • Teach groups that are heterogeneous in ability; • Have students work in cooperative learning groups; and • Manage a class of students engaged in hands-on/project-based work.
This perceived comfort with many general pedagogical skills is consistent with data presented earlier, that showed a majority of elementary school science teachers majored in education. High percentages of teachers also report feeling well prepared to encourage students’ interest in science, and to encourage participation of females and minorities in science.

Horizon Research, Inc. 7 Status of Elementary School Science Teaching
Table 8 Elementary School Science Teachers Considering
Themselves Well Prepared† for Each of a Number of Tasks Percent of Teachers
Grades K–5 Grades K–2 Grades 3–5Encourage participation of females in science 93 (1.2) 94 (1.5) 92 (1.8) Encourage students’ interest in science 89 (1.5) 88 (2.1) 91 (2.0) Listen/ask questions as students work in order to gauge their
understanding 88 (1.5) 89 (1.8) 87 (2.5) Encourage participation of minorities in science 87 (1.6) 88 (1.9) 86 (2.4) Teach groups that are heterogeneous in ability 87 (1.8) 88 (2.3) 85 (2.4) Have students work in cooperative learning groups 84 (1.8) 81 (2.8) 88 (2.0) Manage a class of students engaged in hands-on/project-based work 80 (2.0) 79 (3.1) 81 (2.6) Use the textbook as a resource rather than the primary instructional tool 77 (2.3) 79 (2.8) 74 (3.2) Make connections between science and other disciplines 77 (1.6) 77 (2.7) 77 (2.7) Develop students’ conceptual understanding of science 75 (2.1) 74 (2.7) 77 (3.1) Take students’ prior understanding into account when planning
curriculum and instruction 71 (2.1) 75 (2.7) 68 (3.5) Recognize and respond to student cultural diversity 65 (2.2) 61 (3.3) 69 (3.0) Lead a class of students using investigative strategies 64 (2.1) 59 (3.4) 68 (3.0) Provide deeper coverage of fewer science concepts 63 (2.0) 57 (3.0) 69 (3.0) Involve parents in the science education of their children 48 (2.1) 48 (3.3) 48 (3.0) Use calculators/computers for drill and practice 47 (2.5) 43 (3.1) 50 (3.7) Use the Internet in your science teaching for general reference 40 (2.5) 36 (3.3) 43 (3.1) Use calculators/computers for science learning games 38 (2.3) 35 (3.2) 40 (3.0) Use calculators/computers to collect and/or analyze data 32 (2.3) 26 (3.0) 37 (3.1) Use the Internet in your science teaching for data acquisition 31 (2.3) 25 (2.9) 36 (3.0) Teach students who have limited English proficiency 30 (2.2) 32 (3.0) 28 (3.3) Use calculators/computers to demonstrate scientific principles 20 (1.8) 16 (2.5) 23 (2.7) Use the Internet in your science teaching for collaborative projects with
classes/individuals in other schools 17 (1.8) 12 (2.4) 21 (2.8) Use calculators/computers for laboratory simulations 13 (1.5) 10 (2.1) 17 (2.5)
† Includes teachers responding “very well prepared” or “fairly well prepared” to each statement. Smaller percentages of grade K–5 teachers, ranging between 63 and 77 percent, rated themselves as being well prepared to implement a number of practices thought of as being closely aligned with the Standards:
• Make connections between science and other disciplines; • Develop students’ conceptual understanding of science; • Take students’ prior understanding into account when planning curriculum and
instruction; • Lead a class of students using investigative strategies; and • Provide deeper coverage of fewer science concepts.
Judging from the data in Table 8, increasing technology skills continues to be a need for elementary teachers, especially when it comes to using the Internet. However, feelings of technology preparedness tended to increase with increasing grade range. For example, 25

Horizon Research, Inc. 8 Status of Elementary School Science Teaching
percent of grade K–2 science teachers indicated they were well prepared to use the Internet in their science teaching for data acquisition, compared to 36 percent of their grade 3–5 counterparts. Fewer than half of all elementary school science teachers indicate that they are well prepared to use calculators/computers in their science teaching in each of a number of ways. Based on the results of factor analysis, the items in Table 8 were combined into four pedagogical preparedness composite variables. (Definitions of all composite variables, descriptions of how they were created, and reliability information are included in the Appendix.) Each composite has a minimum possible score of 0 and a maximum possible score of 100. Table 9 displays the composite scores related to elementary teachers’ pedagogical preparedness by grade range. Mean scores on these composites suggest that elementary school science teachers feel fairly well prepared to teach students from diverse backgrounds and to use standards-based teaching practices; they are less likely to feel prepared in technology-related areas.
Table 9 Composite Scores of Elementary School
Science Teachers’ Pedagogical Preparedness Mean Score
Grades K–5 Grades K–2 Grades 3–5 Preparedness to Teach Students from Diverse Backgrounds 74 (0.9) 73 (1.2) 74 (1.5) Preparedness to Use Standards Based Teaching Practices 67 (0.8) 66 (1.2) 68 (1.2) Preparedness to Use Calculators/Computers 33 (1.3) 29 (1.9) 36 (1.7) Preparedness to Use the Internet 30 (1.5) 26 (1.8) 34 (2.0)
Additionally, teachers’ ratings of their pedagogical preparedness are reflected in the areas they identify as needs for professional development. The survey asked about six different areas, shown in Table 10. It is not surprising to see that a majority (84 percent) of grade K–5 teachers perceived a substantial need for professional development in learning how to use technology in science instruction, followed by a need for deepening their science content knowledge (72 percent) given the data about their lack of preparedness in these areas.
Table 10 Elementary School Science Teachers Reporting They Perceived a
Moderate or Substantial Need for Professional Development n the Preceding Three Years Percent of Teachers
Grades K–5 Grades K–2 Grades 3–5Learning how to use technology in science instruction 84 (1.7) 87 (2.3) 81 (2.7) Deepening my own science content knowledge 72 (2.0) 74 (2.7) 70 (3.0) Learning how to use inquiry/investigation-oriented teaching strategies 65 (2.1) 64 (3.1) 66 (3.3) Understanding student thinking in science 63 (2.4) 62 (2.8) 63 (3.7) Learning how to assess student learning in science 60 (2.4) 58 (3.2) 61 (3.5) Learning how to teach science in a class that includes students with
special needs 59 (2.5) 60 (3.0) 57 (3.4)
Horizon Research, Inc. 9 Status of Elementary School Science Teaching
Professional Development of
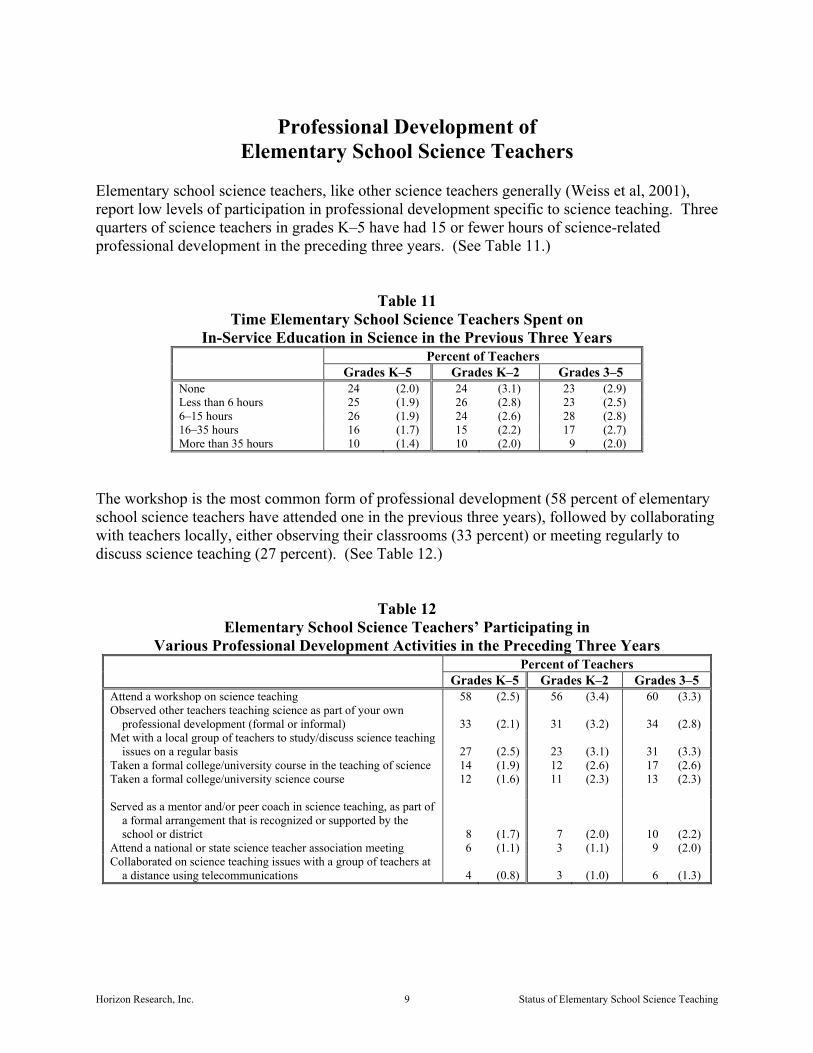
Elementary School Science Teachers Elementary school science teachers, like other science teachers generally (Weiss et al, 2001), report low levels of participation in professional development specific to science teaching. Three quarters of science teachers in grades K–5 have had 15 or fewer hours of science-related professional development in the preceding three years. (See Table 11.)
Table 11 Time Elementary School Science Teachers Spent on
In-Service Education in Science in the Previous Three Years Percent of Teachers
Grades K–5 Grades K–2 Grades 3–5 None 24 (2.0) 24 (3.1) 23 (2.9) Less than 6 hours 25 (1.9) 26 (2.8) 23 (2.5) 6–15 hours 26 (1.9) 24 (2.6) 28 (2.8) 16–35 hours 16 (1.7) 15 (2.2) 17 (2.7) More than 35 hours 10 (1.4) 10 (2.0) 9 (2.0)
The workshop is the most common form of professional development (58 percent of elementary school science teachers have attended one in the previous three years), followed by collaborating with teachers locally, either observing their classrooms (33 percent) or meeting regularly to discuss science teaching (27 percent). (See Table 12.)
Table 12 Elementary School Science Teachers’ Participating in
Various Professional Development Activities in the Preceding Three Years Percent of Teachers
Grades K–5 Grades K–2 Grades 3–5 Attend a workshop on science teaching 58 (2.5) 56 (3.4) 60 (3.3) Observed other teachers teaching science as part of your own
professional development (formal or informal) 33 (2.1) 31 (3.2) 34 (2.8) Met with a local group of teachers to study/discuss science teaching
issues on a regular basis 27 (2.5) 23 (3.1) 31 (3.3) Taken a formal college/university course in the teaching of science 14 (1.9) 12 (2.6) 17 (2.6) Taken a formal college/university science course 12 (1.6) 11 (2.3) 13 (2.3) Served as a mentor and/or peer coach in science teaching, as part of
a formal arrangement that is recognized or supported by the school or district 8 (1.7) 7 (2.0) 10 (2.2)
Attend a national or state science teacher association meeting 6 (1.1) 3 (1.1) 9 (2.0) Collaborated on science teaching issues with a group of teachers at
a distance using telecommunications 4 (0.8) 3 (1.0) 6 (1.3)

Horizon Research, Inc. 10 Status of Elementary School Science Teaching
A closer look at the data on most recent college coursework, in Table 13, indicates that 58 percent of elementary teachers have not taken a college/university science course since 1990, and 49 percent have not taken either a science course or a course on how to teach science since 1990. These data indicate a serious need for retooling a large percentage of the elementary school science teaching force.
Table 13 Elementary School Science Teachers’
Most Recent College Coursework in Field Percent of Teachers
Grades K–5 Grades K–2 Grades 3–5 Science
1996–2000 19 (1.8) 18 (2.7) 21 (2.6) 1990–1995 23 (1.9) 23 (2.8) 22 (2.8) Prior to 1990 58 (2.5) 59 (3.6) 57 (3.5)
The Teaching of Science 1996–2000 22 (1.8) 21 (2.6) 23 (2.7) 1990–1995 21 (2.1) 24 (3.2) 18 (2.4) Prior to 1990 40 (2.6) 36 (3.7) 43 (3.5) Never 17 (1.5) 18 (2.4) 17 (1.9)
Science or the Teaching of Science 1996–2000 27 (2.0) 26 (3.0) 29 (3.1) 1990–1995 24 (2.1) 28 (3.3) 20 (2.7) Prior to 1990 49 (2.5) 46 (3.7) 51 (3.5)
Teachers were asked to consider their professional development as a whole and characterize it in terms of different potential emphases. (See Table 14.) Learning how to use inquiry/ investigation-oriented teaching strategies, understanding student thinking in science, and deepening science content knowledge were each identified by one-fifth or more of K–5 teachers as areas heavily emphasized during their professional development.
Table 14 Elementary School Science Teachers Reporting that Their
Professional Development Gave Heavy Emphasis to Various Areas Percent of Teachers
Grades K–5 Grades K–2 Grades 3–5 Learning how to use inquiry/investigation-oriented teaching strategies 29 (2.3) 24 (2.8) 35 (3.4) Understanding student thinking in science 23 (2.3) 20 (2.7) 26 (3.3) Deepening my own science content knowledge 21 (2.1) 16 (2.0) 25 (3.5) Learning how to assess learning in science 18 (2.0) 15 (2.4) 22 (2.9) Learning how to use technology in science instruction 17 (1.7) 15 (2.4) 19 (2.8) Learning how to teach science in a class that includes students with
special needs 9 (1.5) 8 (2.0) 11 (2.4) It is interesting to note that there is a very poor match between needs and opportunities in terms of technology; this was the most highly rated need (more than 80 percent of teachers), but only 17 percent indicated their professional development emphasized this area. The same is true for

Horizon Research, Inc. 11 Status of Elementary School Science Teaching
the match between the needs and opportunities in terms of learning how to teach science to special needs students. Fifty-nine percent rated this as a need, but only 9 percent reported this area being heavily emphasized in their professional development.
Elementary School Science Instruction The next three sections draw on teachers’ descriptions of what transpires during elementary school science instruction in the United States, in terms of instructional objectives, time spent, and class activities. Each teacher responding to the survey who taught science to more than one class per day was asked to provide detailed information about a randomly selected class. Instructional Objectives Teachers were given a list of potential objectives and asked to rate each in terms of the emphasis they received in the randomly selected class. As can be seen in Table 15, the majority of elementary school science teachers (68 percent) reported giving a heavy emphasis to learning basic science concepts, followed by increasing students’ interest in science (57 percent). Fewer than half place a heavy emphasis on learning important terms and facts of science (42 percent) and learning science process/inquiry skills (41 percent).
Table 15 Elementary School Science Classes with
Heavy Emphasis on Various Instructional Objectives Percent of Classes
Grades K–5 Grades K–2 Grades 3–5 Learn basic science concepts 68 (2.6) 61 (3.7) 74 (2.8) Increase students’ interest in science 57 (2.2) 56 (3.4) 58 (3.1) Learn important terms and facts of science 42 (2.6) 34 (3.4) 48 (3.5) Learn science process/inquiry skills 41 (2.5) 31 (3.3) 51 (3.3) Prepare for further study in science 25 (2.0) 23 (2.9) 27 (2.7) Learn how to communicate ideas in science effectively 23 (1.8) 17 (2.5) 29 (3.1) Prepare for standardized tests 21 (1.9) 14 (2.3) 28 (3.1) Learn about the relationship between science, technology, and society 11 (1.4) 5 (1.2) 16 (2.4) Learn to evaluate arguments based on scientific evidence 9 (1.3) 4 (1.1) 13 (2.2) Learn about the history and nature of science 7 (1.3) 4 (1.2) 10 (2.1) Learn about the applications of science in business and industry 5 (1.0) 2 (0.8) 7 (1.8)
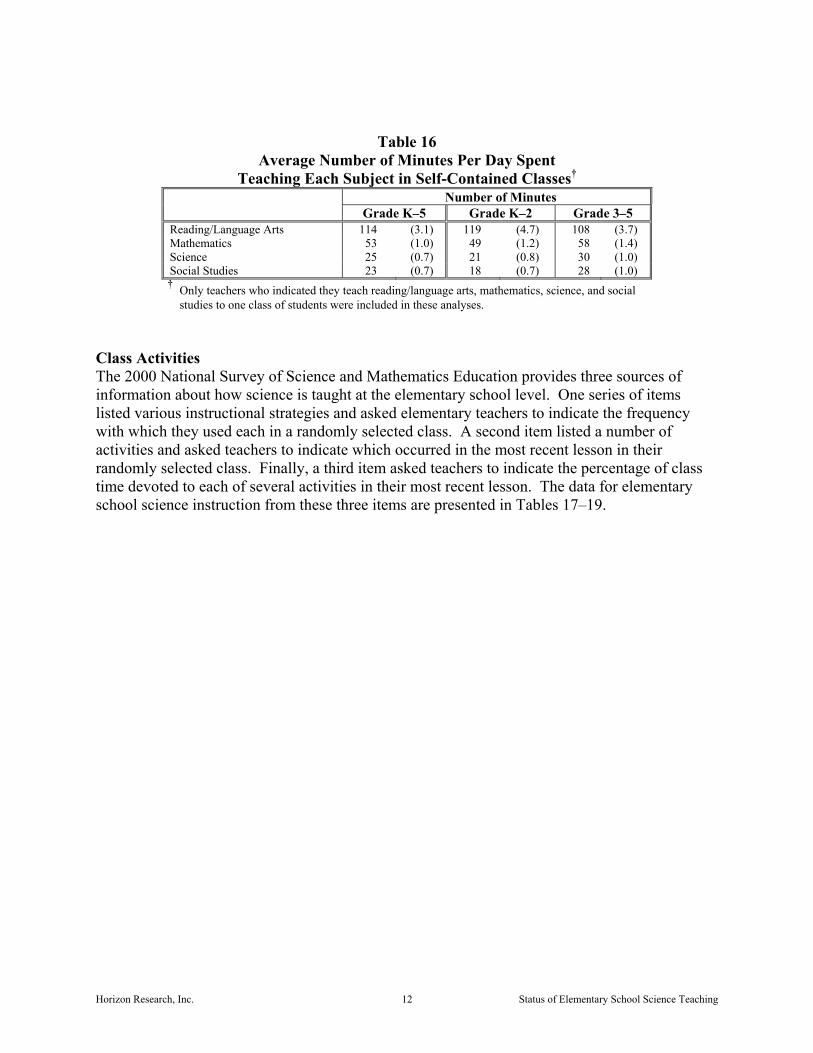
Time Spent The average number of minutes per day typically spent on instruction in reading/language arts, mathematics, science, and social studies are shown in Table 16. To facilitate comparisons among the subject areas, only teachers who teach all four of these subjects to one class of students were included in the analyses. Grade K–5 self-contained classes spent an average of 25 minutes each day in science instruction, compared to 114 minutes on reading/language arts, 53 minutes in mathematics, and 23 minutes in social studies.
Horizon Research, Inc. 12 Status of Elementary School Science Teaching
Table 16 Average Number of Minutes Per Day Spent
Teaching Each Subject in Self-Contained Classes† Number of Minutes Grade K–5 Grade K–2 Grade 3–5 Reading/Language Arts 114 (3.1) 119 (4.7) 108 (3.7) Mathematics 53 (1.0) 49 (1.2) 58 (1.4) Science 25 (0.7) 21 (0.8) 30 (1.0) Social Studies 23 (0.7) 18 (0.7) 28 (1.0) † Only teachers who indicated they teach reading/language arts, mathematics, science, and social
studies to one class of students were included in these analyses. Class Activities The 2000 National Survey of Science and Mathematics Education provides three sources of information about how science is taught at the elementary school level. One series of items listed various instructional strategies and asked elementary teachers to indicate the frequency with which they used each in a randomly selected class. A second item listed a number of activities and asked teachers to indicate which occurred in the most recent lesson in their randomly selected class. Finally, a third item asked teachers to indicate the percentage of class time devoted to each of several activities in their most recent lesson. The data for elementary school science instruction from these three items are presented in Tables 17–19.

Horizon Research, Inc. 13 Status of Elementary School Science Teaching
Table 17 Elementary School Science Classes Where Teachers Report that
Students Take Part in Various Instructional Activities at Least Once a Week Percent of Classes
Grades K–5 Grades K–2 Grades 3–5 Work in groups 67 (2.4) 63 (3.3) 71 (2.8) Do hands-on/laboratory science activities or investigations 52 (3.0) 49 (3.3) 55 (4.0) Follow specific instructions in an activity or investigation 48 (2.7) 39 (3.2) 56 (3.7) Read other science-related materials in class 43 (2.4) 43 (3.3) 44 (3.2) Read from a science textbook in class 34 (2.4) 19 (2.8) 48 (3.4) Watch a science demonstration 31 (2.7) 30 (3.0) 33 (3.5) Answer textbook or worksheet questions 31 (2.1) 15 (2.4) 46 (3.0) Record, represent, and/or analyze data 30 (2.6) 27 (3.3) 34 (3.3) Use mathematics as a tool in problem-solving 25 (2.1) 23 (3.0) 27 (2.8) Write reflections 24 (2.3) 20 (3.0) 27 (2.8) Listen and take notes during presentation by teacher 19 (1.7) 4 (1.1) 33 (2.9) Watch audiovisual presentations 18 (2.1) 17 (2.4) 20 (2.7) Work on extended science investigations or projects 9 (1.3) 9 (1.8) 8 (1.8) Design or implement their own investigation 8 (1.4) 7 (1.7) 10 (2.1) Use computers as a tool 6 (1.1) 5 (1.2) 8 (1.7) Participate in field work 6 (0.9) 5 (1.2) 6 (1.5) Prepare written science reports 5 (0.8) 3 (1.2) 6 (1.2) Take field trips 4 (0.9) 5 (1.2) 4 (1.2) Make formal presentations to the rest of the class 4 (0.8) 2 (0.7) 7 (1.3)
Table 18 Elementary School Science Classes Participating
in Various Activities in Most Recent Lesson Percent of Classes
Grades K–5 Grades K–2 Grades 3–5 Discussion 89 (1.8) 91 (2.3) 88 (2.8) Students doing hands-on/laboratory activities 60 (2.4) 69 (3.0) 53 (3.8) Lecture 60 (2.5) 56 (3.1) 64 (3.8) Students working in small groups 56 (2.4) 56 (3.4) 57 (3.4) Students completing textbook/worksheet problems 44 (2.5) 35 (3.0) 52 (3.6) Students reading about science 42 (2.4) 34 (3.2) 49 (3.3) Test or quiz 8 (1.3) 4 (1.5) 12 (2.2) Students using other technologies 5 (0.9) 4 (1.2) 5 (1.2) Students using computers 5 (1.0) 3 (0.8) 7 (1.7) Students using calculators 1 (0.4) 1 (0.9) 0 (0.3) None of the above 2 (0.8) 1 (0.4) 3 (1.5)
Horizon Research, Inc. 14 Status of Elementary School Science Teaching
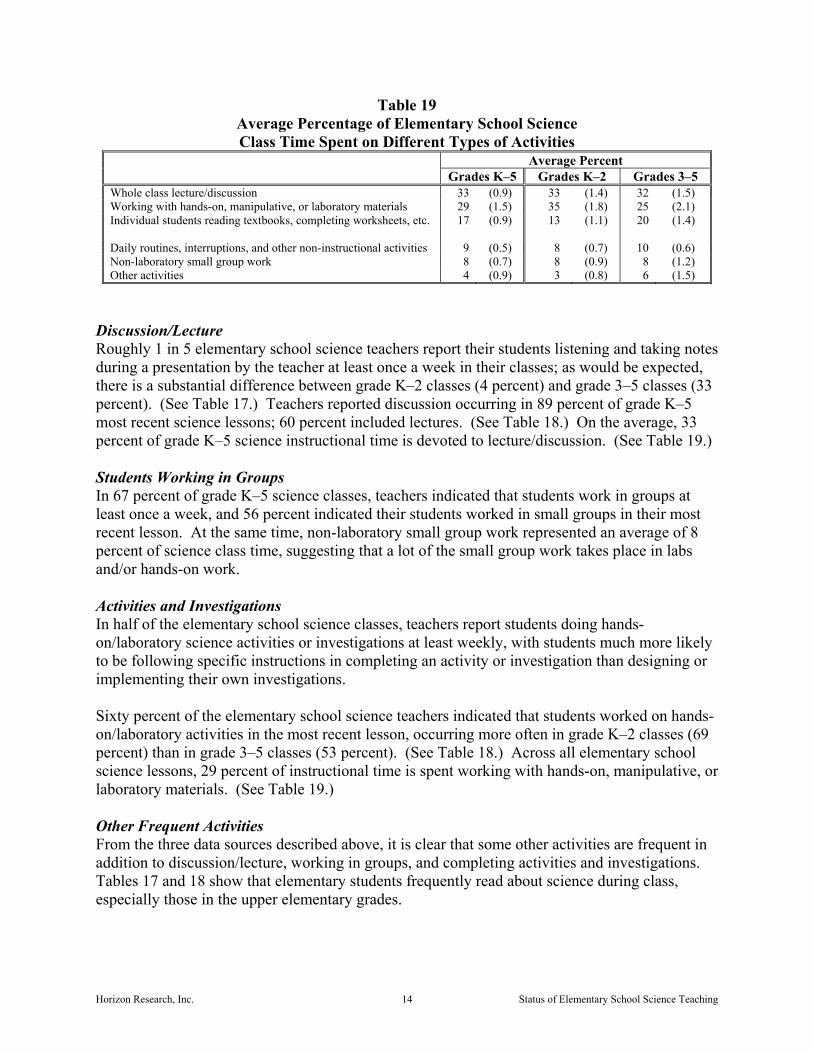
Table 19 Average Percentage of Elementary School Science Class Time Spent on Different Types of Activities
Average Percent Grades K–5 Grades K–2 Grades 3–5
Whole class lecture/discussion 33 (0.9) 33 (1.4) 32 (1.5) Working with hands-on, manipulative, or laboratory materials 29 (1.5) 35 (1.8) 25 (2.1) Individual students reading textbooks, completing worksheets, etc. 17 (0.9) 13 (1.1) 20 (1.4) Daily routines, interruptions, and other non-instructional activities 9 (0.5) 8 (0.7) 10 (0.6) Non-laboratory small group work 8 (0.7) 8 (0.9) 8 (1.2) Other activities 4 (0.9) 3 (0.8) 6 (1.5)
Discussion/Lecture Roughly 1 in 5 elementary school science teachers report their students listening and taking notes during a presentation by the teacher at least once a week in their classes; as would be expected, there is a substantial difference between grade K–2 classes (4 percent) and grade 3–5 classes (33 percent). (See Table 17.) Teachers reported discussion occurring in 89 percent of grade K–5 most recent science lessons; 60 percent included lectures. (See Table 18.) On the average, 33 percent of grade K–5 science instructional time is devoted to lecture/discussion. (See Table 19.) Students Working in Groups In 67 percent of grade K–5 science classes, teachers indicated that students work in groups at least once a week, and 56 percent indicated their students worked in small groups in their most recent lesson. At the same time, non-laboratory small group work represented an average of 8 percent of science class time, suggesting that a lot of the small group work takes place in labs and/or hands-on work. Activities and Investigations In half of the elementary school science classes, teachers report students doing hands-on/laboratory science activities or investigations at least weekly, with students much more likely to be following specific instructions in completing an activity or investigation than designing or implementing their own investigations. Sixty percent of the elementary school science teachers indicated that students worked on hands-on/laboratory activities in the most recent lesson, occurring more often in grade K–2 classes (69 percent) than in grade 3–5 classes (53 percent). (See Table 18.) Across all elementary school science lessons, 29 percent of instructional time is spent working with hands-on, manipulative, or laboratory materials. (See Table 19.) Other Frequent Activities From the three data sources described above, it is clear that some other activities are frequent in addition to discussion/lecture, working in groups, and completing activities and investigations. Tables 17 and 18 show that elementary students frequently read about science during class, especially those in the upper elementary grades.

Horizon Research, Inc. 15 Status of Elementary School Science Teaching
The data in Table 18 indicate that activities considered more traditional in nature, reading in class and the use of textbook or worksheet questions, increase as elementary grade ranges increases, with engagement in hands-on/laboratory activities becoming less frequent in grades 3–5. For example, 35 percent of most recent lessons in grades K–2 included having students complete textbook/worksheet problems, compared to 52 percent of grade 3–5 classes. (See Table 18.) Similarly, Table 19 shows that 35 percent of grade K–2 science instructional time, compared to 25 percent of grade 3–5 instructional time, involved students working with hands-on, manipulative, or laboratory materials. Table 20 presents the means for composite variables related to science teaching practice. To achieve a score of 100, a class would have to do each of the activities included in a composite in every science lesson. A score of 0 would indicate that none of the activities in a composite are ever done. Techniques aimed at helping students learn to communicate science ideas—discussion, posing open-ended questions, asking students to explain their reasoning—are fairly common, as is the use of laboratory teaching practices. Although traditional teaching practices were less common overall than the use of laboratory activities, their use was much more common in higher elementary grades than lower elementary grades (composite means of 59 versus 41, respectively).
Table 20 Class Mean Scores for Elementary School
Science Teaching Practice Composite Variables Mean Score
Grades K–5 Grades K–2 Grades 3–5 Use of Strategies to Develop Students’ Abilities to Communicate Ideas 69 (0.8) 65 (1.1) 72 (1.1) Use of Laboratory Activities 61 (1.1) 58 (1.3) 63 (1.3) Use of Traditional Teaching Practices 51 (0.7) 41 (1.0) 59 (1.0) Use of Projects/Extended Investigations 27 (0.8) 22 (1.0) 32 (1.1) Use of Computers 14 (0.8) 10 (0.9) 17 (1.2)
Activities That Are Not Frequent Survey data also point to some activities that are not very frequent in elementary school science instruction. Although there was a relatively high overall score for using strategies to develop students’ ability to communicate ideas, only 5 percent of the classes prepare written science reports and 4 percent of classes participate in making formal presentations to the rest of the class at least once a week. The high mean score for developing ability to communicate ideas in Table 20 is the result of the large percentage of classes participating in discussion on a frequent basis. Additionally, survey data sources show low frequency of technology use, which is to be expected based on data on teacher preparedness presented earlier in this report. If teachers are not comfortable with their knowledge of how to integrate computers in their instruction, they will be reluctant to use them in their classes. In only 6 percent of science classes do grade K–5 teachers report that students use computers as a tool at least once a week. (See Table 17.) Furthermore, only 5 percent of elementary school science lessons included students using computers, and only 1 percent included students using calculators in their most recent lesson. (See Table 18.) When
Horizon Research, Inc. 16 Status of Elementary School Science Teaching
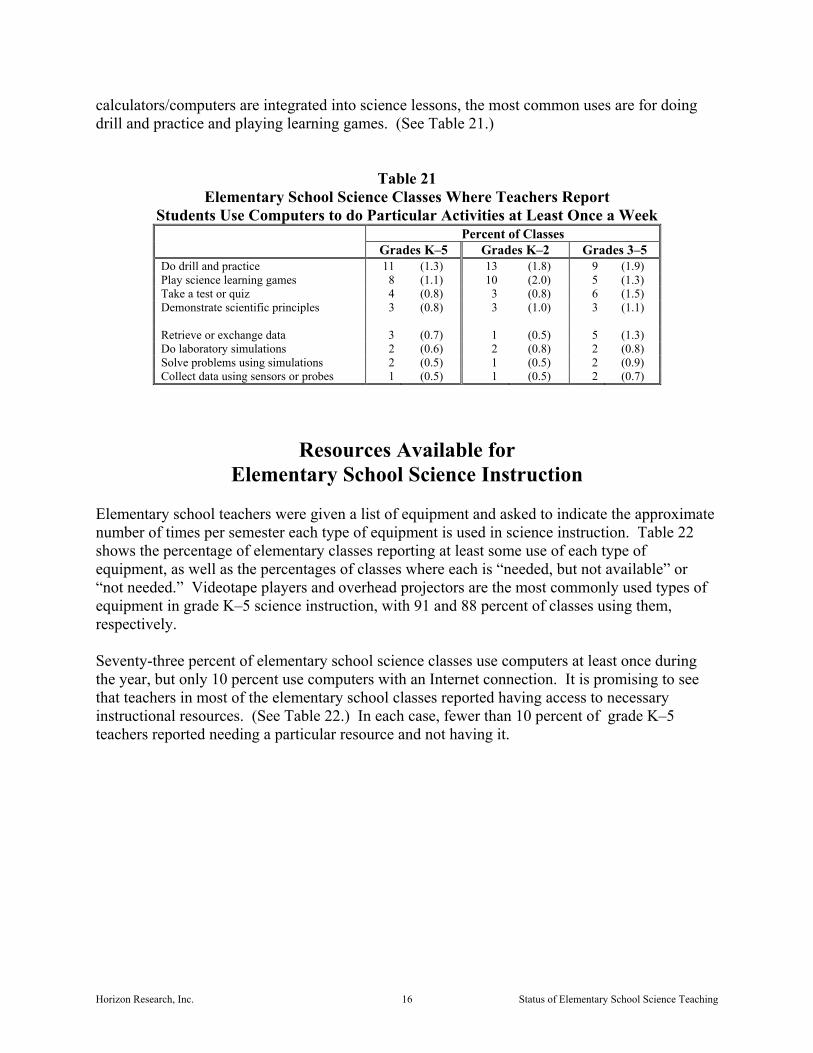
calculators/computers are integrated into science lessons, the most common uses are for doing drill and practice and playing learning games. (See Table 21.)
Table 21 Elementary School Science Classes Where Teachers Report
Students Use Computers to do Particular Activities at Least Once a Week Percent of Classes
Grades K–5 Grades K–2 Grades 3–5 Do drill and practice 11 (1.3) 13 (1.8) 9 (1.9) Play science learning games 8 (1.1) 10 (2.0) 5 (1.3) Take a test or quiz 4 (0.8) 3 (0.8) 6 (1.5) Demonstrate scientific principles 3 (0.8) 3 (1.0) 3 (1.1) Retrieve or exchange data 3 (0.7) 1 (0.5) 5 (1.3) Do laboratory simulations 2 (0.6) 2 (0.8) 2 (0.8) Solve problems using simulations 2 (0.5) 1 (0.5) 2 (0.9) Collect data using sensors or probes 1 (0.5) 1 (0.5) 2 (0.7)
Resources Available for Elementary School Science Instruction
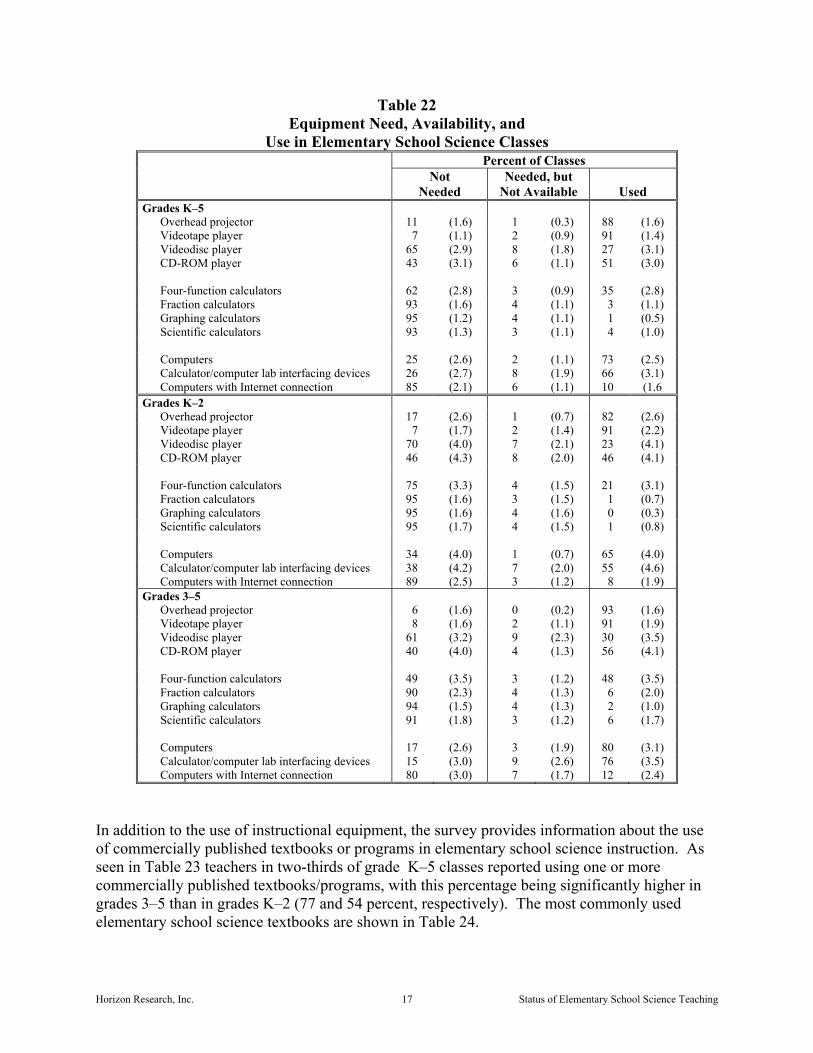
Elementary school teachers were given a list of equipment and asked to indicate the approximate number of times per semester each type of equipment is used in science instruction. Table 22 shows the percentage of elementary classes reporting at least some use of each type of equipment, as well as the percentages of classes where each is “needed, but not available” or “not needed.” Videotape players and overhead projectors are the most commonly used types of equipment in grade K–5 science instruction, with 91 and 88 percent of classes using them, respectively. Seventy-three percent of elementary school science classes use computers at least once during the year, but only 10 percent use computers with an Internet connection. It is promising to see that teachers in most of the elementary school classes reported having access to necessary instructional resources. (See Table 22.) In each case, fewer than 10 percent of grade K–5 teachers reported needing a particular resource and not having it.
Horizon Research, Inc. 17 Status of Elementary School Science Teaching
Table 22 Equipment Need, Availability, and
Use in Elementary School Science Classes Percent of Classes
Not Needed
Needed, but Not Available
Used
Grades K–5 Overhead projector 11 (1.6) 1 (0.3) 88 (1.6) Videotape player 7 (1.1) 2 (0.9) 91 (1.4) Videodisc player 65 (2.9) 8 (1.8) 27 (3.1) CD-ROM player 43 (3.1) 6 (1.1) 51 (3.0) Four-function calculators 62 (2.8) 3 (0.9) 35 (2.8) Fraction calculators 93 (1.6) 4 (1.1) 3 (1.1) Graphing calculators 95 (1.2) 4 (1.1) 1 (0.5) Scientific calculators 93 (1.3) 3 (1.1) 4 (1.0) Computers 25 (2.6) 2 (1.1) 73 (2.5) Calculator/computer lab interfacing devices 26 (2.7) 8 (1.9) 66 (3.1) Computers with Internet connection 85 (2.1) 6 (1.1) 10 (1.6
Grades K–2 Overhead projector 17 (2.6) 1 (0.7) 82 (2.6) Videotape player 7 (1.7) 2 (1.4) 91 (2.2) Videodisc player 70 (4.0) 7 (2.1) 23 (4.1) CD-ROM player 46 (4.3) 8 (2.0) 46 (4.1) Four-function calculators 75 (3.3) 4 (1.5) 21 (3.1) Fraction calculators 95 (1.6) 3 (1.5) 1 (0.7) Graphing calculators 95 (1.6) 4 (1.6) 0 (0.3) Scientific calculators 95 (1.7) 4 (1.5) 1 (0.8) Computers 34 (4.0) 1 (0.7) 65 (4.0) Calculator/computer lab interfacing devices 38 (4.2) 7 (2.0) 55 (4.6) Computers with Internet connection 89 (2.5) 3 (1.2) 8 (1.9)
Grades 3–5 Overhead projector 6 (1.6) 0 (0.2) 93 (1.6) Videotape player 8 (1.6) 2 (1.1) 91 (1.9) Videodisc player 61 (3.2) 9 (2.3) 30 (3.5) CD-ROM player 40 (4.0) 4 (1.3) 56 (4.1) Four-function calculators 49 (3.5) 3 (1.2) 48 (3.5) Fraction calculators 90 (2.3) 4 (1.3) 6 (2.0) Graphing calculators 94 (1.5) 4 (1.3) 2 (1.0) Scientific calculators 91 (1.8) 3 (1.2) 6 (1.7) Computers 17 (2.6) 3 (1.9) 80 (3.1) Calculator/computer lab interfacing devices 15 (3.0) 9 (2.6) 76 (3.5) Computers with Internet connection 80 (3.0) 7 (1.7) 12 (2.4)
In addition to the use of instructional equipment, the survey provides information about the use of commercially published textbooks or programs in elementary school science instruction. As seen in Table 23 teachers in two-thirds of grade K–5 classes reported using one or more commercially published textbooks/programs, with this percentage being significantly higher in grades 3–5 than in grades K–2 (77 and 54 percent, respectively). The most commonly used elementary school science textbooks are shown in Table 24.

Horizon Research, Inc. 18 Status of Elementary School Science Teaching
Table 23 Elementary School Science
Classes Using Textbooks/Programs Percent of Classes
Grades K–5 Grades K–2 Grades 3–5 Use one or more commercially published textbooks or programs 66 (2.3) 54 (3.3) 77 (3.0) Use one textbook or program all or most of the time 39 (2.4) 32 (3.5) 46 (3.3) No textbook or program used 36 (2.4) 49 (3.4) 25 (3.0) Use multiple textbooks or programs 25 (2.3) 19 (2.7) 30 (3.3)
Table 24 Most Commonly Used Textbooks
in Elementary School Science Instruction Title Publisher Discover Science Addison Wesley Longman, Inc./Scott Foresman Discover the Wonder Addison Wesley Longman, Inc./Scott Foresman Discovery Works Silver Burdett Ginn Horizons in Science Silver Burdett Ginn
As can be seen in Table 25, slightly more than half of elementary school science teachers rated their textbooks as good or better in quality. Only 46 percent of grade K–5 science classes address more than three-fourths of their textbook. (See Table 26.)
Table 25 Elementary School Science Teachers’ Perceptions
of Quality of Textbooks/Programs Used in Science Classes Percent of Classes
Grades K–5 Grades K–2 Grades 3–5 Very poor 4 (1.0) 4 (1.6) 4 (1.3) Poor 7 (1.6) 7 (2.3) 7 (2.1) Fair 33 (2.7) 32 (4.4) 33 (3.5) Good 32 (2.9) 30 (4.5) 33 (3.5) Very good 19 (2.4) 21 (3.8) 18 (2.8) Excellent 5 (1.2) 6 (2.1) 5 (1.6)

Horizon Research, Inc. 19 Status of Elementary School Science Teaching
Table 26 Percentage of Elementary School Science
Textbooks/Programs Covered During the Course Percent of Classes
Grades K–5 Grades K–2 Grades 3–5 Less than 25 percent 6 (1.3) 6 (2.1) 6 (1.6) 25–49 percent 15 (1.9) 11 (2.2) 17 (2.7) 50–74 percent 33 (3.0) 27 (4.5) 37 (4.0) 75–90 percent 24 (2.3) 26 (3.7) 22 (2.8) More than 90 percent 22 (2.5) 30 (3.7) 17 (2.7)
Summary The elementary school science teacher workforce is predominately female and white. Data on their age and experience suggest that roughly one-fourth of elementary school science teachers may be retiring within the next ten years. Elementary school science teachers are lacking in content preparation, especially in the physical sciences. Relatively few science teachers in grades K–5 report feeling well qualified to teach specific science disciplines, and almost three-fourths perceive a substantial need for professional development to deepen their own science content knowledge. In contrast, elementary school science teachers report a high degree of pedagogical preparedness; consistent with the high percentage of grade K–5 teachers of science who possess a degree in education. These teachers generally reported feeling well prepared to implement more general pedagogical practices—listening and asking questions of their students and engaging their students in hands-on work and cooperative groups—than practices thought of as being closely aligned with science standards—developing students’ conceptual understanding of science, making connections between science and other disciplines, and leading students using investigative strategies. Teachers were less likely to report being well prepared in the use of technologies, in particular the use of computers for laboratory simulations and the use of the Internet for collaborative projects. Elementary school science teachers expressed a need for help in a number of ways, especially in using instructional technology and increasing their own content knowledge. However, they spend very little time in professional development specific to science or science teaching, where they might receive such help. Most elementary school science lessons include whole class discussion (89 percent) and lecture (60 percent). Solving worksheet or textbook problems occurs in 44 percent of elementary school science lessons and reading about science in 42 percent. Strategies such as hands-on science activities or investigations occur in 60 percent of lessons and working in groups in 56 percent of lessons. Additional data show that elementary school science teachers rarely provide opportunities for students to use computers, which appears to be due more to lack of knowledge about integrating technologies than to lack of access to computers.
Horizon Research, Inc. 20 Status of Elementary School Science Teaching
References
National Research Council. National Science Education Standards. Washington, DC: National
Research Council, 1996. Weiss, I.R., Banilower, E.R., McMahon, K.C., and Smith, P.S. Report of the 2000 National
Survey of Science and Mathematics Education. Chapel Hill, NC: Horizon Research, Inc., 2001.

Horizon Research, Inc. 21 Status of Elementary School Science Teaching
Appendix
Description of Composite Variables To facilitate the reporting of large amounts of survey data, and because individual questionnaire items are potentially unreliable, HRI used factor analysis to identify survey questions that could be combined into “composites.” Each composite represents an important construct related to science education. Each composite is calculated by summing the responses to the items associated with that composite and then dividing by the total points possible. In order for the composites to be on a 100-point scale, the lowest response option on each scale was set to 0 and the others were adjusted accordingly; so for instance, an item with a scale ranging from 1 to 4 was re-coded to have a scale of 0 to 3. By doing this, someone who marks the lowest point on every item in a composite receives a composite score of 0 rather than some positive number. It also assures that 50 is the true mid-point. The denominator for each composite is determined by computing the maximum possible sum of responses for a series of items and dividing by 100; e.g., a 9-item composite where each item is on a scale of 0–3 would have a denominator of 0.27. Composite definitions for the science teacher questionnaire are presented below along with the item numbers. Reliability information is based on the entire sample of K–12 science teachers.
Table A-1 Science Teacher Preparedness to
Use Standards-Based Teaching Practices Take students’ prior understanding into account when planning curriculum and instruction. Q3a Develop students’ conceptual understanding of science Q3b Provide deeper coverage of fewer science concepts Q3c Make connections between science and other disciplines Q3d Lead a class of students using investigative strategies Q3e Manage a class of students engaged in hands-on/project-based work Q3f Have students work in cooperative learning groups Q3g Listen/ask questions as students work in order to gauge their understanding Q3h Use the textbook as a resource rather than the primary instructional tool Q3i Teach groups that are heterogeneous in ability Q3j Number of Items in Composite 10 Reliability (Cronbach’s Coefficient Alpha) 0.88

Horizon Research, Inc. 22 Status of Elementary School Science Teaching
Table A-2 Science Teacher Preparedness to
Teach Students from Diverse Backgrounds Recognize and respond to student cultural diversity Q3l Encourage students’ interest in science Q3m Encourage participation of females in science Q3n Encourage participation of minorities in science Q3o Number of Items in Composite 4 Reliability (Cronbach’s Coefficient Alpha) 0.81
Table A-3 Science Teacher Preparedness to
Use Calculators/Computers Use calculators/computers for drill and practice Q3q Use calculators/computers for science learning games Q3r Use calculators/computers to collect and/or analyze data Q3s Use computers to demonstrate scientific principles Q3t Use computers for laboratory simulations Q3u Number of Items in Composite 5 Reliability (Cronbach’s Coefficient Alpha) 0.89
Table A-4 Science Teacher Preparedness to Use the Internet
Use the Internet in your science teaching for general reference Q3v Use the Internet in your science teaching for data acquisition Q3w Use the Internet in your science teaching for collaborative projects with classes/individuals
in other schools Q3x Number of Items in Composite 3 Reliability (Cronbach’s Coefficient Alpha) 0.86
Table A-5 Nature of Science Objectives
Learn to evaluate arguments based on scientific evidence Q23f Learn about the history and nature of science Q23j Learn how to communicate ideas in science effectively Q23g Learn about the applications of science in business and industry Q23h Learn about the relationship between science, technology, and society Q23i Number of Items in Composite 5 Reliability (Cronbach’s Coefficient Alpha) 0.84
Table A-6 Science Content Objectives
Learn basic science concepts Q23b Learn important terms and facts of science Q23c Learn science process/inquiry skills Q23d Prepare for further study in science Q23e Number of Items in Composite 4 Reliability (Cronbach’s Coefficient Alpha) 0.60