december 11 kinross gold corporation 2012...
TRANSCRIPT

KINROSS GOLD CORPORATIONDundee Sales Desk Presentation
December 11, 2012
1www.kinross.com
1
KINROSS GOLD CORPORATIONDundee Sales Desk Presentation
December 11
2012
2www.kinross.com
2
CAUTIONARY STATEMENT ON FORWARD-LOOKING INFORMATION
All statements, other than statements of historical fact, contained or incorporated by reference in or made in giving this presentation, including anyinformation as to the future performance of Kinross, constitute “forward looking statements” within the meaning of applicable securities laws, includingthe provisions of the Securities Act (Ontario) and the provisions for “safe harbour” under the United States Private Securities Litigation Reform Act of1995 and are based on expectations, estimates and projections as of the date of this presentation. Forward looking statements include, withoutlimitation, possible events; opportunities; statements with respect to possible events or opportunities; estimates and the realization of such estimates;future development, mining activities, production and growth, including but not limited to cost and timing; success of exploration or development ofoperations; the future price of gold and silver; currency fluctuations; expected capital expenditures and requirements for additional capital; governmentregulation of mining operations and exploration; environmental risks; unanticipated reclamation expenses; and title disputes. The words “aim”, “pursue”,“plans”, “expects”, “subject to”, “budget”, “estimate”, “scheduled”, “timeline”, “projected”, “pro forma”, “estimates”, “envision”, “view”, “forecasts”,“guidance”, “seek”, “strategy”, “target”, “possible”, “illustrative”, “model”, “opportunity”, “objective”, “outlook”, “potential”, “intends”, “anticipates” or“believes”, or variations of such words and phrases or statements that certain actions, events or results “may”, “can”, “could”, “would”, “should”, “might”,“indicates”, “will be taken”, “become”, “create”, “occur”, or “be achieved”, and similar expressions identify forward looking statements. Forward-lookingstatements are necessarily based upon a number of estimates and assumptions that, while considered reasonable by Kinross as of the date of suchstatements, are inherently subject to significant business, economic and competitive uncertainties and contingencies. Statements representingmanagement’s financial and other outlook have been prepared solely for purposes of expressing their current views regarding the Company’s financialand other outlook and may not be appropriate for any other purpose. Many of these uncertainties and contingencies can affect, and could cause,Kinross’ actual results to differ materially from those expressed or implied in any forward looking statements made by, or on behalf of, Kinross. Therecan be no assurance that forward looking statements will prove to be accurate, as actual results and future events could differ materially from thoseanticipated in such statements. All of the forward looking statements made in this presentation are qualified by these cautionary statements, and thosemade in our filings with the securities regulators of Canada and the U.S., including but not limited to those cautionary statements made in the “RiskFactors” section of our most recently filed Annual Information Form, the “Risk Analysis” section of our FYE 2011 and Q3 2012 Management’sDiscussion and Analysis, and the “Cautionary Statement on Forward-Looking Information” in our news release dated November 7, 2012, to whichreaders are referred and which are incorporated by reference in this presentation, all of which qualify any and all forward‐looking statements made inthis presentation. These factors are not intended to represent a complete list of the factors that could affect Kinross. Kinross disclaims any intention orobligation to update or revise any forward‐looking statements or to explain any material difference between subsequent actual events and suchforward‐looking statements, except to the extent required by applicable law.
Other information
Where we say "we", "us", "our", the "Company", or "Kinross" in this presentation, we mean Kinross Gold Corporation and/or one or more or all of itssubsidiaries, as may be applicable. The technical information about the Company’s mineral properties (other than exploration activities) contained inthis presentation has been prepared under the supervision of and verified by Mr. Jim Fowler, an officer of the Company who is a “qualified person”within the meaning of National Instrument 43-101 (“NI 43-101”). The technical information about the Company’s exploration activities contained in thispresentation has been prepared under the supervision of and verified by Dr. Glenton Masterman, an officer of the Company who is a “qualified person”with the meaning of NI 43‐101.

KINROSS GOLD CORPORATIONDundee Sales Desk Presentation
December 11, 2012
3www.kinross.com
3
FOUNDATION OF OUR BUSINESS
OPERATING MINES IN 4 CORE REGIONS
• Diversified portfolio of assets located in some of the world’s best gold districts
Tasiast
Fort Knox
Paracatu
Kupol
2.5 – 2.6 million ouncesof gold equivalent production(1,2)
2012E
(1) Please refer to endnote #1.(2) Please refer to endnote #2.
Kettle River - Buckhorn
Round Mountain
La CoipaMaricunga
Chirano
NORTH AMERICA
SOUTH AMERICA
WEST AFRICA
RUSSIA
4www.kinross.com
4
• Identified $200 million in cost savings, reducing expected 2012 capital expenditures to $2.0 billion from $2.2 billion
• Expect to be toward the high end of both production and cost guidance ranges:
THIRD QUARTER 2012
2012 PRODUCTION & COST OUTLOOK(1)
Region Gold Production(2)
(000 oz. Au eq.)% of TotalProduction
Production Cost of Sales(3)
($/oz. Au eq.)
South America 890 – 930 36% $830 – $870
North America 640 – 660 25% $620 – $660
West Africa(2)
(attributable)430 – 460 17% $780 – $820
Russia 535 – 565 22% $470 – $495
Total Kinross(2): 2.5 – 2.6 million 100%Gold equivalent: $690 - $725/oz
By-product: $605- $655/oz
Key Sensitivities: Taking into account existing currency and oil hedges, 10% change in foreign exchange could result in an approximate $5 impact on productioncost of sales per ounce. A $10 change in the price of oil could result in an approximate $2 impact on production cost of sales per ounce. The impact on royaltiesof a $100 change in the gold price could result in an approximate $4 impact on production cost of sales per ounce.
(1) Refer to endnote #1.(2) Refer to endnote #2.(3) Refer to endnote #3.

KINROSS GOLD CORPORATIONDundee Sales Desk Presentation
December 11, 2012
5www.kinross.com
5
THIRD QUARTER 2012
OPERATING RESULTS HIGHLIGHTS
588,358
632,772
672,173
Q1 2012 Q2 2012 Q3 2012
Oun
ces
GOLD EQUIVALENT PRODUCTION(2)
• Kinross is on track to deliver 2012 full-year production and cost of sales guidance
$740$725
$677
Q1 2012 Q2 2012 Q3 2012
$ pe
r ou
nce
PRODUCTION COST OF SALES(3)
(2) Refer to endnote #2.(3) Refer to endnote #3.
6www.kinross.com
6
THIRD QUARTER 2012
FINANCIAL RESULTS HIGHLIGHTS
Q3 2011 Q3 2012
$413$434
Q3 2011 Q3 2012
$269
$250
Q3 2011 Q3 2012
$1,041$1,110
REVENUE+7%
ADJUSTED CASH FLOW(5)
+5%ADJUSTED NET EARNINGS(4)
-7%
US
$ m
illio
ns
$0.36/sh$0.38/sh
$0.24/sh$0.22/sh
(4) From continuing operations. Refer to endnote #4.
KINROSS GOLD CORPORATIONDundee Sales Desk Presentation
December 11, 2012
7www.kinross.com
7
THIRD QUARTER 2012
MAINTAINING A STRONG BALANCE SHEET
• Closed a new US$1.0 billion 3-year term loan on August 17, 2012:
Cost-effective funding: LIBOR plus 1.70%
Effectively pre-funds the repayment of senior convertible notes which may be required in March 2013
• Increased existing US$1.2 billion credit facility to US$1.5 billion
• Improvement in the terms and conditions reflect Kinross’ investment grade credit ratings with stable outlook
STRONG LIQUIDITY POSITION
(US$ millions) As at September 30, 2012
Cash and cash equivalents $1,339.7
Short-term investments $749.6
Available credit $1,489.3
Total liquidity $3,578.6
8www.kinross.com
8
• Prioritizing cash flow• Optimizing pushback widths, mine sequencing
• Exploiting zero / low-capex productivity improvements• Reducing unit consumption
• Implementing better cost controls• Improving contractor management
• Reevaluating capital requirements• Managing potential deferral risks• Identified $200 million in capex reductions for 2012
• Expanding globally-coordinated supply chain initiatives• Planning with greater accuracy
• Establishing lower cost power purchase agreements• Reducing energy consumption
• Enhancing inventory management• Reducing working capital requirements
THIRD QUARTER 2012
THE KINROSS WAY FORWARD
• 7 key areas form the basis of The Kinross Way Forward:
1. MINE PLAN OPTIMIZATION
2. CONTINUOUS IMPROVEMENT
3. COST MANAGEMENT & LABOUR PRODUCTIVITY
4. CAPITAL EFFICIENCY
6. ENERGY MANAGEMENT
7. WORKING CAPITAL MANAGEMENT
5. SUPPLY CHAIN MANAGEMENT

KINROSS GOLD CORPORATIONDundee Sales Desk Presentation
December 11, 2012
9www.kinross.com
9
NORTH AMERICA
RUSSIASOUTH
AMERICAWEST
AFRICA
1. Mine plan optimization
2. Continuous improvement
3. Cost management & labour productivity
4. Capital efficiency
5. Supply chain management
6. Energy management
7. Working capital management
THE KINROSS WAY FORWARD
SOURCES OF POTENTIAL VALUE OPPORTUNITIES
Potential impact
High Medium Low
10www.kinross.com
10
FOUNDATION FOR FUTURE GROWTH
PORTFOLIO OF DEVELOPMENT PROJECTS
• Optimized project sequencing, with Dvoinoye and Tasiast as key development priorities
Fruta del Norte
Lobo-Marte
Tasiast
Dvoinoye
GLOBAL PORTFOLIOOperating mine
Development project
10

KINROSS GOLD CORPORATIONDundee Sales Desk Presentation
December 11, 2012
11www.kinross.com
11
RUSSIA
DVOINOYE CONTINUES ON SCHEDULE
• Underground development 52% complete
Continues to progress ahead of plan
• Surface infrastructure construction 45%
complete
• All-season road progressing well
• All necessary permits for current scope of
underground development and construction
activities are in place
• Project remains on schedule for expected
delivery of first ore to the Kupol mill in H2 2013
Site infrastructure development
Mine door installation
12www.kinross.com
12
MAURITANIA
UPDATE ON TASIAST OPTIMIZATIONHEAP LEACH TESTING
• Gold recovery rates averaged approximately 60%
• Concluded that heap leaching does not provide an economically attractive alternative to CIL milling and that investment in fine crush heap leaching is not currently justified
PRE-FEASIBILITY STUDY
• PFS on a mid-size, expandable CIL mill in the 30k tpd range is on track for completion in Q1/13
• Work has been focused on CIL milling as the preferred processing option and does not contemplate heap leaching - PFS economics are not affected by heap leach test results
INFRASTRUCTURE DEVELOPMENT
• Continued work on basic infrastructure improvements, including:
Permanent camp
Tailings facility and West Branch dump leach pads
Truck shop and warehouse facilities
Main access road
West Branch stripping

KINROSS GOLD CORPORATIONDundee Sales Desk Presentation
December 11, 2012
13www.kinross.com
13
SOUTH AMERICA
OTHER DEVELOPMENT PROJECTS
FRUTA DEL NORTE
• Negotiations with the Ecuadorian government continue
• Government considering reforms to tax and mining laws to help mitigate effects of the Windfall Profits Tax
• Kinross does not expect to reach agreements with the government on exploitation and investment protection before 2013
• Exploring alternative processing scenarios for the project
Opportunities include potential for gravity float leach
May result in lower capital expenditures and reduced operating risk while improving overall project economics
LOBO-MARTE
• Completed review to identify possible project optimization options
• Considering smaller project alternatives with aim of reducing capital requirements and project execution risk
• Limiting capital spending to further project study and permitting
14www.kinross.com
14
TASIAST DISTRICT
• Accelerated drill program in the district outside of the main orebody
• Encountered a number of new targets and positive follow-up drill results at C67 & C68
CHIRANO
• Drilling under the open pits has returned positive results and reinforces potential for mineralization to continue at depth
LA COIPA
• Infill, metallurgical, geotechnical and condemnation drilling at Pompeya completed
• Transitioning to Projects team as we continue to advance the opportunity
2012 EXPLORATION PROGRAM
ENCOURAGING RESULTS YEAR-TO-DATE
KUPOL WEST
• Recent drilling at the Moroshka target (4 km east of Kupol) has encountered encouraging precious metals mineralization
Q3 2012 TASIAST EXPLORATION

KINROSS GOLD CORPORATIONDundee Sales Desk Presentation
December 11, 2012
15www.kinross.com
15
KINROSS: FOUNDATION FOR THE FUTURE• Significant reserve & resource base
• Four operating regions generating robust cash flow
• Strong balance sheet & liquidity position
• Focused plan for reducing costs, improving margins & increasing free cash flow
• Portfolio of development projects and a disciplined approach to project execution
• Focused exploration program with proven track record of adding quality ounces
15
16www.kinross.com
16
APPENDIX
16

KINROSS GOLD CORPORATIONDundee Sales Desk Presentation
December 11, 2012
17www.kinross.com
17
• Production commenced in 1997
• Began construction of a new heap leach facility to extend mine life in 2008
• Heap leach production commenced in late 2009
UNITED STATES
FORT KNOX, ALASKA (100%)
OPERATING RESULTS
PRODUCTION(Au eq. oz.)
PRODUCTION COST OF SALES ($/oz.)
YTD Q3 2012 240,366 $737
FY 2011 289,794 $692
2011 GOLD RESERVES AND RESOURCES(5)
TONNES(thousands)
GRADE (g/t)
OUNCES(thousands)
2P Reserves 314,669 0.43 4,303
M&I Resources 112,098 0.40 1,426
Inferred Resources 22,180 0.41 295
(5) Please refer to endnote #5.
18www.kinross.com
18
• Kinross-operated JV with Barrick
• Bulk tonnage open-pit operation
• Commercial production began in 1977
UNITED STATES
ROUND MOUNTAIN (50%)
OPERATING RESULTS
PRODUCTION(Au eq. oz.)
PRODUCTION COST OF SALES ($/oz.)
YTD Q3 2012 151,110 $698
FY 2011 187,444 $697
2011 GOLD RESERVES AND RESOURCES(5)
TONNES(thousands)
GRADE (g/t)
OUNCES(thousands)
2P Reserves 75,016 0.59 1,412
M&I Resources 75,678 0.55 1,338
Inferred Resources 35,242 0.41 464
(5) Please refer to endnote #5.
KINROSS GOLD CORPORATIONDundee Sales Desk Presentation
December 11, 2012
19www.kinross.com
19
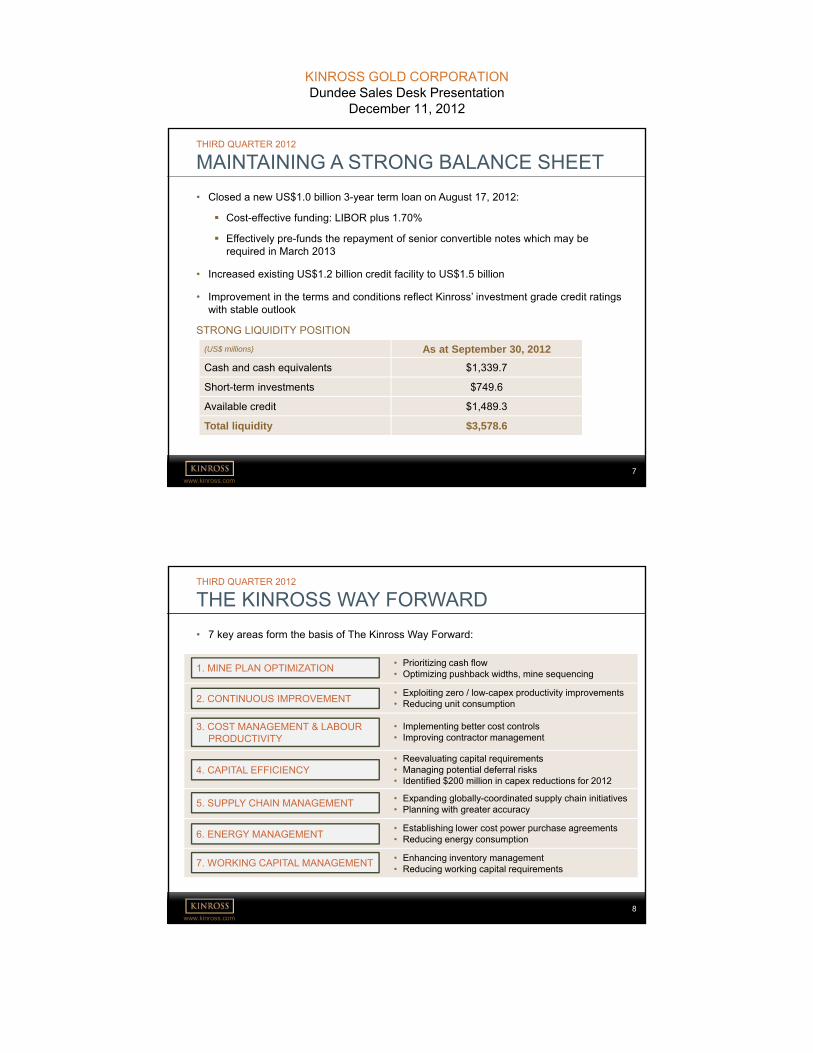
• Entered production in Q4/08
• Small foot-print, underground mine
• Near-mine exploration targets
UNITED STATES
KETTLE RIVER – BUCKHORN (100%)
OPERATING RESULTS
PRODUCTION(Au eq. oz.)
PRODUCTION COST OF SALES ($/oz.)
YTD Q3 2012 122,545 $487
FY 2011 175,292 $420
2011 GOLD RESERVES AND RESOURCES(5)
TONNES(thousands)
GRADE (g/t)
OUNCES(thousands)
2P Reserves 1,082 10.96 381
M&I Resources - - -
Inferred Resources 255 10.39 85
(5) Please refer to endnote #5.
20www.kinross.com
20
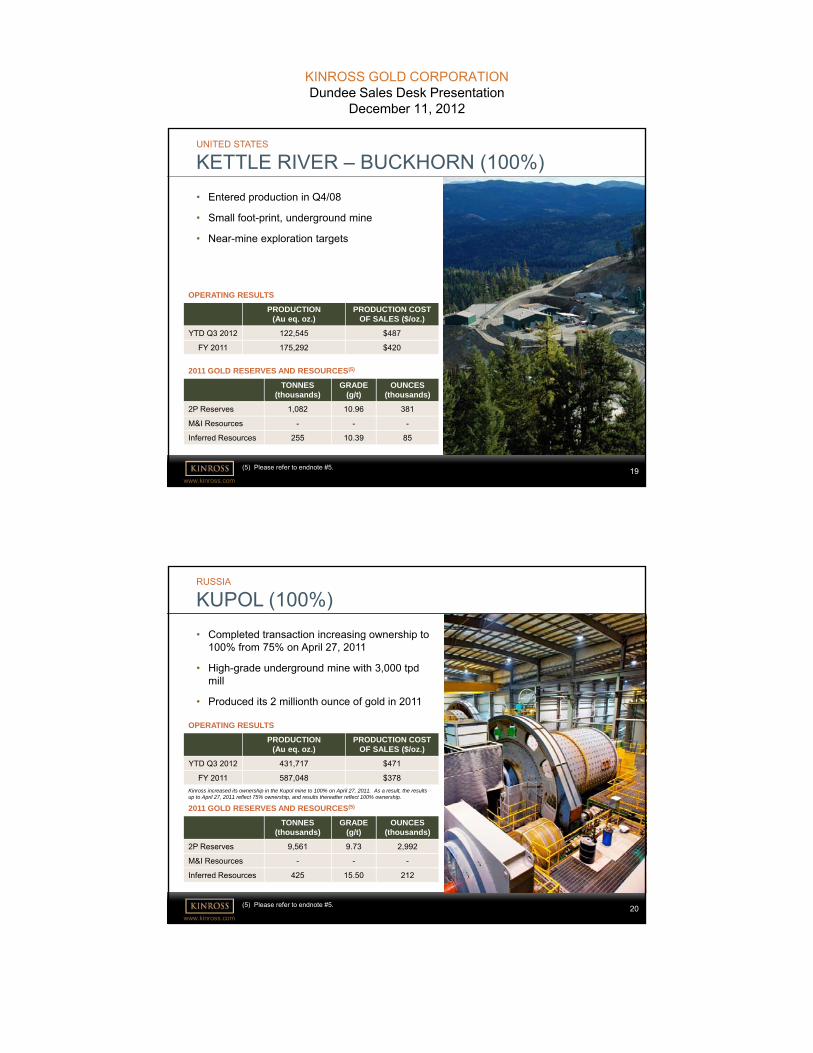
• Completed transaction increasing ownership to 100% from 75% on April 27, 2011
• High-grade underground mine with 3,000 tpd mill
• Produced its 2 millionth ounce of gold in 2011
RUSSIA
KUPOL (100%)
OPERATING RESULTS
PRODUCTION(Au eq. oz.)
PRODUCTION COST OF SALES ($/oz.)
YTD Q3 2012 431,717 $471
FY 2011 587,048 $378
2011 GOLD RESERVES AND RESOURCES(5)
TONNES(thousands)
GRADE (g/t)
OUNCES(thousands)
2P Reserves 9,561 9.73 2,992
M&I Resources - - -
Inferred Resources 425 15.50 212
Kinross increased its ownership in the Kupol mine to 100% on April 27, 2011. As a result, the results up to April 27, 2011 reflect 75% ownership, and results thereafter reflect 100% ownership.
(5) Please refer to endnote #5.

KINROSS GOLD CORPORATIONDundee Sales Desk Presentation
December 11, 2012
21www.kinross.com
21
• Plant 2 expansions now largely complete:
3rd ball mill commissioned in Q2 2011
Commissioning of the 4th ball mill is expected to be complete at year-end 2012
BRAZIL
PARACATU (100%)
OPERATING RESULTS
PRODUCTION(Au eq. oz.)
PRODUCTION COST OF SALES ($/oz.)
YTD Q3 2012 334,595 $915
FY 2011 453,396 $720
2011 GOLD RESERVES AND RESOURCES(5)
TONNES(thousands)
GRADE (g/t)
OUNCES(thousands)
2P Reserves 1,322,231 0.41 17,385
M&I Resources 307,646 0.33 3,291
Inferred Resources 158,591 0.40 2,020
(5) Please refer to endnote #5.
22www.kinross.com
22
• Gold/silver mine in the Maricunga district
• Comprehensive exploration program
• Recent discovery at Pompeya (75% Kinross), located 3 km from mill
CHILE
LA COIPA (100%)
OPERATING RESULTS
PRODUCTION(Au eq. oz.)
PRODUCTION COST OF SALES ($/oz.)
YTD Q3 2012 115,438 $1,084
FY 2011 178,287 $762
2011 GOLD RESERVES AND RESOURCES(5)
TONNES(thousands)
GRADE (g/t)
OUNCES(thousands)
2P Reserves 15,263 1.36 665
M&I Resources 16,826 1.07 579
Inferred Resources 4,508 2.07 300
(5) Please refer to endnote #5.

KINROSS GOLD CORPORATIONDundee Sales Desk Presentation
December 11, 2012
23www.kinross.com
23
• Located in the highly prospective Maricunga District
• High-altitude heap leach operation
• Construction of new SART plant completed in Q2 2012 and is now commissioning
CHILE
MARICUNGA (100%)
OPERATING RESULTS
PRODUCTION(Au eq. oz.)
PRODUCTION COST OF SALES ($/oz.)
YTD Q3 2012 171,801 $727
FY 2011 236,249 $457
2011 GOLD RESERVES AND RESOURCES(5)
TONNES(thousands)
GRADE (g/t)
OUNCES(thousands)
2P Reserves 272,181 0.68 5,948
M&I Resources 202,117 0.58 3,787
Inferred Resources 377,609 0.47 5,651
(5) Please refer to endnote #5.
24www.kinross.com
24
• Open-pit mine ~300 km north of the city of Nouakchott
• Remote, flat, sparsely populated desert
• First expansion phase complete: new ADR plant & dump leach facility
MAURITANIA
TASIAST (100%)
OPERATING RESULTS
PRODUCTION(Au eq. oz.)
PRODUCTION COST OF SALES ($/oz.)
YTD Q3 2012 139,283 $833
FY 2011 200,619 $702
2011 GOLD RESERVES AND RESOURCES(5)
TONNES(thousands)
GRADE (g/t)
OUNCES(thousands)
2P Reserves 128,883 1.80 7,457
M&I Resources 403,216 0.86 11,105
Inferred Resources 78,217 0.74 1,860
(5) Please refer to endnote #5.

KINROSS GOLD CORPORATIONDundee Sales Desk Presentation
December 11, 2012
25www.kinross.com
25
• 90% owned by Kinross; Government of Ghana holds a 10% carried interest
• 9 open-pits and 2 recently-discovered underground deposits
• Achieved first gold pour in 2005
GHANA
CHIRANO (90%)
OPERATING RESULTS(2)
PRODUCTION(Au eq. oz.)
PRODUCTION COST OF SALES ($/oz.)
YTD Q3 2012 186,448 $731
FY 2011 235,661 $693
2011 GOLD RESERVES AND RESOURCES(5)
TONNES(thousands)
GRADE (g/t)
OUNCES(thousands)
2P Reserves 22,640 2.72 1,980
M&I Resources 3,307 2.04 216
Inferred Resources 1,508 1.75 85
(2) Please refer to endnote #2.(5) Please refer to endnote #5.
26www.kinross.com
26
ENDNOTES1) For more information regarding Kinross’ production and cost outlook for 2012, please refer to the news release dated August
8, 2012, available on our website at www.kinross.com.
2) Unless otherwise noted, gold equivalent production, gold equivalent ounces sold and production cost of sales figures in thispresentation are based on Kinross’ 90% share of Chirano production, and do not include production from Crixas, due to thesale of Kinross’ 50% ownership completed June 28, 2012.
3) Production cost of sales per gold equivalent ounce from continuing operations is a non-GAAP measure defined as attributable production cost of sales divided by the attributable number of gold equivalent ounces sold. Production cost of sales is equivalent to total production cost of sales per the financial statements less depreciation, depletion and amortization and impairment charges. For more information about this non-GAAP measure, and a reconciliation of this non-GAAP financial measure for the three months and nine months ended September 30, 2012 and September 30, 2011, please refer to the news release dated November 7, 2012, under the heading “Reconciliation of non-GAAP financial measures”, available on our website at www.kinross.com.
4) Adjusted net earnings attributable to common shareholders and adjusted operating cash flow numbers are from continuing operations and are non-GAAP financial measures which are meant to provide additional information and should not be used as a substitute for performance measures prepared in accordance with GAAP. For more information about these non-GAAPmeasures, and a reconciliation of these non-GAAP financial measures for the three months and nine months ended September 30, 2012 and September 30, 2011, please refer to the news release dated November 7, 2012, under the heading “Reconciliation of non-GAAP financial measures”, available on our website at www.kinross.com.
5) For more information regarding Kinross’ mineral reserves and mineral resources, please refer to Kinross’ Annual Mineral Reserve and Mineral Resource Statement as of December 31, 2011, contained in the press release dated February 15, 2012 available on our website at www.kinross.com.

KINROSS GOLD CORPORATIONDundee Sales Desk Presentation
December 11, 2012
27www.kinross.com
27
KINROSS GOLD CORPORATION
25 York Street, 17th Floor │Toronto, ON │ M5J 2V5
www.kinross.com