decadal variability in the abundance of pacific saury and its response to climatic/oceanic regime...
TRANSCRIPT

www.elsevier.com/locate/jmarsys
Journal of Marine Systems 52 (2004) 235–257
Decadal variability in the abundance of Pacific saury and its
response to climatic/oceanic regime shifts in the northwestern
subtropical Pacific during the last half century
Yongjun Tiana,*, Yasuhiro Uenob, Maki Sudaa, Taturo Akaminea
aNational Research Institute of Fisheries Science, Fisheries Research Agency (FRA), Fukuura 2-12-4, Kanazawa, Yokohama 236-8648, JapanbTohoku National Fisheries Research Institute Hachinohe Branch, Fisheries Research Agency (FRA),
Same, Hachinohe, Aomori 031-0841, Japan
Available online 7 June 2004
Abstract
Pacific saury (Cololabis saira) is one of the most important, small-sized, pelagic fishes in the North Pacific. Using
correlation analysis and principal component analysis (PCA), we examined the relationships between climatic/oceanographic
indices (Asian monsoon index (MOI), Southern Oscillation Index (SOI), North Pacific Index (NPI), Arctic Oscillation Index
(AOI), Pacific Decadal Oscillation (PDO) index, air temperature, wind velocity, sea surface temperature (SST), and surface
current velocity (SCV) in the Kuroshio axis), and abundance/biological indices of Pacific saury (adult catch, catch per unit
effort, i.e., CPUE, condition factor, and body length and larval density) in order to detect the response of Pacific saury
abundance to the recent climatic/oceanic regime shifts (1976/1977, 1987/1988, and 1997/1998). Our oceanographic analyses
show that notable regime shifts occurred in 1987/1988 and possibly 1997/1998 in the Kuroshio region, while the same kind of
regime shift was not readily apparent there in 1976/1977. Results of our oceanographic/biological analyses show that the
decadal-scale variation pattern in Pacific saury abundance responded well to the regime shifts of 1987/1988 and 1997/1998.
These results indicate that only the regime shifts which occurred in the Kuroshio region can affect Pacific saury abundance. Our
results also showed that the abundance and biological indices of saury significantly correlated with both the SSTs in the
northwestern Kuroshio waters and the SCV in the Kuroshio axis in winter. These correlations suggest that winter oceanographic
conditions in the Kuroshio region strongly affect the early survival process and determine the recruitment success of Pacific
saury. The abundance of other major small pelagic species also changed greatly around 1989, suggesting that the regime shift in
the late 1980s occurred in the pelagic ecosystem basin. We concluded that Pacific saury could be used as a bio-indicator of
regime shifts in the northwestern subtropical Pacific.
D 2004 Elsevier B.V. All rights reserved.
Keywords: Pacific saury; Abundance; Decadal variability; Regime shift; Bio-indicator; Kuroshio; Northwestern Pacific
0924-7963/$ - see front matter D 2004 Elsevier B.V. All rights reserved.
doi:10.1016/j.jmarsys.2004.04.004
* Corresponding author. Present address: Japan Sea National
Fisheries Research Institute, Fisheries Research Agency (FRA),
Suido-cho, Niigata 951-8121, Japan. Tel.: +81-25-228-0536; fax:
+81-25-224-0950.
E-mail address: [email protected] (Y. Tian).
1. Introduction
Pacific saury (Cololabis saira) is one of the most
commercially important, pelagic species in the north-
western Pacific, along with Japanese sardine and
Y. Tian et al. / Journal of Marine Systems 52 (2004) 235–257236
Japanese anchovy. However, Pacific saury exhibits
immense interannual variations both in abundance and
size composition (Fukushima, 1979; Kosaka, 2000;
Tian et al., 2002, 2003). Annual catches of saury in
Japan have fluctuated by an order of magnitude from
572,000 t in 1958 to 63,000 t in 1969, with an annual
average of about 257,800 t over the last half century
(Tian et al., 2003). In fact, despite a descending trend
in fishing efforts in the 1990s, both the catch and
catch per unit effort (CPUE) of saury experienced an
abrupt decline in 1998 indicating a strong influence of
environmental factors (Tian et al., 2003); however,
causes and mechanisms of the large variations in
abundance are not well understood.
Understanding fluctuations in marine fish stocks is
important for fisheries management; therefore, in-
creasing attempts have been made to demonstrate
links with oceanographic and climatic variability
(e.g., Francis et al., 1998; Beamish et al., 1999; Zhang
et al., 2000; Attrill and Power, 2002; Finney et al.,
2002). Recent studies have revealed that regime shifts
and/or decadal-scale variability in the atmospheric and
oceanic environments are dominant characteristics of
the mid-latitude North Pacific (Trenberth and Hurrel,
1994; Nakamura et al., 1997; Nakamura and Yama-
gata, 1999; Minobe and Mantua, 1999) and strongly
influence the dynamics of fish stocks and ecosystems
(e.g., McGowan et al., 1998; Sugimoto and Tadokoro,
1998; Zhang et al., 2000; Hollowed et al., 2001;
Sugimoto et al., 2001). Minobe (1999) identified three
main climatic regime shifts during the 1920s, 1940s
and 1970s which occurred in the atmospheric fields of
the North Pacific, and which were strongly associated
with the interannual–decadal variations in the atmo-
spheric and oceanic environment. Yasunaka and
Hanawa (2002) detected six climatic regime shifts
that occurred in the northern hemisphere sea surface
temperature (SST) fields during the 1910s to 1990s:
1925/1926, 1945/1946, 1957/1958, 1970/1971, 1976/
1977, and 1988/1989. Using 100 historical physical
and biological time series events, Hare and Mantua
(2000) confirmed that climatic regime shifts took
place in 1977 and 1989 in the northeast Pacific.
Recent evidence also indicates that a regime shift
possibly took place around 1998 in the North Pacific
(Minobe, 2002). From considering the above inves-
tigations, it seems that whether or not regime shifts are
detected depends on the kind of data or climatic
indices which are used. The climatic regime shift
which occurred in the mid-1970s is the most famous
one, and it has been well documented (Nitta and
Yamada, 1989; Graham, 1994; Parrish et al., 2000;
Hare and Mantua, 2000). It is generally accepted that
the 1976/1977 regime shift had a marked effect not
only on global climate, but also on the dynamics of
North Pacific ecosystems, from low trophic plankton
production to fisheries resources (Hare and Francis,
1995; Hollowed and Wooster, 1995; Francis et al.,
1998; Sugimoto and Tadokoro, 1998; McFarlane et
al., 2000), while agreement on the possibility of
further climatic regime shifts in 1988/1989 and in
the late 1990s is yet to be achieved (McFarlane et al.,
2000).
It is widely accepted that regime shifts can occur
not only in the SST and the atmospheric circulation
fields, but also in fish productivity and pelagic eco-
systems in the North Pacific (e.g., Mantua et al., 1997;
Zhang et al., 2000). In the northeast Pacific, regime
shifts in marine ecosystems took place in 1977, 1989,
and possibly around 1998 (Hare and Mantua, 2000;
McFarlane et al., 2000). Beamish et al. (2000) con-
firmed that fisheries, including salmon, herring, and
groundfish in British Columbia, showed three regimes
during the last half century: 1950–1976, 1977–1988,
and 1989–1997. In the northwest Pacific, regime
shifts in 1976 and 1988 were detected in Korean
waters, which largely affected fisheries resources
(Kang et al., 2000; Zhang et al., 2000). The response
of oceanic ecosystems to oceanographic regime shifts
and long-term climate changes has caused great con-
cern (e.g., Mantua et al., 1997; Francis et al., 1998;
Sugimoto and Tadokoro, 1998; Beamish et al., 1999;
Zhang et al., 2000). Although many studies have
qualitatively demonstrated relationships between the
fluctuations in fisheries catch and climatic variability;
the processes by which climatic changes are linked to
the dynamics of fish stocks are not well understood
(Hare and Francis, 1995; Hollowed and Wooster,
1995).
Variations of oceanic physical variables such as
water temperatures are clearly involved in many
aspects of the variability of biological populations
on seasonal and interannual time scales; however,
there is great uncertainty about the mechanisms by
which decadal variations of physical variables in-
fluence biological populations (Miller and Scheider,
Y. Tian et al. / Journal of Marine Systems 52 (2004) 235–257 237
2000). In addition to the different variation patterns
in the large-scale SST fields observed within the
northeastern and northwestern Pacific Ocean,
responses of ecosystem to oceanic and atmospheric
conditions can vary regionally, even within large
scale regime shifts such as 1976/1977 (Hanawa,
1995; Nakamura et al., 1997; Yasunaka and
Hanawa, 2002). In general, the temporal–spatial
response scale of a specific regional oceanic eco-
system is smaller than that of a climatic regime
shift, hence it is important to identify the regional
variation pattern in the specific oceanic environment
which affects the dynamics of the fish stocks and
ecosystem (Sugimoto and Tadokoro, 1998). Further-
more, even in a specific region such as the north-
western subtropical Pacific, the responses of
individual species will vary with their life history
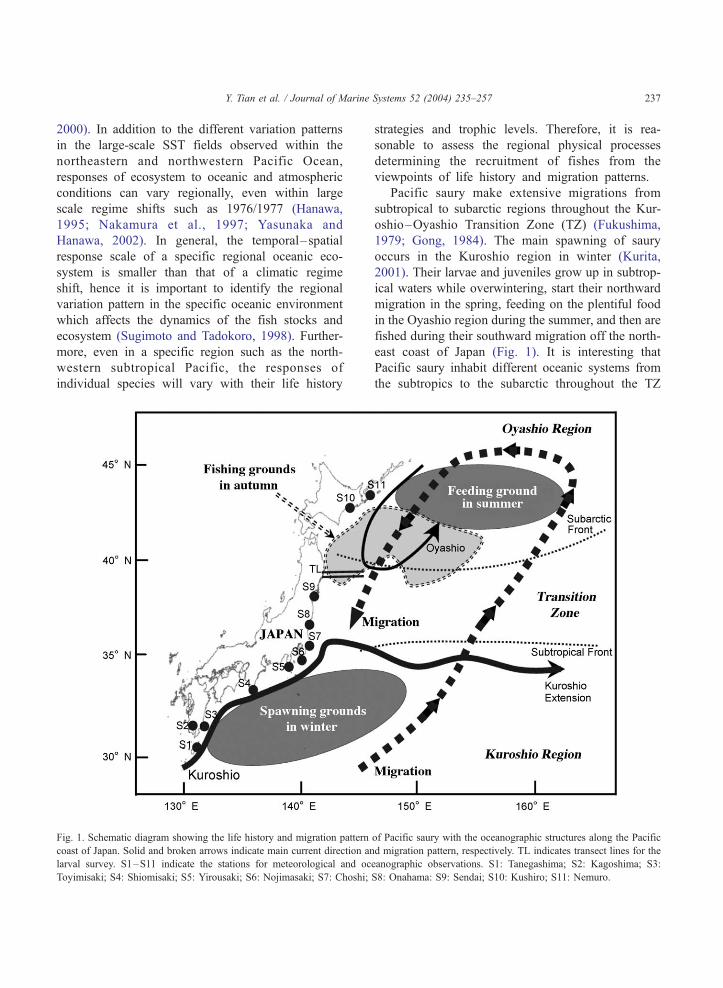
Fig. 1. Schematic diagram showing the life history and migration pattern
coast of Japan. Solid and broken arrows indicate main current direction an
larval survey. S1–S11 indicate the stations for meteorological and oc
Toyimisaki; S4: Shiomisaki; S5: Yirousaki; S6: Nojimasaki; S7: Choshi;
strategies and trophic levels. Therefore, it is rea-
sonable to assess the regional physical processes
determining the recruitment of fishes from the
viewpoints of life history and migration patterns.
Pacific saury make extensive migrations from
subtropical to subarctic regions throughout the Kur-
oshio–Oyashio Transition Zone (TZ) (Fukushima,
1979; Gong, 1984). The main spawning of saury
occurs in the Kuroshio region in winter (Kurita,
2001). Their larvae and juveniles grow up in subtrop-
ical waters while overwintering, start their northward
migration in the spring, feeding on the plentiful food
in the Oyashio region during the summer, and then are
fished during their southward migration off the north-
east coast of Japan (Fig. 1). It is interesting that
Pacific saury inhabit different oceanic systems from
the subtropics to the subarctic throughout the TZ
of Pacific saury with the oceanographic structures along the Pacific
d migration pattern, respectively. TL indicates transect lines for the
eanographic observations. S1: Tanegashima; S2: Kagoshima; S3:
S8: Onahama: S9: Sendai; S10: Kushiro; S11: Nemuro.
Y. Tian et al. / Journal of Marine Systems 52 (2004) 235–257238
during different life stages. Pacific saury have a short
life-span of 1–2 years, therefore, impacts of climate
change on saury abundance should appear after a
short time lag.
The area of the northwestern Pacific adjacent to
Japan is characterized by dynamic oceanographic
conditions and high productivity, with more that 600
fish species. The area supports the largest fisheries
production in the world, including Japanese sardine
(Sardinops melanostictus), Japanese anchovy
(Engraulis japonicus), jack mackerel (Trachurus
japonicus), chub mackerel (Scomber japonicus), Jap-
anese common squid (Todarodes pacificus), and saury
(Chikuni, 1985; Belyaev and Shatilina, 1995). How-
ever, it is also a unique region in that biological
responses have not been adequately studied in com-
parison with those in the northeast Pacific (Limsakul
et al., 2001). Pacific saury exhibits decadal-scale
variation patterns, together with large interannual
fluctuations in abundance (Tian et al., 2002, 2003).
Our previous studies involving observational data
analysis and modeling revealed that the population
dynamics of saury is largely affected by oceanic and
climatic factors rather than by fishing, and that inter-
annual variations in the abundance of Pacific saury are
largely associated with El Nino-Southern Oscillation
(ENSO) events (Tian et al., 2002, 2003, 2004). In the
present study, we focus on the decadal-scale variabil-
ity in Pacific saury abundance, and its linkage with the
oceanic regime shifts in the northwestern subtropical
Pacific. In particular, we concentrate on the Kuroshio
region, which is an important spawning and nursery
ground for a number of small pelagic species such as
sardine, anchovy, mackerel, and common squid. The
objectives of this study are: (1) to identify the physical
characteristics of oceanic variability and regime shifts
in the Kuroshio water in winter; (2) to clarify the
decadal variability in Pacific saury abundance; and (3)
to examine the effects of the oceanographic and
climatic regime shifts on Pacific saury abundance
from the viewpoint of their life history strategy. We
demonstrate that a notable oceanic regime shift oc-
curred in 1987/1988, and possibly around 1997/1998,
in the Kuroshio region during winter, and that these
were largely associated with the decadal variation
patterns in saury abundance. We also conclude that
Pacific saury could be used as a bio-indicator of
regime shifts in Kuroshio waters.
2. Data and methods
2.1. Climatic indices of the North Pacific
The Southern Oscillation Index (SOI), Monsoon
Index (MOI), North Pacific Index (NPI), Arctic
Oscillation Index (AOI), and Pacific Decadal Oscil-
lation (PDO) index were chosen as climatic indices
of the North Pacific. These indices are well docu-
mented and largely associated with the interannual–
interdecadal variability in atmospheric and oceanic
conditions in the North Pacific (Beamish et al.,
2000).
The SOI is defined as the difference in sea level
pressures (SLP) between Darwin (Australia) and
Tahiti. It is an index of ENSO; the extreme ne-
gative (positive) values represent El Nino (La Nina)
episodes (Trenberth, 1990). The MOI is defined as
the difference in the SLP between Irkutsk (Russia)
and Nemuro (Japan), representing conditions of the
winter Asian monsoon (Tian et al., 2002). The NPI
is defined as the area-averaged SLP anomaly in
the region 160jE–140jW, 30–60jN; large (small)
NPI represents the strong (weak) Aleutian Low
(Trenberth and Hurrel, 1994). The AOI is defined
as the leading empirical orthogonal function (EOF)
of wintertime SLP poleward of 20jN, and is
largely associated with the variability in the mid-
latitude North Pacific (Thomson and Wallace,
1998). The PDO index is defined as the time
coefficient of the leading EOF created from month-
ly SST anomalies poleward of 20jN in the Pacific
basin; positive (negative) PDO indices represent
the cooling (warming) phase in the central North
Pacific (Mantua and Hare, 2002). Monthly values
for the above four climatic indices except MOI
were provided by the Climate Predictive Center of
NOAA for the period 1950–2000, and the MOI
data for the same period were obtained from Tian
et al. (2002).
2.2. Oceanographic and meteorological data from
Japan
In addition to the above five global climatic
indices, we also used various oceanographic and
meteorological indices representing the regional cli-
mate and oceanic conditions adjacent to Japan which
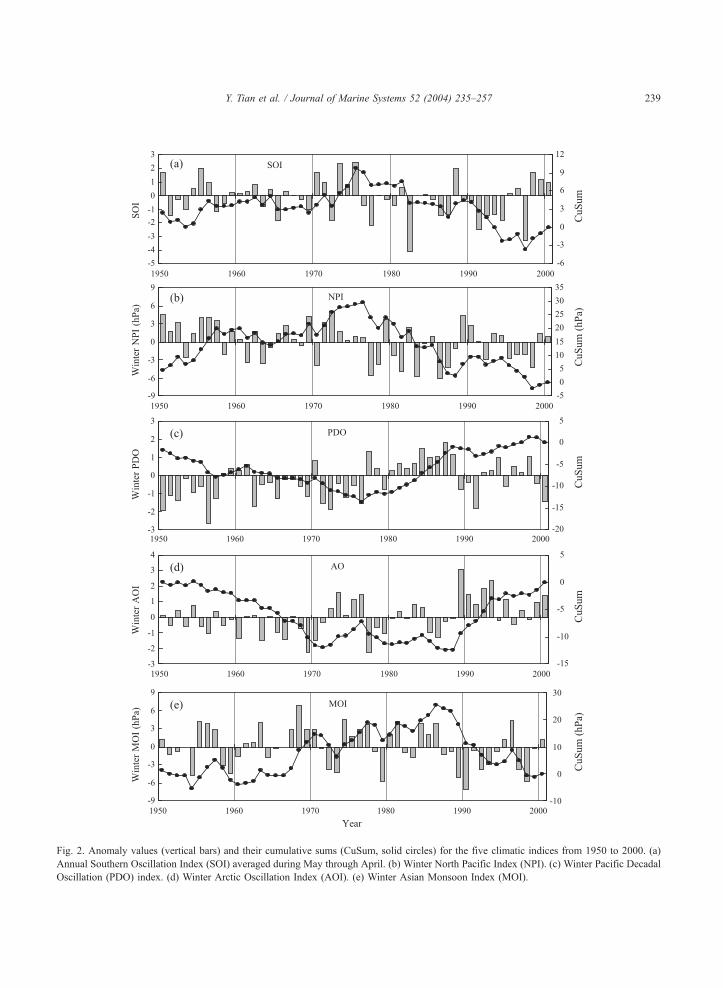
Fig. 2. Anomaly values (vertical bars) and their cumulative sums (CuSum, solid circles) for the five climatic indices from 1950 to 2000. (a)
Annual Southern Oscillation Index (SOI) averaged during May through April. (b) Winter North Pacific Index (NPI). (c) Winter Pacific Decadal
Oscillation (PDO) index. (d) Winter Arctic Oscillation Index (AOI). (e) Winter Asian Monsoon Index (MOI).
Y. Tian et al. / Journal of Marine Systems 52 (2004) 235–257 239
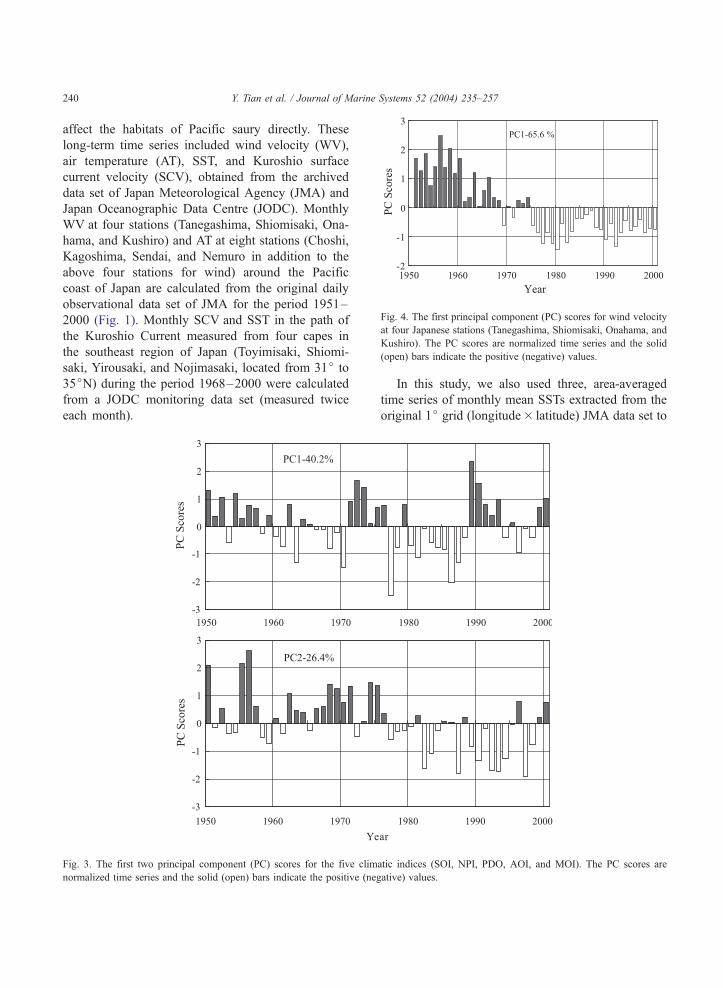
Fig. 4. The first principal component (PC) scores for wind velocity
at four Japanese stations (Tanegashima, Shiomisaki, Onahama, and
Kushiro). The PC scores are normalized time series and the solid
(open) bars indicate the positive (negative) values.
Y. Tian et al. / Journal of Marine Systems 52 (2004) 235–257240
affect the habitats of Pacific saury directly. These
long-term time series included wind velocity (WV),
air temperature (AT), SST, and Kuroshio surface
current velocity (SCV), obtained from the archived
data set of Japan Meteorological Agency (JMA) and
Japan Oceanographic Data Centre (JODC). Monthly
WV at four stations (Tanegashima, Shiomisaki, Ona-
hama, and Kushiro) and AT at eight stations (Choshi,
Kagoshima, Sendai, and Nemuro in addition to the
above four stations for wind) around the Pacific
coast of Japan are calculated from the original daily
observational data set of JMA for the period 1951–
2000 (Fig. 1). Monthly SCV and SST in the path of
the Kuroshio Current measured from four capes in
the southeast region of Japan (Toyimisaki, Shiomi-
saki, Yirousaki, and Nojimasaki, located from 31j to
35jN) during the period 1968–2000 were calculated
from a JODC monitoring data set (measured twice
each month).
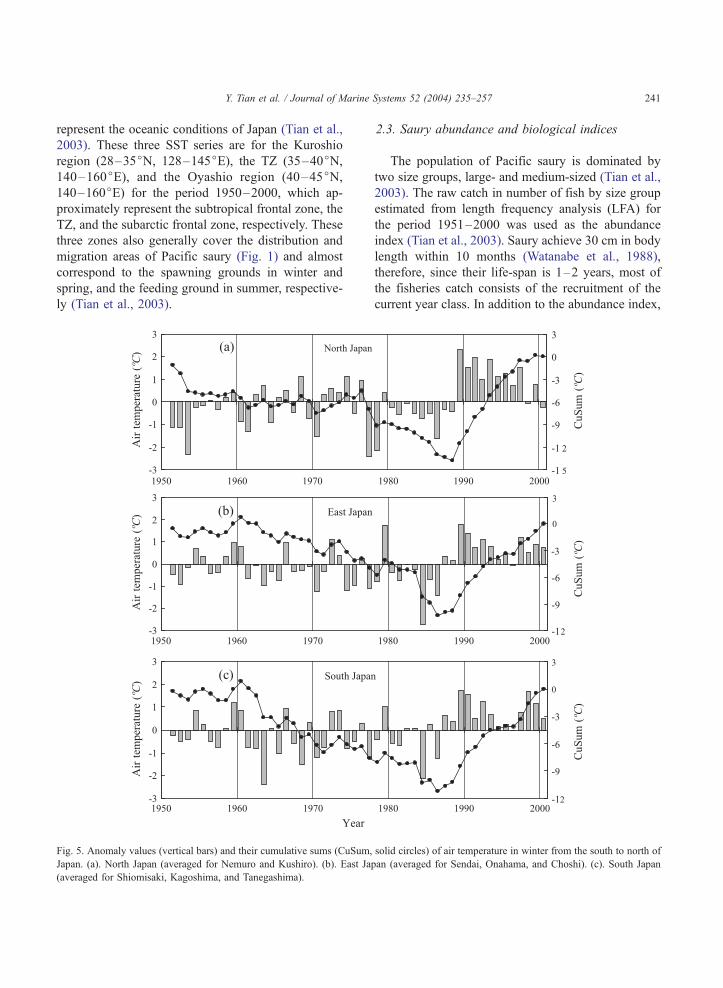
Fig. 3. The first two principal component (PC) scores for the five clim
normalized time series and the solid (open) bars indicate the positive (neg
In this study, we also used three, area-averaged
time series of monthly mean SSTs extracted from the
original 1j grid (longitude� latitude) JMA data set to
atic indices (SOI, NPI, PDO, AOI, and MOI). The PC scores are
ative) values.
Y. Tian et al. / Journal of Marine
represent the oceanic conditions of Japan (Tian et al.,
2003). These three SST series are for the Kuroshio
region (28–35jN, 128–145jE), the TZ (35–40jN,140–160jE), and the Oyashio region (40–45jN,140–160jE) for the period 1950–2000, which ap-
proximately represent the subtropical frontal zone, the
TZ, and the subarctic frontal zone, respectively. These
three zones also generally cover the distribution and
migration areas of Pacific saury (Fig. 1) and almost
correspond to the spawning grounds in winter and
spring, and the feeding ground in summer, respective-
ly (Tian et al., 2003).
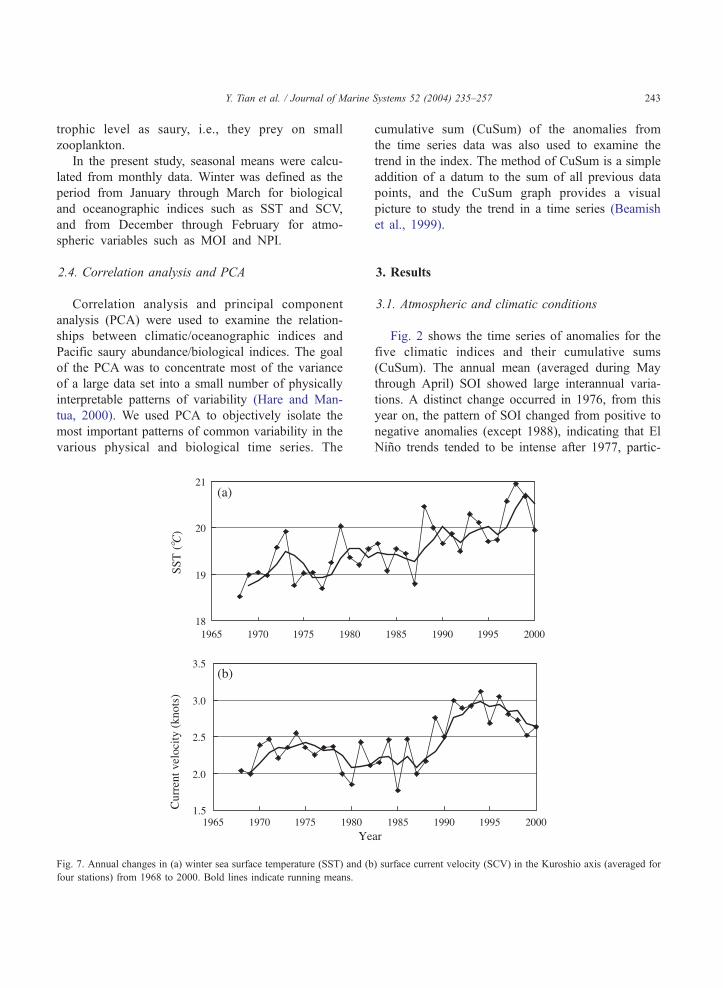
Fig. 5. Anomaly values (vertical bars) and their cumulative sums (CuSum,
Japan. (a). North Japan (averaged for Nemuro and Kushiro). (b). East Jap
(averaged for Shiomisaki, Kagoshima, and Tanegashima).
2.3. Saury abundance and biological indices
The population of Pacific saury is dominated by
two size groups, large- and medium-sized (Tian et al.,
2003). The raw catch in number of fish by size group
estimated from length frequency analysis (LFA) for
the period 1951–2000 was used as the abundance
index (Tian et al., 2003). Saury achieve 30 cm in body
length within 10 months (Watanabe et al., 1988),
therefore, since their life-span is 1–2 years, most of
the fisheries catch consists of the recruitment of the
current year class. In addition to the abundance index,
Systems 52 (2004) 235–257 241
solid circles) of air temperature in winter from the south to north of
an (averaged for Sendai, Onahama, and Choshi). (c). South Japan

Y. Tian et al. / Journal of Marine Systems 52 (2004) 235–257242
annual CPUE (in tons per haul) for the period 1971–
2000 provided by the Tohoku National Fisheries
Research Institute (TNFRI) of Japan, was also used
as a biomass index of saury.
In addition to the above abundance indices for
saury adults, a time series data set for larval and
juvenile saury density was used as an index of the
early survival process (TNFRI, 2000). Saury larvae
and juveniles were collected in the waters off Iwate,
northeast Japan (around 39.5jN, also see Fig. 1)
during the summer–autumn season using a cylindri-
cal–conical net with a 1.3 m diameter mouth and 0.45
mm mesh aperture towed for 10 min at 2 km (1.03 m/
s) (Watanabe et al., 1997). Annual mean larval and
juvenile density was calculated from the summer and
autumn monthly survey data.
Long-term time series data of adult mean body
length and condition factor were used as biological
indices representing the growth and nutritional state of
saury (Wootton, 1990). The mean body length by size
group for the period 1951–2000 was estimated from
LFA and obtained from Tian et al. (2003). The
Fig. 6. The first two principal component (PC) scores for winter air temper
the solid (open) bars indicate the positive (negative) values.
condition factor (K) is defined by the following
equation:
K ¼ W=L3
where W and L are body weight (g) and body
length (mm), respectively. These data were gathered
from data sets of condition factors broken up into
size groups measured during the fishing season
(from late August to early September), and were
provided from TNFRI for the period 1972–2000
and from Kosaka (2000) for the period 1952–1971.
Long-term series of catch data (tons) for four
major small pelagic species (Japanese anchovy, jack
mackerel, chub mackerel, and common squid) for the
period of 1951–2000 were also examined together
with the catch data of saury; these weight data were
obtained from the statistics of the Fisheries Agency
of Japan. These small pelagic species have similar
life histories, share almost the same nursery ground
in the Kuroshio region in winter, and have the same
atures in eight stations. The PC scores are normalized time series and
Y. Tian et al. / Journal of Marine Systems 52 (2004) 235–257 243
trophic level as saury, i.e., they prey on small
zooplankton.
In the present study, seasonal means were calcu-
lated from monthly data. Winter was defined as the
period from January through March for biological
and oceanographic indices such as SST and SCV,
and from December through February for atmo-
spheric variables such as MOI and NPI.
2.4. Correlation analysis and PCA
Correlation analysis and principal component
analysis (PCA) were used to examine the relation-
ships between climatic/oceanographic indices and
Pacific saury abundance/biological indices. The goal
of the PCA was to concentrate most of the variance
of a large data set into a small number of physically
interpretable patterns of variability (Hare and Man-
tua, 2000). We used PCA to objectively isolate the
most important patterns of common variability in the
various physical and biological time series. The
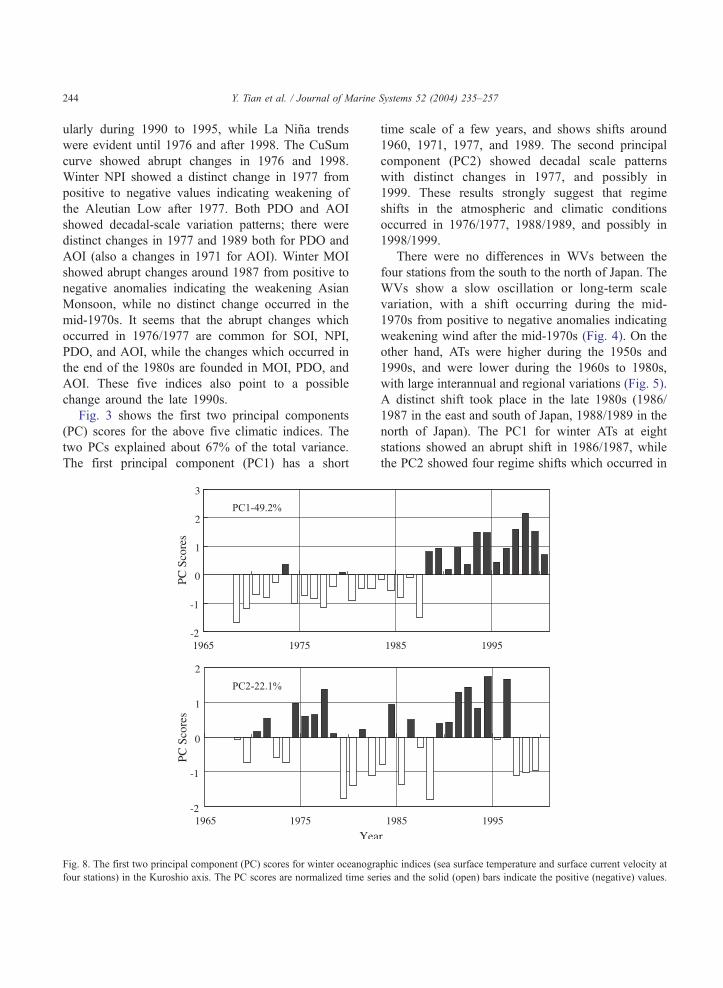
Fig. 7. Annual changes in (a) winter sea surface temperature (SST) and (b
four stations) from 1968 to 2000. Bold lines indicate running means.
cumulative sum (CuSum) of the anomalies from
the time series data was also used to examine the
trend in the index. The method of CuSum is a simple
addition of a datum to the sum of all previous data
points, and the CuSum graph provides a visual
picture to study the trend in a time series (Beamish
et al., 1999).
3. Results
3.1. Atmospheric and climatic conditions
Fig. 2 shows the time series of anomalies for the
five climatic indices and their cumulative sums
(CuSum). The annual mean (averaged during May
through April) SOI showed large interannual varia-
tions. A distinct change occurred in 1976, from this
year on, the pattern of SOI changed from positive to
negative anomalies (except 1988), indicating that El
Nino trends tended to be intense after 1977, partic-
) surface current velocity (SCV) in the Kuroshio axis (averaged for
Y. Tian et al. / Journal of Marine Systems 52 (2004) 235–257244
ularly during 1990 to 1995, while La Nina trends
were evident until 1976 and after 1998. The CuSum
curve showed abrupt changes in 1976 and 1998.
Winter NPI showed a distinct change in 1977 from
positive to negative values indicating weakening of
the Aleutian Low after 1977. Both PDO and AOI
showed decadal-scale variation patterns; there were
distinct changes in 1977 and 1989 both for PDO and
AOI (also a changes in 1971 for AOI). Winter MOI
showed abrupt changes around 1987 from positive to
negative anomalies indicating the weakening Asian
Monsoon, while no distinct change occurred in the
mid-1970s. It seems that the abrupt changes which
occurred in 1976/1977 are common for SOI, NPI,
PDO, and AOI, while the changes which occurred in
the end of the 1980s are founded in MOI, PDO, and
AOI. These five indices also point to a possible
change around the late 1990s.
Fig. 3 shows the first two principal components
(PC) scores for the above five climatic indices. The
two PCs explained about 67% of the total variance.
The first principal component (PC1) has a short
Fig. 8. The first two principal component (PC) scores for winter oceanogra
four stations) in the Kuroshio axis. The PC scores are normalized time ser
time scale of a few years, and shows shifts around
1960, 1971, 1977, and 1989. The second principal
component (PC2) showed decadal scale patterns
with distinct changes in 1977, and possibly in
1999. These results strongly suggest that regime
shifts in the atmospheric and climatic conditions
occurred in 1976/1977, 1988/1989, and possibly in
1998/1999.
There were no differences in WVs between the
four stations from the south to the north of Japan. The
WVs show a slow oscillation or long-term scale
variation, with a shift occurring during the mid-
1970s from positive to negative anomalies indicating
weakening wind after the mid-1970s (Fig. 4). On the
other hand, ATs were higher during the 1950s and
1990s, and were lower during the 1960s to 1980s,
with large interannual and regional variations (Fig. 5).
A distinct shift took place in the late 1980s (1986/
1987 in the east and south of Japan, 1988/1989 in the
north of Japan). The PC1 for winter ATs at eight
stations showed an abrupt shift in 1986/1987, while
the PC2 showed four regime shifts which occurred in
phic indices (sea surface temperature and surface current velocity at
ies and the solid (open) bars indicate the positive (negative) values.
Y. Tian et al. / Journal of Marine Systems 52 (2004) 235–257 245
1961/1962, 1976/1977, 1988/1989, and 1997/1998
(Fig. 6).
3.2. Oceanographic conditions in the Kuroshio region
The Kuroshio Current normally flows northeast-
ward south of Japan, leaves the coast at Cape Yinu-
bozaki (36jN) and turns to flow eastward (see Fig. 1),
hence oceanographic conditions in the Kuroshio re-
gion south of Japan are largely affected by the
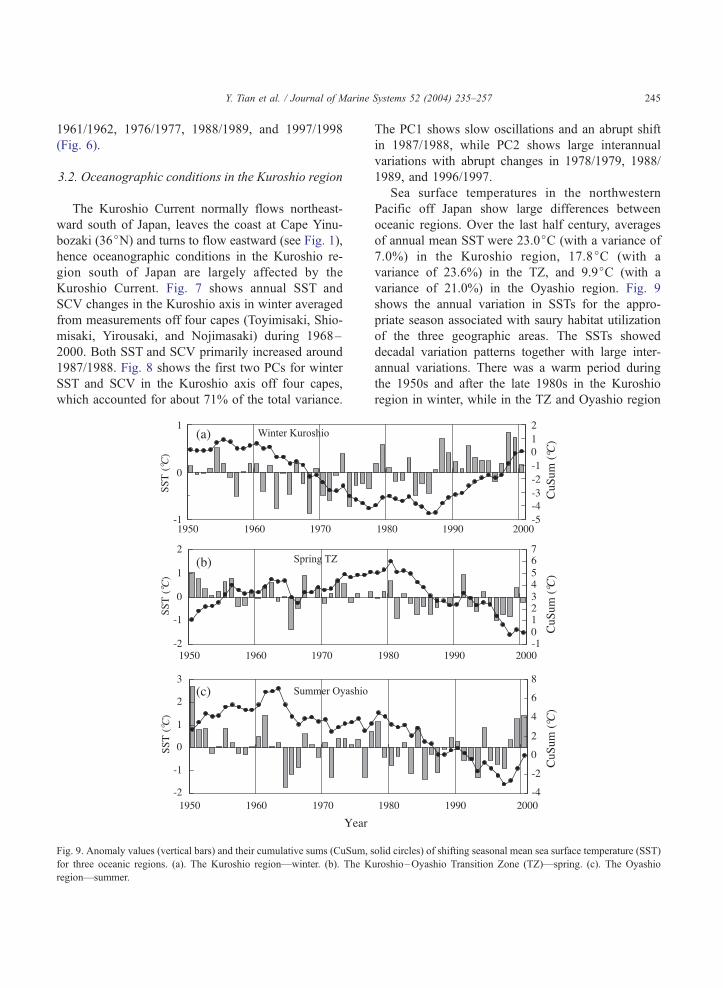
Kuroshio Current. Fig. 7 shows annual SST and
SCV changes in the Kuroshio axis in winter averaged
from measurements off four capes (Toyimisaki, Shio-
misaki, Yirousaki, and Nojimasaki) during 1968–
2000. Both SST and SCV primarily increased around
1987/1988. Fig. 8 shows the first two PCs for winter
SST and SCV in the Kuroshio axis off four capes,
which accounted for about 71% of the total variance.
Fig. 9. Anomaly values (vertical bars) and their cumulative sums (CuSum, s
for three oceanic regions. (a). The Kuroshio region—winter. (b). The K
region—summer.
The PC1 shows slow oscillations and an abrupt shift
in 1987/1988, while PC2 shows large interannual
variations with abrupt changes in 1978/1979, 1988/
1989, and 1996/1997.
Sea surface temperatures in the northwestern
Pacific off Japan show large differences between
oceanic regions. Over the last half century, averages
of annual mean SST were 23.0jC (with a variance of
7.0%) in the Kuroshio region, 17.8jC (with a
variance of 23.6%) in the TZ, and 9.9jC (with a
variance of 21.0%) in the Oyashio region. Fig. 9
shows the annual variation in SSTs for the appro-
priate season associated with saury habitat utilization
of the three geographic areas. The SSTs showed
decadal variation patterns together with large inter-
annual variations. There was a warm period during
the 1950s and after the late 1980s in the Kuroshio
region in winter, while in the TZ and Oyashio region
olid circles) of shifting seasonal mean sea surface temperature (SST)
uroshio–Oyashio Transition Zone (TZ)—spring. (c). The Oyashio
Y. Tian et al. / Journal of Marine Systems 52 (2004) 235–257246
the SSTs were low during mid-1960s and then from
the early 1980s to late 1990s. The SSTs were high
until the early 1960s in the three areas, but the
patterns are different after late 1980 in the Kuroshio
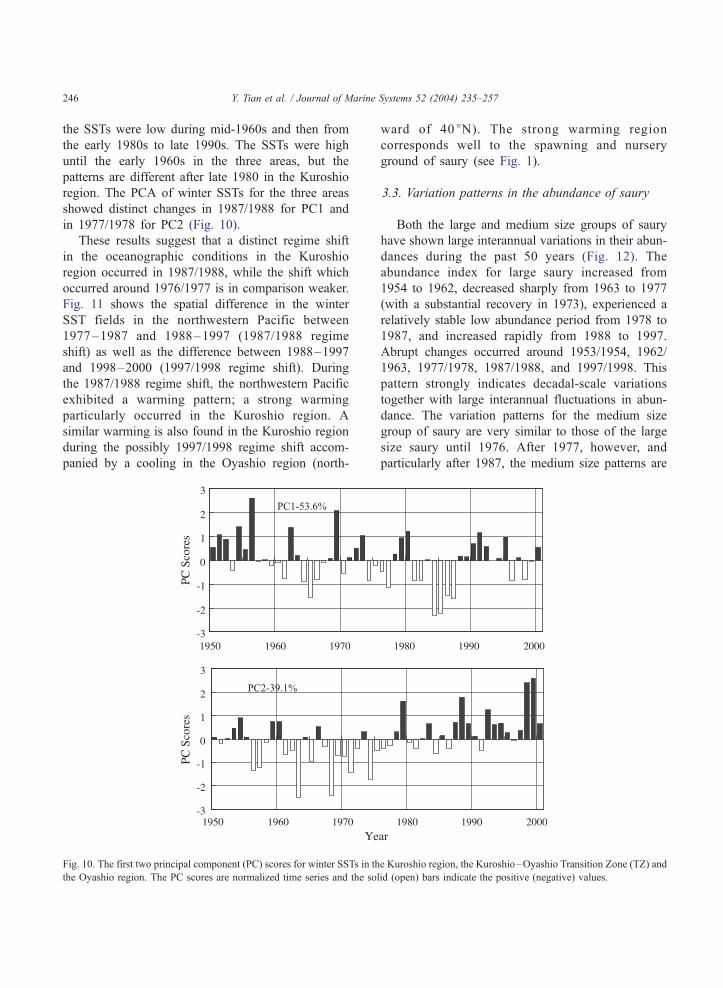
region. The PCA of winter SSTs for the three areas
showed distinct changes in 1987/1988 for PC1 and
in 1977/1978 for PC2 (Fig. 10).
These results suggest that a distinct regime shift
in the oceanographic conditions in the Kuroshio
region occurred in 1987/1988, while the shift which
occurred around 1976/1977 is in comparison weaker.
Fig. 11 shows the spatial difference in the winter
SST fields in the northwestern Pacific between
1977–1987 and 1988–1997 (1987/1988 regime
shift) as well as the difference between 1988–1997
and 1998–2000 (1997/1998 regime shift). During
the 1987/1988 regime shift, the northwestern Pacific
exhibited a warming pattern; a strong warming
particularly occurred in the Kuroshio region. A
similar warming is also found in the Kuroshio region
during the possibly 1997/1998 regime shift accom-
panied by a cooling in the Oyashio region (north-
Fig. 10. The first two principal component (PC) scores for winter SSTs in th
the Oyashio region. The PC scores are normalized time series and the so
ward of 40jN). The strong warming region
corresponds well to the spawning and nursery
ground of saury (see Fig. 1).
3.3. Variation patterns in the abundance of saury
Both the large and medium size groups of saury
have shown large interannual variations in their abun-
dances during the past 50 years (Fig. 12). The
abundance index for large saury increased from
1954 to 1962, decreased sharply from 1963 to 1977
(with a substantial recovery in 1973), experienced a
relatively stable low abundance period from 1978 to
1987, and increased rapidly from 1988 to 1997.
Abrupt changes occurred around 1953/1954, 1962/
1963, 1977/1978, 1987/1988, and 1997/1998. This
pattern strongly indicates decadal-scale variations
together with large interannual fluctuations in abun-
dance. The variation patterns for the medium size
group of saury are very similar to those of the large
size saury until 1976. After 1977, however, and
particularly after 1987, the medium size patterns are
e Kuroshio region, the Kuroshio–Oyashio Transition Zone (TZ) and
lid (open) bars indicate the positive (negative) values.

Fig. 11. Spatial difference in winter SST in the northwestern Pacific between 1988–1997 and 1998–2000 (a: top panel) and between 1977–1987
and 1988–1997 (b: bottom panel). Contour interval is 0.5jC.
Y. Tian et al. / Journal of Marine Systems 52 (2004) 235–257 247
completely the opposite of the large size group saury,
indicating that variations in abundance for the two
size groups are different and may respond to different
oceanic systems.
Fig. 13 shows annual changes in CPUE and larval
density during 1971–2000. Despite large interannual
variations, both indices increased markedly after 1987
indicating a shift occurred in the late 1980s. There is
no clear trend in mean body length for the two size
groups, although the mean length seems somewhat
small during the 1970s–1980s for the medium size
group (Fig. 14a). On the other hand, condition factors
for both large- and medium-sized saury are low until
the early 1970s and much higher after the mid-1980s
indicating a shift occurred in the early 1970s and
possibly again in the late 1980s (Fig. 14b). Fig. 15
shows the first two PC scores for the above eight
indices (abundance index, mean body length and
condition factor for the large and medium size groups,
and larval density and CPUE) of saury during 1971–
2000, which accounted for about 64% of the total
variance. The PC1 shows slow oscillations with a
distinct shift in 1986/1987, while PC2 shows large
interannual variations with changes in 1976/1977,
1982/1983, 1987/1988, and 1996/1997. These results
strongly suggest that a distinct regime shift occurred
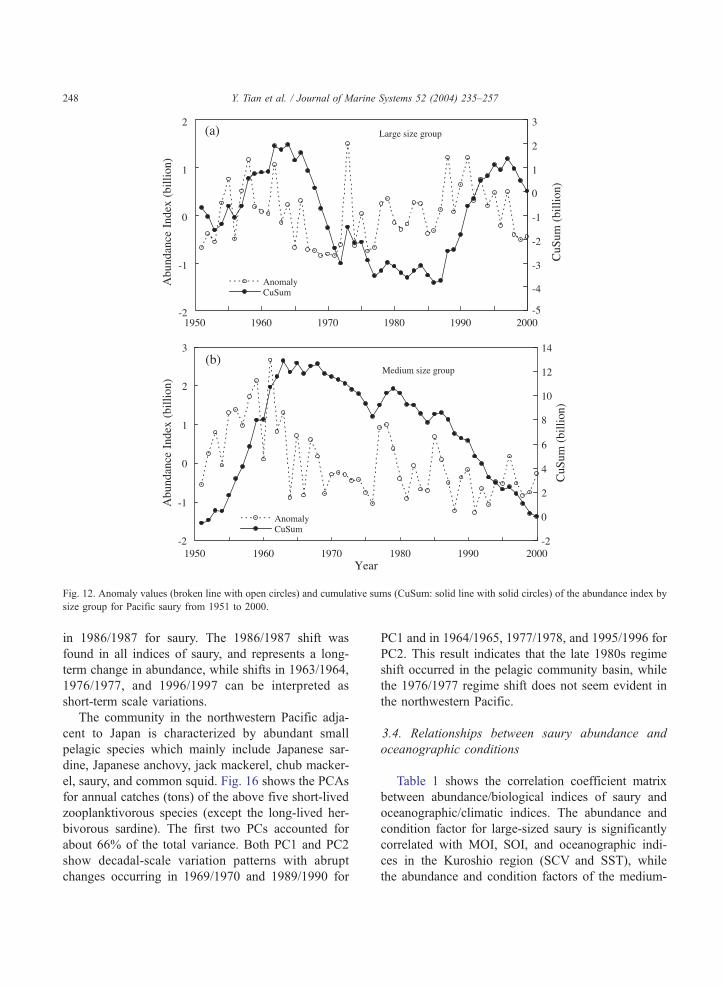
Fig. 12. Anomaly values (broken line with open circles) and cumulative sums (CuSum: solid line with solid circles) of the abundance index by
size group for Pacific saury from 1951 to 2000.
Y. Tian et al. / Journal of Marine Systems 52 (2004) 235–257248
in 1986/1987 for saury. The 1986/1987 shift was
found in all indices of saury, and represents a long-
term change in abundance, while shifts in 1963/1964,
1976/1977, and 1996/1997 can be interpreted as
short-term scale variations.
The community in the northwestern Pacific adja-
cent to Japan is characterized by abundant small
pelagic species which mainly include Japanese sar-
dine, Japanese anchovy, jack mackerel, chub macker-
el, saury, and common squid. Fig. 16 shows the PCAs
for annual catches (tons) of the above five short-lived
zooplanktivorous species (except the long-lived her-
bivorous sardine). The first two PCs accounted for
about 66% of the total variance. Both PC1 and PC2
show decadal-scale variation patterns with abrupt
changes occurring in 1969/1970 and 1989/1990 for
PC1 and in 1964/1965, 1977/1978, and 1995/1996 for
PC2. This result indicates that the late 1980s regime
shift occurred in the pelagic community basin, while
the 1976/1977 regime shift does not seem evident in
the northwestern Pacific.
3.4. Relationships between saury abundance and
oceanographic conditions
Table 1 shows the correlation coefficient matrix
between abundance/biological indices of saury and
oceanographic/climatic indices. The abundance and
condition factor for large-sized saury is significantly
correlated with MOI, SOI, and oceanographic indi-
ces in the Kuroshio region (SCV and SST), while
the abundance and condition factors of the medium-

Fig. 13. Annual changes in CPUE and larval density for Pacific saury from 1971 to 2000.
Y. Tian et al. / Journal of Marine Systems 52 (2004) 235–257 249
sized saury showed high correlations with AOI and
AT in the north of Japan. CPUE and larval density
also showed significant correlations with oceano-
graphic and meteorological indices in the south and
Fig. 14. Annual changes in mean body length (a) and condition fa
east of Japan indicating that the environments in
the Kuroshio region are strongly associated with
survival of saury. In particular, there are high
correlations between the CPUE and annual mean
ctor for Pacific saury by size group from 1951 to 2000 (b).
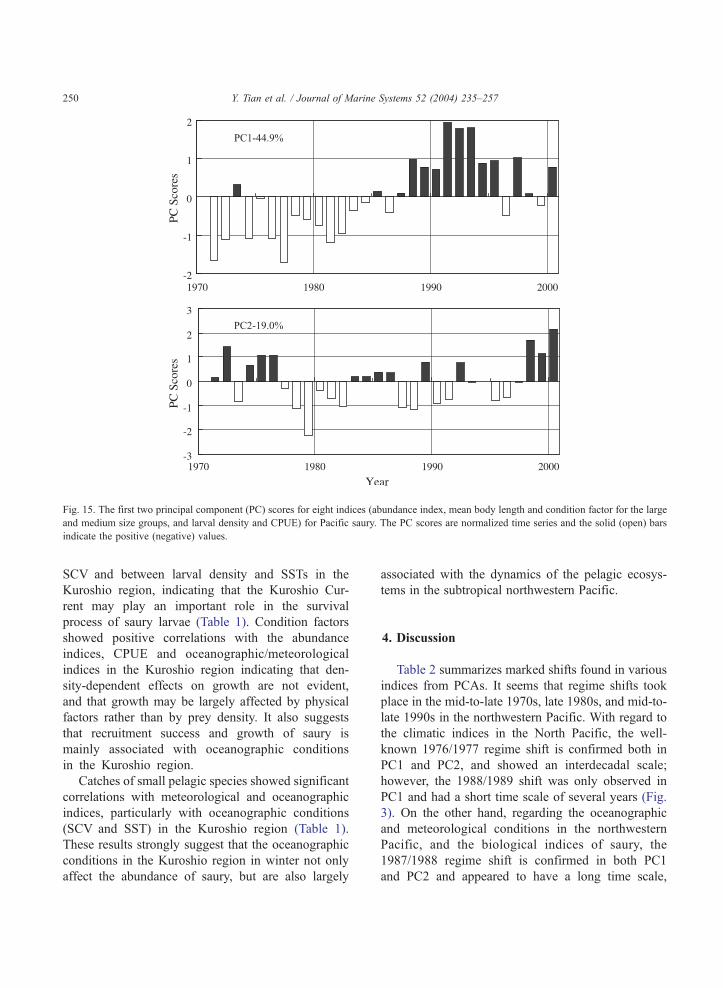
Fig. 15. The first two principal component (PC) scores for eight indices (abundance index, mean body length and condition factor for the large
and medium size groups, and larval density and CPUE) for Pacific saury. The PC scores are normalized time series and the solid (open) bars
indicate the positive (negative) values.
Y. Tian et al. / Journal of Marine Systems 52 (2004) 235–257250
SCV and between larval density and SSTs in the
Kuroshio region, indicating that the Kuroshio Cur-
rent may play an important role in the survival
process of saury larvae (Table 1). Condition factors
showed positive correlations with the abundance
indices, CPUE and oceanographic/meteorological
indices in the Kuroshio region indicating that den-
sity-dependent effects on growth are not evident,
and that growth may be largely affected by physical
factors rather than by prey density. It also suggests
that recruitment success and growth of saury is
mainly associated with oceanographic conditions
in the Kuroshio region.
Catches of small pelagic species showed significant
correlations with meteorological and oceanographic
indices, particularly with oceanographic conditions
(SCV and SST) in the Kuroshio region (Table 1).
These results strongly suggest that the oceanographic
conditions in the Kuroshio region in winter not only
affect the abundance of saury, but are also largely
associated with the dynamics of the pelagic ecosys-
tems in the subtropical northwestern Pacific.
4. Discussion
Table 2 summarizes marked shifts found in various
indices from PCAs. It seems that regime shifts took
place in the mid-to-late 1970s, late 1980s, and mid-to-
late 1990s in the northwestern Pacific. With regard to
the climatic indices in the North Pacific, the well-
known 1976/1977 regime shift is confirmed both in
PC1 and PC2, and showed an interdecadal scale;
however, the 1988/1989 shift was only observed in
PC1 and had a short time scale of several years (Fig.
3). On the other hand, regarding the oceanographic
and meteorological conditions in the northwestern
Pacific, and the biological indices of saury, the
1987/1988 regime shift is confirmed in both PC1
and PC2 and appeared to have a long time scale,
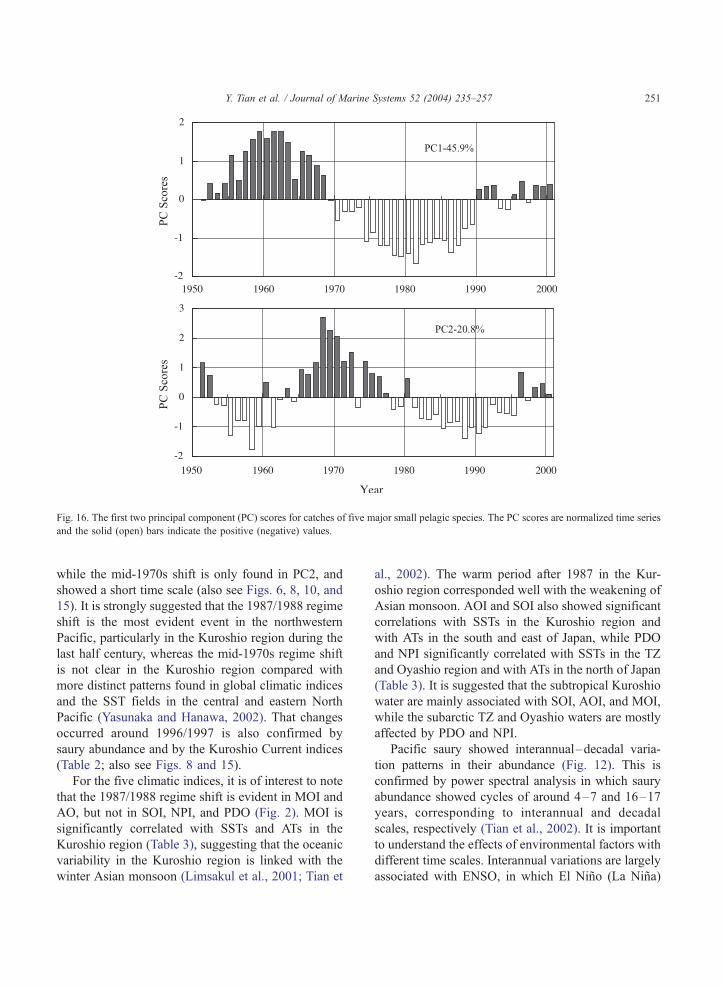
Fig. 16. The first two principal component (PC) scores for catches of five major small pelagic species. The PC scores are normalized time series
and the solid (open) bars indicate the positive (negative) values.
Y. Tian et al. / Journal of Marine Systems 52 (2004) 235–257 251
while the mid-1970s shift is only found in PC2, and
showed a short time scale (also see Figs. 6, 8, 10, and
15). It is strongly suggested that the 1987/1988 regime
shift is the most evident event in the northwestern
Pacific, particularly in the Kuroshio region during the
last half century, whereas the mid-1970s regime shift
is not clear in the Kuroshio region compared with
more distinct patterns found in global climatic indices
and the SST fields in the central and eastern North
Pacific (Yasunaka and Hanawa, 2002). That changes
occurred around 1996/1997 is also confirmed by
saury abundance and by the Kuroshio Current indices
(Table 2; also see Figs. 8 and 15).
For the five climatic indices, it is of interest to note
that the 1987/1988 regime shift is evident in MOI and
AO, but not in SOI, NPI, and PDO (Fig. 2). MOI is
significantly correlated with SSTs and ATs in the
Kuroshio region (Table 3), suggesting that the oceanic
variability in the Kuroshio region is linked with the
winter Asian monsoon (Limsakul et al., 2001; Tian et
al., 2002). The warm period after 1987 in the Kur-
oshio region corresponded well with the weakening of
Asian monsoon. AOI and SOI also showed significant
correlations with SSTs in the Kuroshio region and
with ATs in the south and east of Japan, while PDO
and NPI significantly correlated with SSTs in the TZ
and Oyashio region and with ATs in the north of Japan
(Table 3). It is suggested that the subtropical Kuroshio
water are mainly associated with SOI, AOI, and MOI,
while the subarctic TZ and Oyashio waters are mostly
affected by PDO and NPI.
Pacific saury showed interannual–decadal varia-
tion patterns in their abundance (Fig. 12). This is
confirmed by power spectral analysis in which saury
abundance showed cycles of around 4–7 and 16–17
years, corresponding to interannual and decadal
scales, respectively (Tian et al., 2002). It is important
to understand the effects of environmental factors with
different time scales. Interannual variations are largely
associated with ENSO, in which El Nino (La Nina)
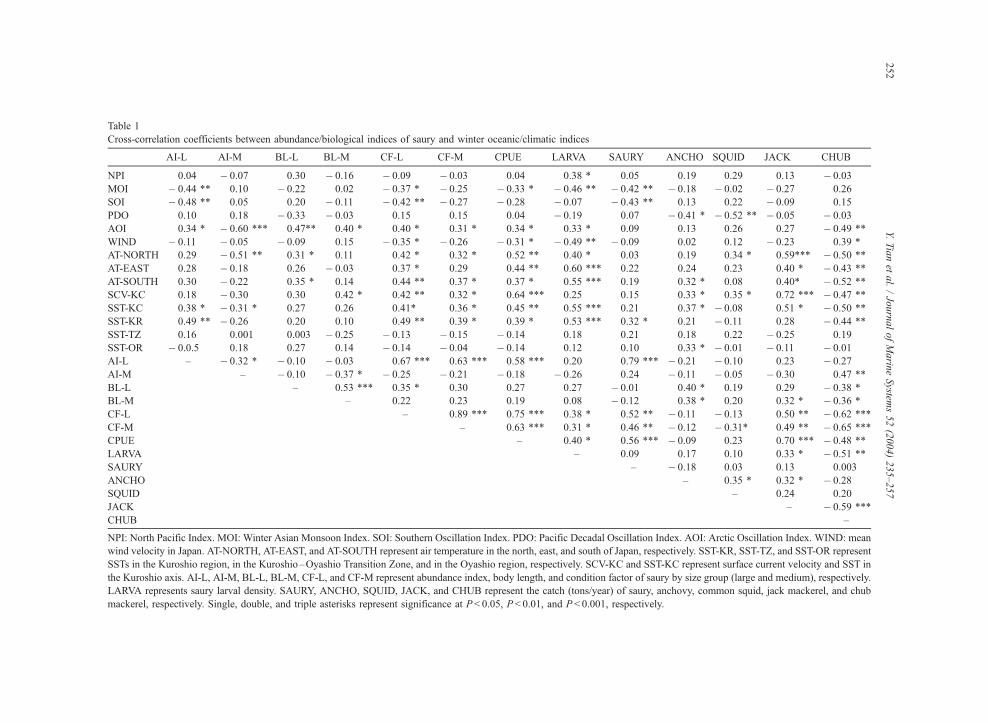
Table 1
Cross-correlation coefficients between abundance/biological indices of saury and winter oceanic/climatic indices
AI-L AI-M BL-L BL-M CF-L CF-M CPUE LARVA SAURY ANCHO SQUID JACK CHUB
NPI 0.04 � 0.07 0.30 � 0.16 � 0.09 � 0.03 0.04 0.38 * 0.05 0.19 0.29 0.13 � 0.03
MOI � 0.44 ** 0.10 � 0.22 0.02 � 0.37 * � 0.25 � 0.33 * � 0.46 ** � 0.42 ** � 0.18 � 0.02 � 0.27 0.26
SOI � 0.48 ** 0.05 0.20 � 0.11 � 0.42 ** � 0.27 � 0.28 � 0.07 � 0.43 ** 0.13 0.22 � 0.09 0.15
PDO 0.10 0.18 � 0.33 � 0.03 0.15 0.15 0.04 � 0.19 0.07 � 0.41 * � 0.52 ** � 0.05 � 0.03
AOI 0.34 * � 0.60 *** 0.47** 0.40 * 0.40 * 0.31 * 0.34 * 0.33 * 0.09 0.13 0.26 0.27 � 0.49 **
WIND � 0.11 � 0.05 � 0.09 0.15 � 0.35 * � 0.26 � 0.31 * � 0.49 ** � 0.09 0.02 0.12 � 0.23 0.39 *
AT-NORTH 0.29 � 0.51 ** 0.31 * 0.11 0.42 * 0.32 * 0.52 ** 0.40 * 0.03 0.19 0.34 * 0.59*** � 0.50 **
AT-EAST 0.28 � 0.18 0.26 � 0.03 0.37 * 0.29 0.44 ** 0.60 *** 0.22 0.24 0.23 0.40 * � 0.43 **
AT-SOUTH 0.30 � 0.22 0.35 * 0.14 0.44 ** 0.37 * 0.37 * 0.55 *** 0.19 0.32 * 0.08 0.40* � 0.52 **
SCV-KC 0.18 � 0.30 0.30 0.42 * 0.42 ** 0.32 * 0.64 *** 0.25 0.15 0.33 * 0.35 * 0.72 *** � 0.47 **
SST-KC 0.38 * � 0.31 * 0.27 0.26 0.41* 0.36 * 0.45 ** 0.55 *** 0.21 0.37 * � 0.08 0.51 * � 0.50 **
SST-KR 0.49 ** � 0.26 0.20 0.10 0.49 ** 0.39 * 0.39 * 0.53 *** 0.32 * 0.21 � 0.11 0.28 � 0.44 **
SST-TZ 0.16 0.001 0.003 � 0.25 � 0.13 � 0.15 � 0.14 0.18 0.21 0.18 0.22 � 0.25 0.19
SST-OR � 0.0.5 0.18 0.27 0.14 � 0.14 � 0.04 � 0.14 0.12 0.10 0.33 * � 0.01 � 0.11 � 0.01
AI-L – � 0.32 * � 0.10 � 0.03 0.67 *** 0.63 *** 0.58 *** 0.20 0.79 *** � 0.21 � 0.10 0.23 � 0.27
AI-M – � 0.10 � 0.37 * � 0.25 � 0.21 � 0.18 � 0.26 0.24 � 0.11 � 0.05 � 0.30 0.47 **
BL-L – 0.53 *** 0.35 * 0.30 0.27 0.27 � 0.01 0.40 * 0.19 0.29 � 0.38 *
BL-M – 0.22 0.23 0.19 0.08 � 0.12 0.38 * 0.20 0.32 * � 0.36 *
CF-L – 0.89 *** 0.75 *** 0.38 * 0.52 ** � 0.11 � 0.13 0.50 ** � 0.62 ***
CF-M – 0.63 *** 0.31 * 0.46 ** � 0.12 � 0.31* 0.49 ** � 0.65 ***
CPUE – 0.40 * 0.56 *** � 0.09 0.23 0.70 *** � 0.48 **
LARVA – 0.09 0.17 0.10 0.33 * � 0.51 **
SAURY – � 0.18 0.03 0.13 0.003
ANCHO – 0.35 * 0.32 * � 0.28
SQUID – 0.24 0.20
JACK – � 0.59 ***
CHUB –
NPI: North Pacific Index. MOI: Winter Asian Monsoon Index. SOI: Southern Oscillation Index. PDO: Pacific Decadal Oscillation Index. AOI: Arctic Oscillation Index. WIND: mean
wind velocity in Japan. AT-NORTH, AT-EAST, and AT-SOUTH represent air temperature in the north, east, and south of Japan, respectively. SST-KR, SST-TZ, and SST-OR represent
SSTs in the Kuroshio region, in the Kuroshio–Oyashio Transition Zone, and in the Oyashio region, respectively. SCV-KC and SST-KC represent surface current velocity and SST in
the Kuroshio axis. AI-L, AI-M, BL-L, BL-M, CF-L, and CF-M represent abundance index, body length, and condition factor of saury by size group (large and medium), respectively.
LARVA represents saury larval density. SAURY, ANCHO, SQUID, JACK, and CHUB represent the catch (tons/year) of saury, anchovy, common squid, jack mackerel, and chub
mackerel, respectively. Single, double, and triple asterisks represent significance at P< 0.05, P < 0.01, and P < 0.001, respectively.
Y.Tianet
al./JournalofMarin
eSystem
s52(2004)235–257
252
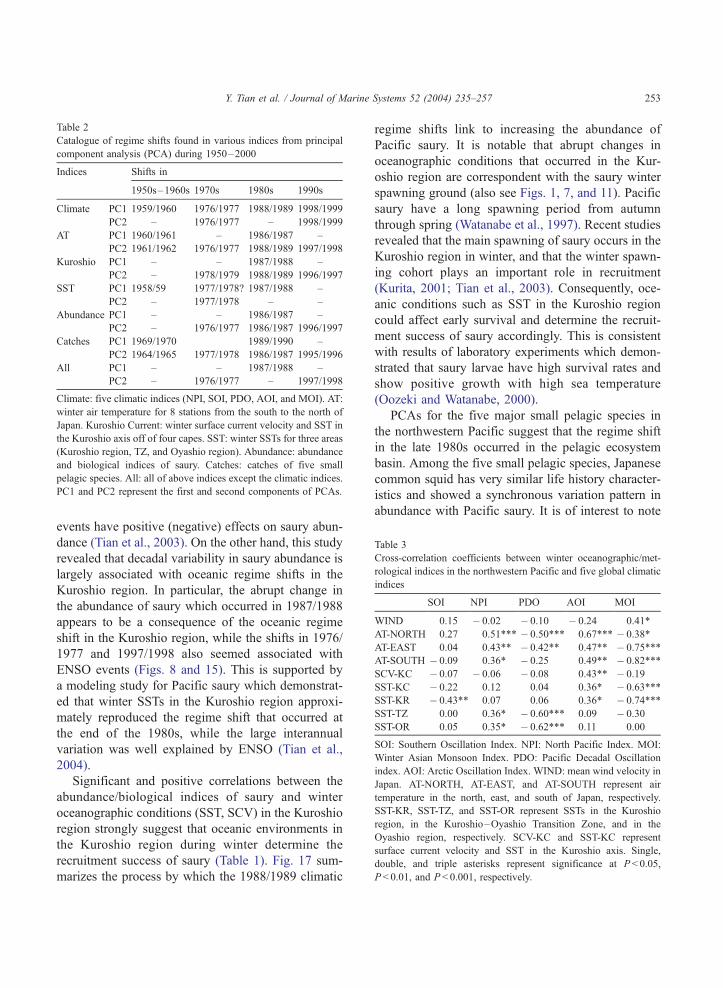
Table 2
Catalogue of regime shifts found in various indices from principal
component analysis (PCA) during 1950–2000
Indices Shifts in
1950s–1960s 1970s 1980s 1990s
Climate PC1 1959/1960 1976/1977 1988/1989 1998/1999
PC2 – 1976/1977 – 1998/1999
AT PC1 1960/1961 – 1986/1987 –
PC2 1961/1962 1976/1977 1988/1989 1997/1998
Kuroshio PC1 – – 1987/1988 –
PC2 – 1978/1979 1988/1989 1996/1997
SST PC1 1958/59 1977/1978? 1987/1988 –
PC2 – 1977/1978 – –
Abundance PC1 – – 1986/1987 –
PC2 – 1976/1977 1986/1987 1996/1997
Catches PC1 1969/1970 1989/1990 –
PC2 1964/1965 1977/1978 1986/1987 1995/1996
All PC1 – – 1987/1988 –
PC2 – 1976/1977 – 1997/1998
Climate: five climatic indices (NPI, SOI, PDO, AOI, and MOI). AT:
winter air temperature for 8 stations from the south to the north of
Japan. Kuroshio Current: winter surface current velocity and SST in
the Kuroshio axis off of four capes. SST: winter SSTs for three areas
(Kuroshio region, TZ, and Oyashio region). Abundance: abundance
and biological indices of saury. Catches: catches of five small
pelagic species. All: all of above indices except the climatic indices.
PC1 and PC2 represent the first and second components of PCAs.
Table 3
Cross-correlation coefficients between winter oceanographic/met-
rological indices in the northwestern Pacific and five global climatic
indices
SOI NPI PDO AOI MOI
WIND 0.15 � 0.02 � 0.10 � 0.24 0.41*
AT-NORTH 0.27 0.51*** � 0.50*** 0.67*** � 0.38*
AT-EAST 0.04 0.43** � 0.42** 0.47** � 0.75***
AT-SOUTH � 0.09 0.36* � 0.25 0.49** � 0.82***
SCV-KC � 0.07 � 0.06 � 0.08 0.43** � 0.19
SST-KC � 0.22 0.12 0.04 0.36* � 0.63***
SST-KR � 0.43** 0.07 0.06 0.36* � 0.74***
SST-TZ 0.00 0.36* � 0.60*** 0.09 � 0.30
SST-OR 0.05 0.35* � 0.62*** 0.11 0.00
SOI: Southern Oscillation Index. NPI: North Pacific Index. MOI:
Winter Asian Monsoon Index. PDO: Pacific Decadal Oscillation
index. AOI: Arctic Oscillation Index. WIND: mean wind velocity in
Japan. AT-NORTH, AT-EAST, and AT-SOUTH represent air
temperature in the north, east, and south of Japan, respectively.
SST-KR, SST-TZ, and SST-OR represent SSTs in the Kuroshio
region, in the Kuroshio–Oyashio Transition Zone, and in the
Oyashio region, respectively. SCV-KC and SST-KC represent
surface current velocity and SST in the Kuroshio axis. Single,
double, and triple asterisks represent significance at P< 0.05,
P< 0.01, and P < 0.001, respectively.
Y. Tian et al. / Journal of Marine Systems 52 (2004) 235–257 253
events have positive (negative) effects on saury abun-
dance (Tian et al., 2003). On the other hand, this study
revealed that decadal variability in saury abundance is
largely associated with oceanic regime shifts in the
Kuroshio region. In particular, the abrupt change in
the abundance of saury which occurred in 1987/1988
appears to be a consequence of the oceanic regime
shift in the Kuroshio region, while the shifts in 1976/
1977 and 1997/1998 also seemed associated with
ENSO events (Figs. 8 and 15). This is supported by
a modeling study for Pacific saury which demonstrat-
ed that winter SSTs in the Kuroshio region approxi-
mately reproduced the regime shift that occurred at
the end of the 1980s, while the large interannual
variation was well explained by ENSO (Tian et al.,
2004).
Significant and positive correlations between the
abundance/biological indices of saury and winter
oceanographic conditions (SST, SCV) in the Kuroshio
region strongly suggest that oceanic environments in
the Kuroshio region during winter determine the
recruitment success of saury (Table 1). Fig. 17 sum-
marizes the process by which the 1988/1989 climatic
regime shifts link to increasing the abundance of
Pacific saury. It is notable that abrupt changes in
oceanographic conditions that occurred in the Kur-
oshio region are correspondent with the saury winter
spawning ground (also see Figs. 1, 7, and 11). Pacific
saury have a long spawning period from autumn
through spring (Watanabe et al., 1997). Recent studies
revealed that the main spawning of saury occurs in the
Kuroshio region in winter, and that the winter spawn-
ing cohort plays an important role in recruitment
(Kurita, 2001; Tian et al., 2003). Consequently, oce-
anic conditions such as SST in the Kuroshio region
could affect early survival and determine the recruit-
ment success of saury accordingly. This is consistent
with results of laboratory experiments which demon-
strated that saury larvae have high survival rates and
show positive growth with high sea temperature
(Oozeki and Watanabe, 2000).
PCAs for the five major small pelagic species in
the northwestern Pacific suggest that the regime shift
in the late 1980s occurred in the pelagic ecosystem
basin. Among the five small pelagic species, Japanese
common squid has very similar life history character-
istics and showed a synchronous variation pattern in
abundance with Pacific saury. It is of interest to note

Fig. 17. Schematic diagram to show the possible process of the
effect of the 1988/1989 regime shift on the variability of abundance
of Pacific saury.
Y. Tian et al. / Journal of Marine Systems 52 (2004) 235–257254
that both the abundance and body size of common
squid showed an abrupt shift around 1988, and that
the body size correlated positively with abundance
(Kidokoro, 2001). It is believed that the stock fluctu-
ation of common squid is related to climatic regime
shifts, in particular to winter SST regimes in the
Kuroshio region (Sakurai, 2001). This is consistent
with changes both in the abundance and the condition
factors of saury which occurred in the late 1980s,
indicative of the responses to the 1987/1988 oceanic
regime shifts in the northwestern Pacific.
Our analyses revealed that a marked oceanic re-
gime shift occurred around 1987/1988 in the Kuroshio
region, and that it was strongly associated with the
dynamics of the pelagic community in the northwest-
ern Pacific, whereas the 1976/1977 regime shift was
not evident there. Noto and Yasuda (1999) showed
that SSTs in the Kuroshio Extension abruptly in-
creased during the winter of 1987–1988 and was
associated with the collapse of Japanese sardine.
Using long-term time series (1960–1997) in oceano-
graphic and meteorological data, Lin et al. (2001)
showed that only the 1988/1989 regime shift was
observed in the Bohai Sea. Regime shifts in 1976
and 1988 were detected in Korean waters and fisheries
resources were greatly affected by these regime shifts
(Kang et al., 2000; Zhang et al., 2000); however, it
appeared that the 1976 shift was not as strong or as
influential as the 1988 shift. Yasuda et al. (2000)
found that there was a regime shift in the winter
mixed layer depth (MLD) in the Kuroshio Extension
changing from a thick to a thin phase in 1985. The
MLD is affected by the winter Asian monsoon, and is
strongly associated with primary production in the
northwestern subtropical Pacific (Limsakul et al.,
2001; Sugimoto et al., 2001). Both the Chl-a concen-
tration and zooplankton biomass in the offshore
waters of the Kuroshio Current south of Japan have
increased since the end of the 1980s (Sugimoto et al.,
2001). Zooplankton biomass in Korean waters also
has showed an abrupt increase after 1990 (Zhang et
al., 2000; Kang, 2001). These studies strongly sug-
gested that the 1987/1988 regime shift occurred not
only in the oceanic environment, but also in the
ecosystems from low trophic levels to pelagic fish
species in the northwestern Pacific, and that the
regime shift was linked with large-scale climate
changes such as the Asian monsoon. Increasing evi-
dence supports the conclusions that a regime shift
took place in late 1980s, and possibly around 1998,
both in the pelagic ecosystem and the oceanic envi-
ronment in the northeastern Pacific (e.g., Beamish et
al., 1999, 2000; McFarlane et al., 2000; Hare and
Mantua, 2000; Minobe, 2002), suggesting that the
1987/1988 regime shift occurred on a scale of the
entire North Pacific basin. However, since the varia-
tion patterns in SST fields are different in the north-
western and northeastern Pacific (Yasunaka and
Hanawa, 2002), it is important to focus on regional
oceanic/climatic indices representing the environmen-
tal habitat of specific species. Our analysis led us to
conclude that oceanic conditions such as winter SSTs
in the Kuroshio region are useful indices for predict-
ing long-term abundance trends of Pacific saury, and
Y. Tian et al. / Journal of Marine Systems 52 (2004) 235–257 255
the apparently strong saury abundance response to
these physical conditions suggests that Pacific saury
could be used as a bio-indicator of regime shifts in the
Kuroshio waters.
5. Summary and conclusions
1. The PCAs on oceanographic, meteorological, and
climatic indices suggest that oceanic regime shifts
took place in the mid-1970s, late 1980s, and
possibly late 1990s in the northwestern Pacific. In
particular, the 1987/1988 regime shift is the most
evident event in the Kuroshio region during the last
half century, whereas the mid-1970s regime shift is
not clear in the Kuroshio region compared with its
distinct pattern found in global climatic indices and
SST fields in the central and eastern North Pacific.
2. The oceanic regime shifts in the Kuroshio region
are strongly associated with the dynamics of the
pelagic community.
3. Decadal variations in Pacific saury abundance
corresponded well with the regime shifts of 1976/
1977, 1987/1988, and possibly 1997/1998 in the
Kuroshio region. In particular, the abrupt change in
saury abundance which occurred around 1987/
1988 appears to be a consequence of the oceanic
regime shift in the Kuroshio region, while the shifts
in 1976/1977 and 1997/1998 also seemed associ-
ated with ENSO events.
4. Since the abundance/biological indices of saury are
significantly correlated with winter oceanographic
conditions (SST, SCV) in the Kuroshio region,
oceanic environmental factors, such as SST in the
Kuroshio region, appear to influence the early
survival and recruitment success of saury.
5. Positive correlations were found between condition
factors and saury abundance indices, CPUE and
oceanographic/meteorological indices in the Kur-
oshio region indicating that a density-dependent
effect on the growth is not evident, and that
recruitment success and growth of saury are
strongly affected by oceanographic conditions in
the Kuroshio region, rather than by biological
factors such as prey density.
6. The PCAs for the main, small pelagic species
investigated suggest that the regime shift in the late
1980s occurred basin-wide in the pelagic ecosys-
tem of the northwestern Pacific, and that Pacific
saury could be used as a bio-indicator of
oceanographic regime shifts in Kuroshio waters.
Acknowledgements
We are grateful to Dr. T. Watanabe of NRIFS for
providing MOI data and to the Japanese Fisheries
Agency for providing the condition factor data for
saury. We thank Dr. T. Watanabe of JSNFRI for his
kind help in drawing spatial maps, and also Drs. A.
Yatsu and T. Yirie of NRIFS for their discussions and
support. Comments from two reviewers helped to
improve this manuscript. This study was partially
supported by grants from the VENFISH project of the
Japanese Ministry of Agriculture, Forestry and
Fisheries.
References
Attrill, M.J., Power, M., 2002. Climatic influence on a marine fish
assemblage. Nature 417, 275–278.
Beamish, R.J., Noakes, D.J., McFarlane, G.A., Klyashtorin, L.,
Ivanov, V.V., Kurashov, V., 1999. The regime concept and nat-
ural trends in the production of Pacific salmon. Can. J. Fish.
Aquat. Sci. 56, 516–526.
Beamish, R.J., McFarlane, G.A., King, J.R., 2000. Fisheries clima-
tology: understanding decadal scale processes that naturally reg-
ulate British Columbia fish populations. In: Harrison, P.J.,
Parsons, T.R. (Eds.), Fisheries Oceanography: An Integrative
Approach to Fisheries Ecology and Management. Blackwell,
London, pp. 94–139.
Belyaev, V.A., Shatilina, T.A., 1995. Variation in abundance of
pelagic fishes in the Kuroshio Zones as related to climatic
changes. In: Beamish, R.J. (Ed.), Climate Changes and
Northern Fish Populations. Can. Spec. Publ. Fish. Aquat.
Sci., vol. 121, pp. 553–559.
Chikuni, S., 1985. The fish resources of the northwest Pacific. FAO
Fish. Tech. Pap., vol. 266. FAO, Rome, pp. 18–28.
Finney, B., Gregory-Eaves, I., Douglas, M.S.V., Smol, J.P., 2002.
Fisheries productivity in the northeastern Pacific Ocean over the
past 2200 years. Nature 416, 729–733.
Francis, R.C., Hare, S.R., Hollowed, A.B., Wooster, W.S., 1998.
Effects of interdecadal climate variability on the oceanic eco-
systems of the NE Pacific. Fish. Oceanogr. 7, 1–21.
Fukushima, S., 1979. Synoptic analysis of migration and fishing
conditions of saury in the northwestern Pacific Ocean. Bull.
Tohoku Reg. Fish. Res. Lab. 41, 1–70 (in Japanese, with
English abstract).
Gong, Y., 1984. Distribution and movements of Pacific saury,
Cololabis saira (BREVOORT), in relation to oceanographic
Y. Tian et al. / Journal of Marine Systems 52 (2004) 235–257256
conditions in waters off Korea. Bull. Fish. Res. Dev. Agency
33, 59–172.
Graham, N.E., 1994. Decadal scale variability in the 1970s and
1980s: observations and models results. Clim. Dyn. 10,
135–162.
Hanawa, K., 1995. Long-term variations in SST fields of the North
Pacific Ocean. In: Beamish, R.J. (Ed.), Climate Changes and
Northern Fish Populations. Can. Spec. Publ. Fish. Aquat. Sci.,
vol. 121, pp. 25–36.
Hare, S.R., Francis, R.C., 1995. Climate change and salmon pro-
duction in the Northeast Pacific Ocean. In: Beamish, R.J. (Ed.),
Climate Changes and Northern Fish Populations. Can. Spec.
Publ. Fish. Aquat. Sci., vol. 121, pp. 357–372.
Hare, S.R., Mantua, N.J., 2000. Empirical evidence for North
Pacific regime shifts in 1977 and 1989. Prog. Oceanogr. 47,
103–145.
Hollowed, A.B., Wooster, W.S., 1995. Decadal-scale variations in
the eastern subarctic Pacific. In: Beamish, R.J. (Ed.), Climate
Changes and Northern Fish Populations. Can. Spec. Publ. Fish.
Aquat. Sci., vol. 121, pp. 373–385.
Hollowed, A.B., Hare, S.R., Wooster, W.S., 2001. Pacific Basin
climate variability and patterns of Northeast Pacific marine fish
production. Prog. Oceanogr. 49, 257–282.
Kang, Y., 2001. Interannual and seasonal variations in zooplankton
in Korean waters. GLOBEC Rep. 15, 21–22.
Kang, S., Kim, S., Bae, S., 2000. Changes in ecosystem compo-
nents induced by climate variability off the eastern coast of the
Korean Peninsula during 1960–1990. Prog. Oceanogr. 47,
205–222.
Kidokoro, H., 2001. Fluctuations in body size and abundance of
Japanese common squid (Todarodes pacificus) in the Sea of
Japan. GLOBEC Rep. 15, 42.
Kosaka, S., 2000. Life history of Pacific saury Cololabis saira in
the Northwest Pacific and consideration of resource fluctuation
based on it. Bull. Tohoku Natl. Fish. Res. Inst. 63, 1–96 (in
Japanese, with English abstract).
Kurita, Y., 2001. Seasonal changes in spawning grounds and the
abundance of egg-laying of Pacific sauryTohoku National
Fisheries Research Institute, Y. (Ed.), Annual Report of the
Research Meeting on Saury Resource, vol. 49, Tohoku Nation-
al Fisheries Research Institute, Aomori, Japan, pp. 203–205
(in Japanese).
Limsakul, A., Saino, T., Midorukawa, T., Goes, J.I., 2001. Tempo-
ral variation in lower trophic level biological environment in the
northwestern North Pacific Subtropical Gyre from 1950 to 1997.
Prog. Oceanogr. 49, 129–1492.
Lin, C., Su, J., Xu, B., Tang, Q., 2001. Long-term variations of
temperature and salinity of Bohai Sea and their influence on its
ecosystem. Prog. Oceanogr. 49, 7–19.
Mantua, N.J., Hare, S.R., 2002. The Pacific decadal oscillation.
J. Oceanogr. 58, 35–44.
Mantua, N.J., Hare, S.R., Zhang, Y., Wallace, J.M., Francis, R.C.,
1997. A Pacific interdecadal climate oscillation with impacts on
salmon production. Bull. Am. Meteorol. Soc. 78, 1069–1079.
McFarlane, G.A., King, J.R., Beamish, R.J., 2000. Have there been
recent changes in climate? Ask the fish. Prog. Oceanogr. 47,
147–169.
McGowan, J.A., Cayan, D.R., Dorman, L.M., 1998. Climate –
ocean variability and ecosystem response in the Northeast Pa-
cific. Science 281, 210–217.
Miller, A.J., Scheider, N., 2000. Interdecadal climate regime dy-
namics in the North Pacific Ocean: theories, observations and
ecosystem impacts. Prog. Oceanogr. 47, 355–379.
Minobe, S., 1999. Resonance in bidecadal and pentadecadal climate
oscillations over the North Pacific: role in climate regime shifts.
Geophys. Res. Lett. 26, 855–858.
Minobe, S., 2002. Interannual to interdecadal changes in the Bering
Sea and concurrent 1998/99 changes over the North Pacific.
Prog. Oceanogr. 55, 45–64.
Minobe, S., Mantua, N., 1999. Interdecadal modulation of interan-
nual atmospheric and oceanic variability over the North Pacific.
Prog. Oceanogr. 43, 163–192.
Nakamura, H., Yamagata, T., 1999. Recent decadal SST variability
in the Northwestern Pacific and associated atmospheric anoma-
lies. In: Navarra, A. (Ed.), Beyond El Nino: Decadal and Inter-
decadal Climate Variability. Springer, Berlin, pp. 49–72.
Nakamura, H., Lin, G., Yamagawa, T., 1997. Decadal climate var-
iability in the North Pacific during the recent decades. Bull. Am.
Meteorol. Soc. 78, 2215–2225.
Nitta, T., Yamada, S., 1989. Recent warming of tropical sea surface
temperature and its relationship to the Northern Hemisphere
circulation. J. Meteorol. Soc. Jpn. 67, 375–383.
Noto, M., Yasuda, I., 1999. Population decline of the Japanese
sardine, Sardinops melanostictus, in relation to sea surface tem-
perature in the Kuroshio Extension. Can. J. Fish. Aquat. Sci. 56,
973–983.
Oozeki, Y., Watanabe, Y., 2000. Comparison of somatic growth and
otolith increment growth in laboratory-reared larvae of Pacific
saury, Cololabis saira, under different temperature conditions.
Mar. Biol. 236, 349–359.
Parrish, R.H., Schwing, F.B., Mendelssohn, R., 2000. Mid-latitude
wind stress: the energy source for climatic shifts in the North
Pacific Ocean. Fish. Oceanogr. 9, 224–238.
Sakurai, Y., 2001. Possible stock fluctuation scenarios of the squid,
Todarodes pacificus, related to climatic regime shifts. GLOBEC
Rep. 15, 36–38.
Sugimoto, T., Tadokoro, K., 1998. Interdecadal variations of plank-
ton biomass and physical environment in the North Pacific.
Fish. Oceanogr. 7, 289–299.
Sugimoto, T., Kimura, S., Tadokoro, K., 2001. Impacts of El Nino
events and climate regime shifts on living resources in the west-
ern North Pacific. Prog. Oceanogr. 49, 113–127.
Thomson, D.W.J., Wallace, J.M., 1998. The Arctic Oscillation sig-
nature in the wintertime geopotential height and temperature
fields. Geophys. Res. Lett. 25, 1297–1300.
Tian, Y., Akamine, T., Suda, M., 2002. Long-term variability in
the abundance of Pacific saury in the northwestern Pacific
ocean and climate changes during the last century. Bull.
Jpn. Soc. Fish. Ocenogr. 66, 16–25 (in Japanese, with English
abstract).
Tian, Y., Akamine, T., Suda, M., 2003. Variations in the abundance
of Pacific saury (Cololabis saira) from the northwestern Pacific
in relation to oceanic–climate changes. Fish. Res. 60, 439–454.
Tian, Y., Akamine, T., Suda, M., 2004. Modeling the influence of

Y. Tian et al. / Journal of Marine Systems 52 (2004) 235–257 257
oceanic–climatic changes on the dynamics of Pacific saury in
the northwestern Pacific using a life cycle model. Fish. Ocean-
ogr. (2004), in press.
Tohoku National Fisheries Research Institute (TNFRI), 2000.
Annual Report of the Research Meeting on Saury Resource,
vol. 48. Tohoku National Fisheries Research Institute,
Aomori, Japan, pp. 42–58 (in Japanese).
Trenberth, K.E., 1990. Recent observed interdecadal climate
changes in the Northern Hemisphere. Bull. Am. Meteorol.
Soc. 71, 988–993.
Trenberth, K.E., Hurrel, J.W., 1994. Decadal atmosphere–ocean
variation in the Pacific. Clim. Dyn. 9, 303–319.
Watanabe, Y., Butler, J.L., Mori, T., 1988. Growth of Pacific saury,
Cololabis saira, in the northeastern and northwestern Pacific
Ocean. Fish. Bull. (U.S.) 86, 489–498.
Watanabe, Y., Oozeki, Y., Kitagawa, D., 1997. Larval parameters
determining preschooling juvenile production of Pacific saury
(Cololabis saira) in the northwestern Pacific. Can. J. Fish.
Aquat. Sci. 54, 1067–1076.
Wootton, R.J., 1990. Ecology of Teleost Fishes. Chapman & Hall,
London. 404 pp.
Yasuda, I., Tozuka, T., Noto, M., Kouketsu, S., 2000. Heat balance
and regime shifts of the mixed layer in the Kuroshio Extension.
Prog. Oceanogr. 47, 257–278.
Yasunaka, S., Hanawa, K., 2002. Regime shifts found in the north-
ern hemisphere SST field. J. Meteorol. Soc. Jpn. 80, 119–135.
Zhang, C.I., Lee, J.B., Kim, S., Oh, J.H., 2000. Climatic regime
shifts and their impacts on marine ecosystems and fisheries
resources in Korean waters. Prog. Oceanogr. 47, 171–190.