debt service and capital planning - onondaga county, … · debt service and capital planning...
TRANSCRIPT
Debt Service and Capital Planning
Section 6

In This Section
Capital Improvement Plan (CIP) ................................... See separate 2018-2023 Capital Improvement Plan Debt Service ................................................................................................................................................. 6-1 Calculation of Total Net Indebtedness ....................................................................................................... 6-4 Constitutional Debt Limit and Debt Margin ............................................................................................. 6-5 2018 Debt Service Summary - All Funds .................................................................................................... 6-6 2018 Debt Service Summary - Countywide Debt Service ........................................................................... 6-7 2018 Debt Service Summary - Special Districts .......................................................................................... 6-8 Indebtedness Authorized and Unissued ..................................................................................................... 6-9 Serial Bonds.................................................................................................................................................. 6-10 Serial Bonds by Department ........................................................................................................................ 6-11 Capital Planning .......................................................................................................................................... 6-17 Proposed Projects - Six Year Summary of Estimated Expenses .................................................................. 6-20 Proposed Projects- Source of Funds 2018-2023 .......................................................................................... 6-23 Proposed Projects- Summary of 2018 Estimated Expenses ........................................................................ 6-24 Proposed Capital Improvement Projects for 2018 ..................................................................................... 6-26

Debt Service
Several methods are available to finance capital improvement projects and other authorized activities. Onondaga County, like most governmental units, borrows money in order to acquire land and equipment, construct buildings, and make renovations and improvements. The cost of these capital projects are normally financed by the issuance of debt obligations which are then repaid over several years along with the interest incurred on the borrowings. An amount is included in the County’s annual operating budget to make these payments, which is defined as “debt service”. This policy enables the cost of these capital assets to be borne by the present and future taxpayers receiving the benefit of the capital assets or improvements.
The use of debt, usually through the issuance of bonds, to finance capital projects has several advantages. Primarily, it allows the County to obtain for current use a capital facility that would go beyond its capacity to finance on a pay-as-you-go basis. In addition, the flexibility associated with the repayment of bonds allows the County to smooth out its expenditure pattern over a period of several years. The structure of the principal payments cumulatively effects both interest payments and subsequently the County’s operating budget.
In general, the State Legislature has granted the power and defined the procedure for the County to borrow by the enactment of the Local Finance Law. Pursuant to the Local Finance Law, its Charter and the County Law, the County authorizes the issuance of bonds by the adoption of a bond resolution, which must be approved by at least two-thirds of the members of the County Legislature. Through the bond resolutions, the County Legislature delegates to the Chief Fiscal Officer the power to authorize and sell bond anticipation notes in anticipation of authorized bonds.
Each bond resolution authorizes the construction, acquisition or installation of the object or purpose to be financed, the plan of financing, the amount of money being borrowed, and the Period of Probable Usefulness (PPU), which ties in with the maximum maturity of the bonds subject to legal restrictions. Within these bonding requirements, the County has considerable flexibility in its borrowing program and can issue two basic forms of debt instruments: Serial Bonds (Bonds) and Bond Anticipation Notes (BANs). BANs, due to their short term (12 months or less), are used to facilitate borrowing for projects that have a PPU of 5 years or less, or are relatively small in amount or otherwise inappropriate for long-term borrowing.
In addition, BANs allow the County the option of conversion to Serial Bonds when interest rates are most beneficial for long-term debt. Statutory law in New York permits BANs to be renewed each year provided annual principal installments are made prior to the second renewal, if the principal is not paid off after the fourth renewal (5 years from the original date of borrowing), the BAN must be converted to a Serial Bond. There is an exception to the 4-time renewal limitation on BANs for Special District Borrowing for Water Environment Protection and Water. BANs may be renewed indefinitely for Special Districts as long as they do not violate the assigned PPU.
The Local Finance Law contains provisions providing the County with power to issue certain other short-term general obligation indebtedness, including revenue and tax anticipation notes and budget and capital notes. Onondaga County has not used any of these short-term borrowing options since 1992.
Bond Advisors
Bond counsel and our financial advisors play an important role in the bond issuing process. They can be influential in reducing borrowing costs by advising the issuing government on how best to structure the
issue and when best to go to market. They assist us in the preparation of the County’s Official Statement,
Debt Service & Capital Planning Section 6 Page 1

insuring that it meets the legal requirements and includes the information to present the County’s financial status and economic activities and comparisons.
They assist us in the application for bond ratings, which provide investors with a symbol of credit quality that is easily recognized. Through careful fiscal planning and sound financial management, Onondaga County received the following ratings: AAA by Fitch, AA+ by S&P and Aa2 by Moody’s.
Market Factors Affecting Bonds
The market for Bonds and Notes could be affected by a variety of factors, some of which are beyond the County’s control. There can be no assurance that adverse events at the state level will not occur which might affect the market price of outstanding Bonds and Notes and the market for additional debt. If a significant default or other financial crisis should occur in the affairs of the federal or state government or of any of its agencies or political subdivisions, it could impair the acceptability of obligations issued and bond ratings of borrowers, such as Onondaga County.
The traditional market for our debt has changed over the years, from primarily banks and individual investors, to the major brokerage houses and fund investors. The County looks to market conditions when scheduling its bond sale to optimize savings to the taxpayers.
Debt Management Planning
Onondaga County’s debt management planning covers all debt issued by the County including debt wholly supported by special district fund revenues. The County’s comprehensive approach to debt management includes: administrative review, emphasis on pay-as-you-go within defined limits, adherence to multiple policies established by the legislature, adherence to local finance law, and comprehensive use of bond counsel and financial advisors.
The County has been proactive in making debt management a priority. In 2009, the County took advantage of the available incentives and issued Build America Bonds (BAB’s) and Recovery Zone Bonds (RZ’s) totaling $22.4 million. Over the 16 year life of the BAB’s the County expected to realize the Federal Government’s 35% interest subsidy of $3.7 million and for the 20 years of the RZ’s, a 45% subsidy totaling over $2.3 million. The Federal Government’s sequestration has eliminated a percentage of the annual subsidy beginning in March 2013 extending through September 20, 2023. As part of the 2008 budget process, the County amended its 1999 resolution that established the 10% fund balance goal. The calculation for General Fund revenues was formally adjusted to reflect the 2006 NYS accounting change for sales tax passed-through to other municipalities. Since the County ended 2006 with its fund balance at 12.9% of General Fund revenues, the 2008 budget allocated $8 million to fund projects for which the County had not yet borrowed. That provided approximately 15 years of $750,000 annual tax relief. The County actively monitors its outstanding debt, reviewing candidates for refunding. Taking advantage of the lowest interest-rate environment in forty years, the County over the past four years has refunded multiple debt issuances which include: approximately $19.6 million of its bonds in June 2014 saving $1.2 million, $11.3 million in June 2015 saving an additional $864 thousand through 2027, and $33.88 million in November 2016 saving $3.75 million through 2030.
Debt Service & Capital Planning Section 6 Page 2
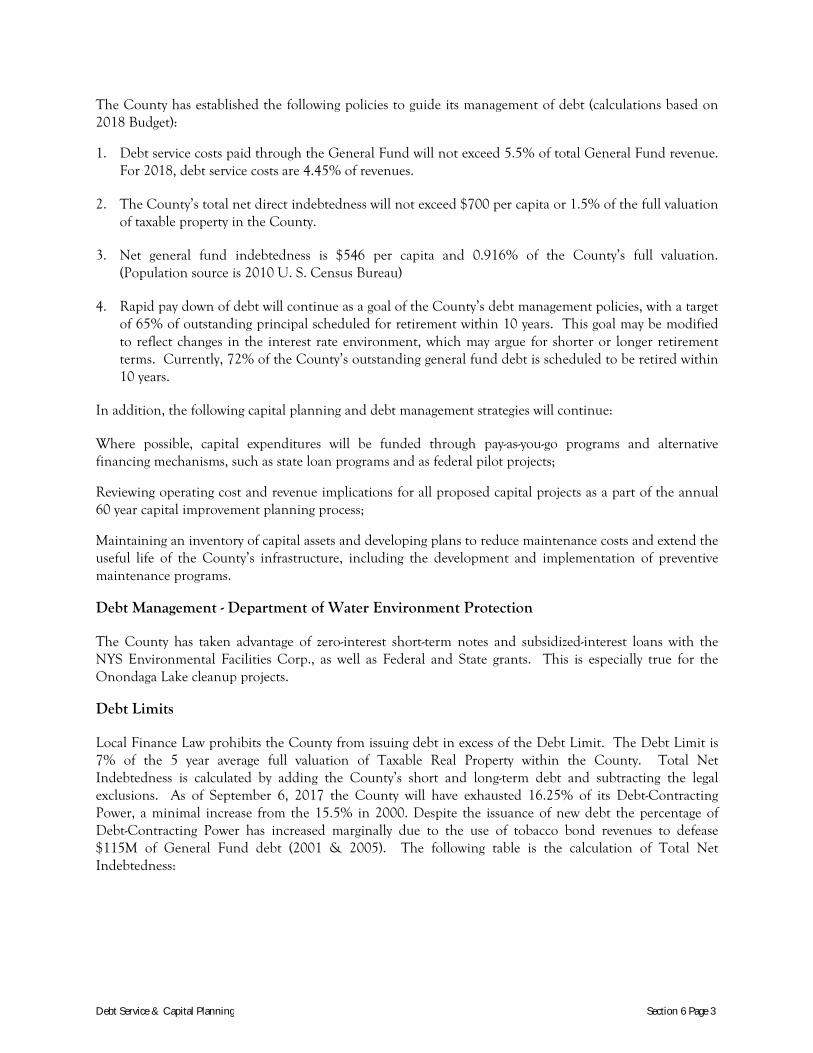
The County has established the following policies to guide its management of debt (calculations based on 2018 Budget):
1. Debt service costs paid through the General Fund will not exceed 5.5% of total General Fund revenue. For 2018, debt service costs are 4.45% of revenues.
2. The County’s total net direct indebtedness will not exceed $700 per capita or 1.5% of the full valuation of taxable property in the County.
3. Net general fund indebtedness is $546 per capita and 0.916% of the County’s full valuation. (Population source is 2010 U. S. Census Bureau)
4. Rapid pay down of debt will continue as a goal of the County’s debt management policies, with a target of 65% of outstanding principal scheduled for retirement within 10 years. This goal may be modified to reflect changes in the interest rate environment, which may argue for shorter or longer retirement terms. Currently, 72% of the County’s outstanding general fund debt is scheduled to be retired within 10 years.
In addition, the following capital planning and debt management strategies will continue:
Where possible, capital expenditures will be funded through pay-as-you-go programs and alternative financing mechanisms, such as state loan programs and as federal pilot projects;
Reviewing operating cost and revenue implications for all proposed capital projects as a part of the annual 60 year capital improvement planning process;
Maintaining an inventory of capital assets and developing plans to reduce maintenance costs and extend the useful life of the County’s infrastructure, including the development and implementation of preventive maintenance programs.
Debt Management - Department of Water Environment Protection
The County has taken advantage of zero-interest short-term notes and subsidized-interest loans with the NYS Environmental Facilities Corp., as well as Federal and State grants. This is especially true for the Onondaga Lake cleanup projects.
Debt Limits
Local Finance Law prohibits the County from issuing debt in excess of the Debt Limit. The Debt Limit is 7% of the 5 year average full valuation of Taxable Real Property within the County. Total Net Indebtedness is calculated by adding the County’s short and long-term debt and subtracting the legal exclusions. As of September 6, 2017 the County will have exhausted 16.25% of its Debt-Contracting Power, a minimal increase from the 15.5% in 2000. Despite the issuance of new debt the percentage of Debt-Contracting Power has increased marginally due to the use of tobacco bond revenues to defease $115M of General Fund debt (2001 & 2005). The following table is the calculation of Total Net Indebtedness:
Debt Service & Capital Planning Section 6 Page 3
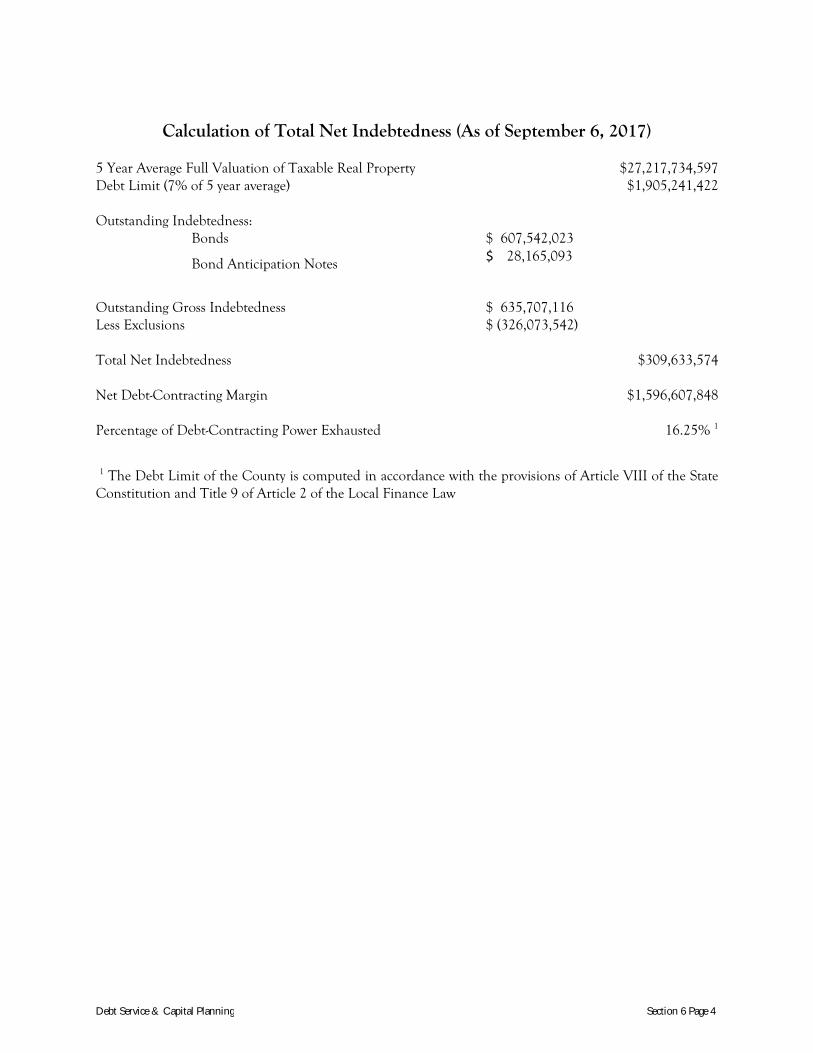
Calculation of Total Net Indebtedness (As of September 6, 2017)
5 Year Average Full Valuation of Taxable Real Property $27,217,734,597 Debt Limit (7% of 5 year average) $1,905,241,422 Outstanding Indebtedness:
Bonds $ 607,542,023
Bond Anticipation Notes $ 28,165,093
Outstanding Gross Indebtedness $ 635,707,116 Less Exclusions $ (326,073,542) Total Net Indebtedness $309,633,574 Net Debt-Contracting Margin $1,596,607,848 Percentage of Debt-Contracting Power Exhausted 16.25% 1
1 The Debt Limit of the County is computed in accordance with the provisions of Article VIII of the State Constitution and Title 9 of Article 2 of the Local Finance Law
Debt Service & Capital Planning Section 6 Page 4

Debt Limit and Debt Margin
Onondaga County's use of its constitutional debt limit declined dramatically in 2001 when it defeased $95M of general fund debt, using proceeds from tobacco revenue bonds. A second tobacco bond sale in 2005 enabled an additional $20M in debt to be defeased. The current percentage of debt contracting power that has been exhausted is 16.25%, which is a marginal increase over the 15.5% in 2000, and down in comparison to an average of 17.8% for the years 1994 - 2000. The debt margin is more than 5 times the total net indebtedness and provides ample flexibility to continue to meet the capital needs of the County.
2017 Debt Limit and Debt Margin
(as of September 6, 2017)
Debt Limit $1,905,241,422
Total Net Indebtedness $309,633,574
Debt Margin $1,596,607,848
Percentage of Debt Limit Used 16.25%
Note: The constitutional debt margin is the amount of additional debt, which a municipality may legally assume at a particular time and is calculated by subtracting the total net indebtedness from the debt limit. The debt limit is equal to 7% of the 5 year full value of taxable real property while the total net indebtedness equals total outstanding debt minus approved exclusions.
Percentage of Debt Limit Used
0%
10%
20%
30%
2000 2002 2004 2006 2008 2010 2012 2014 2016
Issued tobacco bonds to defease debt in 2010
Debt Service & Capital Planning Section 6 Page 5
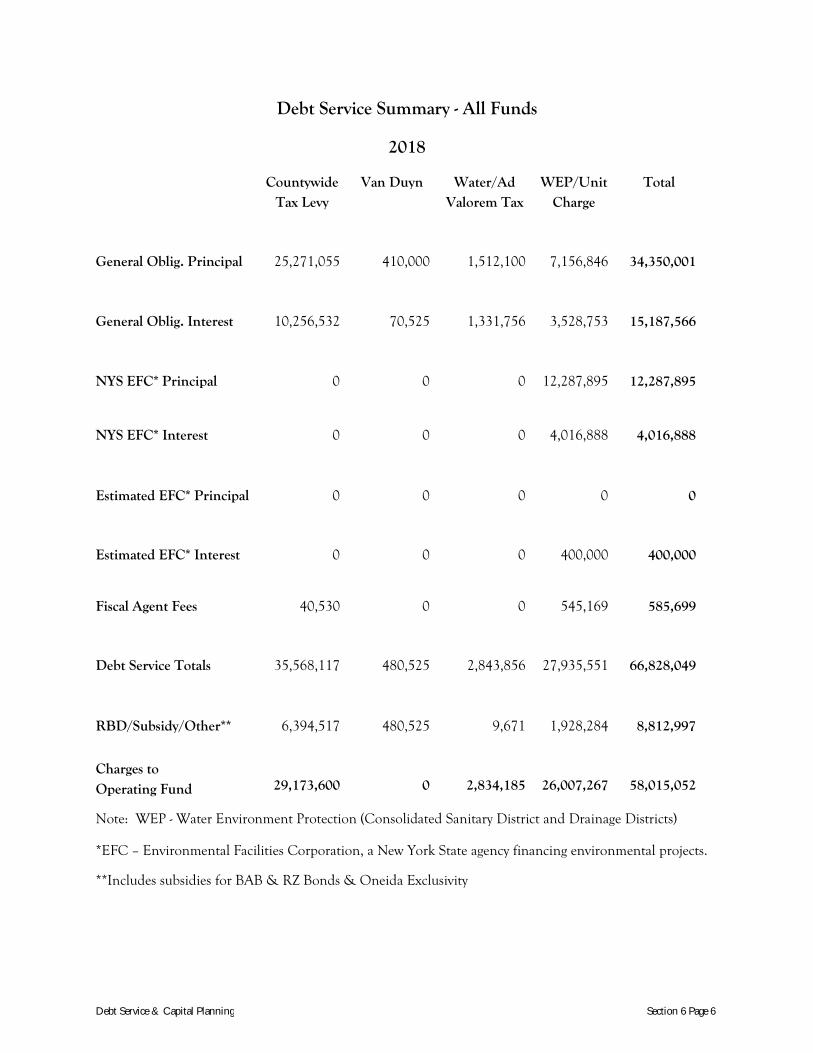
Debt Service Summary - All Funds
2018
Countywide
Tax Levy
Van Duyn Water/Ad
Valorem Tax
WEP/Unit
Charge
Total
General Oblig. Principal 25,271,055 410,000 1,512,100 7,156,846 34,350,001
General Oblig. Interest 10,256,532 70,525 1,331,756 3,528,753 15,187,566
NYS EFC* Principal 0 0 0 12,287,895 12,287,895
NYS EFC* Interest 0 0 0 4,016,888 4,016,888
Estimated EFC* Principal 0 0 0 0 0
Estimated EFC* Interest 0 0 0 400,000 400,000
Fiscal Agent Fees 40,530 0 0 545,169 585,699
Debt Service Totals 35,568,117 480,525 2,843,856 27,935,551 66,828,049
RBD/Subsidy/Other** 6,394,517 480,525 9,671 1,928,284 8,812,997
Charges to
Operating Fund 29,173,600 0 2,834,185 26,007,267 58,015,052
Note: WEP - Water Environment Protection (Consolidated Sanitary District and Drainage Districts)
*EFC – Environmental Facilities Corporation, a New York State agency financing environmental projects.
**Includes subsidies for BAB & RZ Bonds & Oneida Exclusivity
Debt Service & Capital Planning Section 6 Page 6

Debt Service Summary - Countywide Debt Service
2018
General Obligation Fiscal Agent Fees
Debt Service Totals
RBD/ Fed Subsidy
Other Sources
Charge to Operating
Fund Department/Fund Principal Interest
Office of Environment 181,000 32,975 0 213,975 32,975 181,000
Board of Elections 48,019 6,670 0 54,689 0 54,689
Community College 2,590,054 1,411,557 0 4,001,611 195,429 3,806,182
OnCenter Complex 834,180 499,195 40,000 1,373,375 131,737 1,241,638
Information Technology 1,581,478 300,406 0 1,881,884 78,658 1,803,226
Facilities 3,767,960 1,290,816 530 5,059,306 349,408 4,709,898
Correction 110,082 63,298 0 173,380 10,000 163,380
Sheriff/Jail 250,000 6,250 0 256,250 0 256,250
Children & Family Services 304,663 126,898 0 431,561 0 431,561
Parks & Recreation 2,725,215 2,606,980 0 5,332,195 3,246,919 2,085,276
Library 570,012 244,978 0 814,990 364,480 450,510
Transportation 8,517,149 3,117,627 0 11,634,776 1,887,849 9,746,927
Emergency Services 3,791,243 548,882 0 4,340,125 97,062 4,243,063
TOTALS 25,271,055 10,256,532 40,530 35,568,117 6,394,517 29,173,600
Debt Service & Capital Planning Section 6 Page 7

Debt Service Summary - Special Districts
2018
Van
Duyn 1
Water
District
Consol.
San Dist
Meadow
brook
DD
Bear
Trap
DD
Bloody
Brook
DD
Harbor
Brook
DD Total
General Oblig. Principal 410,000 1,512,100 6,564,731 386,115 14,000 67,000 125,000 9,078,946
General Oblig. Interest 70,525 1,331,756 3,387,745 84,366 15,597 22,681 18,364 4,931,034
NYS EFC* Principal 0 0 12,287,895 0 0 0 0 12,287,895
NYS EFC* Interest 0 0 4,016,888 0 0 0 0 4,016,888
Estimated EFC* Principal 0 0 0 0 0 0 0 0
Estimated EFC* Interest 0 0 400,000 0 0 0 0 400,000
Fiscal Agent Fees 0 0 545,169 0 0 0 0 545,169
Debt Service Totals 480,525 2,843,856 27,202,428 470,481 29,597 89,681 143,364 31,259,932
RBD/Fed 2 Subsidy/ Other 480,525 9,671 1,928,284 0 0 0 0 2,418,480
Charges to Operating Fund 0 2,834,185 25,274,144 470,481 29,597 89,681 143,364 28,841,452
1 Van Duyn debt will be paid with proceeds of Van Duyn's sale
2 Includes Reserves for Bonded Debt, and BAB & RZ Subsidies
Debt Service & Capital Planning Section 6 Page 8

County Indebtedness
Authorized and Unissued
As of September 6, 2017
Department Authorized and Unissued
Office of Environment 750,000
Facilities 6,118,422
Parks & Recreation 2,412,699
County Clerk 600,000
Children and Family Services 253,000
Transportation 13,137,500
Emergency Services 1,091,852
Sheriff 100,000
Community College 2,800,000
Water Environment Protection 138,895,510
Total 166,908,983
Debt Service & Capital Planning Section 6 Page 9

Serial Bonds 2018 Debt Service
Interest
Rate*
Amount
Issued
Initial
Interest
Balance (P)
12/31/2018 Title of Bond
Final
Maturity
2018
Principal
2018
Interest
N.Y.S. E.F.C. Bonds 1998* 2018 2.996% 6,030,821 3,386,630 360,000 2,971 0
N.Y.S. E.F.C. Bonds 2000* 2020 2.996% 1,383,178 881,653 80,000 3,628 160,000
N.Y.S. E.F.C. Bonds 2001A* 2020 2.996% 9,078,380 4,562,877 515,000 28,169 1,060,000
N.Y.S. E.F.C. Bonds 2001B* 2021 2.306% 2,195,433 1,108,934 120,000 6,642 365,000
N.Y.S. E.F.C. Bonds 2002A* 2021 4.522% 1,980,745 1,980,745 101,180 4,236 327,948
N.Y.S. E.F.C. Bonds 2002G* 2028 1.306% 14,681,217 5,432,687 630,000 120,905 5,770,000
N.Y.S. E.F.C. Bonds 2003A* 2022 4.311% 1,128,465 1,583,722 60,000 1,128 240,000
N.Y.S. E.F.C. Bonds 2003F* 2023 3.823% 4,657,961 1,868,010 255,000 19,588 1,330,000
N.Y.S. E.F.C. Bonds 2004D* 2024 4.493% 9,579,475 4,760,948 505,000 50,526 3,245,000
N.Y.S. E.F.C. Bonds 2005A* 2024 3.888% 17,469,284 7,080,442 935,000 56,697 5,995,000
N.Y.S. E.F.C. Bonds 2005B* 2025 3.689% 5,495,439 2,218,182 285,000 45,928 2,170,000
N.Y.S. E.F.C. Bonds 2006C* 2036 4.960% 44,610,657 44,610,657 1,450,000 732,035 28,580,000
N.Y.S. E.F.C. Bonds 2007D* 2036 4.180% 41,442,558 26,106,369 1,615,000 471,517 24,490,000
N.Y.S. E.F.C. Bonds 2008A&B* 2028 4.270% 1,645,373 801,562 80,000 20,923 900,000
General Obligation Bonds 2009A 2029 3.738% 61,725,000 13,881,162 4,875,000 294,500 4,925,000
GO Refund Bonds 2009 2023 2.400% 33,345,000 8,234,590 2,105,000 296,056 6,845,000
N.Y.S. E.F.C. Bonds 2010C* 2030 2.412% 2,972,800 1,150,144 135,000 35,868 1,840,000
General Obligation Bonds 2010A 2019 2.093% 31,150,000 7,611,076 3,050,000 226,250 3,000,000
GO Bonds 2010B (BAB's) 2026 4.761% 17,570,000 10,532,039 0 828,406 17,570,000
GO Bonds 2010B (RZ's) 2030 5.709% 4,905,000 7,021,077 0 282,352 4,905,000
N.Y.S. E.F.C. Bonds 2011C* 2031 1.753% 15,603,494 6,787,783 720,000 205,405 10,905,000
General Obligation Bonds 2011 2030 3.006% 33,755,000 11,688,907 2,525,000 164,125 2,525,000
N.Y.S. E.F.C. Bonds 2012B* 2034 1.015% 11,395,171 4,410,561 475,000 138,035 9,105,000
General Obligation Bonds 2012 2037 2.699% 51,425,000 17,994,687 2,900,000 1,347,875 35,350,000
GO Refund Bonds 2012 2025 2.511% 20,615,000 3,844,196 2,355,000 301,913 5,925,000
N.Y.S. E.F.C. Bonds 2012E* 2032 0.779% 4,100,953 1,238,401 185,000 41,830 3,045,000
General Obligation Bonds 2013 2033 3.169% 67,870,000 30,461,070 5,500,000 2,467,500 47,925,000
N.Y.S. E.F.C. Bonds 2014D* 2044 0.622% 128,800,968 79,460,686 3,620,000 1,993,826 114,675,000
General Obligation Bonds 2014 2034 2.632% 34,800,000 12,060,823 2,225,000 713,875 26,600,000
GO Refund Bonds 2014 2036 2.194% 19,600,000 5,951,257 2,900,000 1,169,938 14,515,000
General Obligation Bonds 2015 2045 3.433% 79,900,000 46,215,073 2,430,000 2,998,581 75,105,000
GO Refund Bonds 2015 2027 2.215% 11,370,000 3,592,519 1,295,000 461,625 10,065,000
QECB 2015 2025 3.500% 2,650,000 1,041,161 265,000 104,145 1,855,000
General Obligation Bonds 2016 2036 2.080% 26,500,000 7,770,442 1,920,000 911,731 24,580,000
GO Refund Bonds 2016 2030 1.719% 35,885,000 10,716,026 5,001 1,543,694 35,555,000
General Obligation Bonds 2017 2037 2.762% 21,780,000 8,219,576 0 1,075,001 21,780,000
N.Y.S. E.F.C Bonds 2037 2.479% 3,886,715 524,856 161,715 37,030 3,570,000
TOTAL: 882,984,087 406,791,530 46,637,896 19,204,454 556,797,948
*Interest Rates for General Obligation Bonds are based on the True Interest Costs, while rates for EFC Loans are
based on the budget year coupon per maturity
Debt Service & Capital Planning Section 6 Page 10

Serial Bonds 2018 Debt Service by Department
Year Final Interest 2018 Serial Bond Payments
No. Issued Maturity Rate Principal Interest Total
Office of Environment
General Obligation Bonds 830 2016 2036 2.08% 181,000 32,975 213,975
Total: Office of Environment
181,000 32,975 213,975
Board of Elections
General Obligation Bonds 770 2011 2030 5.00% 48,000 3,120 51,120
General Obligation Refunding Bonds 831 2016 2030 1.00% 19 3,550 3,569
Total: Board of Elections 48,019 6,670 54,689
Onondaga Community College
General Obligation Bonds, Series A 740 2009 2029 3.74% 295,000 17,700 312,700
General Obligation Bonds, Series A 760 2010 2019 2.09% 330,000 25,250 355,250
GO Bonds, Series B (Bab's) 761 2010 2026 4.76% 0 134,344 134,344
GO Bonds, Series B (Rz's) 762 2010 2030 5.71% 0 107,924 107,924
General Obligation Bonds 770 2011 2030 3.01% 362,000 23,450 385,450
General Obligation Bonds 780 2012 2030 2.70% 68,000 36,760 104,760
General Obligation Refunding Bonds 790 2012 2025 2.51% 147,000 50,253 197,253
General Obligation Bonds 800 2013 2033 3.17% 540,000 258,250 798,250
General Obligation Bonds 810 2014 2034 2.63% 115,000 37,325 152,325
General Obligation Refunding Bonds 811 2014 2026 2.19% 223,400 96,010 319,410
General Obligation Bonds 820 2015 2045 3.43% 1,900 1,689 3,589
General Obligation Refunding Bonds 821 2015 2027 2.22% 297,370 99,519 396,889
General Obligation Bonds 830 2016 2036 2.08% 210,000 160,001 370,001
General Obligation Refunding Bonds 831 2016 2033 1.00% 384 316,024 316,408
General Obligation Bonds 840 2017 2037 0.00% 0 47,058 47,058
Total: Community College
2,590,054 1,411,557 4,001,611
Correction
General Obligation Bonds, Series A 740 2009 2029 3.74% 100,000 6,000 106,000
General Obligation Bonds 800 2013 2033 3.17% 10,000 250 10,250
General Obligation Refunding Bonds 831 2016 2030 1.00% 82 57,048 57,130
Total: Corrections 110,082 63,298 173,380
Debt Service & Capital Planning Section 6 Page 11

Serial Bonds 2018 Debt Service by Department
Year Final Interest 2018 Serial Bond Payments
No. Issued Maturity Rate Principal Interest Total
OnCenter Complex
General Obligation Bonds, Series A 740 2009 2029 3.74% 409,000 26,140 435,140
General Obligation Bonds, Series A 760 2010 2019 2.09% 135,000 10,625 145,625
GO Bonds, Series B (Bab's) 761 2010 2026 4.76% 0 52,535 52,535
GO Bonds, Series B (Rz's) 762 2010 2030 5.71% 0 39,143 39,143
General Obligation Bonds 770 2011 2030 3.01% 50,000 3,250 53,250
General Obligation Bonds 780 2012 2024 2.70% 18,000 6,500 24,500
General Obligation Refunding Bonds 790 2012 2024 2.51% 75,000 15,995 90,995
General Obligation Bonds 800 2013 2033 3.17% 50,000 40,850 90,850
General Obligation Bonds 820 2015 2045 3.43% 20,900 18,888 39,788
General Obligation Bonds 830 2016 2036 2.08% 75,924 57,173 133,097
General Obligation Refunding Bonds 831 2016 2030 0.00% 356 228,096 228,452
Total: OnCenter Complex
834,180 499,195 1,333,375
Information Technology
General Obligation Bonds 770 2011 2030 3.01% 450,000 29,250 479,250
General Obligation Bonds 780 2012 2021 2.70% 500,000 90,500 590,500
General Obligation Bonds 800 2013 2033 3.17% 590,000 108,000 698,000
General Obligation Bonds 820 2015 2045 3.43% 41,300 37,358 78,658
General Obligation Refunding Bonds 831 2016 2030 0.00% 178 35,298 35,476
Total: Information Technology 1,581,478 300,406 1,881,884
Facilities Management
General Obligation Bonds, Series A 740 2009 2029 3.74% 181,000 10,860 191,860
General Obligation Refunding Bonds 750 2009 2023 2.40% 1,744,000 261,306 2,005,306
General Obligation Bonds 780 2012 2032 2.70% 300,000 206,950 506,950
General Obligation Refunding Bonds 790 2012 2025 2.51% 270,000 40,218 310,218
General Obligation Bonds 800 2013 2033 3.17% 290,000 104,550 394,550
General Obligation Bonds 810 2014 2034 2.63% 370,000 254,313 624,313
General Obligation Refunding Bonds 811 2014 2026 2.19% 166,400 64,535 230,935
General Obligation Bonds 820 2015 2045 3.43% 66,300 59,324 125,624
General Obligation Refunding Bonds 821 2015 2027 2.22% 115,111 41,137 156,248
QECB 822 2015 2025 3.50% 265,000 104,145 369,145
General Obligation Refunding Bonds 831 2016 2030 0.00% 149 56,113 56,262
General Obligation Bonds 840 2017 2037 0.00% 0 87,365 87,365
Total: Facilities 3,767,960 1,290,816 5,058,776
Debt Service & Capital Planning Section 6 Page 12

Serial Bonds 2018 Debt Service by Department
Year Final Interest 2018 Serial Bond Payments
No. Issued Maturity Rate Principal Interest Total
Sheriff
General Obligation Bonds 800 2013 2033 3.17% 210,000 5,250 215,250
General Obligation Refunding Bonds 811 2014 2026 2.19% 40,000 1,000 41,000
Total: Sheriff/Jail 250,000 6,250 256,250
Children and Family Services
General Obligation Refunding Bonds 811 2014 2026 2.19% 256,700 105,445 362,145
General Obligation Refunding Bonds 821 2015 2027 2.22% 47,963 21,453 69,416
Total: Children and Family Services 304,663 126,898 431,561
Parks & Recreation
General Obligation Bonds, Series A 740 2009 2029 3.74% 80,000 4,800 84,800
General Obligation Bonds, Series A 760 2010 2019 2.09% 320,000 24,250 344,250
GO Bonds, Series B (Bab's) 761 2010 2026 4.76% 0 93,669 93,669
GO Bonds, Series B (Rz's) 762 2010 2030 5.71% 0 41,445 41,445
General Obligation Bonds 770 2011 2030 3.01% 375,000 24,375 399,375
General Obligation Bonds 780 2012 2027 2.70% 217,000 98,260 315,260
General Obligation Bonds 800 2013 2033 3.17% 300,000 177,500 477,500
General Obligation Bonds 810 2014 2034 2.63% 120,000 62,050 182,050
General Obligation Bonds 820 2015 2045 3.43% 1,160,000 1,849,963 3,009,963
General Obligation Bonds 830 2016 2036 2.08% 153,000 115,865 268,865
General Obligation Refunding Bonds 831 2016 2030 0.00% 215 77,391 77,606
General Obligation Bonds 840 2017 2037 0.00% 0 37,412 37,412
Total: Parks & Recreation 2,725,215 2,606,980 5,332,195
Library
General Obligation Bonds 770 2011 2030 3.01% 30,000 1,950 31,950
General Obligation Bonds 780 2012 2020 2.70% 265,000 32,750 297,750
General Obligation Bonds 800 2013 2033 2.17% 170,000 114,650 284,650
General Obligation Bonds 820 2015 2045 3.43% 105,000 94,481 199,481
General Obligation Refunding Bonds 831 2016 2030 0.00% 12 1,148 1,160
Total: Library 570,012 244,979 814,991
Debt Service & Capital Planning Section 6 Page 13
Serial Bonds 2018 Debt Service by Department
Year Final Interest 2018 Serial Bond Payments
No. Issued Maturity Rate Principal Interest Total
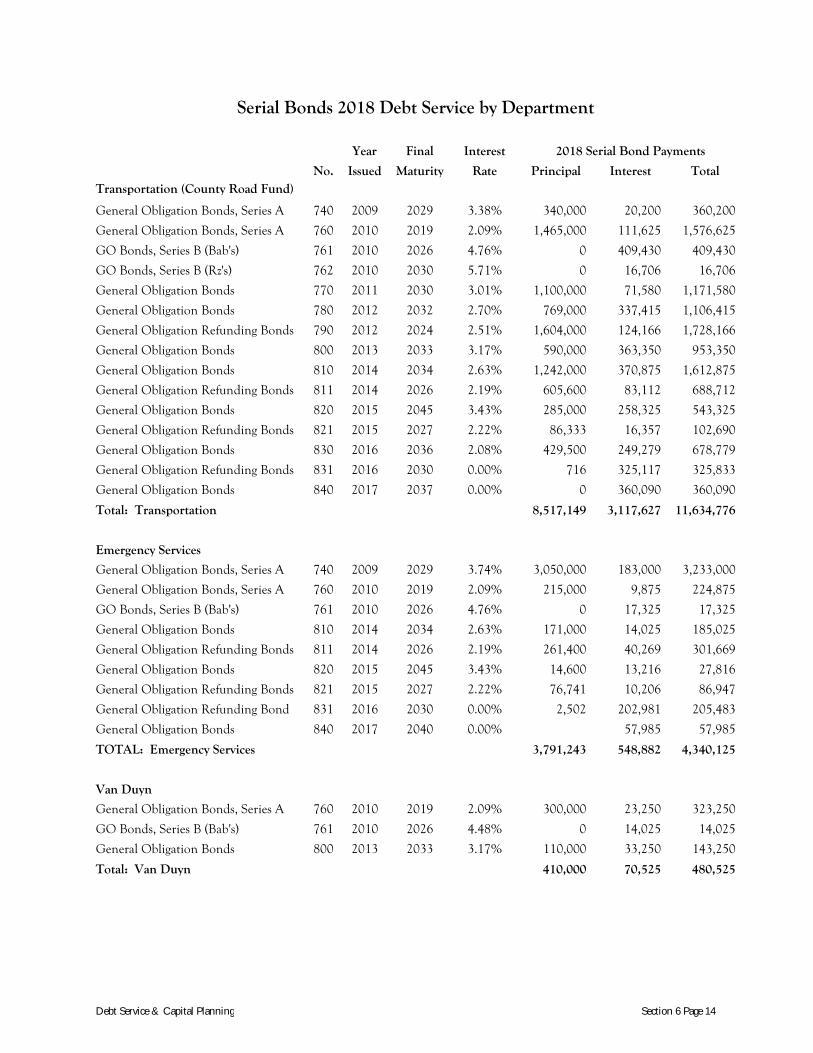
Transportation (County Road Fund)
General Obligation Bonds, Series A 740 2009 2029 3.38% 340,000 20,200 360,200
General Obligation Bonds, Series A 760 2010 2019 2.09% 1,465,000 111,625 1,576,625
GO Bonds, Series B (Bab's) 761 2010 2026 4.76% 0 409,430 409,430
GO Bonds, Series B (Rz's) 762 2010 2030 5.71% 0 16,706 16,706
General Obligation Bonds 770 2011 2030 3.01% 1,100,000 71,580 1,171,580
General Obligation Bonds 780 2012 2032 2.70% 769,000 337,415 1,106,415
General Obligation Refunding Bonds 790 2012 2024 2.51% 1,604,000 124,166 1,728,166
General Obligation Bonds 800 2013 2033 3.17% 590,000 363,350 953,350
General Obligation Bonds 810 2014 2034 2.63% 1,242,000 370,875 1,612,875
General Obligation Refunding Bonds 811 2014 2026 2.19% 605,600 83,112 688,712
General Obligation Bonds 820 2015 2045 3.43% 285,000 258,325 543,325
General Obligation Refunding Bonds 821 2015 2027 2.22% 86,333 16,357 102,690
General Obligation Bonds 830 2016 2036 2.08% 429,500 249,279 678,779
General Obligation Refunding Bonds 831 2016 2030 0.00% 716 325,117 325,833
General Obligation Bonds 840 2017 2037 0.00% 0 360,090 360,090
Total: Transportation 8,517,149 3,117,627 11,634,776
Emergency Services
General Obligation Bonds, Series A 740 2009 2029 3.74% 3,050,000 183,000 3,233,000
General Obligation Bonds, Series A 760 2010 2019 2.09% 215,000 9,875 224,875
GO Bonds, Series B (Bab's) 761 2010 2026 4.76% 0 17,325 17,325
General Obligation Bonds 810 2014 2034 2.63% 171,000 14,025 185,025
General Obligation Refunding Bonds 811 2014 2026 2.19% 261,400 40,269 301,669
General Obligation Bonds 820 2015 2045 3.43% 14,600 13,216 27,816
General Obligation Refunding Bonds 821 2015 2027 2.22% 76,741 10,206 86,947
General Obligation Refunding Bond 831 2016 2030 0.00% 2,502 202,981 205,483
General Obligation Bonds 840 2017 2040 0.00%
57,985 57,985
TOTAL: Emergency Services 3,791,243 548,882 4,340,125
Van Duyn
General Obligation Bonds, Series A 760 2010 2019 2.09% 300,000 23,250 323,250
GO Bonds, Series B (Bab's) 761 2010 2026 4.48% 0 14,025 14,025
General Obligation Bonds 800 2013 2033 3.17% 110,000 33,250 143,250
Total: Van Duyn 410,000 70,525 480,525
Debt Service & Capital Planning Section 6 Page 14
Serial Bonds 2018 Debt Service by Department
Year Final Interest 2018 Serial Bond Payments
No. Issued Maturity Rate Principal Interest Total
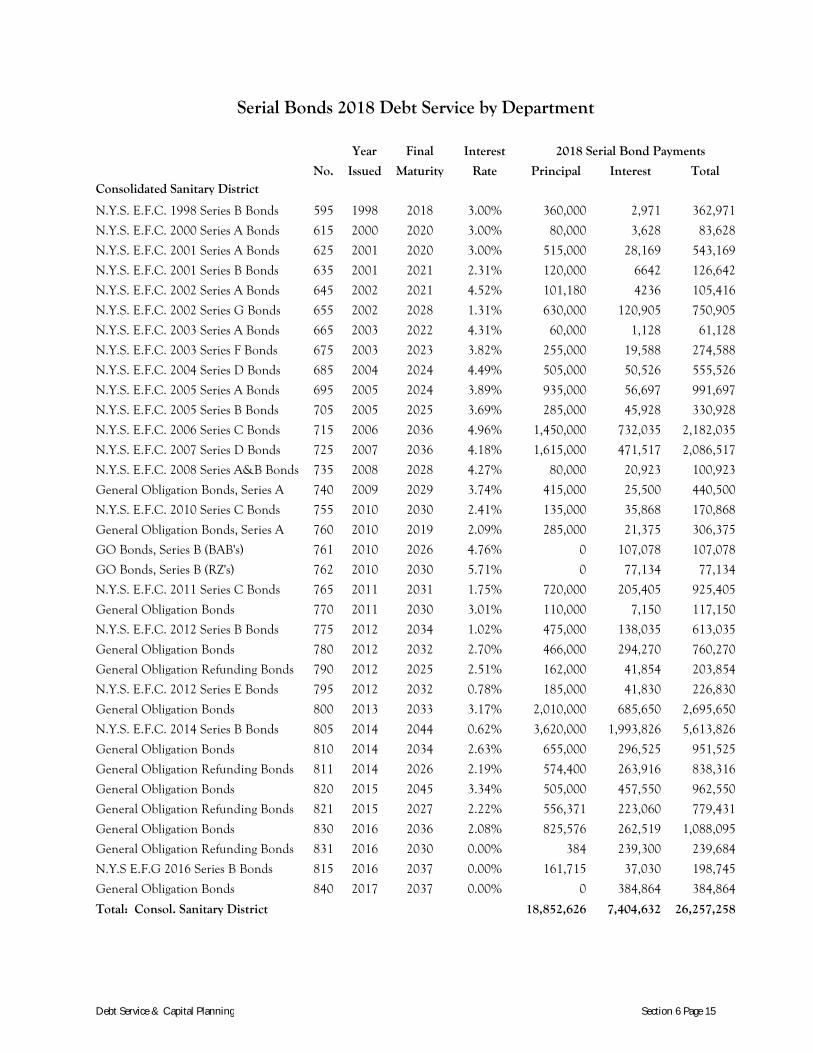
Consolidated Sanitary District
N.Y.S. E.F.C. 1998 Series B Bonds 595 1998 2018 3.00% 360,000 2,971 362,971
N.Y.S. E.F.C. 2000 Series A Bonds 615 2000 2020 3.00% 80,000 3,628 83,628
N.Y.S. E.F.C. 2001 Series A Bonds 625 2001 2020 3.00% 515,000 28,169 543,169
N.Y.S. E.F.C. 2001 Series B Bonds 635 2001 2021 2.31% 120,000 6642 126,642
N.Y.S. E.F.C. 2002 Series A Bonds 645 2002 2021 4.52% 101,180 4236 105,416
N.Y.S. E.F.C. 2002 Series G Bonds 655 2002 2028 1.31% 630,000 120,905 750,905
N.Y.S. E.F.C. 2003 Series A Bonds 665 2003 2022 4.31% 60,000 1,128 61,128
N.Y.S. E.F.C. 2003 Series F Bonds 675 2003 2023 3.82% 255,000 19,588 274,588
N.Y.S. E.F.C. 2004 Series D Bonds 685 2004 2024 4.49% 505,000 50,526 555,526
N.Y.S. E.F.C. 2005 Series A Bonds 695 2005 2024 3.89% 935,000 56,697 991,697
N.Y.S. E.F.C. 2005 Series B Bonds 705 2005 2025 3.69% 285,000 45,928 330,928
N.Y.S. E.F.C. 2006 Series C Bonds 715 2006 2036 4.96% 1,450,000 732,035 2,182,035
N.Y.S. E.F.C. 2007 Series D Bonds 725 2007 2036 4.18% 1,615,000 471,517 2,086,517
N.Y.S. E.F.C. 2008 Series A&B Bonds 735 2008 2028 4.27% 80,000 20,923 100,923
General Obligation Bonds, Series A 740 2009 2029 3.74% 415,000 25,500 440,500
N.Y.S. E.F.C. 2010 Series C Bonds 755 2010 2030 2.41% 135,000 35,868 170,868
General Obligation Bonds, Series A 760 2010 2019 2.09% 285,000 21,375 306,375
GO Bonds, Series B (BAB's) 761 2010 2026 4.76% 0 107,078 107,078
GO Bonds, Series B (RZ's) 762 2010 2030 5.71% 0 77,134 77,134
N.Y.S. E.F.C. 2011 Series C Bonds 765 2011 2031 1.75% 720,000 205,405 925,405
General Obligation Bonds 770 2011 2030 3.01% 110,000 7,150 117,150
N.Y.S. E.F.C. 2012 Series B Bonds 775 2012 2034 1.02% 475,000 138,035 613,035
General Obligation Bonds 780 2012 2032 2.70% 466,000 294,270 760,270
General Obligation Refunding Bonds 790 2012 2025 2.51% 162,000 41,854 203,854
N.Y.S. E.F.C. 2012 Series E Bonds 795 2012 2032 0.78% 185,000 41,830 226,830
General Obligation Bonds 800 2013 2033 3.17% 2,010,000 685,650 2,695,650
N.Y.S. E.F.C. 2014 Series B Bonds 805 2014 2044 0.62% 3,620,000 1,993,826 5,613,826
General Obligation Bonds 810 2014 2034 2.63% 655,000 296,525 951,525
General Obligation Refunding Bonds 811 2014 2026 2.19% 574,400 263,916 838,316
General Obligation Bonds 820 2015 2045 3.34% 505,000 457,550 962,550
General Obligation Refunding Bonds 821 2015 2027 2.22% 556,371 223,060 779,431
General Obligation Bonds 830 2016 2036 2.08% 825,576 262,519 1,088,095
General Obligation Refunding Bonds 831 2016 2030 0.00% 384 239,300 239,684
N.Y.S E.F.G 2016 Series B Bonds 815 2016 2037 0.00% 161,715 37,030 198,745
General Obligation Bonds 840 2017 2037 0.00% 0 384,864 384,864
Total: Consol. Sanitary District
18,852,626 7,404,632 26,257,258
Debt Service & Capital Planning Section 6 Page 15
Serial Bonds 2018 Debt Service by Department
Year Final Interest 2018 Serial Bond Payments
No. Issued Maturity Rate Principal Interest Total
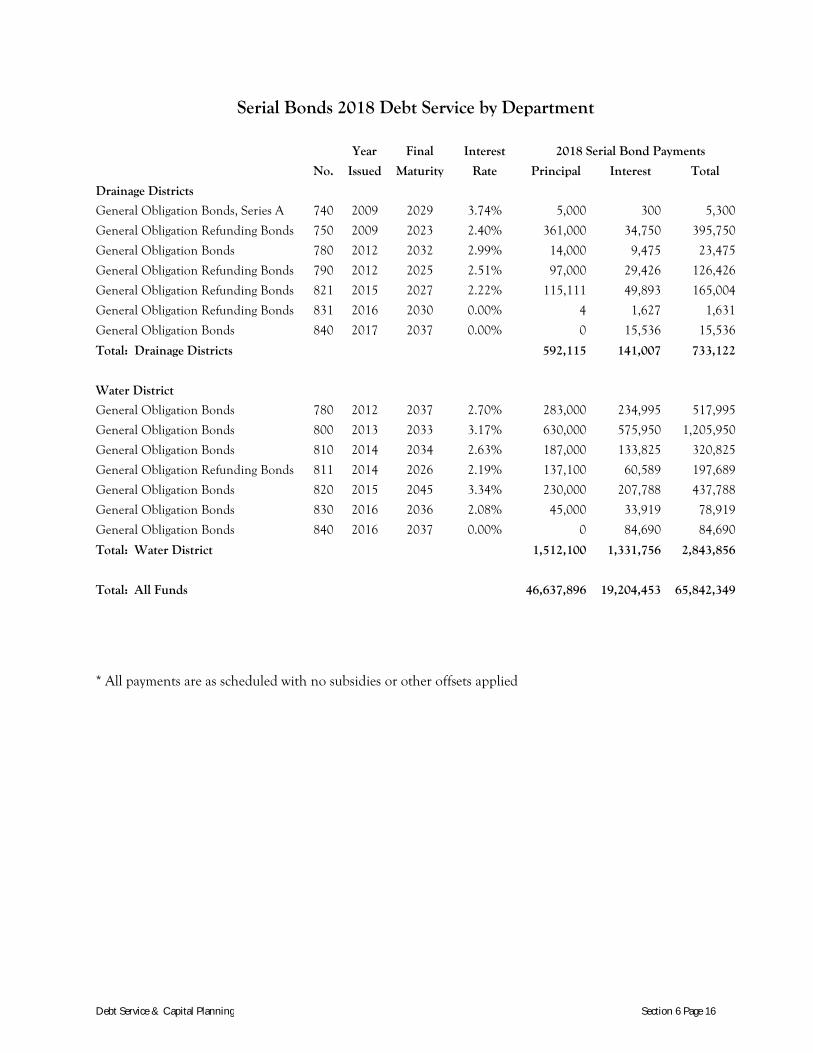
Drainage Districts
General Obligation Bonds, Series A 740 2009 2029 3.74% 5,000 300 5,300
General Obligation Refunding Bonds 750 2009 2023 2.40% 361,000 34,750 395,750
General Obligation Bonds 780 2012 2032 2.99% 14,000 9,475 23,475
General Obligation Refunding Bonds 790 2012 2025 2.51% 97,000 29,426 126,426
General Obligation Refunding Bonds 821 2015 2027 2.22% 115,111 49,893 165,004
General Obligation Refunding Bonds 831 2016 2030 0.00% 4 1,627 1,631
General Obligation Bonds 840 2017 2037 0.00% 0 15,536 15,536
Total: Drainage Districts 592,115 141,007 733,122
Water District
General Obligation Bonds 780 2012 2037 2.70% 283,000 234,995 517,995
General Obligation Bonds 800 2013 2033 3.17% 630,000 575,950 1,205,950
General Obligation Bonds 810 2014 2034 2.63% 187,000 133,825 320,825
General Obligation Refunding Bonds 811 2014 2026 2.19% 137,100 60,589 197,689
General Obligation Bonds 820 2015 2045 3.34% 230,000 207,788 437,788
General Obligation Bonds 830 2016 2036 2.08% 45,000 33,919 78,919
General Obligation Bonds 840 2016 2037 0.00% 0 84,690 84,690
Total: Water District 1,512,100 1,331,756 2,843,856
Total: All Funds 46,637,896 19,204,453 65,842,349
* All payments are as scheduled with no subsidies or other offsets applied
Debt Service & Capital Planning Section 6 Page 16
Capital Planning
The Capital Process
The Capital Improvement Plan (CIP) serves as a mechanism for defining and prioritizing capital projects that are necessary to maintain the high standard of living that County residents have come to expect. Throughout the CIP, 3 spending priorities emerge: environmental protection, economic development, and operational efficiency.
Capital planning involves the County Executive, members of the County Legislature, heads of various County departments, and a citizen advisory board in a process that determines capital needs, alternatives, and priorities. The development of the Capital Improvement Plan takes place over several months, beginning in March of each year, and includes 5 major phases:
1. In March, department heads begin preparation of project proposals in accordance with executive guidelines.
2. In May, proposals are submitted to the CIP Coordinator at Department of Facilities Management . The proposals are analyzed by CIP Coordinator in conjunction in conjunction with County Executive’s Office, various departments, the Syracuse-Onondaga County Planning Agency and the Department of Finance. The Law Department is consulted as needed.
3. By September, a tentative CIP is approved by the County Executive and then presented to the Capital Planning Committee (a committee made up of legislators and representatives from the executive branch of County government)
4. In September, the Tentative Capital Improvement Plan is presented with the County's Annual Operating Budget to the Ways & Means Committee of the County Legislature and then to the full Legislature in October for approval. In the same month the CIP is presented to the County Planning Board (a citizen advisory group).
5. From October to March, research on capital planning and management is conducted, and the prior year's process is revised for improvement.
Coordination and interaction among units of government occurs throughout the process, both formally and informally. The heads of County departments are consulted to discuss questions and recommendations regarding particular projects. Some of the major criteria for evaluating proposals are:
1. Consistency with the stated goals of the County Executive
2. Degree of the overall need for the project
3. Fiscal impact, including the County's capacity to borrow
4. Non-County funding sources
5. Community participation and support
The final product of this process is a 6-year plan to improve those facilities or components of County infrastructure considered necessary to provide or maintain an adequate level of public service.
Debt Service & Capital Planning Section 6 Page 17

Approval by the County Legislature is not a commitment to fund every project in the plan, but rather it is an indication of support for the plan as a whole. Projects, which require borrowing, must be presented to the Legislature individually in order to secure authorization to borrow funds.
The 2010 Development Guide
In 1991, the Onondaga County Legislature adopted the 2010 Development Guide to outline county policy with respect to infrastructure, land development, the environment, and fiscal capacity. The Guide was updated with current demographic and economic data, better graphics, and a more concise, understandable format. The updated Guide was approved by the County Legislature on June 1, 1998, and is now the official Onondaga County plan. The County is currently working on an update to the Guide.
New water lines, sewers, and roads have the effect of creating new developable land. The Guide seeks to prevent premature public expenditures, which foster urban sprawl and create unnecessary capital and operating expenses. The Guide stresses the desirability of infill development in areas served by utilities, in order to balance trends toward sprawl with the ability of a static population to pay for infrastructure. Decisions to extend utilities to provide new urban land will be related to economic growth and job creation, as well as the capacity of complementary infrastructure systems to support growth in a particular location.
Project Criteria
As a matter of policy, capital requests are not considered for the Capital Improvement Plan if: 1) the total cost of the project is less than $250,000; 2) the probable useful life (PPU) is less than 5 years; 3) the request involves the procurement of light or heavy vehicles. These must be funded through the operating budget and are excluded from the Capital Improvement Plan.
A Brief Summary
In addition to projects, which have been authorized by the County Legislature, the 2018-2023 Capital Improvement Plan (CIP) includes 49 County Wide projects and 9 projects in the Sewer Fund. All 58 projects recommended for inclusion in the 6-year plan estimate total spending at $446,684,000.
Total funds for the recommended County-wide project, for 6 years, are $255,855,000 of which $66,630,000 will be pay-as-you-go and $118,272,000 will be debt. The rest is State and Federal Aid. The Sewer Funds projects are expected to cost $190,829,000, of which $34,305,000 will be pay-as-you-go and $156,524,000 will be debt.
Impact on the Operating Budget
Capital projects can affect the operating budget in several ways. First, when funds are borrowed, annual principal and interest payments to retire the debt must be made. The County’s budget to pay scheduled debt payments is presented in the Annual Budget as Debt Service (Debt Service Fund). Additionally, scheduled debt service payments are summarized by department and fund, as well as specified by individual borrowing, in the Debt Service Fund section.
As an alternative to assuming debt, some capital projects are funded on a “pay-as-you-go” basis through departmental operating budgets. Most engineering studies are funded in this manner. Finally, operating costs associated with a project, such as utilities and maintenance, may cause a change in departmental budgets. The impact of these anticipated changes is calculated during the operating budget process as well
Debt Service & Capital Planning Section 6 Page 18
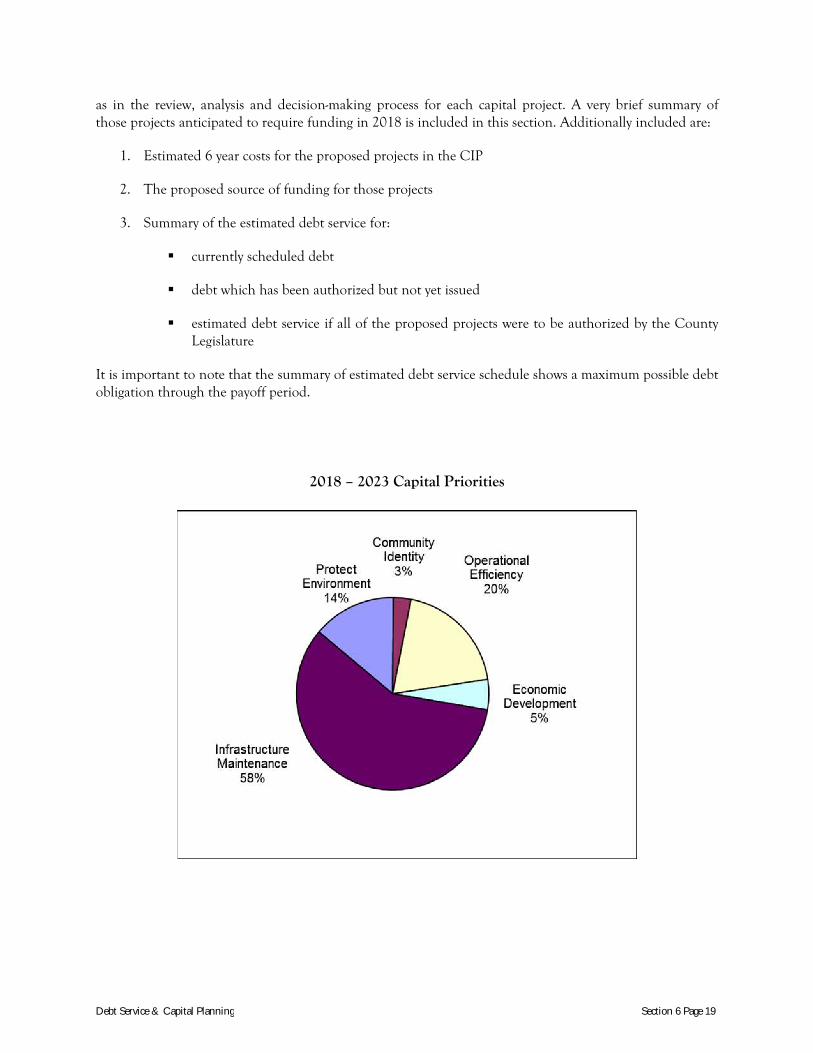
as in the review, analysis and decision-making process for each capital project. A very brief summary of those projects anticipated to require funding in 2018 is included in this section. Additionally included are:
1. Estimated 6 year costs for the proposed projects in the CIP
2. The proposed source of funding for those projects
3. Summary of the estimated debt service for:
currently scheduled debt
debt which has been authorized but not yet issued
estimated debt service if all of the proposed projects were to be authorized by the County Legislature
It is important to note that the summary of estimated debt service schedule shows a maximum possible debt obligation through the payoff period.
2018 – 2023 Capital Priorities
Debt Service & Capital Planning Section 6 Page 19
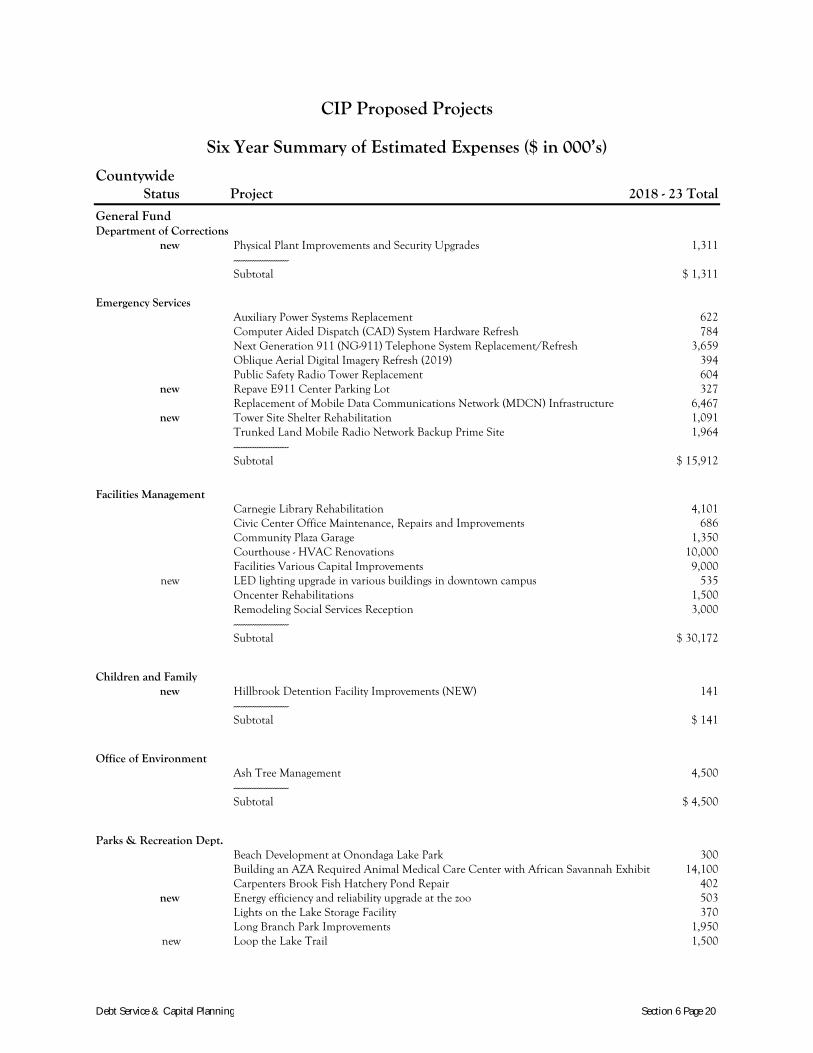
CIP Proposed Projects
Six Year Summary of Estimated Expenses ($ in 000’s)
Countywide Status Project 2018 - 23 Total
General Fund Department of Corrections new Physical Plant Improvements and Security Upgrades 1,311 ------------------------ Subtotal $ 1,311 Emergency Services Auxiliary Power Systems Replacement 622 Computer Aided Dispatch (CAD) System Hardware Refresh 784 Next Generation 911 (NG-911) Telephone System Replacement/Refresh 3,659 Oblique Aerial Digital Imagery Refresh (2019) 394 Public Safety Radio Tower Replacement 604 new Repave E911 Center Parking Lot 327 Replacement of Mobile Data Communications Network (MDCN) Infrastructure 6,467 new Tower Site Shelter Rehabilitation 1,091 Trunked Land Mobile Radio Network Backup Prime Site 1,964 ------------------------ Subtotal $ 15,912
Facilities Management Carnegie Library Rehabilitation 4,101 Civic Center Office Maintenance, Repairs and Improvements 686 Community Plaza Garage 1,350 Courthouse - HVAC Renovations 10,000 Facilities Various Capital Improvements 9,000 new LED lighting upgrade in various buildings in downtown campus 535 Oncenter Rehabilitations 1,500 Remodeling Social Services Reception 3,000 ------------------------ Subtotal $ 30,172
Children and Family new Hillbrook Detention Facility Improvements (NEW) 141 ------------------------ Subtotal $ 141
Office of Environment Ash Tree Management 4,500 ------------------------ Subtotal $ 4,500
Parks & Recreation Dept. Beach Development at Onondaga Lake Park 300 Building an AZA Required Animal Medical Care Center with African Savannah Exhibit 14,100 Carpenters Brook Fish Hatchery Pond Repair 402 new Energy efficiency and reliability upgrade at the zoo 503 Lights on the Lake Storage Facility 370 Long Branch Park Improvements 1,950 new Loop the Lake Trail 1,500
Debt Service & Capital Planning Section 6 Page 20

CIP Proposed Projects
Six Year Summary of Estimated Expenses ($ in 000’s)
Countywide Status Project 2018 - 23 Total
Park Buildings 757 Park Improvements/Willow Bay 2,740 Park Roads, Parking Areas, and Trail Paving 3,750 Park Roofs 300 new Playground Improvements 2,000 Salt Museum Rehabilitation 310 ------------------------ Subtotal $ 28,982
Sheriff Police/Civil new Sheriff's New Headquarters Facility 900 ------------------------ Subtotal $ 900
General Fund Total $ 81,918
Library Onondaga Community Public Library new Petit Branch Library addition and improvements 885 ------------------------
Library Total $ 885
Community College Onondaga Community College Allyn Hall Upgrades and Improvements 2,780 Elevator Replacement and Upgrades/ Protection of the Campus E-mail and Phone Servers 646 Infrastructure - Campus Wide 10,488 Site Improvements 2,718 ------------------------
Community College Total $ 16,632
County Road Transportation Bituminous Surface Treatment 12,898 Bridges 11,512 Capital Highway Construction 29,867 Caughdenoy Road / NYS Route 31 Road Improvements 4,120 Cold Mix Bituminous Paving 21,084 Guide Rail 2,720 Rehabilitation of North Area and Camillus Highway Maintenance Facilities 10,000 Repaving Program (Hot Mix Bituminous) 57,439 Testing, Drainage and Facilities Repair 4,774 Traffic Systems Management 1,910 ------------------------
County Road Total $ 156,324
County Wide Total $ 255,759
Debt Service & Capital Planning Section 6 Page 21

CIP Proposed Projects
Six Year Summary of Estimated Expenses ($ in 000’s)
Special Funds Status Project 2018 - 23 Total
Sewer Water Environment Protection Baldwinsville Seneca Knolls WWTP Disinfection and Phase II Asset Renewal Improvements 26,220 Brewerton WWTP Asset Renewal Improvements 10,122 Camillus Force Main Replacement 9,500 Energy Efficiency Improvements/Performance Contracting 26,000 new Ley Creek/Liverpool Force Main Rehabilitation/Replacement Project 17,800 new Metropolitan (Metro ) Wastewater Treatment Plant - Phase II Digester Improvements (New) 16,103 Oak Orchard WWTP Disinfection and Lagoon Cleaning 11,540 Oak Orchard WWTP Secondary Clarifier Rehabilitation 6,200 Wastewater Transportation System Improvements 67,844 ------------------------
Sewer Total $ 191,329
Special Funds Total $ 191,329 Grand Total $ 447,088
Debt Service & Capital Planning Section 6 Page 22

FUNDING SOURCES OF PROPOSED PROJECTS
County Wide 2018 2019 2020 2021 2022 2023 6yr Total
General Fund Pay as You Go 1,000 1,000 1,000 1,000 1,000 5,000 Authorized Borrowing 869 500 1,369 Borrowing to be Authorized 17,431 18,396 11,066 18,949 6,150 2,941 74,933 State Aid 175 91 350 616
SUB TOTALS $18,475 $19,987 $12,416 $19,949 $7,150 $3,941 $81,918
County Road Pay as You Go 294 8,730 10,395 12,223 13,990 15,902 61,534 Borrowing to be Authorized 15,943 6,523 2,500 2,503 2,850 2,850 33,169 Federal Aid 19,200 650 2,400 22,250 State Aid 8,941 5,640 6,090 5,640 5,640 5,640 37,591 Other 1,780 1,780
SUB TOTALS $46,158 $21,543 $21,385 $20,366 $22,480 $24,392 $156,324
Library Borrowing to be Authorized 485 485 State Aid 350 350 Other 50 50
SUB TOTALS $885 $885
Community College Borrowing to be Authorized 1,390 1,682 5,244 8,316 State Aid 1,390 1,682 5,244 8,316
SUB TOTALS $2,780 $3,364 $10,488 $16,632
County Wide TOTALS $64,633 $45,195 $37,165 $50,803 $29,630 $28,333 $255,759
Special Funds 2018 2019 2020 2021 2022 2023 6yr Total
Sewer Pay as You Go 6,735 6,990 5,639 5,214 5,142 5,085 34,805 Authorized Borrowing 9,510 5,995 688 572 155 16,920 Borrowing to be Authorized 10,598 18,248 32,795 36,008 22,105 19,850 139,604
Sewer TOTALS $26,843 $31,233 $39,122 $41,794 $27,402 $24,935 $191,329
GRAND TOTAL $91,476 $76,428 $76,287 $92,597 $57,032 $53,268 $447,088
Debt Service & Capital Planning Section 6 Page 23

CIP Proposed Projects
Summary of 2018 Estimated Expenses
Department/Projects 2018 Cost
Only
($ in 000's)
Corrections
Physical Plant Improvements and Security Upgrades 325
Sub Total 325
Emergency Services
Public Safety Radio Tower Replacement $339
Replacement of Mobile Data Communications Network Infrastructure $6,467
Trunked Land Mobile Radio Network Backup Prime Site $1,964
Sub Total $8,770
Facilities
Civic Center Office Maintenance, Repairs and Improvements $686
Facilities Various Capital Improvements $1,500
OnCenter Rehabilitations $500
Remodeling Social Services Reception $2,000
Sub Total $4,686
Children and Family
Hillbrook Detention Facility Improvements $141
Sub Total $141
Office of Environment
Ash Tree Management $750
Sub Total $750
Parks
Carpenters Brook Fish Hatchery Pond Repair $100
Park Roads, Parking Areas, and Trail Paving $100
Loop the Lake Trail $1,500 Building an AZA Required Animal Medical Care Center with African Savannah Exhibit $500
Energy efficiency and reliability upgrade at the zoo $503
Playground Improvements $200
Sub Total $2,903
Debt Service & Capital Planning Section 6 Page 24

Sheriff Police/Civil
Sheriff's New Headquarters Facility $900
Sub Total $900
DOT
Bituminous Surface Treatment $1,250
Bridges $4,417
Capital Highway Construction $21,114
Cold Mix Bituminous Paving $2,050
Guide Rail $250
Rehabilitation of North Area and Camillus Highway Mtce Facil. $10,000
Repaving Program (Hot Mix Bituminous) $6,173
Testing, Drainage and Facilities Repair $654
Traffic Systems Management $250
Sub Total $46,158
COUNTY WIDE FUNDS TOTAL $64,633
WEP
Baldwinsville Seneca Knolls WWTP Disinfection and Phase II Asset Renewal Improv. $3,021
Camillus Force Main Replacement $3,500
Energy Efficiency Improvements/Performance Contracting $4,500
Ley Creek/Liverpool Force Main Rehabilitation/Replacement Project $500
Oak Orchard Disinfection and Lagoon Cleaning $7,962
Oak Orchard WWTP Secondary Clarifier Rehabilitation $625
Wastewater Transportation System Improvements $6,735
Sub Total $26,843
ALL FUNDS TOTAL $91,476
Debt Service & Capital Planning Section 6 Page 25

Proposed Capital Improvement Projects For 2018
The following is a listing with a very brief description of the capital projects that are anticipated to require
funding in 2018. More detail can be found in the County’s 2018-2023 Capital Improvement Plan.
DEPARTMENT OF CORRECTIONS
Project: Physical Plant Improvements and Security Upgrades Level of Development: Intermediate Project Description: This project provides for improvement to original structures, building equipment and enhances security around the facility. Building repairs include repair/replacement of kitchen flooring, housing unit entries, programs corridor ceiling replacement, air conditioning in Hsg Units 1, 2 & 3, and the replacement of inmate housing unit entry and cell doors. The kitchen dish washer and the food service delivery carts need to be replaced and a large laundry washing machine needs to be purchased. Security enhancement includes the installation of lighting on facility roadways and an alternative entry and egress from the facility. Grounds and exterior improvements include resurfacing of roadways and parking lots of the facility. The completion of these projects will maintain the safety and security of the facility and the compliance of health and safety standards.
EMERGENCY SERVICES
Project: Public Safety Radio Tower Replacement Level of Development: Intermediate Project Description: Replace two critical public safety radio communications towers that will have reached the end of their useful life cycle and do not meet current standards for critical public safety standards. Project: Replacement of Mobile Data Communications Network (MDCN) Infrastructure Level of Development: Preliminary Project Description: This project will replace the 800 MHz mobile data communications infrastructure, including fixed base station equipment at radio tower sites and mobile data radio modems in public safety vehicles. The end of life for the current Mobile Data Communications Network (MCDN) is December of 2017. Project: Trunked Land Mobile Radio Network Backup Prime Site Level of Development: Advanced Project Description: While there is redundancy in the OCICS digital trunked land mobile radio (TLMR) system, the system does have a single point of failure. A catastrophic failure of the OCICS TLMR would leave critical first responders without radio communications for a period of time. This project will provide a geographically redundant backup prime site solution that will serve to provide basic emergency communications support in the event of a complete TLMR system failure.
Debt Service & Capital Planning Section 6 Page 26

FACILITIES MANAGEMENT
Project: Civic Center Office Maintenance, Repairs and Improvements Level of Development: Advanced Project Description: This ongoing project consists of masonry repairs to the lower brick veneer, concrete stem wall, and columns located in front of the Civic Center, in addition to interior office renovations to multiple floors located in the Civic Center office tower. The project will include new office environments, painting and lighting, carpeting, and HVAC modifications. It will also provide ADA enhancements, sound masking systems and incorporate sustainable practices, such as energy reduction and ergonomic planning. Project: Facilities Various Capital Improvements Level of Development: Advanced Project Description: This project will generate improvements in structural integrity, mechanical systems, energy efficiency systems, life/safety issues, office environments, building exteriors, infrastructure, ADA improvements and security and fire alarm systems of buildings and grounds in various facilities, as well as providing for the preservation of County assets. Project: OnCenter Rehabilitations Level of Development: Advanced Project Description: We propose to replace, rehabilitate and restore various fatigued, out of date and failing systems and components within the Oncenter Building group. This will include, but will not be limited to, theater enhancements of acoustical treatments, ADA upgrades and appurtenances, building systems modifications, as well as lighting and insulation replacements. Project: Remodeling Social Services Reception Level of Development: Advanced Project Description: This project will provide for efficiency improvements in the Department of Social Services by renovating the Division of Temporary Assistance Intake with attention to congestion reduction, staff and public safety, as well as security - to allow for streamlined and effective delivery of services.
HILLBROOK
Project: Hillbrook Detention Facility Improvements Level of Development: Intermediate Project Description: Improvements and replacements of various elements of security and safety throughout the existing facility
OFFICE OF ENVIRONMENT
Project: Ash Tree Management Level of Development: Intermediate Project Description: Emerald Ash Borer (EAB), an invasive species of beetle that kills ash trees, arrived in the U.S. around 2002 and is spreading across the Country. The beetle is already infesting ash trees in Onondaga County. One in nine trees in Onondaga County is an ash tree. Onondaga County has developed and is implementing an Emerald Ash Borer (EAB) management strategy in order to minimize the hazard risk to the community, the impact of EAB on County operations and to plan for and minimize
Debt Service & Capital Planning Section 6 Page 27
EAB costs (tree removal/inoculation, manpower and equipment, disposal and tree replacement). All County-owned ash trees with potential targets in the drop zone (people or physical assets) will need to be removed or inoculated to protect the public, protect assets and reduce liability.
PARKS & RECREATION
Project: Carpenters Brook Fish Hatchery Pond Repair Level of Development: Advanced Project Description: This project will provide funding to patch & resurface the current 18 circular and 9 raceway ponds at Carpenters Brook Fish Hatchery. Problem that Exists: The original concrete ponds were constructed in 1934. These ponds have been exposed to over 80 years of harsh environments. The ponds are leaking at a rapid pace making it more difficult to successfully raise fish. Project: Park Roads, Parking Areas, and Trail Paving Level of Development: Advanced Project Description: This project is the ongoing maintaining, resurfacing or new construction of park roads, trails and parking Project: Building an AZA Required Animal Medical Care Center with African Savannah Exhibit Level of Development: Preliminary Project Description: This project seeks to design and construct a medical care center for animals which would include quarantine areas and medical facilities with the capacity for much larger zoo animals. This project also includes a large hoof-stock savannah exhibit that would be located directly adjacent to the medical facility Project: Energy efficiency and reliability upgrade at the zoo Level of Development: Advanced Project Description: Project entails installing a Combined Heat and Power unit that will provide electricity and heat more efficiently and less costly than from utility sources. In addition the unit will provide a source of emergency electrical power in the event of a utility power outage. This emergency power is necessary to maintain the habitat for exotic and expensive species housed at the zoo. NYSERDA funding is currently available to offset approximately 35% of the project cost. The estimated simple payback for the project is less than 12 years. The savings over the 30 year useful life of the project are estimated to be over $350,000 Project: Playground Improvements Level of Development: Advanced Project Description: The Parks system is home to several major playgrounds that represent a multi-million dollar investment. Many of these playgrounds have expensive composite surfaces that deteriorate over time. This project seeks funding to maintain, repair, upgrade and create playgrounds at new sites. Project: Loop the Lake Trail Level of Development: Preliminary Project Description: Construction of a mile of multi-use trails on the southeast shore of Onondaga Lake known as Murphy’s Island. This is a trail segment which will eventually be part of the completed Loop the Lake trail system.
Debt Service & Capital Planning Section 6 Page 28

SHERIF POLICE/CIVIL
Project: Sheriff's New Headquarters Facility Level of Development: Preliminary Project Description: The goal of this project is to conduct a study to consolidate all of the Police and Civil operations into a central facility. The new facility will consolidate several existing facilities including Headquarters (South State Street), the Property and Evidence Facility/Impound Lot (Joy Road), the Special Operations Facility (Cessna Road), the Patrol Substations, and all administrative functions.
TRANSPORTATION
Project: Bituminous Surface Treatment Level of Development: Ongoing Project Description: This project provides for the treatment of County highways with a bituminous surface treatment to prolong the life of the wearing surface. Project: Bridges Level of Development: Ongoing Project Description: This program addresses the maintenance and repair of bridges within the County highway system. Project: Capital Highway Construction Level of Development: Ongoing Project Description: This project involves construction of major highway improvements. Project: Cold Mix Bituminous Paving Level of Development: Ongoing Project Description: This project entails the repaving of the 375 miles of secondary County roads on a rotating basis. Project: Guide Rail Level of Development: Ongoing Project Description: This program involves the installation of guide rail at various locations on County highways. Project: Rehabilitation of North Area and Camillus Highway Maintenance Facilities Level of Development: Intermediate Project Description: This project addresses the need for substantial renovations and repairs to DOT's
Camillus and Dewitt highway maintenance facilities.
Project: Repaving Program (Hot Mix Bituminous) Level of Development: Ongoing Project Description: This program provides for the repaving of major, high volume County roads to maintain our investment in the transportation system.
Debt Service & Capital Planning Section 6 Page 29

Project: Testing, Drainage and Facilities Repair Level of Development: Ongoing Project Description: This project provides support programs for the Department of Transportation's Annual Work Plan. Project:Traffic Systems Management Level of Development: Ongoing Project Description: This program addresses Traffic System improvements on County highways.
WATER ENVIRONMENT PROTECTION
Project: Baldwinsville Seneca Knolls WWTP Disinfection and Phase II Asset Renewal Improv. Level of Development: Preliminary Project Description: The Baldwinsville-Seneca Knolls Wastewater Treatment Plant was issued a renewed SPDES Discharge Permit in June 2014 by the New York State Department of Environmental Conservation (NYSDEC) which included modifications to the effluent total residual chlorine (TRC) limit from 2.0 mg/L to 0.08 mg/L. The new TRC permit limits will become effective beginning May 15, 2018. The WWTP currently has no means to dechlorinate the effluent to meet this limit. Therefore, the County initiated this project to design and construct upgrades to the disinfection system which will enable the new TRC limit to be met. Additionally, the plant is over thirty-five years old. Various small and discrete improvements and repairs have been done to the facility as a means of operational enhancements and infrastructure maintenance. However, there is a contemporary need to implement a robust infrastructure renewal project for many of the treatment plant's assets so as to ensure continued satisfactory operation and extend its service life. This project is for Phase II asset renewal improvements. Project: Camillus Force Main Replacement Level of Development: Preliminary Project Description: Replacement of a 24 inch diameter 7 mile long wastewater pipeline. Project: Energy Efficiency Improvements/Performance Contracting Level of Development: Intermediate Project Description: This project entails working with an energy service company (ESCO, a commercial business providing a broad range of comprehensive energy solutions including designs and implementation of energy savings projects, energy conservation, power generation and energy supply, and risk management) to design and implement various process and infrastructure improvements for energy savings. The project serves to support of the County's effort to pursue sustainability, effect the goals of the County's Climate Action Plan, reduce energy usage, and correspondingly reduce annual operating costs. Project: Ley Creek/Liverpool Force Main Rehabilitation/Replacement Project Level of Development: Preliminary Project Description: Rehabilitation/Replacement of the Ley Creek 42-inch wastewater force main and the Liverpool 18-inch wastewater force main. Both force mains have exceeded the expected service life and have resulted in costly emergency repairs and additional regulatory scrutiny. Project: Oak Orchard Disinfection and Lagoon Cleaning (NEW) Level of Development: Intermediate Project Description: The Oak Orchard Wastewater Treatment Plant was issued a New York State Pollutant Discharge Elimination System (SPDES) permit in June 2014 which contained more restrictive
Debt Service & Capital Planning Section 6 Page 30

disinfection limits in terms of allowable chlorine residual. The existing infrastructure is inadequate to meet those new limits. Consequently, new and additional process tankage and chemical treatment systems will be installed to meet those new limits. In addition, cleaning and improvements are necessary for the onsite lagoons so as to ensure SPDES compliance and continued satisfactory plant operations. Project: Oak Orchard WWTP Secondary Clarifier Rehabilitation Level of Development: Advanced Project Description: The Oak Orchard Wastewater Treatment Plant (WWTP) has been in operation since 1980. The secondary clarifiers, critical to the successful operation of the plant, are original to the plant and have been identified for replacement Project: Wastewater Transportation System Improvements Level of Development: Ongoing Project Description: This project consists of three primary or categorical elements: pump station
improvements, trunk sewer improvements, and facility maintenance improvements (i.e., paving, roofing,
and larger-scale maintenance activities).
Debt Service & Capital Planning Section 6 Page 31