debt-related vulnerabilities and financial crises- an … · 2005-03-23 · chapter iv first...
TRANSCRIPT
INTERNATIONAL MONETARY FUND
Debt-Related Vulnerabilities and Financial Crises—An Application of the Balance Sheet Approach to Emerging Market Countries
Prepared by the Policy Development and Review Department1
In consultation with other departments
Approved by Mark Allen
July 1, 2004
Contents Page
Executive Summary ...................................................................................................................4
I. Introduction.............................................................................................................................5
II. Public and Private Sector Balance Sheets in Emerging Market Countries: Recent Trends and Key Risks ................................................................................................................8
A. The Public Sector’s Balance Sheet .........................................................................10 B. The Financial Sector’s Balance Sheet .....................................................................16 C. The Nonfinancial Private Sector’s Balance Sheet...................................................18 D. Presenting Economy-Wide Vulnerabilities.............................................................21
III. Balance Sheet Developments in Recent Financial Crises: Some Country Examples ........23 A. Argentina: How Weaknesses in Private Sector Balance Sheets Contributed to the Crisis of 2001-02....................................................................................................24 B. Uruguay: How a Run on Banks Led to a Sovereign Debt Crisis.............................29 C. Turkey: How Banks’ Balance Sheet Positions Contributed to the Crisis of 2000–01........................................................................................................................34 D. Brazil: How the Public Sector Leveraged its Balance Sheet to Insulate the Private Sector from the 1998-1999 Currency Crisis ....................................................38
1 This paper was drafted by a staff team led by Christoph Rosenberg and comprising Ioannis Halikias, Brett House, Christian Keller, Jens Nystedt, Alex Pitt and Brad Setser. Invaluable research assistance was provided by Rich Kelly and editorial assistance was provided by Belinda McPherson, Neri Gomes and Silvia Thomas.

- 2 -
E. Peru: How A Highly Dollarized Economy Remained Resilient in the Face of Regional Financial Turmoil .........................................................................................42 F. Lebanon: How Confidence Can Uphold Fragile Balance Sheets ............................45
IV. Conclusions........................................................................................................................48
References................................................................................................................................53 Annex I. Regional Groupings .................................................................................................................57 Annex II. Definitions and Sources for Chapter II ....................................................................................58
Boxes 1. The Balance Sheet Approach in the Recent Literature ..........................................................7 2. The Balance Sheet Approach in Practice ...............................................................................9 3. Extensions of the Balance Sheet Approach .........................................................................52 Tables III.A.1. Argentina: Foreign-Currency Denominated Debt of the Corporate Sector.................26 III.A.2. Argentina: Principal Assets and Liabilities of the Argentine Banking System...........28 III.B.1. Uruguay: Deposit Structure, by Residency..................................................................31 III.E.1. Peru: Foreign-Currency Debt and Foreign-Currency Income in the Private Nonfinancial Sector .................................................................................................45 Figures II.1 Public Debt...................................................................................................................10 II.2 Public Domestic vs. Public External Debt...................................................................11 II.3 Public Domestic vs. Foreign-Currency Debt ...............................................................12 II.4 Privately-Held vs. Officially-Held Public Debt ...........................................................12 II.5 Average Maturity of Public External Debt .................................................................13 II.6 Structure of Domestic Government Bonds ..................................................................13 II.7 Public Sector Debt Sustainability Assessments ...........................................................14 II.8 Primary Balance ...........................................................................................................14 II.9 Total Public External Debt...........................................................................................15 II.10 Gross and Net Reserves ...............................................................................................16 II.11 Banking Sector Assets .................................................................................................16 II.12 Credit to the Private vs. Public Sectors........................................................................17 II.13 Foreign-Currency Deposits ..........................................................................................17 II.14 Domestic Foreign-Currency Loans ..............................................................................18 II.15 Short-Term External Debt and Foreign-Currency Deposits ........................................18 II.16 Nonfinancial Private Sector Debt ................................................................................19 II.17 Nonfinancial Private Sector External Debt and Private Domestic Foreign- Currency Debt ..........................................................................................................20

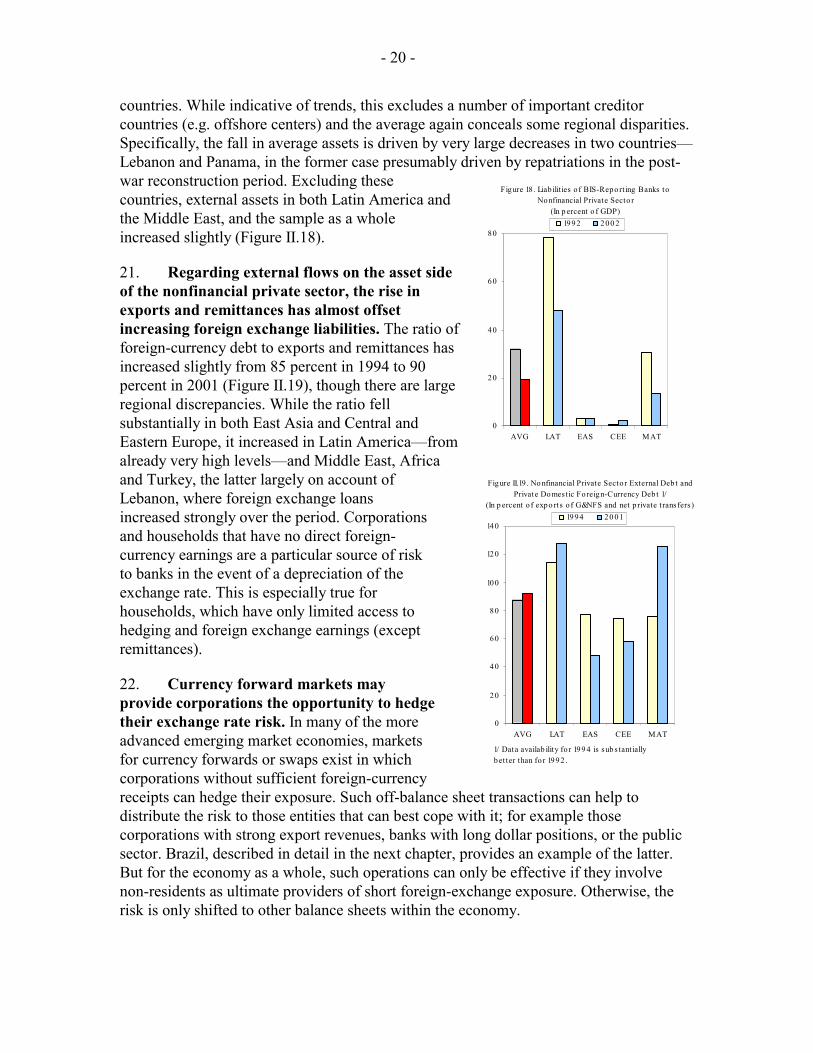
- 3 -
II.18 Liabilities of BIS-Reporting Banks to Nonfinancial Sector.........................................20 II.19 Nonfinancial Private Sector External Debt and Private Domestic Foreign- Currency Debt ..........................................................................................................21 II.20 Economy-Wide Vulnerabilities, Emerging Markets....................................................22 II.21 Economy-Wide Vulnerabilities, Regional ...................................................................23 II.22 Vulnerabilities in Crisis and Non-Crisis Countries ...................................................... IIIA.1 Argentina: Maturity Mismatches: With and Without Foreign-Currency Deposits......29 III.B.1. Uruguay: Dollarization of Deposits and Loans............................................................31 III.B.2. Uruguay: System-Wide Foreign-Currency Balance Sheet...........................................31 III.B.3. Uruguay: Maturity Mismatch and Domestic Foreign-Currency Deposits ...................31 III.B.4. Uruguay: Foreign-Currency Balance Sheets ................................................................32 III.B.5. Uruguay: Foreign-Currency Balance Sheets ................................................................32 III.B.6. Uruguay: Gross Reserves.............................................................................................33 III.B.7. Uruguay: Combined Public-Sector Debt .....................................................................33 III.C.1 Turkey: Primary Auction Interest Rates in Real Terms...............................................35 III.C.2 Turkey: Banking Sector Assets....................................................................................36 III.C.3 Turkey: Funding from Foreign Banks..........................................................................36 III.C.4 Turkey: Banks’ Net Open Foreign-Currency Positions ...............................................37 III.C.5. Turkey: Change in Public Debt to GDP Ratio: Component Contribution by Year....................................................................................................................37 III.C.6 Turkey: Public Debt by Instrument..............................................................................38 III.D.1 Brazil: Growth Effect of Real Currency Crises ...........................................................39 III.D.2. Brazil: NFA of Banking System ..................................................................................39 III.D.3. Brazil: Corporate Sector External Debt .......................................................................40 III.D.4. Brazil: Composition of Federal Debt ...........................................................................41 III.D.5. Brazil: Net Foreign-Currency Assets and Composition...............................................42 III.D.6. Brazil: Key Vulnerability Ratios..................................................................................42 III.E.1. Peru: Share of Foreign Currency and External Debt....................................................43 III.E.2. Peru: Foreign-Currency Mismatch...............................................................................43 III.E.3. Peru: Liquid Dollar Assets Versus Banks’ Short-Term Dollar Liabilities ..................44 III.E.4. Peru: Liquid Dollar Assets Versus Banks’ Dollar Liabilities and Short-Term Foreign Debt ............................................................................................................45 III.E.5 Peru: External and Financial Vulnerability Ratios ......................................................46 III.F.1. Lebanon: Public Sector Balance Sheet ........................................................................47 III.F.2.Lebanon: Private Financial Sector Balance Sheet.........................................................48

- 4 -
EXECUTIVE SUMMARY
This paper responds to calls by the IMFC and the Executive Board to take forward the Fund’s work on debt-related vulnerabilities and balance sheet risks. The paper has three major tasks: it provides an overview of salient balance sheet developments in emerging market economies over the last decade; it demonstrates how the balance sheet approach (BSA) can be used to identify vulnerabilities; and it prepares the ground for discussing surveillance and program-related policy issues arising from balance sheet mismatches. The paper focuses on emerging-market countries, because during the last decade several of them have experienced capital account crises emanating from balance sheet weaknesses. Moreover, the staff’s work has greater potential to provide new insights than on industrial countries where such analysis is already widely used. Chapter II takes a broad look at recent trends in public and private sectoral balance sheets in a sample of 25 emerging market countries. It highlights the increasing linkages between public and private sector balance sheets, and identifies some of the opportunities and risks these linkages can create. Following a sector-by-sector analysis, the paper suggests ways of presenting vulnerabilities on an economy-wide scale. Rather than using a unified measure, it presents a host of mismatch indicators, calibrated by comparisons across countries and/or time. Chapter III looks at several country cases in more detail. It first aims to explain how mismatches can translate into financial crises by looking more closely at balance sheet developments in a few recent cases (Argentina, Uruguay, Turkey). These episodes are set against some other cases (Brazil, Peru, Lebanon) where particular features of each country’s sectoral balance sheets allowed it to avoid slipping into crisis. Chapter IV first provides some concluding thoughts on the policy implications of the BSA. On the policy front, both the cross-country analysis and the case studies (i) underscore the importance of temporary asset buffers associated with strong public sector balance sheets, (ii) highlight the benefits of promoting appropriate buffers and hedges in private balance sheets to improve risk allocation within and between sectors, (iii) support the strengthening of banking supervision to limit currency exposure and maturity mismatches, and (iv) show how sound liability management by both the public and private sectors can play an important role in containing interest rate, currency, and rollover risks. The final chapter also offers thoughts on how to operationalize the BSA in future Fund work. The BSA cannot be easily reduced to a small set of readily comparable indicators that quantify vulnerabilities, and, by definition, it does not take account of off-balance sheet transactions. Nevertheless, this paper demonstrates that available data, even where limited, can yield a great deal of insight into the nature of intersectoral vulnerabilities and the channels by which they are transmitted. Further work on operationalizing the BSA might permit to simulate the balance-sheet implications of
- 5 -
relevant shocks and assess the welfare implications of trade-offs between reducing balance sheet vulnerabilities and minimizing financial costs.
I. INTRODUCTION
1. This paper responds to calls by the IMFC and the Executive Board to take forward the Fund’s work on debt-related vulnerabilities and balance sheet risks.2 The paper relates to a number of policy initiatives identified in the recent informal Board discussion on “Integrating the Balance Sheet Approach into Fund Operations” (SM/04/52). These include staff’s work on liquidity and debt management (SM/04/149), innovations aimed at reducing the vulnerabilities that emanate from today’s sovereign debt structures (SM/04/140), strengthening surveillance by using the balance sheet approach (BSA) to detect vulnerabilities (in the context of the forthcoming Biennial Surveillance Review), improving data provision to the Fund (SM/04/56), and reviewing debt-related conditionality in Fund-supported programs with emerging market countries.
2. As discussed at the March 2004 Board seminar, the paper focuses on emerging market countries. For these members, the application of the balance sheet approach appears particularly promising. First, several emerging market countries have been subject to capital account crises in the last decade, often emanating from balance sheet-related weaknesses. These members have proven particularly vulnerable to sudden capital outflows and sharp changes in investors’ confidence, interest rates and exchange rates because their financing is generally less diversified than in mature countries: they are typically not able to issue foreign debt in domestic currency and are often forced to borrow at short maturities. This may lead to combined currency and maturity mismatches. Moreover, there are fewer avenues to hedge or absorb financial losses.3 Secondly, unlike in industrial countries where balance sheet analysis is already widely used and the related risks are factored into policy formulation, staff’s work on emerging markets has more potential to provide new insights and identify avenues for research. Finally, the Fund’s current budget constraints dictate a risk-oriented approach where staff resources are concentrated on members that are most likely to be subject to crisis and where the Fund could be—or is already—financially exposed. As such constraints ease, staff will expand its efforts to industrial countries as well.
2 See IMFC Communiqué September 2003, and the informal Board meetings on the balance sheet approach in July 2003 and March 2004.
3 Recent empirical work has established that the types of crises for which balance sheet mismatches have strong predictive power, notably “sudden stops”, have tended to be an exclusive feature of emerging market economies. See, for example, Calvo, Izquierdo, and Mejía (2004).
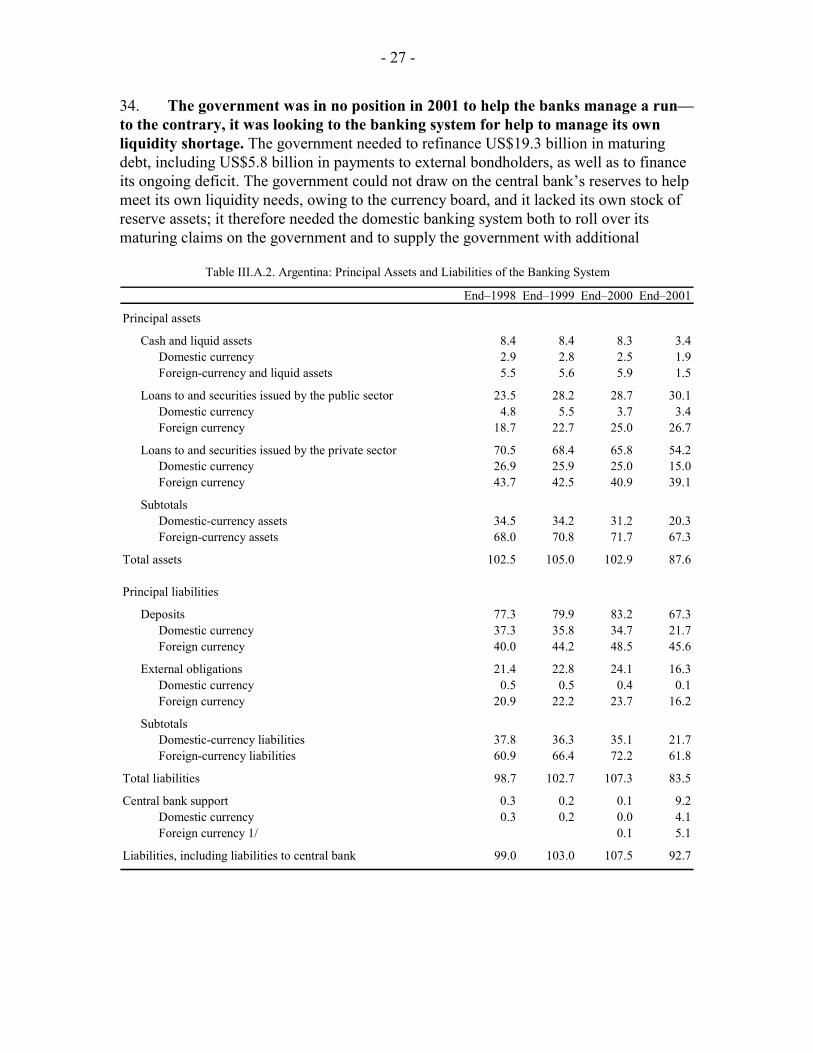
- 6 -
Box 1. The Balance Sheet Approach in the Recent Literature “The Balance Sheet Approach to Financial Crisis” (WP/02/210) provided a comprehensive review of the analytical literature on the role that balance sheet weaknesses can play in the genesis and evolution of financial crises. The BSA can be best understood as a comprehensive framework for looking at vulnerabilities that may arise as a result of (i) interactions between debt levels, debt structure (in particular with respect to maturity and currency), and the relevant assets for servicing these debts, and (ii) linkages between sectoral balance sheets.
The recent literature on debt intolerance emphasizes that developing countries historically have run into problems at much lower debt-to-output ratios than advanced countries.1 This research focuses on weak revenue bases and the lack of expenditure control as critical reasons in explaining why primary balances and hence sustainable public debt levels in emerging market economy are fairly low.2 In the context of balance sheet analysis, these traditional indicators of fiscal weaknesses can be interpreted as vulnerabilities on the “asset-side” of the public sector’s balance sheet. Other research highlights the role weaknesses on the liabilities side of the public sector’s balance sheet can play in reducing the level of debt that emerging economies can sustain. For example, the literature on original sin—the inability to borrow (abroad, but also at home) long-term in the local currency—draws attention to important differences between the debt structures of advanced economies and many emerging economies.3
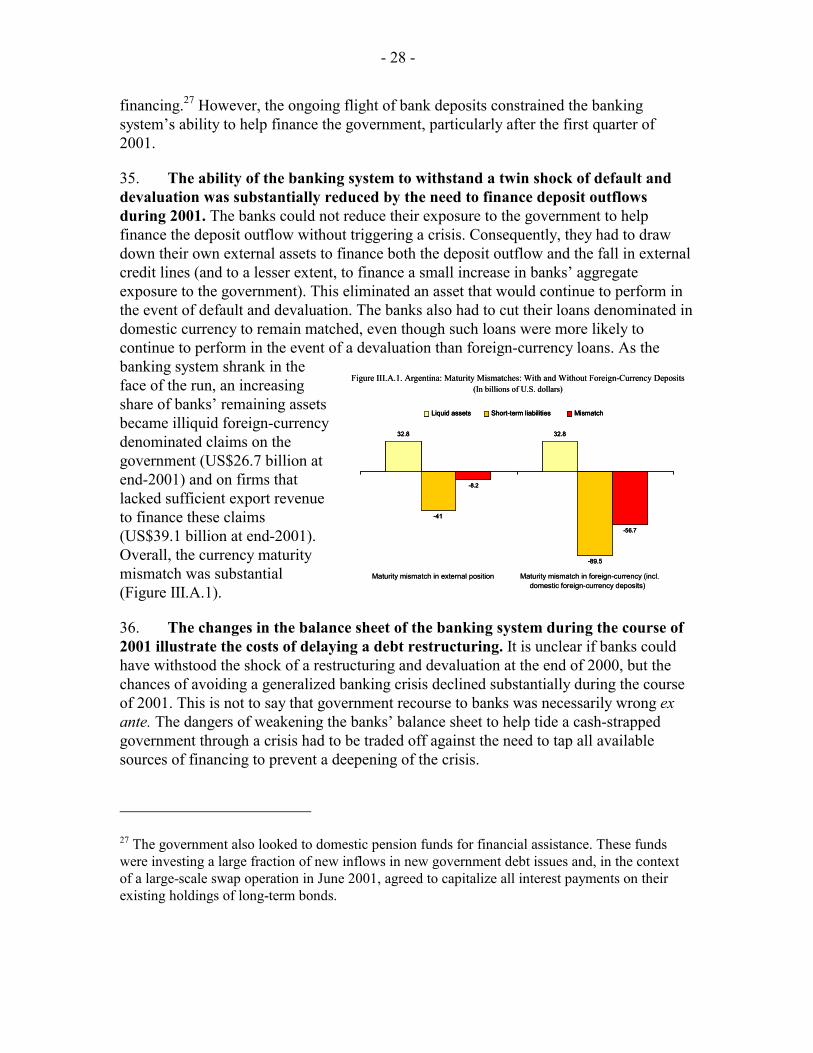
Financial crises, especially in Latin America, have inspired additional research on the vulnerabilities associated with (partial) domestic dollarization in emerging market countries. 4 Households’ holdings of dollar deposits, for example, can leave the banking system and the overall economy vulnerable to a self-reinforcing deposit run, as a shock to the portfolio preferences of domestic households prompts a shift out of domestic dollar deposits toward relatively safer international assets. The need to match dollar deposits with domestic dollar loans can increase the overall stock of foreign-currency denominated claims in the economy, aggravating the risk that a currency depreciation will result in financial distress.5 Balance sheet mismatches in the financial, household, or corporate sectors can seriously limit the degree of exchange rate volatility that policymakers are willing to tolerate (fear of floating), as monetary authorities in practice often intervene to prevent large movements in the exchange rate. 6 Recent work on currency mismatches by Goldstein and Turner (2003) highlights the need to take into account domestic foreign-currency liabilities as well as external debt in assessing vulnerability, and to assess an economy’s foreign-currency debt in light of both existing stocks of foreign assets and its ability to generate a flow of foreign-currency receipts from exports and income receipts. ________________________________ 1 Reinhart, Rogoff, and Savastano (2003a) find that external debt was less than 60 percent of GNP in 47 percent of the default cases they examined. Similarly, IMF (2002), and Manasse, Roubini, and Schimmelpfenning (2003), estimate external debt thresholds of 40 percent of GDP, and 50 percent of GDP, respectively, beyond which countries are more likely to experience debt defaults. 2 Research in IMF (2003) suggests that, based on fiscal performance, the sustainable gross public debt level for a typical emerging market economy may only be about 25 percent of GDP; 50 percent of GDP is found to be a threshold level beyond which the risk of a sovereign debt crisis increases significantly. 3 Eichengreen, Barry; Ricardo Hausmann and Ugo Panizza (2002 and 2003); Eichengreen, Barry; Ricardo Hausmann (2002).
4 Reinhart, Rogoff, and Savastano (2003b); De Nicoló, Honohan, and Ize (2003); Caballero and Krishnamurthy (2000); Balino, Bennet and Borenszstein (1999), Mongardini and Mueller (2000); Oomes (2003); Edwards (2001), Havrylyshyn and Beddies (2003).
5 Zettelmeyer and Jeanne (2002), Kaminski and Reinhart (1999), Jeanne and Wyplosz (2001).
6 Calvo, Guillermo and Carmen Reinhart (2000); Céspedes, Luis Felipe, Roberto Chang, Andrés Velasco (2001).
- 7 -
3. The purpose of the paper is threefold:
• First, it provides an overview of salient balance sheet developments in emerging market economies. While in earlier papers (WP/02/210 and SM/03/227) and in the recent literature (Box 1) the BSA is introduced mainly as an approach for analyzing financial crises, this paper takes account of the main balance sheet trends over the past decade and includes a number of case-studies. Data weaknesses notwithstanding, the paper illustrates how intersectoral linkages have deepened over time. This suggests that the BSA is becoming increasingly relevant for vulnerability analysis.
• Secondly, it demonstrates how the balance sheet approach can be used to identify vulnerabilities. The paper should be seen mainly as a didactic device: both the broader regional overview as well as the country case studies illustrate how the BSA can be applied, even with relatively limited data. The paper also highlights the importance of systematically taking into account the level and structure of liabilities and assets in addition to traditional macroeconomic indicators. This facilitates analysis of the main linkages between domestic sectors, and consideration of off-balance sheet activities, including contingent liabilities.
• Finally, it prepares the ground for discussing surveillance and program-related policy issues. The paper seeks to provide empirical backing for the Board’s tentative conclusions during the recent Board seminar on liquidity management regarding policies that can make emerging market economies more resilient. For the design of Fund-supported programs, the paper provides some background for discussing how best to design debt-related conditionality, and how to justify access to Fund resources.
4. At the outset, a number of caveats regarding the usefulness of the BSA for vulnerability analysis are in order. While Directors have pointed out that this application of the approach holds much promise, it also suffers from a number of shortcomings that will have to be overcome over time:
• First, as distinct from early warning systems, the BSA cannot be easily reduced to a small set of indicators that quantify vulnerabilities in a manner that is readily amenable to cross-country comparisons. Rather, the approach is better thought of as a conceptual framework for a fuller assessment of such vulnerabilities and related policy options, in conjunction with other relevant country-specific factors.
• Second, by definition, the BSA does not take into account off-balance sheet transactions that have become increasingly important over time. As will be demonstrated in some of the country case studies, such transactions can be used to hedge balance sheet exposures, but have at times exacerbated them.
• Third, a full assessment of underlying risks needs to factor in the probability distribution of key relevant shocks. For instance, under a fixed exchange rate
- 8 -
regime, a situation of significant misalignment would raise the level of concern relating to any vulnerabilities identified by the BSA and sharpen the urgency of needed policy interventions.
• Finally, a full assessment of sectoral balance sheets on welfare grounds needs to explicitly take into account the relevant tradeoffs between reducing vulnerability (along the lines suggested by the BSA) and minimizing financial cost. Such an approach is clearly called for, for instance, when evaluating financial system liquidity, currency and maturity composition of external debt, and optimal reserve accumulation.
5. The paper is structured as follows: Chapter II takes a broad look at trends in public and private balance sheets in emerging market countries, highlights their increasing linkages and points to the vulnerabilities that they may create. Chapter III aims to give a better sense of how such vulnerabilities can actually translate into real crises, by more closely tracing balance sheet developments, both in a few recent crisis cases (Argentina, Uruguay, Turkey) and some near-crisis cases (Brazil, Peru, Lebanon). Chapter IV provides some concluding thoughts on policy implications, operationalizing the approach and further work.
II. PUBLIC AND PRIVATE SECTOR BALANCE SHEETS IN EMERGING MARKET COUNTRIES: RECENT TRENDS AND KEY RISKS
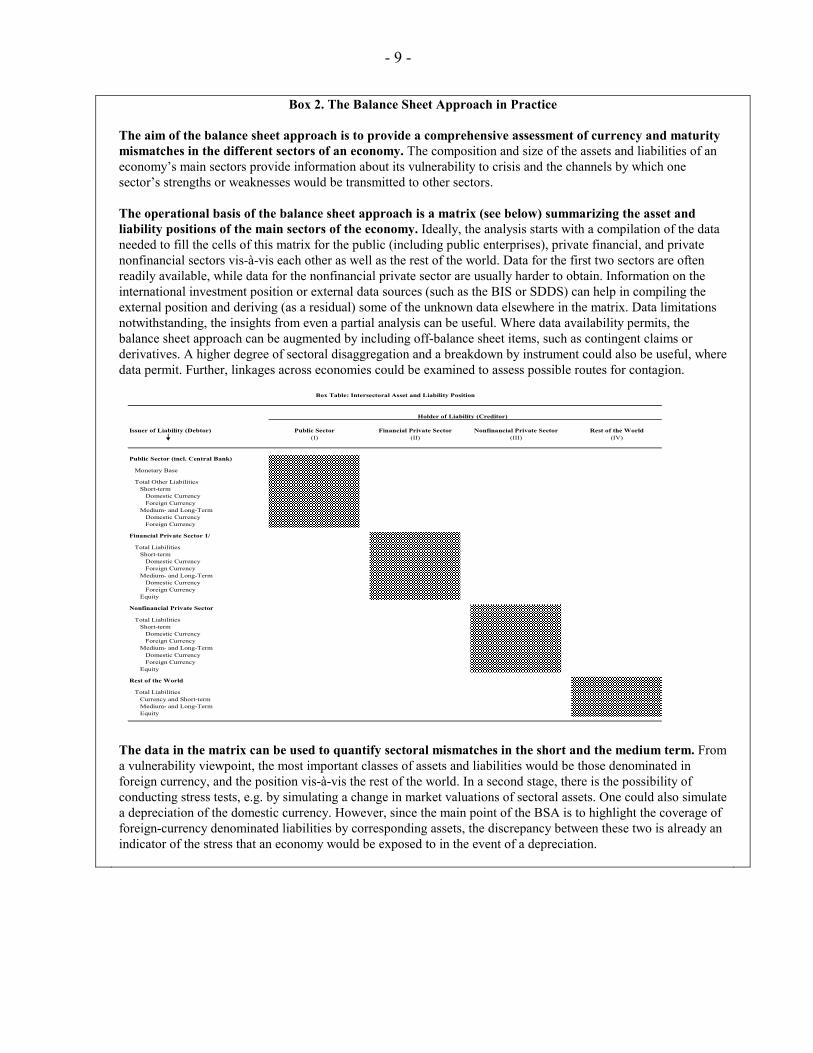
6. This chapter shows how emerging markets’ public, banking, and nonfinancial private sector balance sheets have become more integrated over the past decade.4 It also provides a toolkit for assessing vulnerabilities, even with limited data (for an outline of some operational aspects of the balance sheet approach, see Box 2). To highlight common trends and differences between 1992 and 2002, a sample of 25
4 The public sector includes both the general government (in most countries including public enterprises) and the central bank.
- 9 -
Box 2. The Balance Sheet Approach in Practice The aim of the balance sheet approach is to provide a comprehensive assessment of currency and maturity mismatches in the different sectors of an economy. The composition and size of the assets and liabilities of an economy’s main sectors provide information about its vulnerability to crisis and the channels by which one sector’s strengths or weaknesses would be transmitted to other sectors. The operational basis of the balance sheet approach is a matrix (see below) summarizing the asset and liability positions of the main sectors of the economy. Ideally, the analysis starts with a compilation of the data needed to fill the cells of this matrix for the public (including public enterprises), private financial, and private nonfinancial sectors vis-à-vis each other as well as the rest of the world. Data for the first two sectors are often readily available, while data for the nonfinancial private sector are usually harder to obtain. Information on the international investment position or external data sources (such as the BIS or SDDS) can help in compiling the external position and deriving (as a residual) some of the unknown data elsewhere in the matrix. Data limitations notwithstanding, the insights from even a partial analysis can be useful. Where data availability permits, the balance sheet approach can be augmented by including off-balance sheet items, such as contingent claims or derivatives. A higher degree of sectoral disaggregation and a breakdown by instrument could also be useful, where data permit. Further, linkages across economies could be examined to assess possible routes for contagion.
The data in the matrix can be used to quantify sectoral mismatches in the short and the medium term. From a vulnerability viewpoint, the most important classes of assets and liabilities would be those denominated in foreign currency, and the position vis-à-vis the rest of the world. In a second stage, there is the possibility of conducting stress tests, e.g. by simulating a change in market valuations of sectoral assets. One could also simulate a depreciation of the domestic currency. However, since the main point of the BSA is to highlight the coverage of foreign-currency denominated liabilities by corresponding assets, the discrepancy between these two is already an indicator of the stress that an economy would be exposed to in the event of a depreciation.
Issuer of Liability (Debtor)
Public Sector (incl. Central Bank)
Monetary Base
Total Other LiabilitiesShort-term
Domestic CurrencyForeign Currency
Medium- and Long-TermDomestic CurrencyForeign Currency
Total LiabilitiesShort-term
Domestic CurrencyForeign Currency
Medium- and Long-TermDomestic CurrencyForeign Currency
Equity
Nonfinancial Private Sector
Total LiabilitiesShort-term
Domestic CurrencyForeign Currency
Medium- and Long-TermDomestic CurrencyForeign Currency
Equity
Rest of the World
Total LiabilitiesCurrency and Short-termMedium- and Long-TermEquity
Financial Private Sector 1/
Holder of Liability (Creditor)
Public Sector Financial Private Sector Nonfinancial Private Sector Rest of the World(III)(I) (II) (IV)
Box Table: Intersectoral Asset and Liability Position

- 10 -
emerging market countries is considered.5 The countries are grouped into four regions:Latin America (LAT), East Asia (EAS), Central and Eastern Europe (CEE), and Middle East, Africa and Turkey (MAT).6 It should be noted at the outset that the small sample size for each region and sometimes sketchy data (especially for 1992) do not allow for a complete picture of the relevant strengths and vulnerabilities. The primary purpose of this chapter is therefore to show the usefulness of the methodology rather than providing an authoritative view on the state of emerging markets’ balance sheets
A. The Public Sector’s Balance Sheet
The liability side 7. Public debt levels generally have increased over the last decade (Figure II.1). The average debt-to-GDP ratio (including Fund credit) of emerging economies has risen from 60 percent in 1992 to some 70 percent in 2002—levels generally viewed as cause for concern.7 Europe is the only exception to the rising trend because some of these countries embarked on the transition process with very high debt ratios—partly attributed to the
5 The sample comprises countries where public debt exceeds 30 percent of GDP, and where more than half of that debt is held by private creditors. This leaves out the HIPC or IDA-only universe of countries, but also some emerging market countries which have low public debt (e.g., Czech Republic, the Baltics, and Chile) or a low share of privately held public debt (e.g., India). We also exclude small island economies such as the members of the East Caribbean Currency Union, Jamaica and the Seychelles. For the exact regional country composition see Appendix I. The main data sources are IFS, BIS, and WEO databases, data bases collected by MFD, RES, FAD (inter alia, for the 2003 WEO), the World Bank debt tables and information received from country teams. For detailed definitions of the variables and databases used in Chapter II, see Appendix II. The members covered in this sample account for 94 percent of all GRA resources outstanding and 84 percent of total Fund resources outstanding.
6 Alternative groupings of the sample, such as by rating or capital market openness, were considered, but they ultimately did not provide for meaningful interpretation. Regional groupings, while imperfect, are stable over time, and have intuitive appeal.
7 For a detailed analysis of public debt in emerging markets see the September 2003 WEO, chapter III. In that country sample, emerging market countries in 2002 had an average public debt ratio of 70 percent, against 65 percent for industrial countries.
Figure II.1. Public Debt, 1992 and 2002(In percent of GDP)
0
40
80
120
AVG LAT EAS CEE MAT
Gross public debt Fund credit
- 11 -
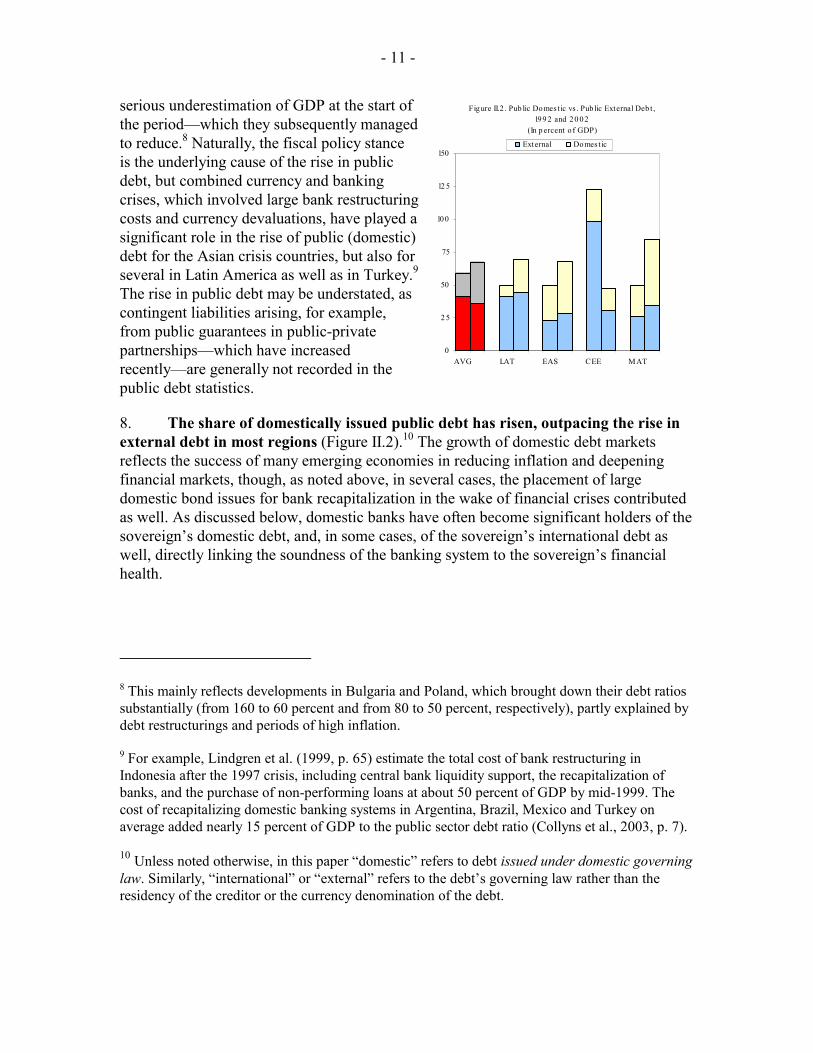
serious underestimation of GDP at the start of the period—which they subsequently managed to reduce.8 Naturally, the fiscal policy stance is the underlying cause of the rise in public debt, but combined currency and banking crises, which involved large bank restructuring costs and currency devaluations, have played a significant role in the rise of public (domestic) debt for the Asian crisis countries, but also for several in Latin America as well as in Turkey.9 The rise in public debt may be understated, as contingent liabilities arising, for example, from public guarantees in public-private partnerships—which have increased recently—are generally not recorded in the public debt statistics.
8. The share of domestically issued public debt has risen, outpacing the rise in external debt in most regions (Figure II.2).10 The growth of domestic debt markets reflects the success of many emerging economies in reducing inflation and deepening financial markets, though, as noted above, in several cases, the placement of large domestic bond issues for bank recapitalization in the wake of financial crises contributed as well. As discussed below, domestic banks have often become significant holders of the sovereign’s domestic debt, and, in some cases, of the sovereign’s international debt as well, directly linking the soundness of the banking system to the sovereign’s financial health.
8 This mainly reflects developments in Bulgaria and Poland, which brought down their debt ratios substantially (from 160 to 60 percent and from 80 to 50 percent, respectively), partly explained by debt restructurings and periods of high inflation.
9 For example, Lindgren et al. (1999, p. 65) estimate the total cost of bank restructuring in Indonesia after the 1997 crisis, including central bank liquidity support, the recapitalization of banks, and the purchase of non-performing loans at about 50 percent of GDP by mid-1999. The cost of recapitalizing domestic banking systems in Argentina, Brazil, Mexico and Turkey on average added nearly 15 percent of GDP to the public sector debt ratio (Collyns et al., 2003, p. 7).
10 Unless noted otherwise, in this paper “domestic” refers to debt issued under domestic governing law. Similarly, “international” or “external” refers to the debt’s governing law rather than the residency of the creditor or the currency denomination of the debt.
Figure II.2 . Pub lic Domest ic vs . Pub lic External Deb t , 199 2 and 20 02
(In p ercent o f GDP)
0
2 5
50
75
100
12 5
150
AVG LAT EAS CEE MAT
External Domest ic
- 12 -
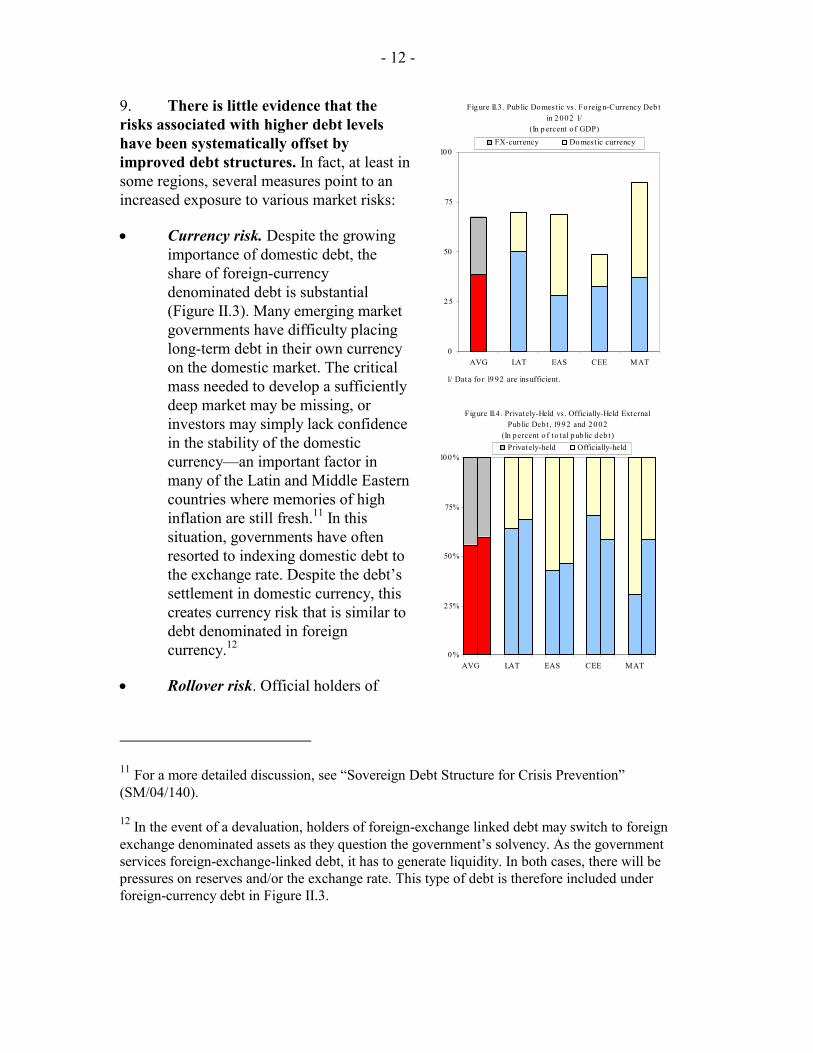
9. There is little evidence that the risks associated with higher debt levels have been systematically offset by improved debt structures. In fact, at least in some regions, several measures point to an increased exposure to various market risks:
• Currency risk. Despite the growing importance of domestic debt, the share of foreign-currency denominated debt is substantial (Figure II.3). Many emerging market governments have difficulty placing long-term debt in their own currency on the domestic market. The critical mass needed to develop a sufficiently deep market may be missing, or investors may simply lack confidence in the stability of the domestic currency—an important factor in many of the Latin and Middle Eastern countries where memories of high inflation are still fresh.11 In this situation, governments have often resorted to indexing domestic debt to the exchange rate. Despite the debt’s settlement in domestic currency, this creates currency risk that is similar to debt denominated in foreign currency.12
• Rollover risk. Official holders of
11 For a more detailed discussion, see “Sovereign Debt Structure for Crisis Prevention” (SM/04/140).
12 In the event of a devaluation, holders of foreign-exchange linked debt may switch to foreign exchange denominated assets as they question the government’s solvency. As the government services foreign-exchange-linked debt, it has to generate liquidity. In both cases, there will be pressures on reserves and/or the exchange rate. This type of debt is therefore included under foreign-currency debt in Figure II.3.
Figure II.4 . Privately-Held vs . Officially-Held External Pub lic Deb t , 1992 and 2002
(In percent o f to tal p ub lic deb t)
0%
25%
50%
75%
100%
AVG LAT EAS CEE MAT
Privately-held Officially-held
Figure II.3 . Pub lic Domestic vs . Fo reign-Currency Deb t in 2 002 1/
(In percent o f GDP)
0
25
50
75
100
AVG LAT EAS CEE MAT
FX-currency Domest ic currency
1/ Data fo r 19 92 are insufficient.
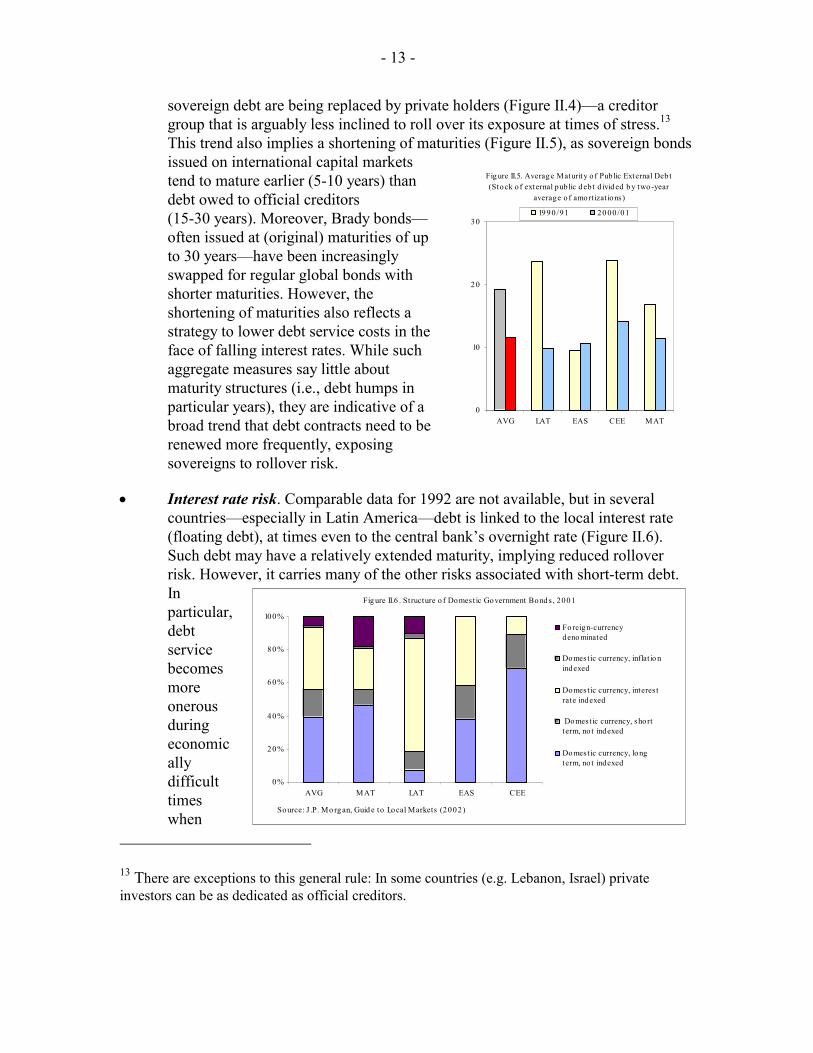
- 13 -
sovereign debt are being replaced by private holders (Figure II.4)—a creditor group that is arguably less inclined to roll over its exposure at times of stress.13 This trend also implies a shortening of maturities (Figure II.5), as sovereign bonds issued on international capital markets tend to mature earlier (5-10 years) than debt owed to official creditors (15-30 years). Moreover, Brady bonds—often issued at (original) maturities of up to 30 years—have been increasingly swapped for regular global bonds with shorter maturities. However, the shortening of maturities also reflects a strategy to lower debt service costs in the face of falling interest rates. While such aggregate measures say little about maturity structures (i.e., debt humps in particular years), they are indicative of a broad trend that debt contracts need to be renewed more frequently, exposing sovereigns to rollover risk.
• Interest rate risk. Comparable data for 1992 are not available, but in several countries—especially in Latin America—debt is linked to the local interest rate (floating debt), at times even to the central bank’s overnight rate (Figure II.6). Such debt may have a relatively extended maturity, implying reduced rollover risk. However, it carries many of the other risks associated with short-term debt. In particular, debt service becomes more onerous during economically difficult times when
13 There are exceptions to this general rule: In some countries (e.g. Lebanon, Israel) private investors can be as dedicated as official creditors.
Fig ure II.5. Averag e Maturity o f Pub lic External Deb t (Stock o f external pub lic d eb t d ivid ed b y two-year
average o f amortizat ions)
0
10
20
30
AVG LAT EAS CEE MAT
19 90 /91 20 00 /01
Fig ure II.6 . St ructure o f Domest ic Government Bond s , 2001
0%
20%
40%
60%
80%
100%
AVG MAT LAT EAS CEE
Fo reign-currencydeno minated
Domest ic currency, inflat io nindexed
Domest ic currency, interes trate indexed
Domest ic currency, sho rtterm, no t indexed
Domest ic currency, longterm, no t indexed
Source: J .P. Mo rg an, Guid e to Local Markets (2002)
- 14 -
financial policies are often tightened and hence fiscal risks increase.
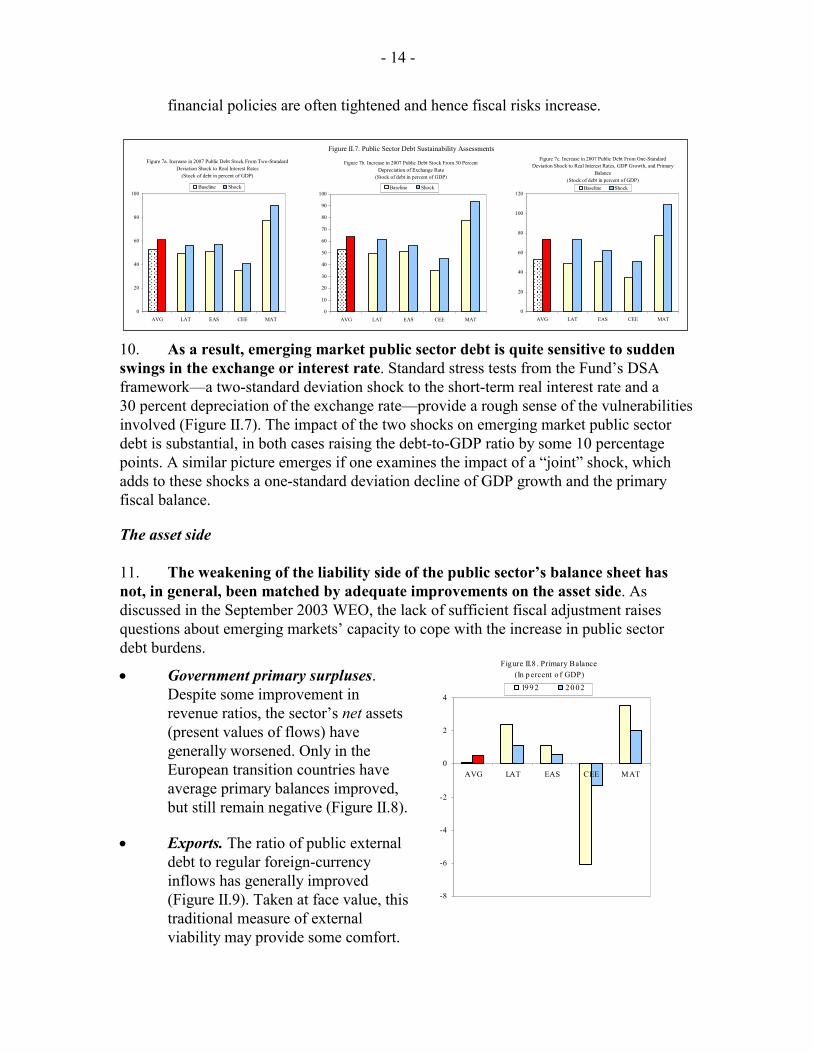
10. As a result, emerging market public sector debt is quite sensitive to sudden swings in the exchange or interest rate. Standard stress tests from the Fund’s DSA framework—a two-standard deviation shock to the short-term real interest rate and a 30 percent depreciation of the exchange rate—provide a rough sense of the vulnerabilities involved (Figure II.7). The impact of the two shocks on emerging market public sector debt is substantial, in both cases raising the debt-to-GDP ratio by some 10 percentage points. A similar picture emerges if one examines the impact of a “joint” shock, which adds to these shocks a one-standard deviation decline of GDP growth and the primary fiscal balance.
The asset side 11. The weakening of the liability side of the public sector’s balance sheet has not, in general, been matched by adequate improvements on the asset side. As discussed in the September 2003 WEO, the lack of sufficient fiscal adjustment raises questions about emerging markets’ capacity to cope with the increase in public sector debt burdens.
• Government primary surpluses. Despite some improvement in revenue ratios, the sector’s net assets (present values of flows) have generally worsened. Only in the European transition countries have average primary balances improved, but still remain negative (Figure II.8).
• Exports. The ratio of public external debt to regular foreign-currency inflows has generally improved (Figure II.9). Taken at face value, this traditional measure of external viability may provide some comfort.
Figure 7a. Increase in 2007 Public Debt Stock From Two-Standard Deviation Shock to Real Interest Rates
(Stock of debt in percent of GDP)
0
20
40
60
80
100
AVG LAT EAS CEE MAT
Baseline Shock
Figure 7c. Increase in 2007 Public Debt From One-Standard Deviation Shock to Real Interest Rates, GDP Growth, and Primary
Balance(Stock of debt in percent of GDP)
0
20
40
60
80
100
120
AVG LAT EAS CEE MAT
Baseline Shock
Figure 7b. Increase in 2007 Public Debt Stock From 30 Percent Depreciation of Exchange Rate
(Stock of debt in percent of GDP)
0
10
20
30
40
50
60
70
80
90
100
AVG LAT EAS CEE MAT
Baseline Shock
Figure II.7. Public Sector Debt Sustainability Assessments
Figure II.8 . Primary Balance(In p ercent o f GDP)
-8
-6
-4
-2
0
2
4
AVG LAT EAS CEE MAT
199 2 20 02
- 15 -
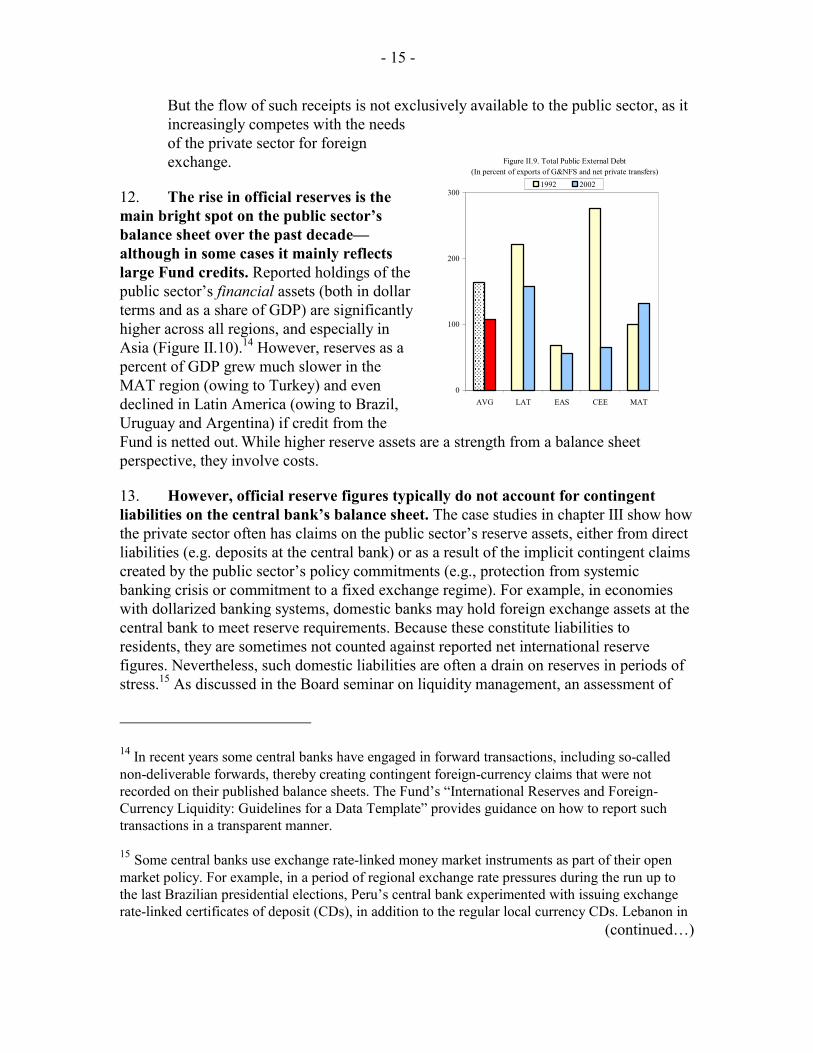
But the flow of such receipts is not exclusively available to the public sector, as it increasingly competes with the needs of the private sector for foreign exchange.
12. The rise in official reserves is the main bright spot on the public sector’s balance sheet over the past decade—although in some cases it mainly reflects large Fund credits. Reported holdings of the public sector’s financial assets (both in dollar terms and as a share of GDP) are significantly higher across all regions, and especially in Asia (Figure II.10).14 However, reserves as a percent of GDP grew much slower in the MAT region (owing to Turkey) and even declined in Latin America (owing to Brazil, Uruguay and Argentina) if credit from the Fund is netted out. While higher reserve assets are a strength from a balance sheet perspective, they involve costs.
13. However, official reserve figures typically do not account for contingent liabilities on the central bank’s balance sheet. The case studies in chapter III show how the private sector often has claims on the public sector’s reserve assets, either from direct liabilities (e.g. deposits at the central bank) or as a result of the implicit contingent claims created by the public sector’s policy commitments (e.g., protection from systemic banking crisis or commitment to a fixed exchange regime). For example, in economies with dollarized banking systems, domestic banks may hold foreign exchange assets at the central bank to meet reserve requirements. Because these constitute liabilities to residents, they are sometimes not counted against reported net international reserve figures. Nevertheless, such domestic liabilities are often a drain on reserves in periods of stress.15 As discussed in the Board seminar on liquidity management, an assessment of
14 In recent years some central banks have engaged in forward transactions, including so-called non-deliverable forwards, thereby creating contingent foreign-currency claims that were not recorded on their published balance sheets. The Fund’s “International Reserves and Foreign-Currency Liquidity: Guidelines for a Data Template” provides guidance on how to report such transactions in a transparent manner.
15 Some central banks use exchange rate-linked money market instruments as part of their open market policy. For example, in a period of regional exchange rate pressures during the run up to the last Brazilian presidential elections, Peru’s central bank experimented with issuing exchange rate-linked certificates of deposit (CDs), in addition to the regular local currency CDs. Lebanon in
(continued…)
Figure II.9. Total Public External Debt(In percent of exports of G&NFS and net private transfers)
0
100
200
300
AVG LAT EAS CEE MAT
1992 2002

- 16 -
reserve adequacy against broad measures of potential demand for foreign-currency liquidity would provide a fuller picture of vulnerabilities.
B. The Financial Sector’s Balance Sheet
14. The financial sector has grown in almost all regions, making the health of its balance sheet central to any assessment of economies’ overall resilience to shocks (Figure II.11).16 Commercial banks’ balance sheets are at the core of the allocation and transmission of risk in any economy. Maturity transformation—taking in short-term deposits to extend longer-term loans—is fundamental to financial intermediation, giving rise to the well-known risk of deposit runs. The financial systems of emerging markets
often face challenges not typically found in
advanced economies: to accommodate loan demand, banks may tap foreign credit lines; to attract depositors, banks may offer foreign-currency deposits; banks may extend domestic loans in foreign currency to match their foreign-currency liabilities; as a consequence of high public sector deficits, banks may have a large exposure to government paper. Also, supervisory frameworks and practices are often less developed than in advanced economies. On the other hand, the growth of the banking sector has in many countries been accompanied by a significant increase in foreign capital participation, which can lead to improved risk management practices. Parent banks are also a possible source of direct financial support at times of crisis.
________________________ 2003 issued high-yielding CDs denominated in domestic currency, but these could only be bought if an equivalent amount of foreign exchange was surrendered.
16 For the purposes of this paper, due to data limitation, the financial sector is synonymous with the banking sector.
Figure II.10 . Gross and Net Reserves , 1992 and 2002(In p ercent o f GDP)
0
5
10
15
20
25
30
AVG LAT EAS CEE MAT
Net reserves Fund cred it
Figure II.11. Banking Secto r Assets(In p ercent o f GDP)
0
20
40
60
80
100
120
140
AVG LAT EAS CEE MAT
199 2 200 2
- 17 -
Further, in the wake of large financial crises, and aided by the FSAP program, banking supervision has generally improved.
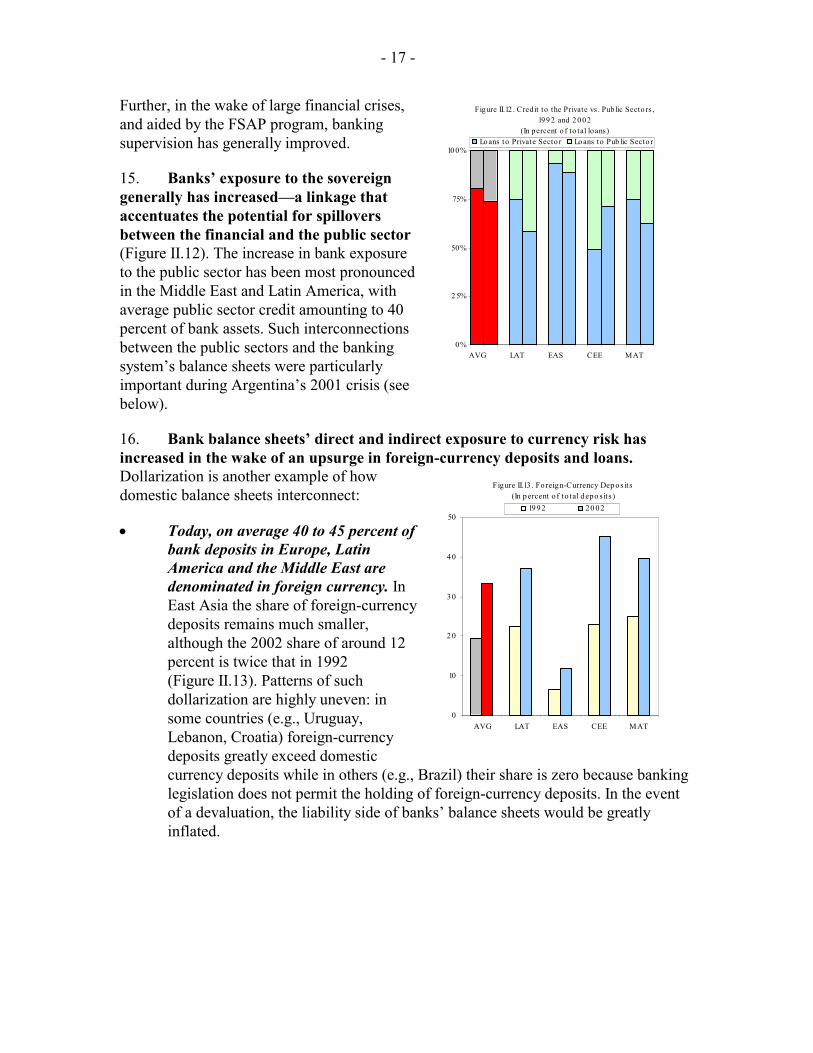
15. Banks’ exposure to the sovereign generally has increased—a linkage that accentuates the potential for spillovers between the financial and the public sector (Figure II.12). The increase in bank exposure to the public sector has been most pronounced in the Middle East and Latin America, with average public sector credit amounting to 40 percent of bank assets. Such interconnections between the public sectors and the banking system’s balance sheets were particularly important during Argentina’s 2001 crisis (see below).
16. Bank balance sheets’ direct and indirect exposure to currency risk has increased in the wake of an upsurge in foreign-currency deposits and loans. Dollarization is another example of how domestic balance sheets interconnect:
• Today, on average 40 to 45 percent of bank deposits in Europe, Latin America and the Middle East are denominated in foreign currency. In East Asia the share of foreign-currency deposits remains much smaller, although the 2002 share of around 12 percent is twice that in 1992 (Figure II.13). Patterns of such dollarization are highly uneven: in some countries (e.g., Uruguay, Lebanon, Croatia) foreign-currency deposits greatly exceed domestic currency deposits while in others (e.g., Brazil) their share is zero because banking legislation does not permit the holding of foreign-currency deposits. In the event of a devaluation, the liability side of banks’ balance sheets would be greatly inflated.
Fig ure II.12 . Cred it to the Private vs . Public Secto rs , 199 2 and 2 0 02
(In percent o f to tal loans)
0%
2 5%
50%
75%
10 0%
AVG LAT EAS CEE MAT
Lo ans to Private Secto r Lo ans to Pub lic Sector
Figure II.13 . Fo reign-Currency Dep os its(In percent o f to tal depo s its )
0
10
20
30
40
50
AVG LAT EAS CEE MAT
1992 20 02

- 18 -
• In an effort to balance their domestic foreign-currency liabilities, banks have increased their foreign-currency lending to residents (Figure II.14). Thus, most domestic foreign-currency deposits are offset by domestic foreign-currency loans, not by assets held abroad (the banking sector’s net foreign asset positions are positive, but close to balance). This implies that, in the event of an exchange rate adjustment, banks’ balance sheets crucially depend on the performance of their domestic foreign-currency loans and, ultimately, the existence of a viable export sector. Consequently, the exposure of the banking sector’s balance sheet to currency risk cannot be adequately assessed without understanding currency mismatches on the balance sheets of the nonfinancial private sector.
17. Dollarization also implies that the banking system can be the source of large foreign-currency liquidity needs in a crisis. Banks that undertake maturity transformation in foreign currency—offsetting short-term funding from domestic dollar deposits with less liquid domestic dollar-denominated loans—are vulnerable both to a run and to the risk that exchange rate fluctuations will lead to a sharp deterioration in the quality of a bank’s loan portfolio (credit risk). As the case studies in chapter III demonstrate, large positions of liquid foreign-currency assets can increase the resilience of dollarized banking systems both because they may be a source of emergency liquidity, and because these assets typically continue to perform in the event of a domestic shock. Since commercial banks’ own foreign exchange resources are often not sufficient, central banks have in many cases acted as lender of last resort—with moral hazard implications. Figure II.15 relates potential short-term foreign exchange claims (including deposits) to available liquidity buffers, including from the public sector’s balance sheet. The above-mentioned build-up of official reserves has generally improved the ability to cover potential drains. Latin America is again the exception.
C. The Nonfinancial Private Sector’s Balance Sheet
Figure II.14 . Domestic Fo reign-Currency Loans(In percent o f to tal lo ans)
0
10
20
30
40
50
AVG LAT EAS CEE MAT
1992 2001
Figure II.15. Short -Term External Deb t and Foreign-Currency Depo s its , 1992 and 2002
(In percent o f reserve assets )
0
50
100
150
200
AVG LAT EAS CEE MAT
ST external deb t FX depos its

- 19 -
18. In the nonfinancial private sector, as elsewhere, domestic debt has been replacing external debt.17 The average external debt level across regions more than halved from 40 to less that 20 percent of GDP, falling markedly in all regions except in the Middle East, Africa, Turkey group (Figure II.16). At the same time, loans from the domestic banking sector rose from 30 to 45 percent of GDP, leaving the average overall debt level almost unchanged.
19. Because a high share of domestic debt is denominated in foreign currency, the sector’s exposure to various market risks remains substantial. In 2001, the average amount of foreign-currency debt still amounted to over 30 percent of GDP—somewhat more than in 1994—of which only two-thirds constituted debt owed to nonresidents (Figure II.17).18 This foreign-currency denominated domestic debt, which is the flipside of the rise in banks’ foreign-currency loans described earlier, creates a vulnerability to currency risk among indebted households and firms. Moreover, there is evidence that it combines with rollover risk: while the overall level of the private sector’s (banks and corporations) external debt on average fell by more than half, short-term external debt declined by less than one third. This is probably the result of an increased share of external trade credit (which typically is short-term), as trade flows have increased and longer-term project financing is increasingly derived from domestic sources.
20. External assets of the nonfinancial private sector have decreased overall. Figure II.18 shows holdings of households and corporations in banks of BIS-reporting
17 Unless otherwise noted, the nonfinancial private sector includes households and corporations.
18 Data for a sufficiently large sample of countries were not available for 1992.
Figure II.16 . No nfinancial p rivate secto r deb t, 199 2 and 200 2(In percent o f GDP)
0
20
40
60
80
100
AVG LAT EAS CEE MAT
Do mest ic External
Fig ure II.17. Nonfinancial Private Secto r External Deb t and Private Domest ic Fo reign-Currency Deb t , 1994 and 2001 1/
(In percent o f GDP)
0
10
20
30
40
50
AVG LAT EAS CEE MAT
External Do mest ic fx
1/ Data availab ility fo r 1994 is subs tant ially b etter than fo r 19 92 .
- 20 -
countries. While indicative of trends, this excludes a number of important creditor countries (e.g. offshore centers) and the average again conceals some regional disparities. Specifically, the fall in average assets is driven by very large decreases in two countries—Lebanon and Panama, in the former case presumably driven by repatriations in the post-war reconstruction period. Excluding these countries, external assets in both Latin America and the Middle East, and the sample as a whole increased slightly (Figure II.18).
21. Regarding external flows on the asset side of the nonfinancial private sector, the rise in exports and remittances has almost offset increasing foreign exchange liabilities. The ratio of foreign-currency debt to exports and remittances has increased slightly from 85 percent in 1994 to 90 percent in 2001 (Figure II.19), though there are large regional discrepancies. While the ratio fell substantially in both East Asia and Central and Eastern Europe, it increased in Latin America—from already very high levels—and Middle East, Africa and Turkey, the latter largely on account of Lebanon, where foreign exchange loans increased strongly over the period. Corporations and households that have no direct foreign-currency earnings are a particular source of risk to banks in the event of a depreciation of the exchange rate. This is especially true for households, which have only limited access to hedging and foreign exchange earnings (except remittances).
22. Currency forward markets may provide corporations the opportunity to hedge their exchange rate risk. In many of the more advanced emerging market economies, markets for currency forwards or swaps exist in which corporations without sufficient foreign-currency receipts can hedge their exposure. Such off-balance sheet transactions can help to distribute the risk to those entities that can best cope with it; for example those corporations with strong export revenues, banks with long dollar positions, or the public sector. Brazil, described in detail in the next chapter, provides an example of the latter. But for the economy as a whole, such operations can only be effective if they involve non-residents as ultimate providers of short foreign-exchange exposure. Otherwise, the risk is only shifted to other balance sheets within the economy.
Figure 18 . Liab ilities o f BIS-Report ing Banks to Nonfinancial Private Secto r
(In p ercent o f GDP)
0
20
40
60
80
AVG LAT EAS CEE MAT
1992 200 2
Figure II.19 . No nfinancial Private Secto r External Deb t and Private Domestic Foreign-Currency Deb t 1/
(In p ercent o f expo rts o f G&NFS and net p rivate t ransfers )
0
20
40
60
80
100
120
140
AVG LAT EAS CEE MAT
1994 20 01
1/ Data availab ility fo r 199 4 is sub s tant ially bet ter than fo r 1992 .

- 21 -
D. Presenting Economy-Wide Vulnerabilities
23. Some of the key indicators of sectoral vulnerabilities can be summarized in a diamond-shaped chart. In principle, any of the measures of vulnerability in the public or
private sector discussed above can be used. For illustration, Figures II.20 to II.22 present some well-known metrics, including:
• Public debt as a share of revenues, as a proxy for public debt sustainability.
• Short-term debt (amortizations in one year) as a share of public sector debt, as a gauge of rollover risk in the public sector.
• External debt as a share of exports, as a proxy of external sustainability.
• Short-term debt and domestic foreign-currency deposits over reserves, as a more comprehensive measure of roll-over risk (including that related to domestic depositors) and currency risk.19
24. For all regions taken together, some vulnerabilities have increased as others have declined over the last decade, while in the past five years, vulnerabilities have unambiguously increased. In the example shown in Figure II.20, the left panel shows the situation in 2002 compared to 1992; the right panel compares 2002 with 1997.
19 Since March 2003, Moody’s has been using such an index in its ratings methodology.
So urces : World Econo mic Out lo ok, Internatio nal Financial Stat is t ics , and Glo b al Develo pment Finance.
1/ Reserve assets are the s tock of g ross reserves and fo reig n assets o f the b anking sys tem. Assumes no net o pen currency p os it io n in the banking secto r.2 / Public and pub licly-g uaranteed med ium- and long -term external d eb t .3 / The sum of exp ort s o f g o od s and no nfactor services and net p rivate trans fers in the g iven and p rio r year.
02 04 06 08 01 0 0
1 2 0
P u b lic d e b t/R e v e n u e 1 / 20 02 19 92
P ublic de bt / Re ve nue
Ext e rna l de bt / Export s 3/
P ublic ext ernal a mort iz a t ion/ De bt st oc k 2/
S T ext ernal de bt +fore ign-
c urre ncy de posit s/ Re se rve a sse t s 1/ 10 20
400
200
200 100
100
200
Figure II.20. Eco no my-Wide Vulnerabilities , Emerging Markets
P ublic de bt / Re ve nue 1/
Ext e rna l de bt / Export s 3/
02 04 06 08 01 0 0
1 2 0
P u b lic d e b t/R e v e n u e 1 /
E xte rn a l d e b t/E xp o rts 3 /
2 00 2 19 97
P ublic ext ernal a mort iz a t ion/ De bt st oc k 2/
S T ext ernal de bt +fore ign-
c urre ncy de posit s/ Re se rve a sse t s 1/ 10 20
400
200
200 100
100
200
- 22 -
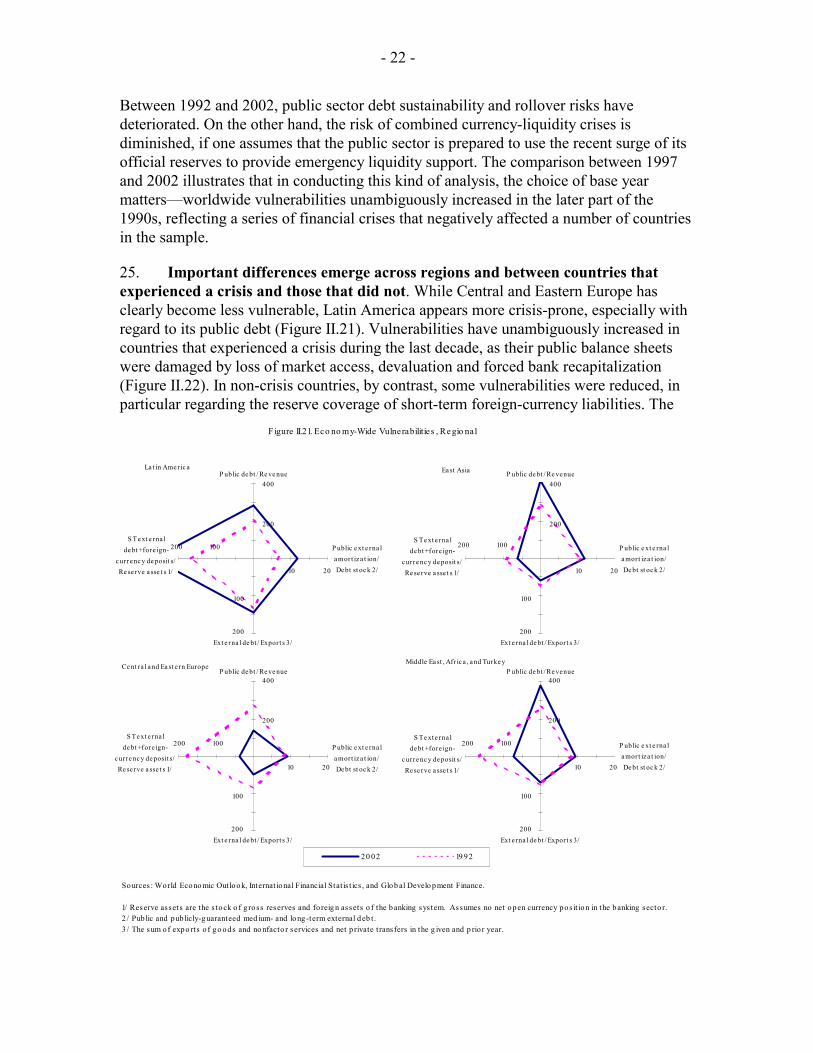
Between 1992 and 2002, public sector debt sustainability and rollover risks have deteriorated. On the other hand, the risk of combined currency-liquidity crises is diminished, if one assumes that the public sector is prepared to use the recent surge of its official reserves to provide emergency liquidity support. The comparison between 1997 and 2002 illustrates that in conducting this kind of analysis, the choice of base year matters—worldwide vulnerabilities unambiguously increased in the later part of the 1990s, reflecting a series of financial crises that negatively affected a number of countries in the sample.
25. Important differences emerge across regions and between countries that experienced a crisis and those that did not. While Central and Eastern Europe has clearly become less vulnerable, Latin America appears more crisis-prone, especially with regard to its public debt (Figure II.21). Vulnerabilities have unambiguously increased in countries that experienced a crisis during the last decade, as their public balance sheets were damaged by loss of market access, devaluation and forced bank recapitalization (Figure II.22). In non-crisis countries, by contrast, some vulnerabilities were reduced, in particular regarding the reserve coverage of short-term foreign-currency liabilities. The
Figure II.21. Eco no my-Wide Vulnerabilities , Re gio nal
02 04 06 08 01 0 0
1 2 0
P u b lic d e b t/R e v e n u e 1 /
2 0 02 19 92
Sources : World Econo mic Outlook, Internat ional Financial Stat is t ics , and Glob al Develo pment Finance.
1/ Reserve assets are the s tock o f g ross reserves and fo reig n assets o f the banking sys tem. Assumes no net open currency pos it ion in the banking secto r.2 / Pub lic and pub licly-g uaranteed med ium- and long-term external deb t.3 / The sum o f expo rts o f go ods and no nfacto r services and net p rivate t ransfers in the g iven and p rio r year.
Middle Ea st , Afr ic a , a nd Turke yP ublic de bt / Re venue
Ext e rna l de bt / Export s 3/
P ublic e xt e rna l a mort iz a t ion/ De bt st oc k 2/
S T e xt e rna l de bt +fore ign-
c urre nc y de posit s/ Re se rve a sse t s 1/ 10 20
400
200
200 100
100
200
Ce nt ra l a nd Ea st e rn EuropeP ublic de bt / Re ve nue
Ext e rna l de bt / Export s 3/
P ublic e xt e rna l a mort iz a t ion/ De bt st oc k 2/
S T e xt e rna l de bt +fore ign-
c urre nc y de posit s/ Re se rve a sse t s 1/ 10 20
400
200
200 100
100
200
La t in Ame ric aP ublic de bt / Re ve nue
Ext e rna l de bt / Export s 3/
P ublic e xt e rna l a mort iz a t ion/ De bt st oc k 2/
S T e xt e rna l de bt +fore ign-
c urrenc y de posit s/ Re se rve a sse t s 1/ 10 20
400
200
200 100
100
200
Ea st Asia P ublic de bt / Re venue
Ext e rna l de bt / Export s 3/
P ublic e xt e rna l a mort iz a t ion/ De bt st oc k 2/
S T e xt e rna l de bt +fore ign-
c urre nc y de posit s/ Re se rve a sse t s 1/ 10 20
400
200
200 100
100
200

- 23 -
case studies in the next chapter will further highlight balance sheet developments in crisis and non-crisis countries.
26. Caution is in order when interpreting any such set of vulnerability indicators. The comparison between 1992 and 2002 may overlook recent trends, and the choice of indicators may not capture important balance sheet vulnerabilities. For example, the unequivocal improvement in Central and Eastern Europe, as measured by the metrics chosen, could well mask the risks associated with the credit booms, current account widenings and rigid exchange rate regimes recently observed in these countries. The purpose of Figures II.20 - II.22 is therefore not to assess the present probability of crises in individual countries or regions—this is done much more accurately in the Fund's internal vulnerability exercise—but rather to propose a way of presenting balance sheet risks across time and countries.
III. BALANCE SHEET DEVELOPMENTS IN RECENT FINANCIAL CRISES: SOME COUNTRY EXAMPLES
27. This chapter takes a closer look at some recent crisis and near-crisis episodes in emerging market countries. The purpose is to show how an analysis of sectoral balance sheet relationships can help explain why some countries have experienced financial crises, while others have not. None of the country experiences detailed below is intended to represent an exhaustive account of that particular crisis, especially macroeconomic developments and the authorities’ fiscal and monetary policies, which are well-documented elsewhere. Rather, each example focuses on one salient feature of a country’s experience that can be best understood by looking at it through the prism of the balance sheet approach.
Figure II.22. Vulnerabilitie s in Cris is and No n-Cris is Co untries 1/
Sources : World Econo mic Outlook, Internat io nal Financial Stat is t ics , and Global Develo pment Finance.
1/ Cris is cases include Argent ina, Brazil, Ecuad or, Indo nes ia, Ko rea, Mexico , Philipp ines , Russ ia, Thailand , Turkey, and Uruguay.2 / Reserve assets are the s tock o f g ross reserves and fo reign assets o f the b anking sys tem. Assumes no net op en currency pos it ion in the b anking secto r.3 / Pub lic and pub licly-g uaranteed med ium- and long-term external deb t.4 / The sum o f expo rts o f go ods and nonfacto r services and net p rivate t ransfers in the g iven and p rio r year.
02 04 06 08 01 0 0
1 2 0
P u b lic d e b t/R e v e n u e 1 /
2 0 02 19 92
Crisis Ca se sP ublic de bt / Re ve nue
Ext e rna l de bt / Export s 4/
P ublic e xt e rna l a mort iz a t ion/ De bt st oc k 3/
S T e xt e rna l de bt +fore ign-
c urre nc y de posit s/ Re se rve a sse t s 2/ 10 20
400
200
200 100
100
200
Non-Crisis Ca se sP ublic de bt / Re ve nue
Ext e rna l de bt / Export s 4/
P ublic e xt e rna l a mort iz a t ion/ De bt st oc k 3/
S T e xt e rna l de bt +fore ign-
c urre nc y de posit s/ Re se rve a sse t s 2/ 10 20
400
200
200 100
100
200

- 24 -
A. Argentina: How Weaknesses in Private Sector Balance Sheets Contributed to the Crisis of 2001-0220
28. The causes of Argentina’s crisis extended to the weaknesses in the private sector’s balance sheets. Most attention rightly has focused on inconsistencies between Argentina’s fiscal and exchange rate policies, its difficulties carrying out sufficient fiscal adjustment during a prolonged recession, weaknesses in the public-sector balance sheet, and the government’s large stock of foreign-currency debt. However, these problems, which have been discussed in past staff papers, were compounded by the poor management of bank and corporate balance sheets in the context of the pegged exchange rate.21 The balance sheet approach can help to explain how vulnerabilities in the private sector augmented the underlying weaknesses in Argentina’s public sector, and also contributed to the depth of its crisis in 2001–02.
29. Currency mismatches in the private sector were severe. The private sector’s foreign-currency denominated debt was larger, in relation to exports, than in the late-1990s Asian crisis cases, crises that famously originated outside the government. This is partly due to Argentina’s lower export-to-GDP ratio, but also because its banks needed to lend in foreign currency to match their domestic foreign-currency deposits, adding to the mismatch created by external borrowing (Table III.A.1).22 At end-2000, Argentine firms had borrowed US$37 billion externally and are estimated to have borrowed an additional US$30 billion in foreign currency from the domestic banking system—a large exposure in relation to Argentina’s US$31 billion in annual exports of goods and services.23
30. Resident banks’ foreign-currency denominated lending left them exposed to a devaluation even if the government could have avoided outright default. The real burden of the dollar-denominated debts of private firms was sure to increase if either the currency board could not be sustained or a period of prolonged deflation was needed to bring about the necessary real exchange rate adjustment.24 As in Asia, the financial
20 Primarily drafted by Brad Setser.
21 For example, “Lessons from the Crisis in Argentina” (SM/03/345).
22 Given the relatively small size of the tradeables sector and the high degree of dollarization, the convertibility regime left banks with few other options. Nevertheless, this mismatch might have been reduced, but not eliminated if banks had instead invested foreign-currency deposits in low risk externally-issued securities.
23 Although Argentina’s supervisory and regulatory framework were viewed as some of the strongest in the region prior to the crisis, prudential indicators failed to take account of the banking sector’s increasing exposure to the nontradeables sector.
24 Roubini (2001).

- 25 -
difficulties of private firms in turn would weaken the banking system. Moreover, the small size of Argentina’s export sector meant that there were few sellers of protection against exchange rate shocks, making it difficult for corporates to hedge.25
31. Argentina lost more reserves in 2001 as a result of a bank run than as a result of the government’s inability to access external markets to meet its financing
25 Some privatized utilities had the ability to index their local prices to the dollar and to raise prices in line with U.S. inflation. This protected against both real depreciation through falling domestic prices and a nominal depreciation—but the viability of such a hedge hinged on the political will to pass the currency mismatch onto the utilities’ consumers. In 2002, after the devaluation, the government decided to freeze utility prices, which broke this regulatory hedge.
Argentina Thailand Korea Brazil Uruguay2000 1996 1996 2001 2001
Foreign-currency debt to domestic banks 1/ 30.1 32.1 32.0 21.4 5.3Foreign-currency debt to external creditors 36.9 61.8 28.3 69.8 1.2Total foreign-currency debt 67.0 93.9 60.3 91.2 6.5
Exports (goods and services) 31.4 71.4 153.4 67.6 3.3GDP 284.2 180.1 495.7 517.3 18.6
Foreign-currency debt to exports (in percent) 213 132 39 135 199Foreign-currency debt to GDP (in percent) 24 52 12 18 35
External foreign-currency debt to exports (in percent) 118 87 18 103 37External foreign-currency debt to GDP (in percent) 13 34 6 13 6
External debt of banking system and firms 61 114 94 108 ... as percent of GDP 21 63 19 21 ... as percent of exports 194 160 61 159 ...
Memorandum items: Domestic foreign-currency deposits 48.5 ... ... ... 5.2 External debt of the banking system 2/ 24.1 52.1 65.9 37.9 ... External assets of the banking system ... ... 33.9 16.5 ... Stock of government foreign-currency debt sold as hedge ... ... ... 73.6 ...
Sources: Argentina, GOA and BCRA data; Thailand, WP/02/210; Korea BIS and IMF data; Brazil,GOB external debt data and IMF; Uruguay, BCU domestic data and WEO external debt.1/ For Brazil and Korea, upper bound estimates (external debt of banking system - external assets).2/ Thai numbers include debt of finance companies.
Table III.A.1. Argentina: Foreign-Currency Denominated Debt of the Corporate Sector
Corporate foreign-currency debt
(In billions of U.S. dollars unless otherwise indicated)
- 26 -
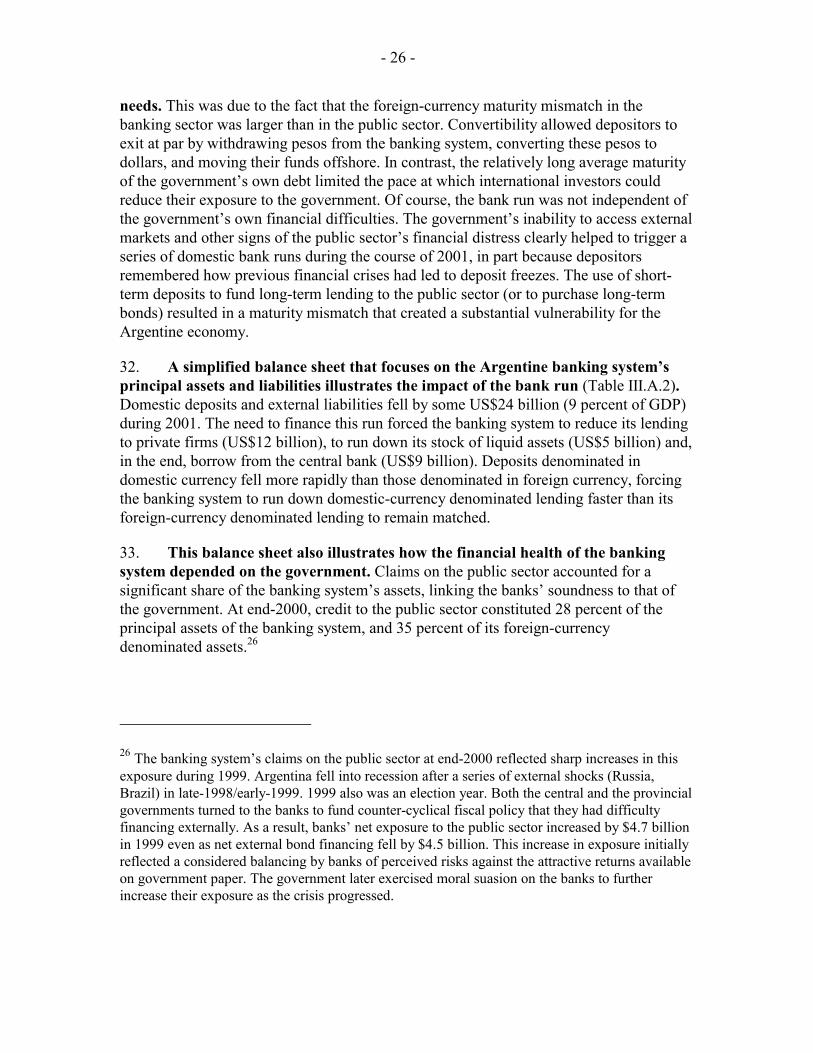
needs. This was due to the fact that the foreign-currency maturity mismatch in the banking sector was larger than in the public sector. Convertibility allowed depositors to exit at par by withdrawing pesos from the banking system, converting these pesos to dollars, and moving their funds offshore. In contrast, the relatively long average maturity of the government’s own debt limited the pace at which international investors could reduce their exposure to the government. Of course, the bank run was not independent of the government’s own financial difficulties. The government’s inability to access external markets and other signs of the public sector’s financial distress clearly helped to trigger a series of domestic bank runs during the course of 2001, in part because depositors remembered how previous financial crises had led to deposit freezes. The use of short-term deposits to fund long-term lending to the public sector (or to purchase long-term bonds) resulted in a maturity mismatch that created a substantial vulnerability for the Argentine economy.
32. A simplified balance sheet that focuses on the Argentine banking system’s principal assets and liabilities illustrates the impact of the bank run (Table III.A.2). Domestic deposits and external liabilities fell by some US$24 billion (9 percent of GDP) during 2001. The need to finance this run forced the banking system to reduce its lending to private firms (US$12 billion), to run down its stock of liquid assets (US$5 billion) and, in the end, borrow from the central bank (US$9 billion). Deposits denominated in domestic currency fell more rapidly than those denominated in foreign currency, forcing the banking system to run down domestic-currency denominated lending faster than its foreign-currency denominated lending to remain matched.
33. This balance sheet also illustrates how the financial health of the banking system depended on the government. Claims on the public sector accounted for a significant share of the banking system’s assets, linking the banks’ soundness to that of the government. At end-2000, credit to the public sector constituted 28 percent of the principal assets of the banking system, and 35 percent of its foreign-currency denominated assets.26
26 The banking system’s claims on the public sector at end-2000 reflected sharp increases in this exposure during 1999. Argentina fell into recession after a series of external shocks (Russia, Brazil) in late-1998/early-1999. 1999 also was an election year. Both the central and the provincial governments turned to the banks to fund counter-cyclical fiscal policy that they had difficulty financing externally. As a result, banks’ net exposure to the public sector increased by $4.7 billion in 1999 even as net external bond financing fell by $4.5 billion. This increase in exposure initially reflected a considered balancing by banks of perceived risks against the attractive returns available on government paper. The government later exercised moral suasion on the banks to further increase their exposure as the crisis progressed.
- 27 -
34. The government was in no position in 2001 to help the banks manage a run—to the contrary, it was looking to the banking system for help to manage its own liquidity shortage. The government needed to refinance US$19.3 billion in maturing debt, including US$5.8 billion in payments to external bondholders, as well as to finance its ongoing deficit. The government could not draw on the central bank’s reserves to help meet its own liquidity needs, owing to the currency board, and it lacked its own stock of reserve assets; it therefore needed the domestic banking system both to roll over its maturing claims on the government and to supply the government with additional
End–1998 End–1999 End–2000 End–2001
Principal assets
Cash and liquid assets 8.4 8.4 8.3 3.4Domestic currency 2.9 2.8 2.5 1.9Foreign-currency and liquid assets 5.5 5.6 5.9 1.5
Loans to and securities issued by the public sector 23.5 28.2 28.7 30.1Domestic currency 4.8 5.5 3.7 3.4Foreign currency 18.7 22.7 25.0 26.7
Loans to and securities issued by the private sector 70.5 68.4 65.8 54.2Domestic currency 26.9 25.9 25.0 15.0Foreign currency 43.7 42.5 40.9 39.1
SubtotalsDomestic-currency assets 34.5 34.2 31.2 20.3Foreign-currency assets 68.0 70.8 71.7 67.3
Total assets 102.5 105.0 102.9 87.6
Principal liabilities
Deposits 77.3 79.9 83.2 67.3Domestic currency 37.3 35.8 34.7 21.7Foreign currency 40.0 44.2 48.5 45.6
External obligations 21.4 22.8 24.1 16.3Domestic currency 0.5 0.5 0.4 0.1Foreign currency 20.9 22.2 23.7 16.2
SubtotalsDomestic-currency liabilities 37.8 36.3 35.1 21.7Foreign-currency liabilities 60.9 66.4 72.2 61.8
Total liabilities 98.7 102.7 107.3 83.5
Central bank support 0.3 0.2 0.1 9.2Domestic currency 0.3 0.2 0.0 4.1Foreign currency 1/ 0.1 5.1
Liabilities, including liabilities to central bank 99.0 103.0 107.5 92.7
Table III.A.2. Argentina: Principal Assets and Liabilities of the Banking System
- 28 -
financing.27 However, the ongoing flight of bank deposits constrained the banking system’s ability to help finance the government, particularly after the first quarter of 2001.
35. The ability of the banking system to withstand a twin shock of default and devaluation was substantially reduced by the need to finance deposit outflows during 2001. The banks could not reduce their exposure to the government to help finance the deposit outflow without triggering a crisis. Consequently, they had to draw down their own external assets to finance both the deposit outflow and the fall in external credit lines (and to a lesser extent, to finance a small increase in banks’ aggregate exposure to the government). This eliminated an asset that would continue to perform in the event of default and devaluation. The banks also had to cut their loans denominated in domestic currency to remain matched, even though such loans were more likely to continue to perform in the event of a devaluation than foreign-currency loans. As the banking system shrank in the face of the run, an increasing share of banks’ remaining assets became illiquid foreign-currency denominated claims on the government (US$26.7 billion at end-2001) and on firms that lacked sufficient export revenue to finance these claims (US$39.1 billion at end-2001). Overall, the currency maturity mismatch was substantial (Figure III.A.1).
36. The changes in the balance sheet of the banking system during the course of 2001 illustrate the costs of delaying a debt restructuring. It is unclear if banks could have withstood the shock of a restructuring and devaluation at the end of 2000, but the chances of avoiding a generalized banking crisis declined substantially during the course of 2001. This is not to say that government recourse to banks was necessarily wrong ex ante. The dangers of weakening the banks’ balance sheet to help tide a cash-strapped government through a crisis had to be traded off against the need to tap all available sources of financing to prevent a deepening of the crisis.
27 The government also looked to domestic pension funds for financial assistance. These funds were investing a large fraction of new inflows in new government debt issues and, in the context of a large-scale swap operation in June 2001, agreed to capitalize all interest payments on their existing holdings of long-term bonds.
32.8 32.8
-41
-89.5
-8.2
-56.7
Maturity mismatch in external position Maturity mismatch in foreign-currency (incl.domestic foreign-currency deposits)
Liquid assets Short-term liabilities Mismatch
Figure III.A.1. Argentina: Maturity Mismatches: With and Without Foreign-Currency Deposits(In billions of U.S. dollars)
32.8 32.8
-41
-89.5
-8.2
-56.7
32.8 32.8
-41
-89.5
-8.2
-56.7
Maturity mismatch in external position Maturity mismatch in foreign-currency (incl.domestic foreign-currency deposits)
Liquid assets Short-term liabilities MismatchLiquid assets Short-term liabilities Mismatch
Figure III.A.1. Argentina: Maturity Mismatches: With and Without Foreign-Currency Deposits(In billions of U.S. dollars)
- 29 -
37. The authorities ended up addressing Argentina’s internal balance sheet mismatch through pesification.28 In 2003, both the banks’ liabilities and their assets were converted into local currency, though at different rates. While the banking system’s assets were converted at parity, liabilities were exchanged at 1.4 pesos for each U.S. dollar. This allowed non-performing dollar assets to be quickly replaced with performing peso assets. Although nonperforming assets did emerge, pesification likely dampened the debt servicing difficulties that would have resulted had these private-sector debts to the banks remained in U.S. dollars. Pesification also allowed the central bank to supply large amounts of liquidity support to the banking system. But like all across-the-board solutions, pesification traded equity for efficiency—and prior to the issuance of compensation bonds to close most of the financial losses created by pesification, the asymmetric rates at which the banking system’s assets and liabilities were pesified also imposed large losses on banks’ shareholders. The issuance of compensation bonds, though, added to the government’s domestic debt burden and further weakened its own balance sheet.
38. Argentina demonstrates how close examination of domestic balance sheets can highlight key vulnerabilities, particularly when combined with readily available external debt data. Two insights stand out: First, the banking system’s foreign-currency exposure to the private sector substantially exceeded its exposure to the government. Rather than being a source of strength, this was a potential weakness, given the small size of the export sector and extensive lending to firms in the non-tradeables sector. Any government debt crisis that resulted in a devaluation was therefore likely to be combined with an Asian-style bank-corporate crisis. Secondly, drawing on the banking system to help tide the government through a liquidity crisis can increase the risk of a deposit run, and particularly in the context of a fixed exchange rate, may lead to very large reserve losses. In highlighting these additional facets of the crisis in Argentina, the balance sheet approach underscores the role played by domestic private-sector balance sheet mismatches in augmenting Argentina’s vulnerabilities.
B. Uruguay: How a Run on Banks Led to a Sovereign Debt Crisis29
39. Uruguay’s 2002 financial crisis began with a run by liquidity-constrained Argentines on nonresident foreign-currency deposits. While the crisis is sometimes, therefore, seen as a pure product of contagion that gained momentum when the exchange-
28 External debts could not be pesified. Both the government of Argentina and many Argentine firms are in the process of renegotiating their external debt. The government is servicing its domestic peso debts even though it is in default on its external debt; firms, however, cannot pay their domestic creditors while they are in default on their external debt. Many firms consequently have been putting funds into domestic escrow accounts.
29 Primarily drafted by Brett House.

- 30 -
rate regime was loosened in June 2002, a simplified balance sheet analysis highlights the crucial role that asymmetries in the banking sector played in raising doubts about the government’s capacity both to service its debt and to support the banking system—doubts that led to the loss of Uruguay’s investment–grade status and eventually forced the liquidity-constrained government to undertake a preemptive debt restructuring. This section traces how Uruguay’s crisis cascaded from the financial sector to the public sector’s balance sheet.
40. Uruguay’s relatively strong economic performance throughout the 1990s masked an accumulation of balance-sheet weaknesses in the banking sector. With total bank deposits at about 90 percent of GDP, Uruguay’s banking system was large for an emerging economy of its size. At end-2001 the sector was marked by:
• A high degree of dollarization. At end-2001, nearly 90 percent of deposits and over 70 percent of loans were denominated in U.S. dollars (Figure III.B.1).
• Substantial nonresident deposits. Nonresident deposits, mainly from Argentina, accounted for nearly half of total liabilities (Table III.B.1). Most of these deposits were denominated in U.S. dollars.
• Relatively balanced system-wide external foreign-currency assets and liabilities. Total nonresident borrowing amounted to US$6.6 billion, which, combined with US$1.4 billion in foreign reserves deposited at the central bank, broadly matched the US$7.9 billion in nonresident foreign-currency deposits (Figure III.B.2). Nevertheless, the quality of these assets was not uniform and, in practice, the match of external foreign-currency assets and liabilities may not have been as clear as this accounting exercise implies.
Table III.B.1 Uruguay: Deposit Structure, by Residency(In percent of total)
End-2000 End-2001 End-2002
Residents 56 54 63Nonresidents 44 46 37
Source: Central Bank of Uruguay
Figure III.B.1 Uruguay: Dollarization of Deposits and Loans(In percent of total)
0
10
20
30
40
50
60
70
80
90
1994 1995 1996 1997 1998 1999 2000 2001 2002
Deposits Loans
Figure III.B.2 Uruguay: System-Wide Foreign-Currency Balance Sheet(In billions of U.S. dollars)
14.3
8.06.3
-15.7
-7.9 -7.8
-1.4
0.0
-1.5
System-wide Nonresident Resident
Assets Liabilities Mismatch
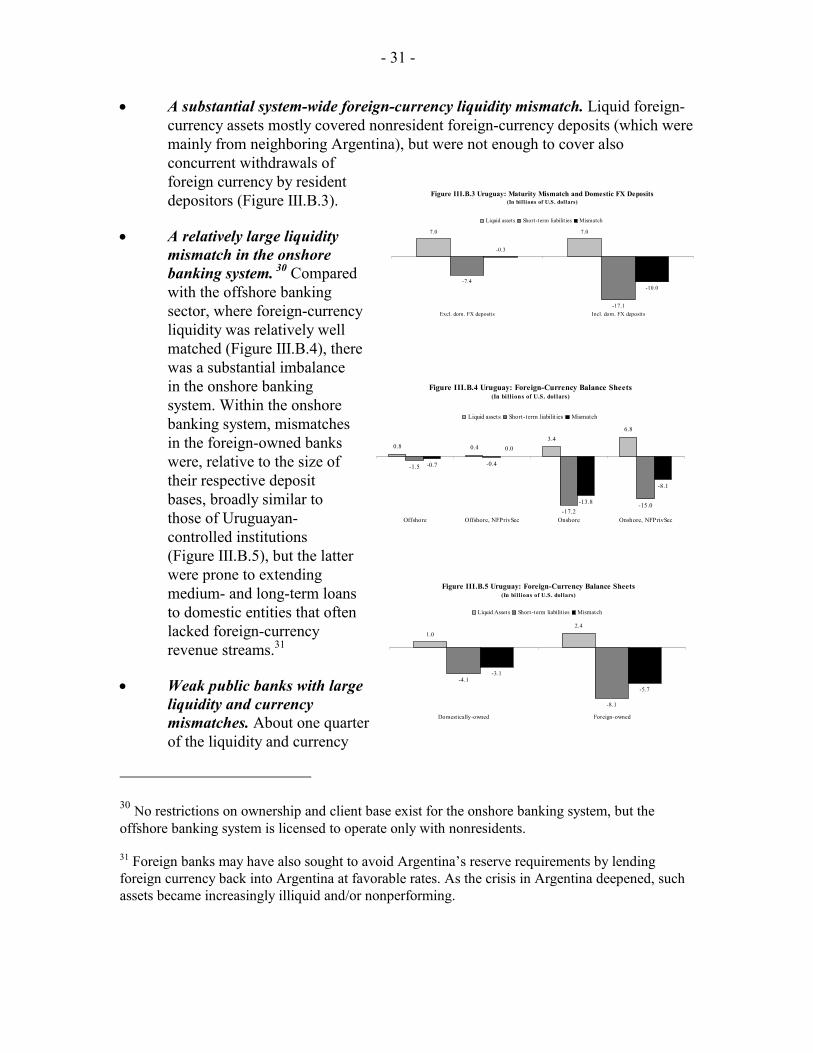
- 31 -
• A substantial system-wide foreign-currency liquidity mismatch. Liquid foreign-currency assets mostly covered nonresident foreign-currency deposits (which were mainly from neighboring Argentina), but were not enough to cover also concurrent withdrawals of foreign currency by resident depositors (Figure III.B.3).
• A relatively large liquidity mismatch in the onshore banking system. 30 Compared with the offshore banking sector, where foreign-currency liquidity was relatively well matched (Figure III.B.4), there was a substantial imbalance in the onshore banking system. Within the onshore banking system, mismatches in the foreign-owned banks were, relative to the size of their respective deposit bases, broadly similar to those of Uruguayan-controlled institutions (Figure III.B.5), but the latter were prone to extending medium- and long-term loans to domestic entities that often lacked foreign-currency revenue streams.31
• Weak public banks with large liquidity and currency mismatches. About one quarter of the liquidity and currency
30 No restrictions on ownership and client base exist for the onshore banking system, but the offshore banking system is licensed to operate only with nonresidents.
31 Foreign banks may have also sought to avoid Argentina’s reserve requirements by lending foreign currency back into Argentina at favorable rates. As the crisis in Argentina deepened, such assets became increasingly illiquid and/or nonperforming.
Figure III.B.3 Uruguay: Maturity Mismatch and Domestic FX Deposits(In bill ions of U.S. dollars)
7.0 7.0
-7.4
-17.1
-0.3
-10.0
Excl. dom. FX deposits Incl. dom. FX deposits
Liquid assets Short-term liabilit ies Mismatch
Figure III.B.4 Uruguay: Foreign-Currency Balance Sheets(In bi llions of U.S. dol lars)
0.8 0.43.4
6.8
-1.5 -0.4
-17.2-15.0
-0.7
0.0
-13.8
-8.1
Offshore Offshore, NFPrivSec Onshore Onshore, NFPrivSec
Liquid assets Short-term liabilit ies Mismatch
Figure III.B.5 Uruguay: Foreign-Currency Balance Sheets(In bi ll ions of U.S. dol lars)
1.02.4
-4.1
-8.1
-3.1
-5.7
Domest ically-owned Foreign-owned
Liquid Assets Short-term liabilit ies Mismatch
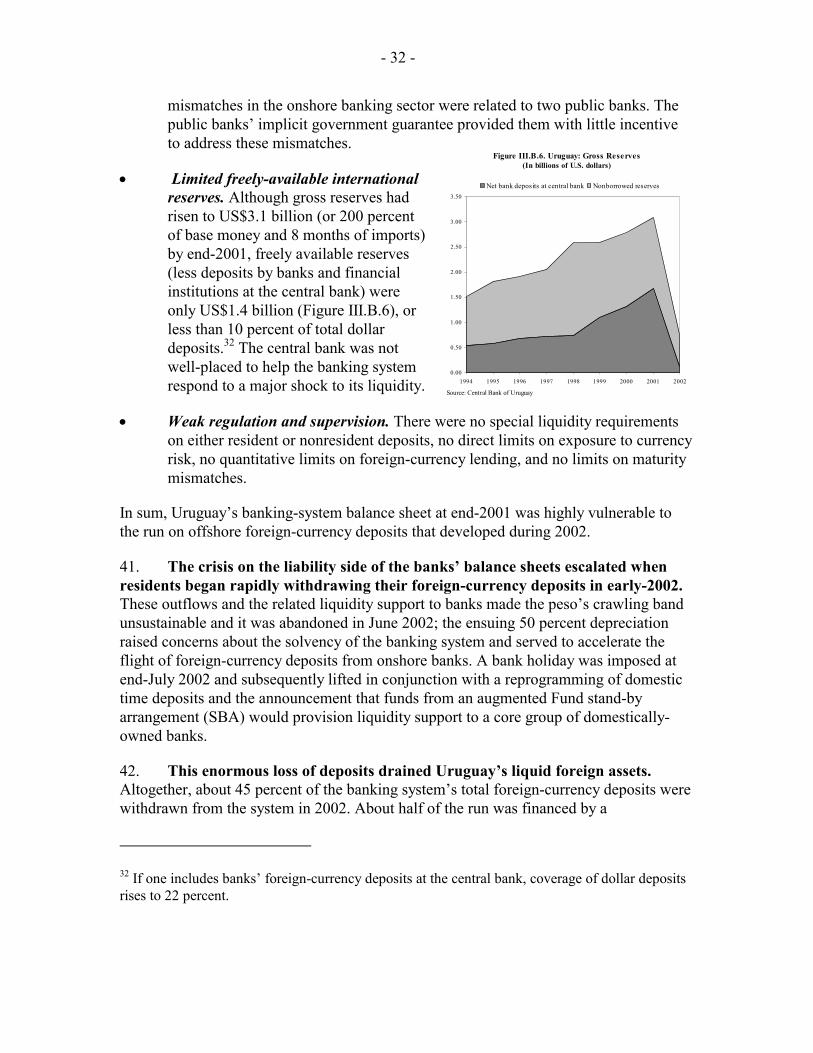
- 32 -
mismatches in the onshore banking sector were related to two public banks. The public banks’ implicit government guarantee provided them with little incentive to address these mismatches.
• Limited freely-available international reserves. Although gross reserves had risen to US$3.1 billion (or 200 percent of base money and 8 months of imports) by end-2001, freely available reserves (less deposits by banks and financial institutions at the central bank) were only US$1.4 billion (Figure III.B.6), or less than 10 percent of total dollar deposits.32 The central bank was not well-placed to help the banking system respond to a major shock to its liquidity.
• Weak regulation and supervision. There were no special liquidity requirements on either resident or nonresident deposits, no direct limits on exposure to currency risk, no quantitative limits on foreign-currency lending, and no limits on maturity mismatches.
In sum, Uruguay’s banking-system balance sheet at end-2001 was highly vulnerable to the run on offshore foreign-currency deposits that developed during 2002.
41. The crisis on the liability side of the banks’ balance sheets escalated when residents began rapidly withdrawing their foreign-currency deposits in early-2002. These outflows and the related liquidity support to banks made the peso’s crawling band unsustainable and it was abandoned in June 2002; the ensuing 50 percent depreciation raised concerns about the solvency of the banking system and served to accelerate the flight of foreign-currency deposits from onshore banks. A bank holiday was imposed at end-July 2002 and subsequently lifted in conjunction with a reprogramming of domestic time deposits and the announcement that funds from an augmented Fund stand-by arrangement (SBA) would provision liquidity support to a core group of domestically-owned banks.
42. This enormous loss of deposits drained Uruguay’s liquid foreign assets. Altogether, about 45 percent of the banking system’s total foreign-currency deposits were withdrawn from the system in 2002. About half of the run was financed by a
32 If one includes banks’ foreign-currency deposits at the central bank, coverage of dollar deposits rises to 22 percent.
Figure III.B.6. Uruguay: Gross Reserves(In billions of U.S. dollars)
0.00
0.50
1.00
1.50
2.00
2.50
3.00
3.50
1994 1995 1996 1997 1998 1999 2000 2001 2002
Net bank deposits at central bank Nonborrowed reserves
Source: Central Bank of Uruguay
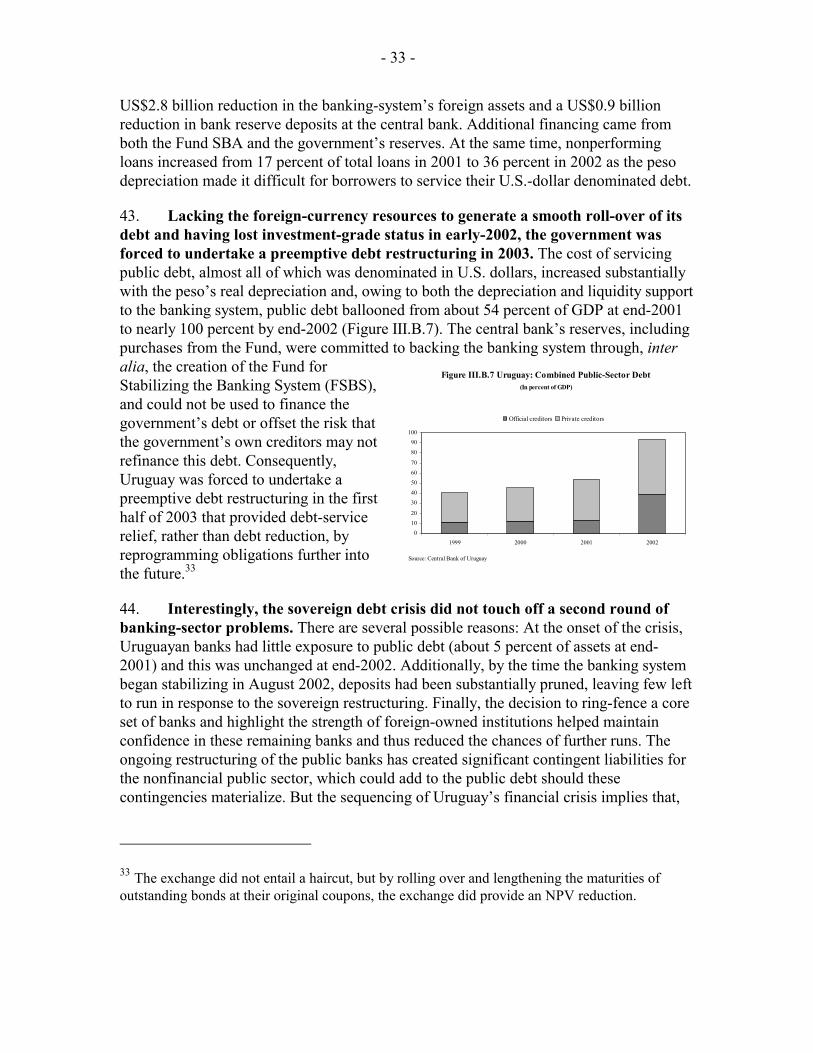
- 33 -
US$2.8 billion reduction in the banking-system’s foreign assets and a US$0.9 billion reduction in bank reserve deposits at the central bank. Additional financing came from both the Fund SBA and the government’s reserves. At the same time, nonperforming loans increased from 17 percent of total loans in 2001 to 36 percent in 2002 as the peso depreciation made it difficult for borrowers to service their U.S.-dollar denominated debt.
43. Lacking the foreign-currency resources to generate a smooth roll-over of its debt and having lost investment-grade status in early-2002, the government was forced to undertake a preemptive debt restructuring in 2003. The cost of servicing public debt, almost all of which was denominated in U.S. dollars, increased substantially with the peso’s real depreciation and, owing to both the depreciation and liquidity support to the banking system, public debt ballooned from about 54 percent of GDP at end-2001 to nearly 100 percent by end-2002 (Figure III.B.7). The central bank’s reserves, including purchases from the Fund, were committed to backing the banking system through, inter alia, the creation of the Fund for Stabilizing the Banking System (FSBS), and could not be used to finance the government’s debt or offset the risk that the government’s own creditors may not refinance this debt. Consequently, Uruguay was forced to undertake a preemptive debt restructuring in the first half of 2003 that provided debt-service relief, rather than debt reduction, by reprogramming obligations further into the future.33
44. Interestingly, the sovereign debt crisis did not touch off a second round of banking-sector problems. There are several possible reasons: At the onset of the crisis, Uruguayan banks had little exposure to public debt (about 5 percent of assets at end-2001) and this was unchanged at end-2002. Additionally, by the time the banking system began stabilizing in August 2002, deposits had been substantially pruned, leaving few left to run in response to the sovereign restructuring. Finally, the decision to ring-fence a core set of banks and highlight the strength of foreign-owned institutions helped maintain confidence in these remaining banks and thus reduced the chances of further runs. The ongoing restructuring of the public banks has created significant contingent liabilities for the nonfinancial public sector, which could add to the public debt should these contingencies materialize. But the sequencing of Uruguay’s financial crisis implies that,
33 The exchange did not entail a haircut, but by rolling over and lengthening the maturities of outstanding bonds at their original coupons, the exchange did provide an NPV reduction.
Figure III.B.7 Uruguay: Combined Public-Sector Debt(In percent of GDP)
0
10
20
30
40
50
60
70
80
90
100
1999 2000 2001 2002
Official creditors Private creditors
Source: Central Bank of Uruguay
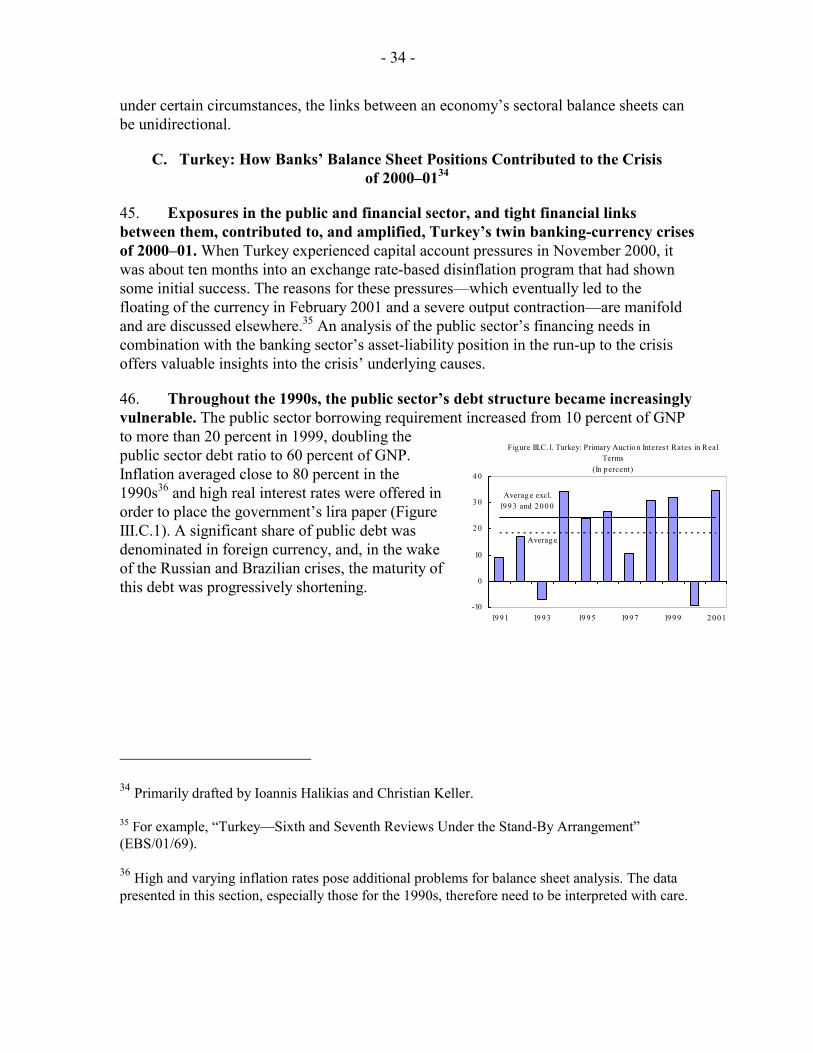
- 34 -
under certain circumstances, the links between an economy’s sectoral balance sheets can be unidirectional.
C. Turkey: How Banks’ Balance Sheet Positions Contributed to the Crisis of 2000–0134
45. Exposures in the public and financial sector, and tight financial links between them, contributed to, and amplified, Turkey’s twin banking-currency crises of 2000–01. When Turkey experienced capital account pressures in November 2000, it was about ten months into an exchange rate-based disinflation program that had shown some initial success. The reasons for these pressures—which eventually led to the floating of the currency in February 2001 and a severe output contraction—are manifold and are discussed elsewhere.35 An analysis of the public sector’s financing needs in combination with the banking sector’s asset-liability position in the run-up to the crisis offers valuable insights into the crisis’ underlying causes.
46. Throughout the 1990s, the public sector’s debt structure became increasingly vulnerable. The public sector borrowing requirement increased from 10 percent of GNP to more than 20 percent in 1999, doubling the public sector debt ratio to 60 percent of GNP. Inflation averaged close to 80 percent in the 1990s36 and high real interest rates were offered in order to place the government’s lira paper (Figure III.C.1). A significant share of public debt was denominated in foreign currency, and, in the wake of the Russian and Brazilian crises, the maturity of this debt was progressively shortening.
34 Primarily drafted by Ioannis Halikias and Christian Keller.
35 For example, “Turkey—Sixth and Seventh Reviews Under the Stand-By Arrangement” (EBS/01/69).
36 High and varying inflation rates pose additional problems for balance sheet analysis. The data presented in this section, especially those for the 1990s, therefore need to be interpreted with care.
Figure III.C.1. Turkey: Primary Auction Interes t Rates in Real Terms
(In percent)
-10
0
10
2 0
3 0
4 0
1991 19 93 19 95 199 7 1999 2001
Averag e excl. 1993 and 200 0
Averag e
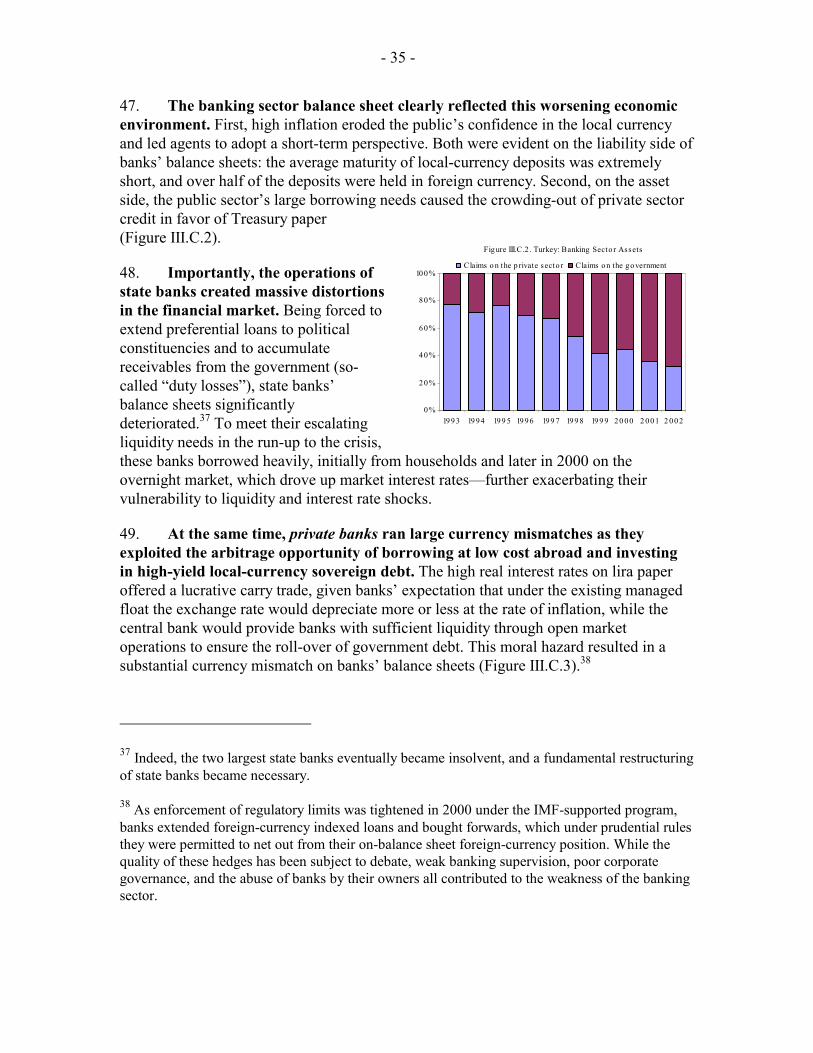
- 35 -
47. The banking sector balance sheet clearly reflected this worsening economic environment. First, high inflation eroded the public’s confidence in the local currency and led agents to adopt a short-term perspective. Both were evident on the liability side of banks’ balance sheets: the average maturity of local-currency deposits was extremely short, and over half of the deposits were held in foreign currency. Second, on the asset side, the public sector’s large borrowing needs caused the crowding-out of private sector credit in favor of Treasury paper (Figure III.C.2).
48. Importantly, the operations of state banks created massive distortions in the financial market. Being forced to extend preferential loans to political constituencies and to accumulate receivables from the government (so-called “duty losses”), state banks’ balance sheets significantly deteriorated.37 To meet their escalating liquidity needs in the run-up to the crisis, these banks borrowed heavily, initially from households and later in 2000 on the overnight market, which drove up market interest rates—further exacerbating their vulnerability to liquidity and interest rate shocks.
49. At the same time, private banks ran large currency mismatches as they exploited the arbitrage opportunity of borrowing at low cost abroad and investing in high-yield local-currency sovereign debt. The high real interest rates on lira paper offered a lucrative carry trade, given banks’ expectation that under the existing managed float the exchange rate would depreciate more or less at the rate of inflation, while the central bank would provide banks with sufficient liquidity through open market operations to ensure the roll-over of government debt. This moral hazard resulted in a substantial currency mismatch on banks’ balance sheets (Figure III.C.3).38
37 Indeed, the two largest state banks eventually became insolvent, and a fundamental restructuring of state banks became necessary.
38 As enforcement of regulatory limits was tightened in 2000 under the IMF-supported program, banks extended foreign-currency indexed loans and bought forwards, which under prudential rules they were permitted to net out from their on-balance sheet foreign-currency position. While the quality of these hedges has been subject to debate, weak banking supervision, poor corporate governance, and the abuse of banks by their owners all contributed to the weakness of the banking sector.
Figure III.C.2 . Turkey: Banking Secto r Assets
0%
20%
40%
60%
80%
100%
1993 1994 199 5 1996 199 7 199 8 199 9 20 00 2 001 2 002
Claims o n the p rivate secto r Claims on the government

- 36 -
50. Perversely, the initial success of the exchange rate-based disinflation program that started in December 1999 added to the incentive to maintain large currency mismatches. The program, anchored on a pre-determined exchange rate path, contributed to a sharp drop in nominal and real interest rates in the first months of 2000. In response, banks not only reduced their deposit rates, but—in expectation of a further decline—increased their holdings of longer-term fixed-rate government debt. They also sought to boost their local currency lending to the private sector, as the fiscal tightening under the program meant that they would have to diversify away from public sector assets. At the same time, the pre-announced exchange rate path and the real appreciation of the Turkish lira made foreign-currency funding appear even cheaper. Banks responded by borrowing more in foreign currency, thus running an even larger negative net open foreign-currency position (Figure III.C.4). Excluding holdings of foreign-currency indexed assets and forwards (which to a large extent consisted of contracts with connected parties with little or no foreign exchange earnings), this open position reached more than 300 percent of bank capital on the eve of the November 2000 crisis.
51. This change in the composition of bank balance sheets significantly raised their liquidity, interest rate, and currency risks. First, banks were borrowing short term in foreign currency, while lending to the government in local currency, increasingly at (relatively) longer maturities. In addition to this combined liquidity-currency risk, banks’ interest rate risk from domestic funding also rose, because the longer-term local currency lending to the government was mostly at fixed rates, while the rates on lira demand deposits were adjusted promptly. Of course, the degree of these mismatches varied between individual banks, but when some particularly weak banks eventually failed, the fragility of the entire banking sector was revealed.
52. The combined public and banking sector mismatches constrained the available policy options to deal with the crisis. The government could have reduced banks’ currency mismatches and eased its rollover problems by issuing foreign-currency debt (as it in fact did later, as described below), but this would have increased its own currency mismatch and sharply reduced banks’ profitability. On the other hand, banks could not simply be forced to rapidly reduce their currency mismatch by building up foreign-currency assets, as this would have undermined the smooth rollover of government debt and put pressure on interest rates. Higher interest rates, in turn, would
Figure III.C.4 . Turkey: Banks ' Net Open Foreig n-Currency Pos it ions(In b illions o f US$)
-20
-15
-10
-5
0
Jan.2000
Sep .2 000
Dec.200 0
Mar.2001
Dec.2 001
Dec.2002
Exclud ing fo rwards
Includ ing fo rwardsand fo reig n-currencyindexed assets
Figure III.C.3 . Turkey: Fund ing from Foreig n Banks (In b illions o f US$)
0
5
10
15
20
1994 1999 2000

- 37 -
not only have raised doubts about the sustainability of the public debt burden, but also created further losses for the banks that had large maturity mismatches. Furthermore, a rapid elimination of banks’ open positions would have created the exchange rate pressures that the program was precisely trying to avert. The program’s crawling peg also precluded large liquidity injections by the central bank.
53. Under these circumstances, an interest rate defense of the exchange rate peg could not be sustained and sharp fiscal adjustment became the only available option to stem the crisis. The initial surge in interest rates in November 2000 caused a drop in the value of banks’ holdings of fixed-rate government securities and simultaneously increased their short-term funding costs. The subsequent exchange rate depreciation in February 2001 fully exposed banks’ negative net open foreign-currency positions. In light of the banking sector’s financial distress, foreign investors’ confidence dwindled, adding to capital flight and associated pressures on the exchange and interest rates. Given the choice of exchange rate regime, only a sharp fiscal adjustment could alleviate these pressures.
54. While the public sector’s fragility had contributed to the banking crisis, its own balance sheet now deteriorated sharply. The depreciation that followed the
floating of the lira caused the public debt ratio to jump by about 30 percentage points of GDP (Figure III.C.5). Notably, the share of domestic debt at floating rates rose significantly (Figure III.C.6) because investors would only accept local currency instruments if their real value would be protected, and also because domestic banks needed assets that would reduce their interest rate exposure (which they had increased earlier in expectation of falling interest rates). Furthermore, in mid-2001, the government exchanged the equivalent of
Figure III.C.5. Turkey: Change in Public Debt to GDP Ratio:Component Contribution by Year
-40
-20
0
20
40
60
1997 1998 1999 2000 2001Residual Fiscal balanceExchange rate change Inflation indexationDenominator effect (nominal output growth) Change in the debt/GDP ratio
Figure III.C.6 . Turkey: Pub lic Deb t by Ins t rument (In percent o f GNP)
0
2 0
4 0
6 0
8 0
100
2000 200 1External Domestic fo reign-currency indexedDomestic CPI-indexed Domestic float ing rateDomestic d iscount b ills and o ther

- 38 -
US$5 billion in lira debt for dollar-indexed debt to help banks close their open foreign-currency positions. Finally, in an effort to avoid a collapse of the banking system, the government declared a blanket guarantee for banks’ liabilities and issued bonds for their recapitalization. As a result, the government’s debt from bank recapitalization alone reached almost 30 percent of GNP, contributing to a jump in gross public debt to 86 percent of GNP by end-2001.
D. Brazil: How the Public Sector Leveraged its Balance Sheet to Insulate the Private Sector from the 1998-1999 Currency Crisis39
55. Contrary to other recent currency crises, the Brazilian economy posted positive real growth rates even during the crisis years of 1998 and 1999 (Figure III.D.1). Though growth rates have not rebounded substantially since that crisis, Brazil’s resilience is particularly remarkable given the large currency and maturity mismatches within the banking and corporate sectors in the run-up to the crisis (Figure III.D.2—the vertical dotted lines mark the two major crises during the time period). This achievement can be attributed to the authorities’ (implicit) decision to address key balance sheet vulnerabilities ahead of the change in exchange-rate regime by transferring risks to the government’s balance sheet. This section details this strategy in terms of its costs and benefits and how it subsequently changed the vulnerability of Brazil’s public sector.
56. A supportive external environment towards emerging markets in the mid-1990s allowed both the financial and corporate sectors to build up large stocks of external debt. These sectors took advantage of the lower nominal interest rates on debt issued externally
39 Primarily drafted by Jens Nystedt.
Figure III.D.2 Brazil: NFA of Banking System(In billions of U.S. dollars)
0
5
10
15
20
25
30
35
40
1997Q1 1998Q2 1999Q3 2000Q4 2002Q1 2003Q20
5
10
15
20
25
30
35
40Foreig n Assets BanksForeig n Liab ilit ies BanksNeg ative NFA
Figure III.D.1 Brazil: Real Growth Effect of Currency Crises
(Percent change in real GDP)
-10
-8
-6
-4
-2
0
2
4
6
t-2 t-1 t t+1 t+2-10
-8
-6
-4
-2
0
2
4
6
BrazilCrisis Average

- 39 -
and the perception that currency risk was limited. Brazil was following a crawling peg exchange rate regime at the time, which had played an important role in successfully bringing down hyperinflation and stabilizing the economy. The private sector’s external debt peaked during the fourth quarter of 1998 at US$146 billion (including intercompany loans).
57. The increase of foreign assets in the banking system did not keep pace with the build-up of foreign liabilities. At the beginning of 1997, the negative NFA of the banking system was around US$20 billion (excluding holdings of dollar-linked debt, which at the time had reached US$15 billion). In the corporate sector, companies in both the non-tradeable and tradeable sectors were heavy borrowers, increasing their external debt substantially from 1997 onward (Figure III.D.3). Within the corporate sector, the utility and telecommunications sectors had the largest currency mismatches. 58. The market turmoil that started in October 1997 triggered a sharp increase in demand for hedge by both the banking and the corporate sectors. In a rush to close large net open foreign-exchange positions, demand for dollar-linked government domestic debt and outright spot purchases of dollars surged; the authorities responded by increasing the stock of dollar-linked debt outstanding by nearly US$20 billion dollars. In 1998 pressure on the exchange rate rapidly intensified, as slippages emerged in fiscal adjustment and the central bank lowered interest rates prematurely, forcing it to once again intervene to support the crawling peg. Market participants used the time provided to them by active central bank intervention in both spot and futures market, combined with stepped-up issuance of dollar-linked domestic debt, to further reduce their net open foreign-exchange positions. Through the issuance of an additional US$23 billion in dollar-linked debt after end-1997, mainly to roll over public debt amortizations falling due, and accumulated foreign exchange intervention of US$30 billion, the authorities ensured that the local banking system was actually net long on dollars by the end of 1998.40 Moreover, most of the corporates were by then protected from the devaluation that took place only a few weeks later.
40 Resulting in a stock of dollar-linked debt of US$56 billion by end-1998.
Figure III.D.3. Brazil: Corporate Sector External Debt(In billions of U.S. dollars)
0
20
40
60
80
100
120
1997Q1 1998Q2 1999Q3 2000Q4 2002Q1 2003Q20.0
0.5
1.0
1.5
2.0
2.5
3.0
3.5
4.0
4.5
Rea l per $ (right s ca le)
Co rpo ra te Sec to r Externa l Debt

- 40 -
59. As part of its defense of the exchange rate, the central bank also more than doubled overnight interest rates, exposing the maturity mismatch of the banking system. The overnight rate was hiked from 19 percent at the beginning of September 1998 to more than 40 percent in November. The banking system’s maturity mismatch was partly mitigated by a sharp pick-up in sovereign issuance of overnight-linked interest rate bonds, which allowed the government to partially trade off rollover risk by assuming the banks’ interest rate risk. As part of a strategy of stabilizing market sentiment in the aftermath of the float, the overnight rate was once again raised to 45 percent, but at this time the banking system had largely shifted its government debt holdings to overnight-linked instruments and thus stood ready to gain from the move.
60. As a by-product of the Brazilian authorities’ attempt to defend the crawling peg and hence immunize large parts of the banking and corporate sectors, Brazilian banks posted record profits during the first quarter of 1999. This experience differs sharply from other countries’ banking systems in the aftermath of exiting a fixed exchange-rate regime. As a sign of the corporate sector’s ability to weather the storm, the banking sector’s non-performing loans rose only modestly from 7.6 percent of total loans in 1997 to 10.2 percent in 1998, and fell back again to 8.7 percent in 1999.
61. Far from entering into a deep recession, the economy actually grew slightly in real terms in 1999. Unaffected by wealth effects, the economy was able to avoid most of the collateral damage from the currency crisis. Confidence was restored, as inflation and inflation expectations were rapidly brought under control by proactive monetary policy. The authorities were also able deliver on a significant fiscal adjustment that alleviated debt sustainability concerns. This fiscal adjustment was based on far-reaching reforms to increase fiscal discipline at all levels of government. Public indebtedness was further constrained through a system of spending rules, borrowing limits and sanctions.
62. The Brazilian government’s ability largely to insulate the banking and corporate sectors from a more than 30 percent exchange rate depreciation reflected the strength of its own balance sheet going into the crisis. At end-December 1997, Brazil’s public sector net debt was a relatively modest 35 percent of GDP, and nearly 50 percent of its public debt was held either in short-term fixed rate notes or in inflation-indexed debt. The authorities’ response to the currency crisis not only triggered a sharp rise in the net debt to GDP ratio to 53 percent by end-1999, but also markedly changed the composition of its debt. The share of dollar-linked domestic debt doubled, while the share of overnight linked bonds more than tripled to account for more than 50 percent of total public debt by the second quarter of 1999. Coming out of the currency crisis, more than 90 percent of
Fig ure III.D.4 Brazil: Compos ition o f Fed eral Pub lic-Secto r Deb t(In percent o f to tal)
0
20
40
60
80
100
J an-97 J an-98 J an-99 J an-00 J an-01 J an-02 J an-03
Infla tio n linked
SELIC linked
Fixed Rate
FX linked Do me s tic De bt
External DebtTo ta l FX
Linke d FX swaps

- 41 -
Brazil’s public debt was either linked to the exchange rate or the overnight rate, making the debt stock exceedingly vulnerable to future shocks (Figure III.D.4).41
63. The shift of the corporate and banking sector’s currency mismatches to the public sector’s balance sheet did not significantly reduce the overall economy’s exposure to exchange rate changes. As shown in Figure III.D.5, the net gap between foreign-exchange liabilities and assets of the economy improved only marginally in 1999 and subsequently largely stabilized. Stylized balance sheet indicators comparing the economy’s liquid foreign assets to its short-term foreign liabilities (Figure III.D.6) imply a worsening in Brazil’s external vulnerability following the 1998 crisis. However, most of this reflects the deterioration in the public sector’s balance sheet after it assumed most of the private sector’s maturity and currency mismatches.42 The corporate and banking sectors, in contrast, gradually reduced their foreign-currency exposure and shifted their net financing on-shore in the context of a floating exchange rate regime. Moreover, the stock-based metric in Figure III.D.6. does not capture the impressive turnaround in Brazil’s current account balance and the economy’s increased overall shocks resistance to following the switch to a flexible exchange rate regime.
41 In addition to traditional foreign-exchange intervention in the spot and futures markets, the government replaced, in essence, the financial and corporate sectors’ market risk (risk related to the exchange rate, interest rates, etc.) with credit risk to the government.
42 Additional vulnerabilities may be generated by the possible moral hazard created by the implicit public guarantee of private foreign-currency liabilities.
Figure III.D.6. Brazil: Key Vulnerability Ratios(In percent)
0%10%
20%30%
40%50%
60%70%
80%90%
1997 1999 2001 2003:Q30%10%
20%30%
40%50%
60%70%
80%90%
FX Assets to FX Liab ilit ies us ing Net Reserves
Gro ss Reserves over Short Term Deb tFX Assets to FX Liab ilit ies us ing Gross Reserves
Figure III.D.5 Brazil: Net Foreign-Currency Assets and Composition
(In billions of U.S. dollars)
-150
-100
-50
0
50
100
150
19 97 1999 200 1 200 3 :Q3-150
-100
-50
0
50
100
150Fo reign As s e ts Ba nksDo llar-linked debt < 1 yearNIRM LT Debt < 1 yea rSho rt-te rm Debt
Net foreign currency gap
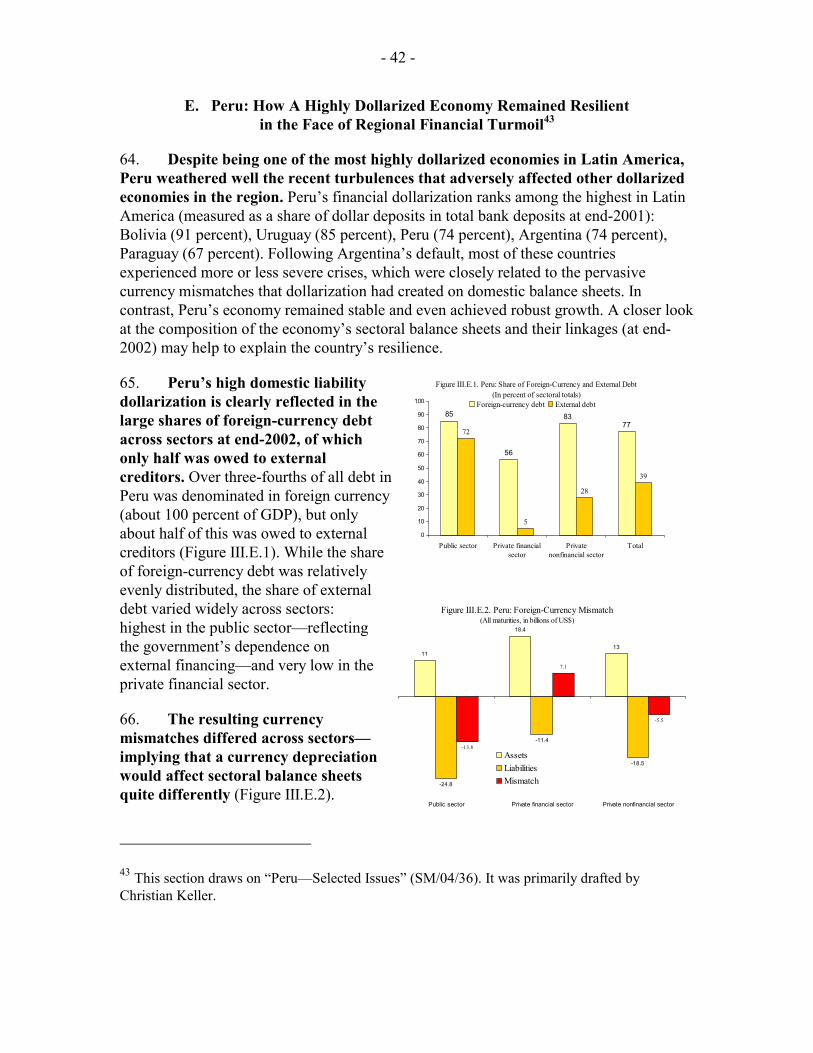
- 42 -
E. Peru: How A Highly Dollarized Economy Remained Resilient in the Face of Regional Financial Turmoil43
64. Despite being one of the most highly dollarized economies in Latin America, Peru weathered well the recent turbulences that adversely affected other dollarized economies in the region. Peru’s financial dollarization ranks among the highest in Latin America (measured as a share of dollar deposits in total bank deposits at end-2001): Bolivia (91 percent), Uruguay (85 percent), Peru (74 percent), Argentina (74 percent), Paraguay (67 percent). Following Argentina’s default, most of these countries experienced more or less severe crises, which were closely related to the pervasive currency mismatches that dollarization had created on domestic balance sheets. In contrast, Peru’s economy remained stable and even achieved robust growth. A closer look at the composition of the economy’s sectoral balance sheets and their linkages (at end-2002) may help to explain the country’s resilience.
65. Peru’s high domestic liability dollarization is clearly reflected in the large shares of foreign-currency debt across sectors at end-2002, of which only half was owed to external creditors. Over three-fourths of all debt in Peru was denominated in foreign currency (about 100 percent of GDP), but only about half of this was owed to external creditors (Figure III.E.1). While the share of foreign-currency debt was relatively evenly distributed, the share of external debt varied widely across sectors: highest in the public sector—reflecting the government’s dependence on external financing—and very low in the private financial sector.
66. The resulting currency mismatches differed across sectors—implying that a currency depreciation would affect sectoral balance sheets quite differently (Figure III.E.2).
43 This section draws on “Peru—Selected Issues” (SM/04/36). It was primarily drafted by Christian Keller.
Figure III.E.2. Peru: Foreign-Currency Mismatch(All maturities, in billions of US$)
11
18.4
13
-24.8
-11.4
-18.5
-13.8
7.1
-5.5
Public sector Private financial sector Private nonfinancial sector
AssetsLiabilitiesMismatch
Figure III.E.1. Peru: Share of Foreign-Currency and External Debt(In percent of sectoral totals)
85
56
8377
72
5
28
39
0
10
20
30
40
50
60
70
80
90
100
Public sector Private financialsector
Privatenonfinancial sector
Total
Foreign-currency debt External debt
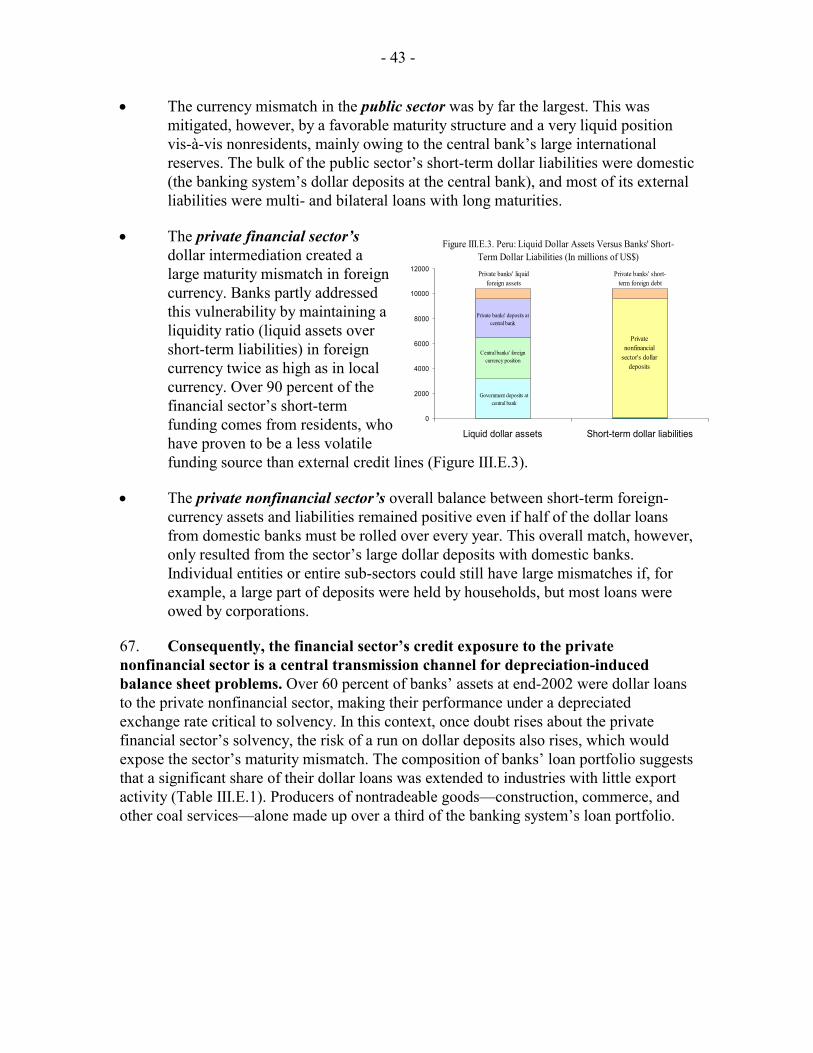
- 43 -
• The currency mismatch in the public sector was by far the largest. This was mitigated, however, by a favorable maturity structure and a very liquid position vis-à-vis nonresidents, mainly owing to the central bank’s large international reserves. The bulk of the public sector’s short-term dollar liabilities were domestic (the banking system’s dollar deposits at the central bank), and most of its external liabilities were multi- and bilateral loans with long maturities.
• The private financial sector’s dollar intermediation created a large maturity mismatch in foreign currency. Banks partly addressed this vulnerability by maintaining a liquidity ratio (liquid assets over short-term liabilities) in foreign currency twice as high as in local currency. Over 90 percent of the financial sector’s short-term funding comes from residents, who have proven to be a less volatile funding source than external credit lines (Figure III.E.3).
• The private nonfinancial sector’s overall balance between short-term foreign-currency assets and liabilities remained positive even if half of the dollar loans from domestic banks must be rolled over every year. This overall match, however, only resulted from the sector’s large dollar deposits with domestic banks. Individual entities or entire sub-sectors could still have large mismatches if, for example, a large part of deposits were held by households, but most loans were owed by corporations.
67. Consequently, the financial sector’s credit exposure to the private nonfinancial sector is a central transmission channel for depreciation-induced balance sheet problems. Over 60 percent of banks’ assets at end-2002 were dollar loans to the private nonfinancial sector, making their performance under a depreciated exchange rate critical to solvency. In this context, once doubt rises about the private financial sector’s solvency, the risk of a run on dollar deposits also rises, which would expose the sector’s maturity mismatch. The composition of banks’ loan portfolio suggests that a significant share of their dollar loans was extended to industries with little export activity (Table III.E.1). Producers of nontradeable goods—construction, commerce, and other coal services—alone made up over a third of the banking system’s loan portfolio.
Figure III.E.3. Peru: Liquid Dollar Assets Versus Banks' Short-Term Dollar Liabilities (In millions of US$)
Government deposits at central bank
Central banks' foreign currency position
Private banks' deposits at central bank
Private banks' liquid foreign assets
Private banks' short-term foreign debt
0
2000
4000
6000
8000
10000
12000
Liquid dollar assets Short-term dollar liabilities
Private nonfinancial
sector's dollar deposits

- 44 -
68. Against this backdrop, the public sector’s ability to act as a lender of last resort has become crucial for depositors’ confidence. The public sector’s high official reserve holdings at end-2002 matched the stock of the private nonfinancial sector’s dollar deposits in the domestic banking system. This helped to avoid the creation of negative expectations, which could lead to self-fulfilling bank runs. Moreover, high official reserves also mitigated the risk of an external roll-over crisis. The private financial sector’s liquid external assets almost exactly matched its short-term foreign debt, and the private nonfinancial sector had a favorable mismatch (i.e., assets exceeded liabilities) between liquid foreign assets and short-term external debt. The public sector’s reserve holdings were, in principle, high enough to help bridge a temporary loss of access to foreign credit (Figure III.E.4).
69. The composition of Peru’s sectoral balance sheets thus made it resilient to anything but the extreme scenario of a simultaneous run on domestic dollar deposits and a shut-down of external credit. The sum of short-term debt and domestic dollar deposits at end-2002 exceeded the sum of official reserves and the private sector’s liquid foreign assets. This static comparison of assets and liabilities, however, does not take into account a possible flow adjustment in the current account in response to a depreciated exchange rate, which could help to mitigate any gaps caused by a simultaneous run on deposits and shutdown of credit. Moreover, examination of end-2002 data alone misses the fact that high coverage of potential foreign-currency needs has been maintained over time (Figure III.E.5): Peru’s official reserves together with banks’ liquid foreign assets
Manufacturing industry 4.1 0.4 4.6 2.3 3.1 -0.7Primary sector 1.5 5.6 7.1 5.3 1.5 3.8 Transportation 0.7 0.1 0.7 0.3 0.1 0.2 Commerce 1.8 - 1.8 - - 0.0Services 1.3 0.2 1.5 1.0 0.2 0.7Construction 1.3 - 1.3 - - 0.0Other 1.1 0.1 1.1 0.3 0.1 0.2Total 11.8 6.3 18.1 9.2 5.0 4.2 1/ Using banking system's loan portfolio classification.2/ Assuming MLT debt is owed by mining corporations, and allocating trade credit by export weight.3/ Intermediary goods and certain service imports (transportation, communication and insurance); weighted by export share where importing sector is unspecified.
Table III.E.1. Peru: Foreign Currency Debt and Foreign Currency Income in the Private Nonfinancial Sector
(In billions of US$)
Imported inputs 3/
Net export earningsSegments of the private
nonfinancial sector 1/
Domestic loans in US$
External debt 2/
Total US$ debt
Exports of goods and services
Figure III.E.4. Peru: Liquid Dollar Assets Versus Banks' Dollar Liabilities and Short-Term Foreign Debt
(In millions of US$)
PNFS
Public sector (NIR)
PFS PFSPNFS
Public sector
Domestic dollar
deposits
0
2000
4000
6000
8000
10000
12000
14000
Liquid foreign assets Short-term external debt anddomestic dollar deposits
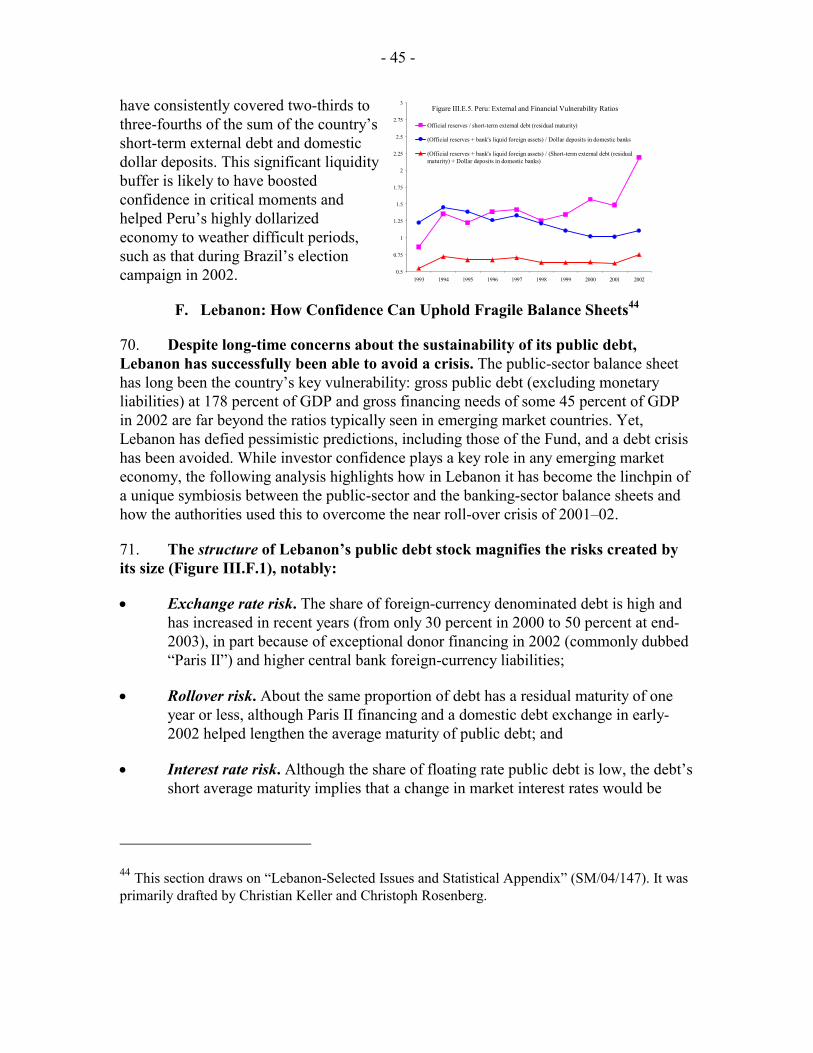
- 45 -
have consistently covered two-thirds to three-fourths of the sum of the country’s short-term external debt and domestic dollar deposits. This significant liquidity buffer is likely to have boosted confidence in critical moments and helped Peru’s highly dollarized economy to weather difficult periods, such as that during Brazil’s election campaign in 2002.
F. Lebanon: How Confidence Can Uphold Fragile Balance Sheets44
70. Despite long-time concerns about the sustainability of its public debt, Lebanon has successfully been able to avoid a crisis. The public-sector balance sheet has long been the country’s key vulnerability: gross public debt (excluding monetary liabilities) at 178 percent of GDP and gross financing needs of some 45 percent of GDP in 2002 are far beyond the ratios typically seen in emerging market countries. Yet, Lebanon has defied pessimistic predictions, including those of the Fund, and a debt crisis has been avoided. While investor confidence plays a key role in any emerging market economy, the following analysis highlights how in Lebanon it has become the linchpin of a unique symbiosis between the public-sector and the banking-sector balance sheets and how the authorities used this to overcome the near roll-over crisis of 2001–02.
71. The structure of Lebanon’s public debt stock magnifies the risks created by its size (Figure III.F.1), notably:
• Exchange rate risk. The share of foreign-currency denominated debt is high and has increased in recent years (from only 30 percent in 2000 to 50 percent at end-2003), in part because of exceptional donor financing in 2002 (commonly dubbed “Paris II”) and higher central bank foreign-currency liabilities;
• Rollover risk. About the same proportion of debt has a residual maturity of one year or less, although Paris II financing and a domestic debt exchange in early-2002 helped lengthen the average maturity of public debt; and
• Interest rate risk. Although the share of floating rate public debt is low, the debt’s short average maturity implies that a change in market interest rates would be
44 This section draws on “Lebanon-Selected Issues and Statistical Appendix” (SM/04/147). It was primarily drafted by Christian Keller and Christoph Rosenberg.
Figure III.E.5. Peru: External and Financial Vulnerability Ratios
0.5
0.75
1
1.25
1.5
1.75
2
2.25
2.5
2.75
3
1993 1994 1995 1996 1997 1998 1999 2000 2001 2002
Official reserves / short-term external debt (residual maturity)
(Official reserves + bank's liquid foreign assets) / Dollar deposits in domestic banks
(Official reserves + bank's liquid foreign assets) / (Short-term external debt (residualmaturity) + Dollar deposits in domestic banks)
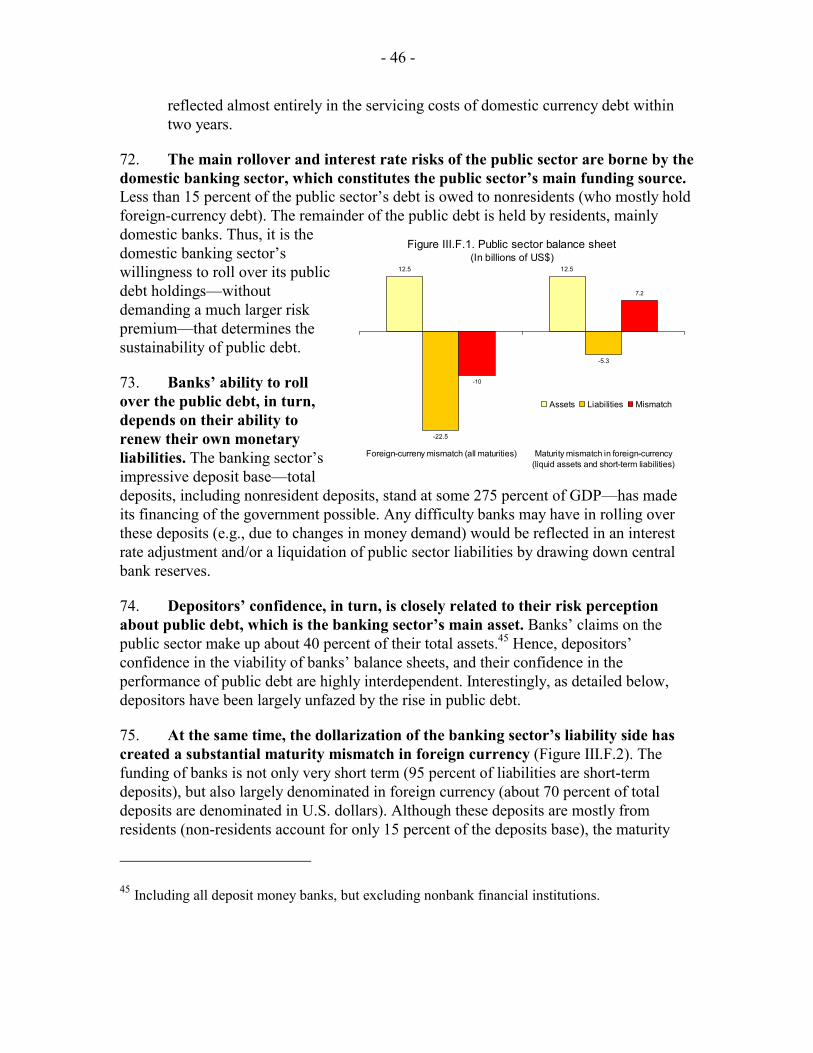
- 46 -
reflected almost entirely in the servicing costs of domestic currency debt within two years.
72. The main rollover and interest rate risks of the public sector are borne by the domestic banking sector, which constitutes the public sector’s main funding source. Less than 15 percent of the public sector’s debt is owed to nonresidents (who mostly hold foreign-currency debt). The remainder of the public debt is held by residents, mainly domestic banks. Thus, it is the domestic banking sector’s willingness to roll over its public debt holdings—without demanding a much larger risk premium—that determines the sustainability of public debt.
73. Banks’ ability to roll over the public debt, in turn, depends on their ability to renew their own monetary liabilities. The banking sector’s impressive deposit base—total deposits, including nonresident deposits, stand at some 275 percent of GDP—has made its financing of the government possible. Any difficulty banks may have in rolling over these deposits (e.g., due to changes in money demand) would be reflected in an interest rate adjustment and/or a liquidation of public sector liabilities by drawing down central bank reserves.
74. Depositors’ confidence, in turn, is closely related to their risk perception about public debt, which is the banking sector’s main asset. Banks’ claims on the public sector make up about 40 percent of their total assets.45 Hence, depositors’ confidence in the viability of banks’ balance sheets, and their confidence in the performance of public debt are highly interdependent. Interestingly, as detailed below, depositors have been largely unfazed by the rise in public debt.
75. At the same time, the dollarization of the banking sector’s liability side has created a substantial maturity mismatch in foreign currency (Figure III.F.2). The funding of banks is not only very short term (95 percent of liabilities are short-term deposits), but also largely denominated in foreign currency (about 70 percent of total deposits are denominated in U.S. dollars). Although these deposits are mostly from residents (non-residents account for only 15 percent of the deposits base), the maturity
45 Including all deposit money banks, but excluding nonbank financial institutions.
Figure III.F.1. Public sector balance sheet(In billions of US$)
12.5 12.5
-22.5
-5.3
-10
7.2
Foreign-curreny mismatch (all maturities) Maturity mismatch in foreign-currency(liquid assets and short-term liabilities)
Assets Liabilities Mismatch

- 47 -
mismatch in foreign currency constitutes a substantial risk.46 Excluding dollar-denominated lending to the nonbank private sector (which does not represent liquid assets), the banking sector’s foreign exchange position is significantly shorter. The limited liquidity coverage of foreign-currency denominated liabilities is, thus, a key vulnerability in the event of a sizeable and rapid withdrawal of such deposits.
76. Against this background, the public sector’s ample—and increasing—reserve holdings have played an important role in building confidence. The recent growth of official reserves (to US$12.5 billion by end-2003)—increasing at a faster pace than the central bank’s foreign-currency liabilities—has contributed to a boost in confidence in three ways: First, in the absence of any regular dollar revenues, the holdings of foreign-currency assets are critical to gauge the foreign-currency mismatch on the public-sector balance sheet: although the overall mismatch remains substantial, liquid assets comfortably exceed liabilities falling due over the short term. Second, higher official reserves also signal an increase in emergency liquidity that could be made available to back some (though certainly not all) dollar deposits in the banking system. Finally, high reserves are widely seen as a guarantor of the exchange rate peg, which is perceived as essential to economic and social stability. Aware of its crucial signaling function, the central bank has taken an active stance forward accumulating reserves, by, inter alia, issuing certificates of deposit at relatively high yields.47 The authorities deem the benefits of such operations as great enough to justify their substantial quasi-fiscal costs.
77. Lately, improved risk perception has created a virtuous circle of growing reserves, higher money demand and falling spreads on government debt. The increase in official reserves after Paris II was accompanied by a surge in investors’ confidence, against the background of a favorable interest rate environment and sizeable capital inflows from the Persian Gulf. This increased confidence led to strong growth in total deposits (reaching 15 percent in 2003) and a sharp decline in the sovereign risk
46 By and large, Lebanese expatriates are considered residents.
47 While denominated in domestic currency, banks could only purchase these CDs by surrendering an equivalent amount of foreign exchange.
Figure III.F.2. Private financial sector balance sheet(In billions of US$)36.1
12.7
-31.4 -31.2
4.7
-18.5
Foreign-curreny mismatch (all maturities) Maturity mismatch in foreign-currency(liquid assets and short-term liabilities)
Assets Liabilities Mismatch

- 48 -
premium.48 The resulting liquidity relief provided the banking sector with ample resources that it could recycle to fund the public sector, and which, in turn, was able to place its debt at lower interest cost.
78. This circular effect, however, can also work in the opposite direction, as evidenced in the near-crisis episode of 2001–02. Developments in the run-up to the Paris II donor conference in late-2002 give an indication of how the cycle’s mechanics can also turn vicious. When official reserves fell and the growth of money demand slowed down, banks had difficulties increasing their monetary liabilities. Consequently, they tried to reduce their exposure to government paper—by not rolling it over or by discounting it at the central bank—and the subsequent lack of liquidity put upward pressure on interest rates. The central bank had to finance directly the government with an offsetting further loss of foreign reserves. This negative spiral was reversed in mid-2002, when the authorities were able to generate a series of good news to boost investors’ confidence. This included initial success with an ambitious fiscal adjustment program, a political truce between the president and prime minister over privatization plans, a surge of reported reserves through a large sale of Eurobonds to a friendly government, and announcements about the imminent Paris II donor conference.
79. More fundamentally, some factors idiosyncratic to Lebanon may explain the remarkable resilience of its banking system. The continuous funding of very high public financing needs through the domestic banking system is made possible by a large and dedicated investor base (i.e., Lebanese diaspora and Arab investors). Indeed, indications are that (i.e., fear that assets held in the U.S. could be frozen) inflows from regional investors have increased as a result of events post-September 11. The government’s ability to mobilize extraordinary levels of official financing (such as Paris II) may also play a role.
48 Besides growing official reserves, other factors, such as the expected direction of fiscal policy, also play a role in the sovereign risk rating.
IV. CONCLUSIONS
80. This paper illustrates how sectoral balance sheet relationships have evolved over time and how this matters for vulnerability analysis in emerging markets. By several measures, the external, public, nonfinancial and financial sectors have grown more integrated over the past decade, with the latter playing a particularly important role in channeling and amplifying risks. As the case studies show, these transmission mechanisms bear both risks and opportunities at times of financial crisis. If poorly managed, sectoral balance sheet mismatches can reinforce each other and quickly snowball into the full-blown balance of payment crises witnessed in Argentina, Uruguay or Turkey. But if the authorities are aware of vulnerabilities and are willing to act, they
- 49 -
can preempt or mitigate external shocks, by strengthening confidence (as in Lebanon) or shifting risks from weaker to stronger sectors (as in Brazil and Peru). In practice, emerging market governments have often drawn on their own balance sheet—in the first instance their official reserves, and in second instance their ability to raise taxes or tap foreign credit lines (including from the Fund). If the public sector is perceived to be taking responsibility for private sector mismatches, such implicit bail-out guarantees raise questions of moral hazard.
81. Many of the policy conclusions emerging from this paper echo the discussion at the recent Board seminar on liquidity management. The review of recent balance sheet developments in emerging markets provides some empirical backing for Directors’ findings at that meeting. Specifically, the analysis (i) underscores the importance of temporary asset buffers associated with strong public sector balance sheets (as well as flexible exchange rates) to limit immediate disruptions and give time to implement appropriate policy responses, (ii) highlights the benefits of promoting appropriate buffers and hedges in private balance sheets, which would improve risk allocation within and between sectors, (iii) supports the strengthening of banking supervision to limit currency exposure (including to borrowers without foreign-currency earnings) and maturity mismatches, and (iv) shows how sound liability management by both the public and private sectors can play a major role in containing interest rate, currency, and rollover risk. Debt-related conditionality in Fund-supported programs, if appropriately broad and nuanced, can support the authorities in this process. This issue will be taken up in another paper.
82. At the operational level, the paper shows that existing data sources can go some way to allow for intersectoral balance sheet analysis. Both the cross-country comparison in chapter II and the case studies in chapter III rely on data readily available from public sources (such as IFS, World Bank or BIS data bases) or, in some cases, obtained by country teams from their national counterparts. While recent statistical initiatives (SDDS, the Fund’s coordinated Portfolio Investment Survey) have contributed to improved balance sheet data, large information gaps exist. Sometimes, however, these can be overcome by making pragmatic assumptions (e.g., that banks maintain no open foreign-currency positions, if this is required by supervisory regulations). In balance sheet analysis, the perfect can be the enemy of the good: not all questions require a full intersectoral asset-liability matrix as presented in Box 2 above. This is not to deny that more systematic data gathering across the membership would greatly improve the quality of analysis.
83. An initial step towards operationalizing the BSA would be to complete the analysis for "low-hanging fruits”—simple ratios that can be easily calculated and compared across countries and time. Comprehensive indices of currency and maturity mismatches have recently been proposed, inter alia, by Goldstein and Turner (2003) or the MfRisk model. Rather than one single indicator, the present paper uses a range of ratios to gauge various balance sheet risks, which are summarized in the diamond presentation in Chapter II. Such inter-temporal and inter-regional comparisons provide a natural calibration of the results, with the caveats noted above. For example, a first

- 50 -
assessment of a member country’s vulnerabilities could be obtained by mapping a set of mismatch indicators against a regional comparator. A multidimensional and flexible use of a variety of indicators also responds to Director’s concerns, recently expressed at the Board seminar on liquidity management, regarding a “one-size-fits-all” or mechanistic approach to vulnerability analysis.
84. Further analytical and empirical work is underway in the Fund to utilize the balance sheet approach for vulnerability analysis (Box 3). The examples presented in this paper are a first tentative step—necessarily impeded by the paucity of data—in a wider effort to use balance sheet analysis in bilateral and multilateral surveillance. In parallel, the BSA is being employed in a number of Article IV consultations currently in progress or scheduled for the coming months. The BSA’s input to the policy dialogue and advice should point to areas in which the approach can be further refined. As better statistical information becomes available, staff plans to also expand the scope of both the indicators and the member countries covered in cross-country analysis. In this context, a closer look at industrial countries (and their differences to emerging markets) could yield important insights. In addition, staff could seek further insight into balance sheet vulnerabilities by incorporating off-balance sheet transactions into the analysis, and by using a more disaggregated sectoral breakdown—even if data limitations necessitate reliance on a smaller sample of countries. Moreover, the BSA could be extended to take into account the main channels of financial contagion identified in the literature. Another promising avenue of further work is the application of the contingent claims approach, which extends the static balance sheets compiled along the lines described in this paper to a stress-testing analysis. Directors will have an opportunity to discuss this methodology and its application to a few emerging market countries at a forthcoming Board seminar.

- 51 -
Box 3. Extensions of the Balance Sheet Approach The basic accounting exercise presented in this paper is being refined and extended throughout the Fund, especially with respect to the corporate sector. Initiatives to further operationalize the approach include: • A “bottom-up” compilation of corporate data. Some area departments, in
particular APD, are focusing on a detailed analysis of corporate data, based on the commercially available World scope data base. Unlike the macro approach used in this paper, indicators would be derived from firm-level information and aggregated across sub-sectors. However, many difficulties remain to resolved, e.g., differing accounting standards and valuation problems.
• Improving comparability across sectors and countries. RES is working on an Excel add-in component that will provide desk economists with easy access to a variety of corporate risk indicators in comparable industries and countries. Measures of risk are derived from the above-mentioned World scope data base.
• Applying the contingent claims approach. This methodology allows to estimate the risks of default and associated value a risk transfer across interrelated balance sheets of corporate, financial and public sectors (Gapen et al., forthcoming). For this purpose a commercially available simulation model, Moody’s MfRisk, is being tested by ICM and applied to several member countries (e.g. Brazil and Thailand). However, the model is a “black box”, which makes the results not always easy to interpret.
• Integrating the BSA into early warning systems. A recent paper (Mulder et al., 2002) finds that balance sheet effects can enhance the early warning model used by RES. Using commercial data for individual corporations in about 20 emerging market countries, the authors find that a number of corporate balance sheet indicators have a measurable impact on the likelihood of financial crises. These include such measures as (i) the ratio of debt to equity, (ii) the ratio of short-term debt to working capital, (iii) the corporate share of bank loans times the debt-equity ratio, (iv) the ratio of private sector external debt to exports. Nevertheless, in early warning systems balance sheet indicators can only supplement, rather than substitute, traditional macroeconomic variables.

- 52 -
References
Aghion, Phillippe, Philippe Bacchetta, and Abhijit Banerjee, 2001a, “Currency Crises and Monetary Policy in an Economy with Credit Constraints”, European Economic Review, Vol. 45, No. 7 (June), pp. 1121–50.
——, 2001b, “A Corporate Balance Sheet Approach to Currency Crises”, Discussion Paper No. 3092, (December), pp. 1–39. Center for Economic Research.
Allen, Mark, Christoph Rosenberg, Christian Keller, Brad Setser and Nouriel Roubini, 2002, “A Balance Sheet Approach to Financial Crisis”, IMF Working Paper 02/210 (Washington: International Monetary Fund).
Balino, Tomás, Adam Bennett, and Eduardo Borenszstein, 1999, Monetary Policy in Dollarized Economies, IMF Occasional Paper No. 171 (Washington: International Monetary Fund).
Borensztein, Eduardo and Paolo Mauro, 2002, “Reviving the Case for GDP-Indexed Bonds,” IMF Policy Discussion Paper 02/10 (Washington: International Monetary Fund).
Bussière, Matthieu and Christian Mulder, 1999, “External Vulnerability in Emerging Market Economies: How High Liquidity Can Offset Weak Fundamentals and the Effects of Contagion,” IMF Working Paper 99/88 (Washington: International Monetary Fund).
Caballero, Ricardo and Arvind Krishnamurthy, 2000, “Dollarization of Liabilities: Underinsurance and Domestic Financial Underdevelopment,” NBER Working Paper No. 7792.
Calvo, Guillermo, 1998, “Capital Flows and Capital-Market Crises: The Simple Economics of Sudden Stops”, Journal of Applied Economics, Vol. 1 (November), pp. 35–54.
Calvo, Guillermo and Carmen M. Reinhart, 2000, When Capital Inflows Come to a Sudden Stop: Consequences and Policy Options, in P. Kenen and A. Swoboda, eds., Reforming the International Monetary and Financial System, pp. 175–201 (Washington: International Monetary Fund).
Calvo, Guillermo and Carmen M. Reinhart, 2002, “Fear of Floating”, Quarterly Journal of Economics, Vol. 117, No. 2 (May), pp. 379–408.
Calvo, Guillermo, Alejandro Izquierdo, and Luis-Fernando Mejía, 2004, “On the Empirics of Sudden Stops: The Relevance of Balance-Sheet Effects,” NBER Working Paper No. 10520 (May).

- 53 -
Céspedes, Luis Felipe, Roberto Chang and Andrés Velasco, 2000, “Balance Sheet Effects and Exchange Rate Policy,” NBER Working Paper No. 7840.
Corsetti, Giancarlo, Paolo Pesenti, and Nouriel Roubini, 1999, “Paper Tigers? A Model of the Asian Crisis,” European Economic Review, Vol. 43 (July), pp. 1211–36.
Corsetti, G., A. Dasgupta, S. Morris, and H. S. Shin, 2004, “Does One Soros Make a Difference? A Theory of Currency Crises with Large and Small Traders,” Review of Economic Studies, Vol. 71, No. 246 (January), pp. 87–113.
De Nicoló, Gianni, Patrick Honohan, and Alain Ize, 2003, “Dollarization of the Banking System: Good or Bad?” IMF Working Paper 03/146 (Washington: International Monetary Fund).
Diamond, Douglas and Raghuram Rajan, 2000, “Banks, Short-Term Debt and Financial Crises: Theory, Policy Implications, and Applications,” NBER Working Paper, No. 7764.
Edwards, Sebastian, 2001, “Dollarization: Myths and Realities,” Journal of Policy Modeling, Vol. 23 (April), pp. 249–65.
Eichengreen, Barry, Ricardo Hausmann, 2002, “Achieving Redemption from Original Sin”, in B. Eichengreen and R. Hausmann, eds., Currency and Maturity Matchmaking: Achieving Redemption From Original Sin (Chicago: University of Chicago Press).
Eichengreen, Barry, Ricardo Hausmann and Ugo Panizza, 2002, “Original Sin: The Pain, The Mystery, and the Road to Redemption,” in B. Eichengreen and R. Hausmann, eds., Currency and Maturity Matchmaking: Achieving Redemption From Original Sin (Chicago: University of Chicago Press).
Eichengreen, Barry, Ricardo Hausmann, Ugo Panizza, 2003, “Currency mismatches, debt intolerance and original sin: Why they are not the same and why it matters,” NBER Working Paper No. 10036.
Gapen, Michel, Dale Gray, Cheng-Hoon Lim, Yingbin Xiao, 2004, “A Contingent Claims Approach to Corporate Vulnerability Analysis: Estimating Default Risk and Economy Wide Risk Transfer,” IMF Working Paper 04/__ (forthcoming).
Garcia, Marcio and Roberto Rigobon, 2004, “A Risk Management Approach to Emerging Market’s Sovereign Debt Sustainability with an Application to Brazilian Data,” NBER Working Paper No. 10336.
Goldstein, Morris, Philip Turner, 2004, Controlling Currency Mismatches in Emerging Markets (Washington: Institute of International Economics).

- 54 -
Gulde, Anne-Marie, David Hoelscher, Alain Ize, Alfredo Leone and David Marston, 2003, Dealing with Banking Crises in Dollarized Economies, in Charles Collyns and Russell Kincaid, eds., Managing Financial Crises: Recent Experience and Lessons From Latin America, IMF Occasional Paper No. 217 (Washington: International Monetary Fund).
Hagan, Sean, Eliot Kalter, and Rhoda Weeks-Brown, 2003, Corporate Debt Restructuring in the Wake of Economic Crisis, in Charles Collyns and R. Kincaid eds., Managing Financial Crises: Recent Experience and Lessons From Latin America, IMF Occasional Paper No. 217 (Washington: International Monetary Fund).
Havrylyshyn, Oleh and Christian Beddies, 2003, “Dollarization in the Former Soviet Union: From Hysteria to Hysteresis,” Contemporary Economic Studies, Summer, pp. 1–29.
International Monetary Fund, 2002, “Assessing Sustainability”, available at: www.imf.org
International Monetary Fund, 2003a, World Economic Outlook September 2003.
International Monetary Fund, 2003b, “Lessons from the Crisis in Argentina,” SM/03/345, (October).
Jeanne, Olivier, and Charles Wyplosz, 2001, “The International Lender of Last Resort: How Large is Large Enough?,” NBER Working Paper No. 8381.
Kaminski, Graciela and Carmen Reinhart, 1999, “The Twin Crises: The Causes of Banking and Balance-of-Payments Problems,” American Economic Review, Vol. 89, pp. 473–500.
Krugman, Paul, 1998, “Curfews On Capital Flight: What Are The Options?” (unpublished, MIT, October 12, http://web.mit.edu/krugman/www/curfews.html).
Krugman, Paul, 1999, “Balance Sheets, The Transfer Problem, and Financial Crises,” in Peter Isard, Asaaf Razin, and Andrew K. Rose, eds., International Finance and Financial Crises: Essays in Honor of Robert P. Flood, Jr., pp. 31–44 (Washington: International Monetary Fund).
Lindgren, Carl-Johan, Tomás J.T. Balino, Charles Enoch, Anne-Marie Gulde, Marc Quintyn, and Leslie Teo, 1999, Financial Sector Crisis and Restructuring—Lessons from Asia, IMF Occasional Paper No. 188 (Washington: International Monetary Fund).
Manasse, Paolo, Nouriel Roubini, Axel Schimmelpfennig, 2003, “Predicting Sovereign Debt Crises,” IMF Working Paper 03/221 (Washington: International Monetary Fund).

- 55 -
Mongardini, Johannes and Johannes Mueller, 2000, “Ratchet Effects in Currency Substitution: An Application to the Kyrgyz Republic,” Staff Papers, International Monetary Fund, Vol. 47, No. 2 (December), pp. 218–37.
Morris, S. and H. S. Shin, 2003,“Global Games: Theory and Applications,” in Mathias Dewatripont, Lars Peter Hansen, and Stephen Turnovsky (eds.), Advances in Economics and Econometrics: Theory and Applications, Eighth World Congress, Vol. 1.
Mulder, Christian, Robert Perrelli, and Manuel Rocha, 2002, “The Role of Corporate, Legal and Macroeconomic Balance Sheet Indicators in Crisis Detection and Prevention,” IMF Working Paper 02/59 (Washington: International Monetary Fund).
Oomes, Nienke, 2003, “Network Externalities and Dollarization Hysteresis: the Case of Russia,” IMF Working Paper 03/96 (Washington: International Monetary Fund).
Reinhart, Carmen M., Kenneth S. Rogoff, Miguel A. Savastano, 2003a,“Debt Intolerance,” in William Brainard and George Perry, eds., Brookings Papers on Economic Activity, No. 1, pp. 1–74.
Reinhart, Carmen M., Kenneth S. Rogoff, Miguel A. Savastano, 2003b,“Addicted to Dollars,” NBER Working Paper No. 10015.
Rodrik, Dani; and Andrès Velasco, 1999, “Short-Term Capital Flows,” NBER Working Paper No. 7364.
Roubini, Nouriel, 2001, Should Argentina Dollarize or Float? The Pros and Cons of Alternative Exchange Rate Regimes and their Implications for Domestic and Foreign Debt Restructuring Reduction, mimeo, (New York: Stern School of Business).
Schneider, Martin and Aaron Tornell, 2000, “Balance Sheet Effects, Bailout Guarantees and Financial Crises,” NBER Working Paper No. 8060.
Zettelmeyer, Jeromin and Olivier D. Jeanne, 2002, “Original Sin, Balance Sheet Crises and the Roles of International Lending,” IMF Working Paper 02/234 (Washington: International Monetary Fund).
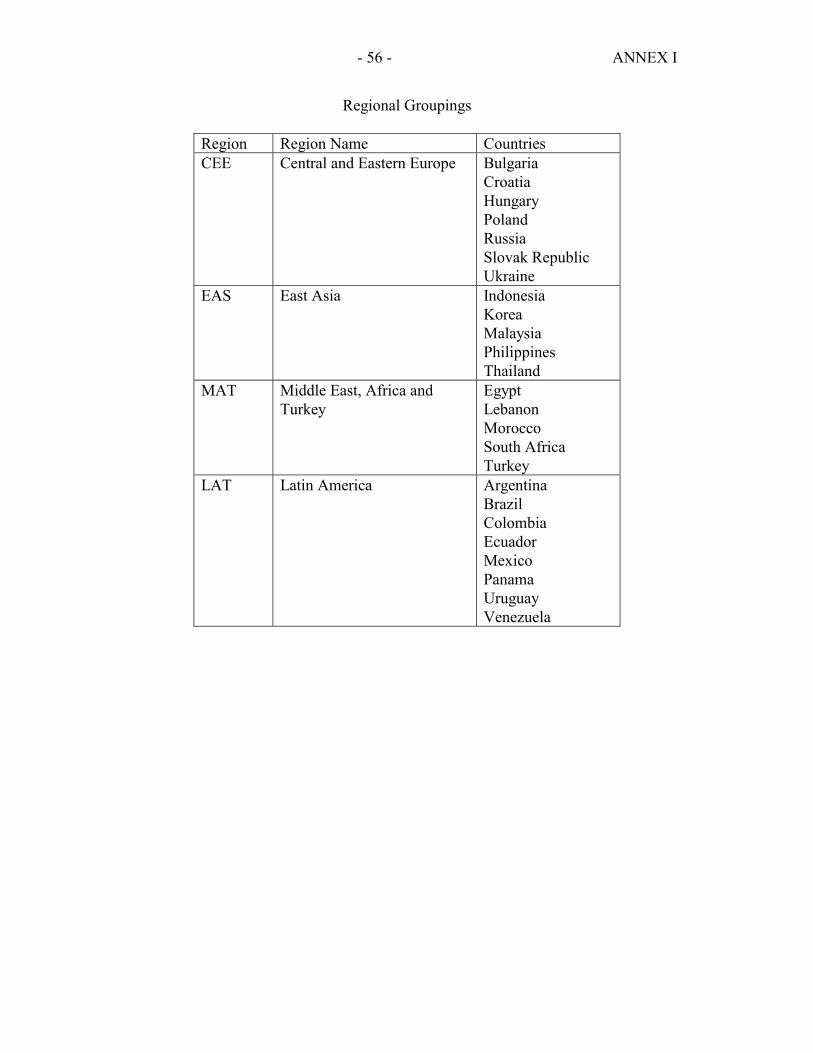
- 56 - ANNEX I
Regional Groupings
Region Region Name Countries CEE Central and Eastern Europe Bulgaria
Croatia Hungary Poland Russia Slovak Republic Ukraine
EAS East Asia Indonesia Korea Malaysia Philippines Thailand
MAT Middle East, Africa and Turkey
Egypt Lebanon Morocco South Africa Turkey
LAT Latin America Argentina Brazil Colombia Ecuador Mexico Panama Uruguay Venezuela
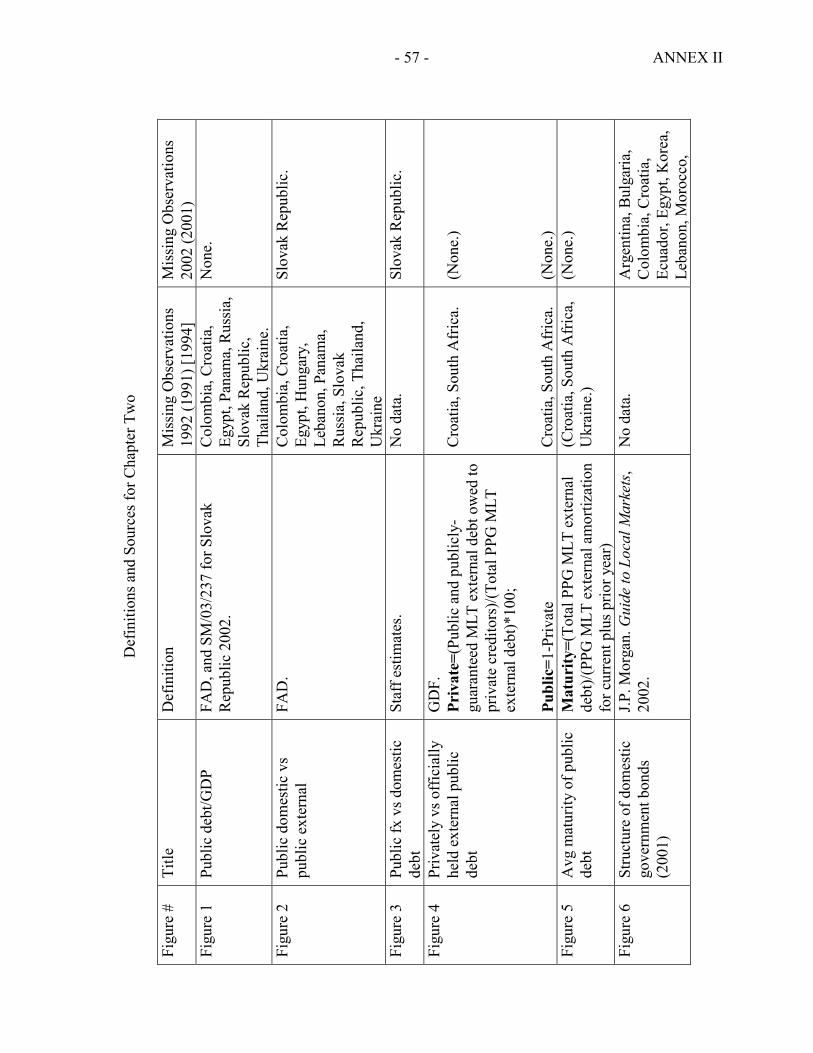
- 57 - ANNEX II
Def
initi
ons a
nd S
ourc
es fo
r Cha
pter
Tw
o Fi
gure
#
Title
D
efin
ition
M
issi
ng O
bser
vatio
ns
1992
(199
1) [1
994]
M
issi
ng O
bser
vatio
ns
2002
(200
1)
Figu
re 1
Pu
blic
deb
t/GD
P FA
D, a
nd S
M/0
3/23
7 fo
r Slo
vak
Rep
ublic
200
2.
Col
ombi
a, C
roat
ia,
Egyp
t, Pa
nam
a, R
ussi
a,
Slov
ak R
epub
lic,
Thai
land
, Ukr
aine
.
Non
e.
Figu
re 2
Pu
blic
dom
estic
vs
publ
ic e
xter
nal
FAD
. C
olom
bia,
Cro
atia
, Eg
ypt,
Hun
gary
, Le
bano
n, P
anam
a,
Rus
sia,
Slo
vak
Rep
ublic
, Tha
iland
, U
krai
ne
Slov
ak R
epub
lic.
Figu
re 3
Pu
blic
fx v
s dom
estic
de
bt
Staf
f est
imat
es.
No
data
.
Slov
ak R
epub
lic.
Figu
re 4
Priv
atel
y vs
off
icia
lly
held
ext
erna
l pub
lic
debt
GD
F.
Priv
ate=
(Pub
lic a
nd p
ublic
ly-
guar
ante
ed M
LT e
xter
nal d
ebt o
wed
to
priv
ate
cred
itors
)/(To
tal P
PG M
LT
exte
rnal
deb
t)*10
0;
Publ
ic=1
-Priv
ate
Cro
atia
, Sou
th A
fric
a.
Cro
atia
, Sou
th A
fric
a.
(Non
e.)
(Non
e.)
Figu
re 5
A
vg m
atur
ity o
f pub
lic
debt
M
atur
ity=(
Tota
l PPG
MLT
ext
erna
l de
bt)/(
PPG
MLT
ext
erna
l am
ortiz
atio
n fo
r cur
rent
plu
s prio
r yea
r)
(Cro
atia
, Sou
th A
fric
a,
Ukr
aine
.) (N
one.
)
Figu
re 6
St
ruct
ure
of d
omes
tic
gove
rnm
ent b
onds
(2
001)
J.P. M
orga
n. G
uide
to L
ocal
Mar
kets
, 20
02.
No
data
. A
rgen
tina,
Bul
garia
, C
olom
bia,
Cro
atia
, Ec
uado
r, Eg
ypt,
Kor
ea,
Leba
non,
Mor
occo
,

- 58 - ANNEX II
Figu
re #
Ti
tle
Def
initi
on
Mis
sing
Obs
erva
tions
19
92 (1
991)
[199
4]
Mis
sing
Obs
erva
tions
20
02 (2
001)
Pa
nam
a, R
ussi
a,
Ukr
aine
, Uru
guay
. Fi
gure
7
Publ
ic S
ecto
r DSA
s (in
tere
st ra
te, e
xcha
nge
rate
)
WEO
. A
s cal
cula
ted
in IM
F de
bt
sust
aina
bilit
y te
mpl
ates
. A
rgen
tina,
Hun
gary
, Pa
nam
a, S
lova
k R
epub
lic.
Arg
entin
a, H
unga
ry,
Pana
ma,
Slo
vak
Rep
ublic
. Fi
gure
8
Prim
ary
surp
luse
s W
EO a
nd st
aff e
stim
ates
for T
urke
y,
Kor
ea, M
alay
sia,
Phi
lippi
nes,
and
Thai
land
in 2
002.
=(
Prim
ary
Bal
ance
/Exc
hang
e R
ate)
/ G
DP*
100
Kor
ea, M
alay
sia,
Ph
ilipp
ines
, Tha
iland
, U
krai
ne.
Non
e.
Figu
re 9
Pu
blic
ext
erna
l de
bt/e
xpor
ts
FAD
deb
t, W
EO o
ther
. =(
(Ext
erna
l deb
t in
perc
ent o
f G
DP/
100)
*WEO
GD
P)/((
Expo
rts
G&
NFS
+Net
tota
l tra
nsfe
rs-N
et
offic
ial t
rans
fers
)/Exc
hang
e R
ate)
*100
Col
ombi
a, C
roat
ia,
Egyp
t, H
unga
ry,
Leba
non,
Pan
ama,
R
ussi
a, S
lova
k R
epub
lic, T
haila
nd,
Ukr
aine
.
Slov
ak R
epub
lic.
Figu
re 1
0
Gro
ss a
nd n
et (e
xcl.
IMF)
rese
rves
/GD
P
IFS
Use
of F
und
Cre
dit,
WEO
oth
er.
Res
erve
s=St
ock
of R
eser
ves a
t yea
r-en
d/G
DP*
100
Net
Res
erve
s=[(
Stoc
k of
rese
rves
at
year
-end
) – (U
se o
f Fun
d C
redi
t)]/G
DP*
100
Slov
ak R
epub
lic.
Slov
ak R
epub
lic.
Non
e.
Non
e.
Figu
re 1
1 B
anki
ng se
ctor
as
sets
/GD
P W
EO G
DP
and
exch
ange
rate
, IFS
ot
her.
={[R
eser
ves(
20)+
Fore
ign
Ass
ets(
21)+
Cla
ims o
n C
G(2
2a)+
Cla
ims o
n St
ate
and
loca
l
Arg
entin
a, B
ulga
ria,
Cro
atia
, Mal
aysi
a,
Rus
sia,
Slo
vak
Rep
ublic
.
Ecua
dor.

- 59 - ANNEX II
Figu
re #
Ti
tle
Def
initi
on
Mis
sing
Obs
erva
tions
19
92 (1
991)
[199
4]
Mis
sing
Obs
erva
tions
20
02 (2
001)
go
vern
men
t(22b
)+C
laim
s on
NFP
S(22
c)+C
laim
s on
priv
ate
sect
or(2
2d)+
Cla
ims o
n ot
her b
anki
ng
inst
itutio
ns(2
2f)+
Cla
ims o
n no
nbla
nk
finan
cial
inst
itutio
ns(2
2g)]
/Exc
hang
e R
ate}
/GD
P*10
0 Fi
gure
12
C
redi
t to
priv
ate
vs
publ
ic se
ctor
W
EO G
DP,
IFS
othe
r. Pu
blic
=[C
laim
s on
CG
(22a
)+C
laim
s on
Sta
te a
nd lo
cal
gove
rnm
ent(2
2b)+
Cla
ims o
n N
FPS(
22c)
]/Exc
hang
e R
ate
Priv
ate=
[Cla
ims o
n pr
ivat
e se
ctor
(22d
)]/E
xcha
nge
Rat
e
Arg
entin
a, C
roat
ia,
Rus
sia,
Slo
vak
Rep
ublic
. C
roat
ia, R
ussi
a, S
lova
k R
epub
lic.
Ecua
dor,
Slov
ak
Rep
ublic
. Ec
uado
r.
Figu
re 1
3
Fx
dep
osits
/tota
l de
posi
ts
IMF
WP/
03/1
46 a
nd st
aff e
stim
ates
for
Bra
zil.
Col
ombi
a, C
roat
ia,
Hun
gary
, Leb
anon
, M
alay
sia,
Mex
ico,
M
oroc
co, P
anam
a,
Phili
ppin
es, P
olan
d,
Rus
sia,
Slo
vak
Rep
ublic
, Uru
guay
, V
enez
uela
(Col
ombi
a, H
unga
ry,
Mor
occo
, Pan
ama,
Sl
ovak
Rep
ublic
.)
Figu
re 1
4
Fx d
omes
tic lo
ans t
o re
side
nts/
tota
l loa
ns
WP/
03/1
46.
All
LAT,
Cro
atia
, Eg
ypt,
Leba
non,
M
alay
sia,
Mor
occo
, Ph
ilipp
ines
, Pol
and,
R
ussi
a, S
lova
k R
epub
lic, S
outh
Afr
ica,
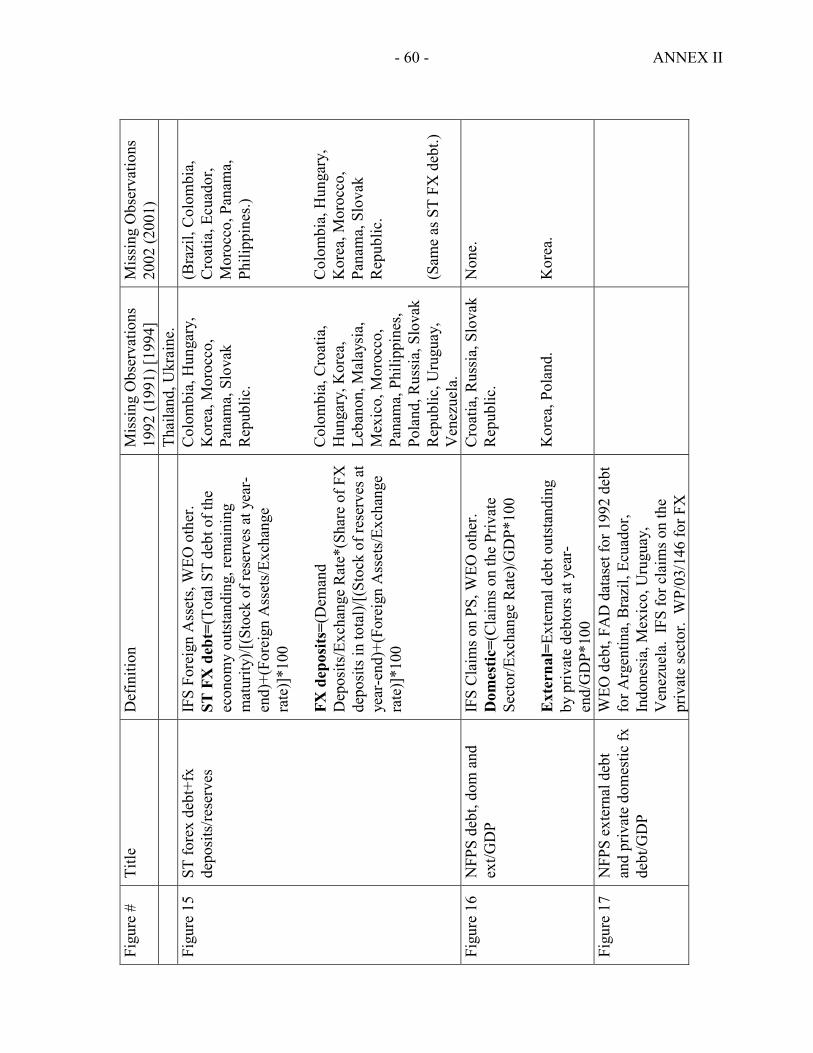
- 60 - ANNEX II
Figu
re #
Ti
tle
Def
initi
on
Mis
sing
Obs
erva
tions
19
92 (1
991)
[199
4]
Mis
sing
Obs
erva
tions
20
02 (2
001)
Thai
land
, Ukr
aine
. Fi
gure
15
ST fo
rex
debt
+fx
depo
sits
/rese
rves
IF
S Fo
reig
n A
sset
s, W
EO o
ther
. ST
FX
deb
t=(T
otal
ST
debt
of t
he
econ
omy
outs
tand
ing,
rem
aini
ng
mat
urity
)/[(S
tock
of r
eser
ves a
t yea
r-en
d)+(
Fore
ign
Ass
ets/
Exch
ange
ra
te)]
*100
FX
dep
osits
=(D
eman
d D
epos
its/E
xcha
nge
Rat
e*(S
hare
of F
X
depo
sits
in to
tal)/
[(St
ock
of re
serv
es a
t ye
ar-e
nd)+
(For
eign
Ass
ets/
Exch
ange
ra
te)]
*100
Col
ombi
a, H
unga
ry,
Kor
ea, M
oroc
co,
Pana
ma,
Slo
vak
Rep
ublic
. C
olom
bia,
Cro
atia
, H
unga
ry, K
orea
, Le
bano
n, M
alay
sia,
M
exic
o, M
oroc
co,
Pana
ma,
Phi
lippi
nes,
Pola
nd, R
ussi
a, S
lova
k R
epub
lic, U
rugu
ay,
Ven
ezue
la.
(Bra
zil,
Col
ombi
a,
Cro
atia
, Ecu
ador
, M
oroc
co, P
anam
a,
Phili
ppin
es.)
Col
ombi
a, H
unga
ry,
Kor
ea, M
oroc
co,
Pana
ma,
Slo
vak
Rep
ublic
. (S
ame
as S
T FX
deb
t.)
Figu
re 1
6
NFP
S de
bt, d
om a
nd
ext/G
DP
IFS
Cla
ims o
n PS
, WEO
oth
er.
Dom
estic
=(C
laim
s on
the
Priv
ate
Sect
or/E
xcha
nge
Rat
e)/G
DP*
100
Ext
erna
l=Ex
tern
al d
ebt o
utst
andi
ng
by p
rivat
e de
btor
s at y
ear-
end/
GD
P*10
0
Cro
atia
, Rus
sia,
Slo
vak
Rep
ublic
. K
orea
, Pol
and.
Non
e.
Kor
ea.
Figu
re 1
7
NFP
S ex
tern
al d
ebt
and
priv
ate
dom
estic
fx
debt
/GD
P
WEO
deb
t, FA
D d
atas
et fo
r 199
2 de
bt
for A
rgen
tina,
Bra
zil,
Ecua
dor,
Indo
nesi
a, M
exic
o, U
rugu
ay,
Ven
ezue
la.
IFS
for c
laim
s on
the
priv
ate
sect
or.
WP/
03/1
46 fo
r FX
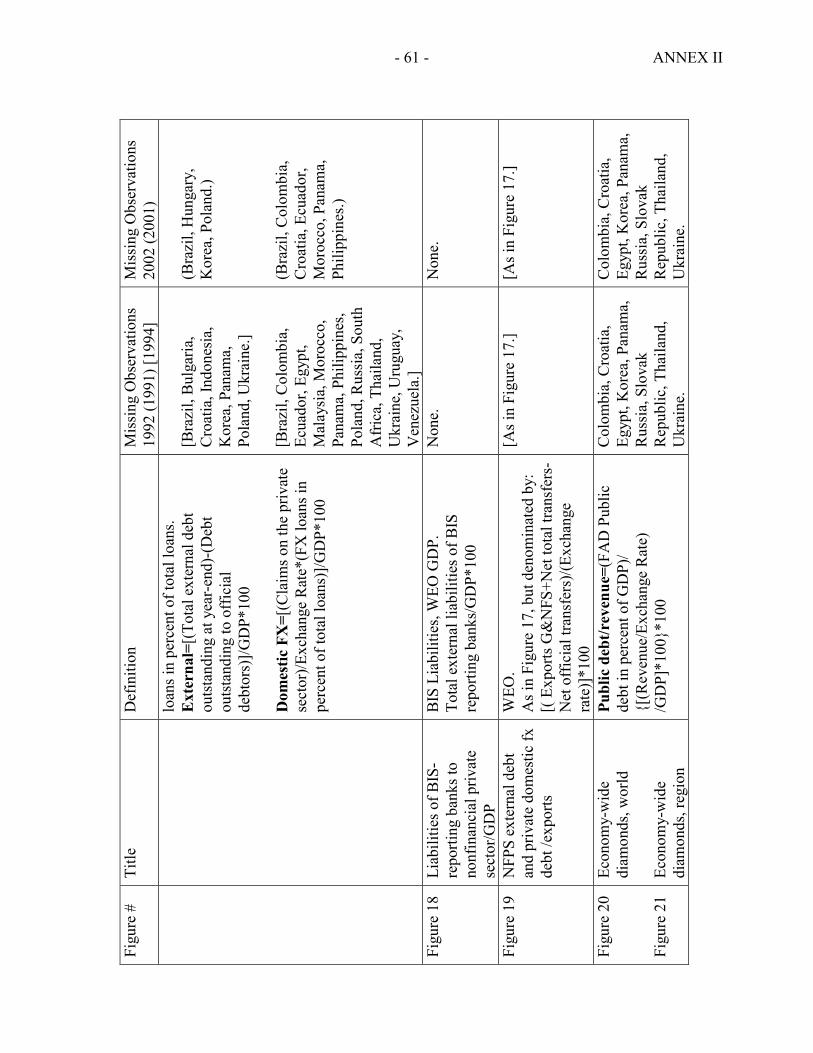
- 61 - ANNEX II
Figu
re #
Ti
tle
Def
initi
on
Mis
sing
Obs
erva
tions
19
92 (1
991)
[199
4]
Mis
sing
Obs
erva
tions
20
02 (2
001)
lo
ans i
n pe
rcen
t of t
otal
loan
s. E
xter
nal=
[(To
tal e
xter
nal d
ebt
outs
tand
ing
at y
ear-
end)
-(D
ebt
outs
tand
ing
to o
ffic
ial
debt
ors)
]/GD
P*10
0 D
omes
tic F
X=[
(Cla
ims o
n th
e pr
ivat
e se
ctor
)/Exc
hang
e R
ate*
(FX
loan
s in
perc
ent o
f tot
al lo
ans)
]/GD
P*10
0
[Bra
zil,
Bul
garia
, C
roat
ia, I
ndon
esia
, K
orea
, Pan
ama,
Po
land
, Ukr
aine
.] [B
razi
l, C
olom
bia,
Ec
uado
r, Eg
ypt,
Mal
aysi
a, M
oroc
co,
Pana
ma,
Phi
lippi
nes,
Pola
nd, R
ussi
a, S
outh
A
fric
a, T
haila
nd,
Ukr
aine
, Uru
guay
, V
enez
uela
.]
(Bra
zil,
Hun
gary
, K
orea
, Pol
and.
) (B
razi
l, C
olom
bia,
C
roat
ia, E
cuad
or,
Mor
occo
, Pan
ama,
Ph
ilipp
ines
.)
Figu
re 1
8 Li
abili
ties o
f BIS
-re
porti
ng b
anks
to
nonf
inan
cial
priv
ate
sect
or/G
DP
BIS
Lia
bilit
ies,
WEO
GD
P.
Tota
l ext
erna
l lia
bilit
ies o
f BIS
re
porti
ng b
anks
/GD
P*10
0
Non
e.
Non
e.
Figu
re 1
9 N
FPS
exte
rnal
deb
t an
d pr
ivat
e do
mes
tic fx
de
bt /e
xpor
ts
WEO
. A
s in
Figu
re 1
7, b
ut d
enom
inat
ed b
y:
[( E
xpor
ts G
&N
FS+N
et to
tal t
rans
fers
-N
et o
ffic
ial t
rans
fers
)/(Ex
chan
ge
rate
)]*1
00
[As i
n Fi
gure
17.
] [A
s in
Figu
re 1
7.]
Figu
re 2
0 Fi
gure
21
Econ
omy-
wid
e di
amon
ds, w
orld
Ec
onom
y-w
ide
diam
onds
, reg
ion
Publ
ic d
ebt/r
even
ue=(
FAD
Pub
lic
debt
in p
erce
nt o
f GD
P)/
{[(R
even
ue/E
xcha
nge
Rat
e)
/GD
P]*1
00}*
100
Col
ombi
a, C
roat
ia,
Egyp
t, K
orea
, Pan
ama,
R
ussi
a, S
lova
k R
epub
lic, T
haila
nd,
Ukr
aine
.
Col
ombi
a, C
roat
ia,
Egyp
t, K
orea
, Pan
ama,
R
ussi
a, S
lova
k R
epub
lic, T
haila
nd,
Ukr
aine
.
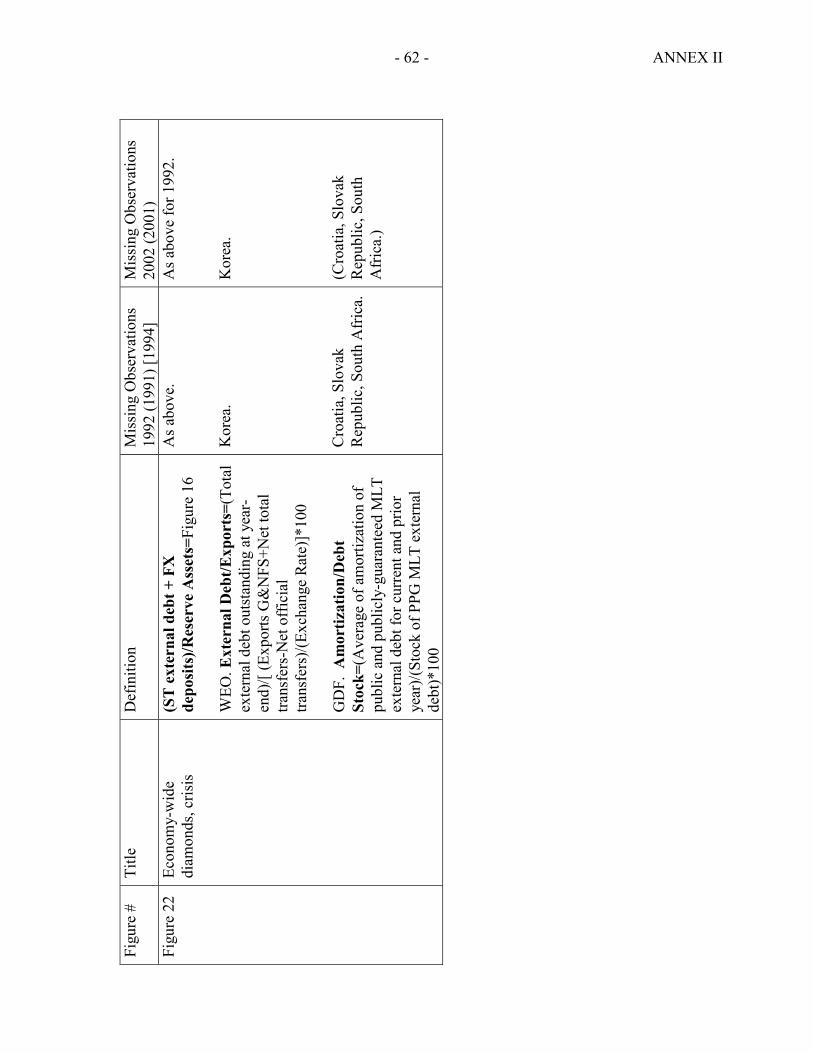
- 62 - ANNEX II
Figu
re #
Ti
tle
Def
initi
on
Mis
sing
Obs
erva
tions
19
92 (1
991)
[199
4]
Mis
sing
Obs
erva
tions
20
02 (2
001)
Fi
gure
22
Econ
omy-
wid
e di
amon
ds, c
risis
(S
T e
xter
nal d
ebt +
FX
de
posi
ts)/R
eser
ve A
sset
s=Fi
gure
16
WEO
. Ext
erna
l Deb
t/Exp
orts
=(To
tal
exte
rnal
deb
t out
stan
ding
at y
ear-
end)
/[ (E
xpor
ts G
&N
FS+N
et to
tal
trans
fers
-Net
off
icia
l tra
nsfe
rs)/(
Exch
ange
Rat
e)]*
100
GD
F. A
mor
tizat
ion/
Deb
t St
ock=
(Ave
rage
of a
mor
tizat
ion
of
publ
ic a
nd p
ublic
ly-g
uara
ntee
d M
LT
exte
rnal
deb
t for
cur
rent
and
prio
r ye
ar)/(
Stoc
k of
PPG
MLT
ext
erna
l de
bt)*
100
As a
bove
. K
orea
. C
roat
ia, S
lova
k R
epub
lic, S
outh
Afr
ica.
As a
bove
for 1
992.
K
orea
. (C
roat
ia, S
lova
k R
epub
lic, S
outh
A
fric
a.)