death and injury rates of u.s. military personnel in iraq · was 90.4% in iraq as compared to 86.5%...
TRANSCRIPT

MILITARY MEDICINE, 175. 4:220.2010
Death and Injury Rates of U.S. Military Personnel in Iraq
Matthew S. Goldberg, PhD
ABSTRACT In the first 6.5 years of Operation Iraqi Freedom (OIF), U.S. military casualties exceeded 3,400 hostiledeaths. 800 nonhostile deaths (due to disease, nonbattle injury, and other causes), and over 31,000 troops wounded inaction. Casualty rates in Iraq have been considerably lower that during the Vietnam conflict, and a greater proportion oftroops wounded in Iraq survive their wounds. Before the surge in troop levels that began in early 2(X)7, the survival ratewas 90.4% in Iraq as compared to 86.5% in Vietnam. Woundcd-in-action rates increased during the first few months ofthe surge, but declined below presurge levels after ihe number oí U.S. brigades in Iraq climbed from 15 to its maximumlevel of 20. Wounds during the surge were somewhat more lethal than previously, but because there were fewer woundingincidents the net effect was a reduction in the hostile death rate.
INTRODUCTIONThe second U.S. invasion of Iraq—Operation Iraqi Freedom(OIF)—began on March 19, 2003. In the easuing 6.5 years, theU.S. military sustained over 3.400 hostile deaths. 800 nonhostiledeaths, and 31,000 wounded in action (WIA).'•- The Departmentof Defense (DoD) regularly reports cumulative numbers ofcasualties along several dimensions such as service branch, geo-graphical location, and mechanism of injury. For several rea-sons, DoD's casualty statistics and their portrayal in the presshave not always been in the ideal format to answer the policyquestions at hand. First, by design, DoD's casualty stati.stics donot include certain nonhostile injuries. Second, several research-ers have estimated the proportion of troops wounded in Iraq whosurvive their wounds (survival rates), and benchmarked themagainst rates from Vietnam and earlier conflicts. However, thoseresearchers have not always used comparable measures for thevarious conflicts. Third, death and injury rates tnay have beenhigher during the surge in Iraq (February 2007 through July2(K)8) than before it, but that distinction is lost in cumulativereports. Last, although not all nonhostile ("accidental") deathsin a large deployed population should be attributed to the war,commentators have not adjusted for baseline death rates pertain-ing to active duty service members during peacetime.
In the first part of this article, I explain the nuances of DoD'scasualty classification system. Next 1 estimate presurge deathand injury rates for Iraq and previous conflicts, and discusswhy different calculations are useful for different purposes.Then I compare the presurge casualty rates for Iraq to thoseduring the surge. In the last section 1 estimate the baselinenonhostile death rate for active duty personnel, which I use toadjust the number of nonhostile deaths in the Iraq theater.
DOD'S CASUALTY CLASSIFICATION SYSTEMAlthough members from all military branches have been killedor injured during the war in Iraq, I use the term "soldiers"
U.S. Congressional Budget Office, Ford House Office Building,Washington. 0 0 20513.
The viewi expressed in this article are those of Ihe ¡lulhor and should notbe interpreted as those of the Congressional Budget Office.
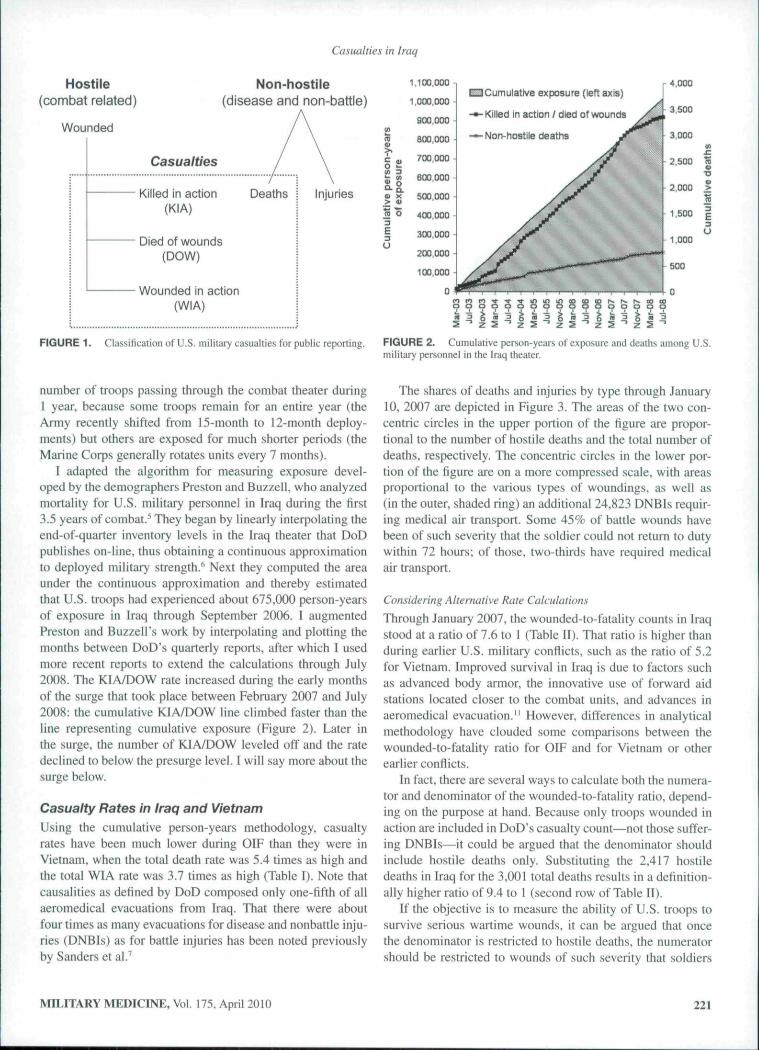
broadly to include not only Army personnel but also sailors,airmen, and marines. DoD defines a "casualty" as any soldierwho is lost to his or her organization or unit. DoD classifiescasuahies as "hostile" if sustained as the direct result of com-bat between U.S. forces and opposing forces, or if sustainedgoing to or returning from a combat mission if the occurrencewas directly related to that mission; this definition excludesinjuries or deaths due to the elements, self-inflicted wounds,or combat fatigue.^
DoD's published casualty statistics further distinguishthree categories of hostile casualties, depending on whetherand where the injured soldiers die:
— Killed-in-action (KIA): those who die immediately onthe battlefield.
— Died-of-wounds (DOW): those who survive injury onthe battlefield, but die after admission to a medicaltreatment facility.
— Wounded-in-action (WIA): those who survive theirinjuries beyond initial hospitalization."*
On its Web sites that tabulate casualties in OperationIraqi Freedom and Operation Enduring Freedom (OEF—Afghanistan), DoD also reports nonhostile fatalities, whichit treats as an additional category of casualties (Figure l).''^(DoD does not report nonhostile, nonfatal injuries onthose Web sites—thus they are excluded from the box inFigure 1—although some of those injuries are reflected in themedical evacuatioti statistics reported on those Web sites.)Finally, DoD does not make any adjustment or notation in itscasualty reports for baseline death and injury rates that sol-diers might experience during peacetime.
PRESURGE DEATH AND INJURY RATES
Estimation of the Population at RiskExpressing deaths and injuries as a rate requires measuringexposure: the number of person-years at risk. Because deathsand injuries occur throughout the year and troop levels vary, asingle point-in-time inventory would provide a poor measureof exposure. Nor would it be satisfactory to count the total
220 MILITARY MEDICINE, Vol. 175. April 2010

Report Documentation Page Form ApprovedOMB No. 0704-0188
Public reporting burden for the collection of information is estimated to average 1 hour per response, including the time for reviewing instructions, searching existing data sources, gathering andmaintaining the data needed, and completing and reviewing the collection of information. Send comments regarding this burden estimate or any other aspect of this collection of information,including suggestions for reducing this burden, to Washington Headquarters Services, Directorate for Information Operations and Reports, 1215 Jefferson Davis Highway, Suite 1204, ArlingtonVA 22202-4302. Respondents should be aware that notwithstanding any other provision of law, no person shall be subject to a penalty for failing to comply with a collection of information if itdoes not display a currently valid OMB control number.
1. REPORT DATE 2010 2. REPORT TYPE
3. DATES COVERED 00-00-2010 to 00-00-2010
4. TITLE AND SUBTITLE Death and Injury Rates of U.S. Military Personnel in Iraq
5a. CONTRACT NUMBER
5b. GRANT NUMBER
5c. PROGRAM ELEMENT NUMBER
6. AUTHOR(S) 5d. PROJECT NUMBER
5e. TASK NUMBER
5f. WORK UNIT NUMBER
7. PERFORMING ORGANIZATION NAME(S) AND ADDRESS(ES) U.S. Congressional Budget Office,Ford House Office Building,Washington,DC,20515
8. PERFORMING ORGANIZATIONREPORT NUMBER
9. SPONSORING/MONITORING AGENCY NAME(S) AND ADDRESS(ES) 10. SPONSOR/MONITOR’S ACRONYM(S)
11. SPONSOR/MONITOR’S REPORT NUMBER(S)
12. DISTRIBUTION/AVAILABILITY STATEMENT Approved for public release; distribution unlimited
13. SUPPLEMENTARY NOTES
14. ABSTRACT see report
15. SUBJECT TERMS
16. SECURITY CLASSIFICATION OF: 17. LIMITATION OF ABSTRACT Same as
Report (SAR)
18. NUMBEROF PAGES
8
19a. NAME OFRESPONSIBLE PERSON
a. REPORT unclassified
b. ABSTRACT unclassified
c. THIS PAGE unclassified
Standard Form 298 (Rev. 8-98) Prescribed by ANSI Std Z39-18
Casualties in Iraq
Hostile(combat related)
Wounded
Non-hostile(disease and non-battle)
Casualties
Injuries a.Killed in action(KIA)
Died of wounds(DOW)
Wounded in action(WIA)
FIGURE 1. Classification of U.S. military casualties for public reporting.
1.100.000
i.oœ.ooo
900,000
800.000
700,000
d>:>!C a>o »-!r » BtXJ.OOO
(D o
E
Cumulative exposure (left axis)
Killed in action / died of wounds
Non-hostile deaths
500,000
4X,0C0
300,000
200,000 -
100,000
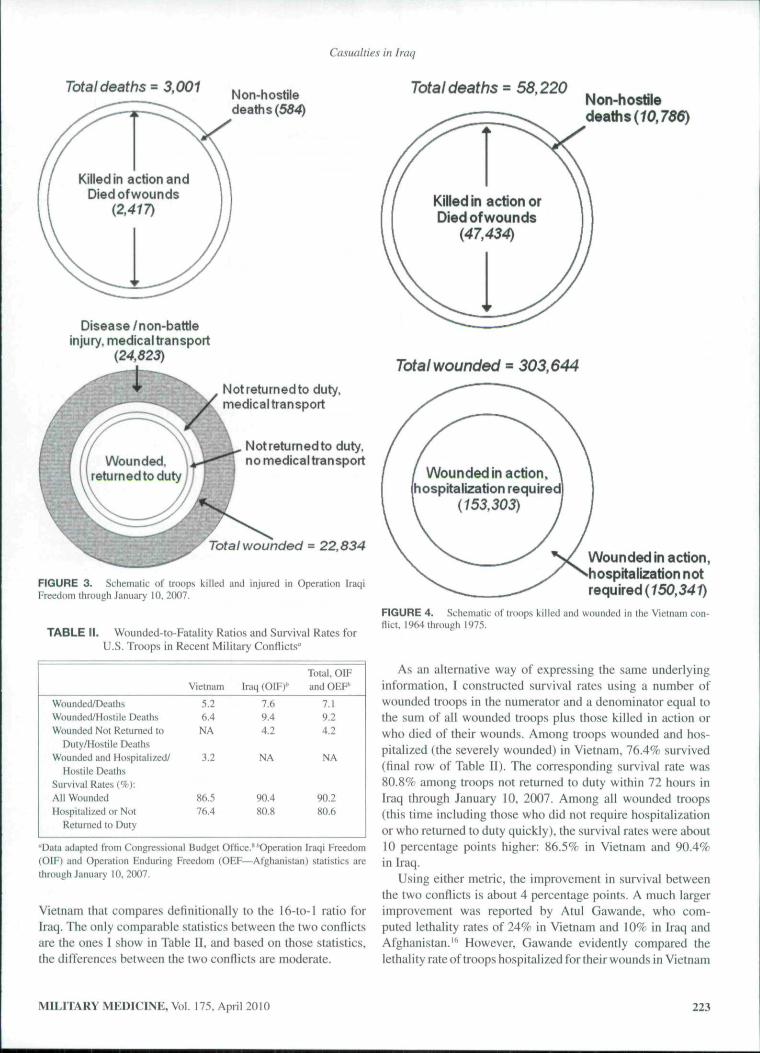
FIGURE 2. Cumulative person-years of exposure and deaths among U.S.military personnel in the kaq theater.
ntimber of troops passing through the combat theater during1 year, because some troops remain for an entire year (theArmy recently shifted from 15-month to 12-month deploy-ments) but others are exposed for much shorter periods (theMarine Corps generally rotates units every 7 months).
I adapted the algorithm for measuring exposure devel-oped by the demographers Preston and Buzzell, who analyzedmortality for U.S. military personnel in Iraq during the first3.5 years of combat.^ They began by linearly interpolating theend-of-quarter inventory levels in the Iraq theater that DoDpublishes on-line, thus obtaining a continuous approximationto deployed military strength.'' Next they computed the areaunder the continuous approximation and thereby estimatedthat U.S. troops had experienced about 675,000 person-yearsof exposure in Iraq through September 2006. I augmentedPreston and Buzzell's work by interpolating and plotting themonths between DoD's quarterly reports, after which I usedmore recent reports to extend the calculations through July2008. The KIA/DOW rate increased during the early monthsof the surge that took place between February 2007 and July2008: the cumulative KÍA/DOW line climbed faster than theline representing cumulative exposure (Figure 2). Later inthe surge, the number of KIA/DOW leveled off and the ratedeclined to below the presurge level. I will say more about thesurge below.
Casualty Rates in Iraq and VietnamUsing the cumulative person-years methodology, casualtyrates have been much lower during OIF than they were inVietnam, when the total death rate was 5.4 times as high andthe total WIA rate was 3.7 times as high (Table I). Note thatcausalities as defined by DoD composed only one-fifth of allaeromedicai evacuations from Iraq. That there were aboutfour times as many evacuations for disease and nonbattle inju-ries (DNBIs) as for battle injuries has been noted previouslyby Sanders et al.''
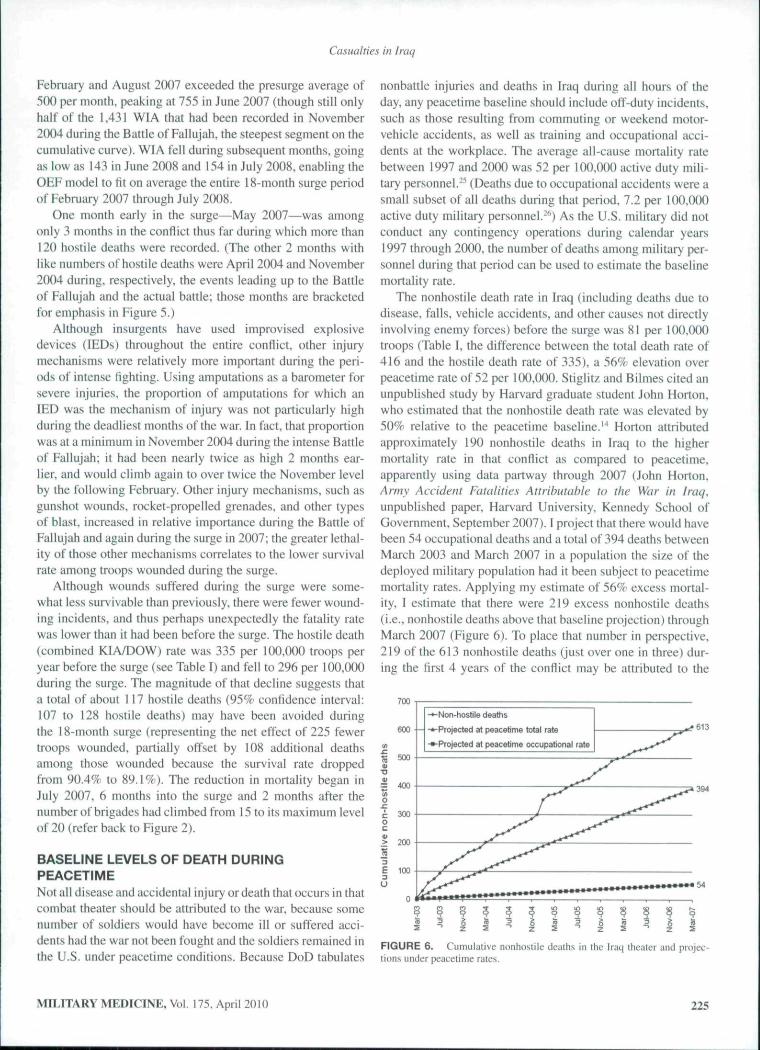
The shares of deaths and injuries by type through January10, 2007 are depicted in Figure 3. The areas of the two con-centric circles in the upper portion of the figure are propor-tional to the number of hostile deaths and the total number ofdeaths, respectively. The concentric circles in the lower por-tion of the figure are on a more compressed scale, with areasproportional to the various types of woundings, as weil as(in the outer, shaded ring) an additional 24.823 DNBTs requir-ing medical air transport. Some 45% of battle wounds havebeen of such severity that the soldier could not return to dutywithin 72 hours; of those, two-thirds have required medicalair transport.
Considering Alternative Rale CalculationsThrough January 2007, the wounded-to-fatality counts in Iraqstood at a ratio of 7.6 to I (Table II). That ratio is higher thanduring earlier U.S. military conflicts, such as the ratio of 5.2for Vietnam. Improved survival in Iraq is due to factors suchas advanced body armor, the innovative use of forward aidstations located closer to the combat units, and advances inaeromedicai evacuation." However, differences in analyticalmethodology have clouded some comparisons between thewounded-to-fatality ratio for OIF and for Vietnam or otherearlier confiicts.
In fact, there are several ways to calculate both the numera-tor and denominator of the wounded-to-fatality ratio, depend-ing on the purpose at hand. Because only troops wounded inaction are included in DoD's casualty count—not those sufter-ing DNBIs—it could be argued that the denominator shouldinclude hostile deaths only. Substituting tbe 2.417 hostiledeaths in Iraq for the 3,001 total deaths results in a definition-ally higher ratio of 9.4 to 1 (second row of Table II).
If the objective is to measure the ability of U.S. troops tosurvive serious wartime wounds, it can be argued that oncethe denominator is restricted to hostile deaths, the numerator.should be restricted to wounds of such severity that soldiers
MILITARY MEDICINE, Vol. 175, April 2010 221

Casualties in Iraq
TABLE I. U.S. Military Casualties Sustained in Operation Iraqi Freedom (Through January 10, 2007) and in the Vietnam Conflict"
Person-Years of Exposure^Deaths
Hostile (killed in aftion or died of wounds)NonhostileTotal deaths
Wounded in ActionRelumed to duty <72 hours
Noi Returned lo Duty, 72 HoursMedical air transport requiredMedica! air transport not requiredTotal, noi returned to duty
Total Wounded ¡n Action^4emorandum:Medical Air Transport
WoundedNonhostile injuriesDiseaseTotal evacuations
Number*
721,220
2,417
3.001
12,643
6,6703.521
10,19122,834
6,6706.640
18.18331.493
Operation Iraqi Freedom
Rate per 100.000 per year
NA
335M
416
1.753
925488
1.4133.166
925921
2,5214,367
Number
2.608.650
47.43410.78658.220
150.341
153.303303,644
Vietnam Conflict
Rate per 100.000 per year
NA
1.818413
2.231
5,763
5.87711,640
"Data reproduced from Congressional Budget Office."''Estimates of casualties sustained in Operation Iraqi Freedom are from the start of that operation (March19, 2003) through January 10, 2007. Tho Iraq theater of operations includes the Arabian Sea. Bahrain. Gulf of Aden. Gulf of Oman. Iraq, Kuwait, Oman,Persian Gulf, Qatar. Red Sea. Saudi Arabia, and United Arab Emirates. Casualties suffered by DepartmenI of Defense civilian personnel and contractors areexcluded from the table. ' Estimates of ca.sualties sustained during the Vietnam conflicl are from two DoD Web sites.''"' ''Person-years of exposure in Vietnamare taken from Preston and Buzzeil.' Person-years of exposure in Iraq represent the author's extension through January 10. 2007 of Preston ;md Buzzell'sestimate through September 30. 2006.
could not return to duty within 72 hours. Because only 45%of the woundings in Iraq have met that criterion (a factor thathas remained remarkably constant during OIF), the wounded-to-fatality ratio is cut by more than half u.sing that computa-tion method.
Linda Bilmes examined the same underlying data throughJanuary 2007, and asserted that the wounded-to-fatal ity ratioin Iraq wdfi 16 to l.'Mn a newspaper editorial she reassertedthat ratio, as compared to ratios below 3.0 in the Vietnam andKorean wars and below 2.0 during World Wars I and II." Inher widely cited book with Joseph Stigiitz in which they esti-mate the cost of the Iraq war. they reported a slightly lowerwounded-to-fatality of 15 to I in Iraq, but still over five timesthe ratio of 2.6 that they reported tor Vietnam,'** To obtain suchhigh ratios for Iraq, the numerator must equal total woundedin action (22,834) plus evacuations for nonhostile injuries(6.640) plus evacuations for disease (18.183). That numera-tor corresponds to the outermost circle in the lower portion ofFigure 3. and the denominator corresponds to the outer circlein the upper portion of the same figure.
Bilmes used a much wider definition of the word "casualty"than does DoD. Including the total number of troops medi-cally evacuated from the Iraq theater for any reason has meritwhen, for example, projecting the medical resources that DoDand the Department of Veterans Affairs will require to care forveterans of the Iraqi conflict. However, tha! approach is prob-lematic for benchmarking against eatlier conflicts because itexaggerates the rate at which the current generation of sol-diers survives their injuries.
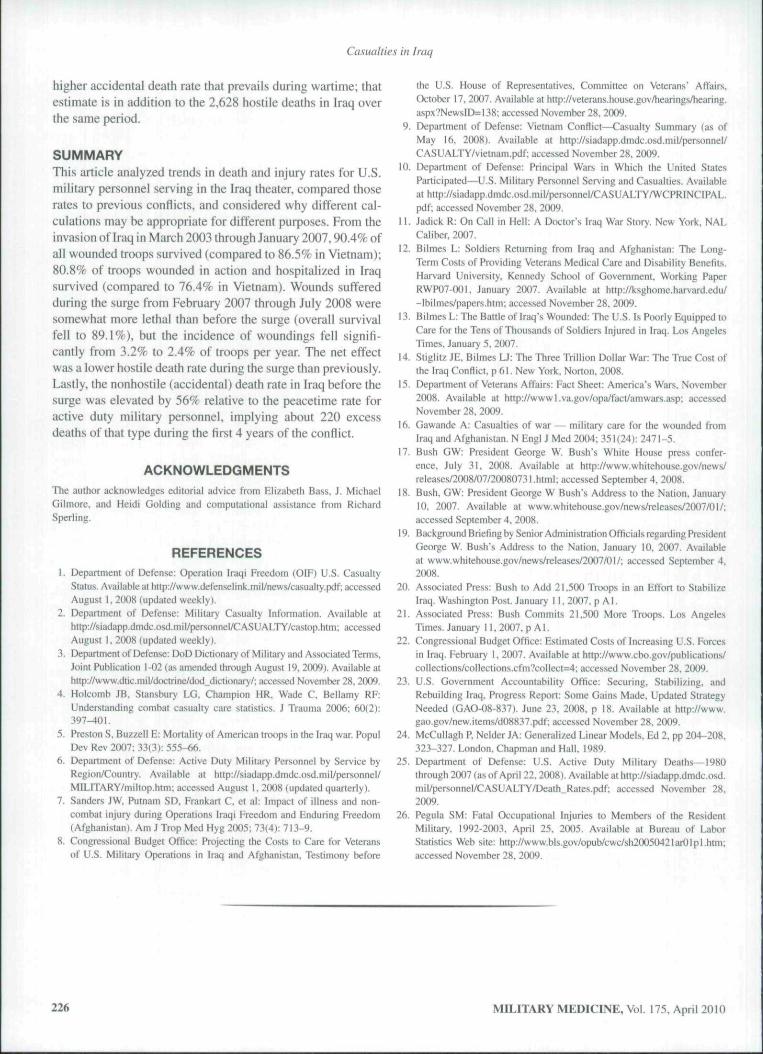
It is well-known that the U.S. military suffered about58,000 deaths in Vietnam, of which 47,000 were the result ofhostile action. There were also 153,000 battle injuries requir-ing hospital care. Lesser known, but still publicly accessi-ble, is that there were an additional 150,000 battle injuriesin Vietnam of lesser severity that did not require hospitaliza-tion (see Table I).'"'"' Because the categories have changedover time and may not map precisely. I equate battle inju-ries in Vietnam not requiring hospital care with battle inju-ries in Iraq after which the soldier was able to return to dutywithin 72 hours. Conversely. I liken soldiers hospitalized dur-ing Vietnam with soldiers in Iraq who were unable to returnto duty within 72 hours. With these approximations, the var-ious wounded-to-fatality ratios are higher than in the cur-rent conflicts (whether or not Afghanistan is included) thanin Vietnam (see Table II), but not nearly as different as sug-gested by Stigiitz and Bilmes.
As already mentioned, to obtain a 16 to I ratio for Iraqone must include both minor and major woundings in thenumerator, as well as troops who were medically evacuatedbecause of DNBIs—all four concentric rings in the lower por-tion of Figure 3. However, Stigiitz and Bilmes' benchmarkratio of 2.6 from Vietnam includes only woundings requir-ing hospitaiization (the inner circle in the lower portion ofFigure 4). Including woundings from the Vietnam conflict thatdid not require hospitaiization (the second ring in Figure 4)would double the ratio to 5.2, as I calculated and displayedin Table 11. But in the absence of data on troops evacuatedfrom Vietnam because of DNBIs. there is no benchmark from
222 MILITARY MEDICINE, Vol. 17.5. April 2010
Casualties in frag
Total deaths = 3,001
Killed in action andDied of wounds
(2,417)
Non-hostiledeaths (554)
Total deaths =58,220
Disease /non-battleinjury, medical transport
(24,823)
Wounded,returnedtoduty
Notretumedto duty,medicaltransport
Notretumedto duty,no medicaltransport
Total wounded = 22,834
FIGURE 3. Sclieniiilic of troops killed and injured in Operation IraqiFreedom through January 10. 2007.
TABLE II. Wounded-to-Fatal ity Ratios and Survival Rates forU.S. Troops in Recent Military Conflicts"
Wounded/DeathsWounded/Hostile DeathsWounded Not Returned to
Duty/Hostile DeathsWiiunded and Hospitalized/
Hostile DeathsSurvival Rates i%):All WoundedHospitalized or Not
Returned to Duty
Vietnam
5.26.4
NA
3.2
86.376.4
Iraq (OIF)*
7.69.44.2
NA
90.480.8
Total. OIFand OEF"
7.19.24.2
NA
90.280.6
"Data adapted from Congressional Budget Oftice."''Operation Iraqi Freedom(OIF) and Operation Enduring Freedom (OEF—Afghanistan) statistics arethrough January 10,2007.
Vietnam that compares definitionally to the 16-to-l ratio forhaq. The only comparable statistics between the two conflictsare the ones 1 show in Table II, and based on those statistics,the differences between the two conflicts are moderate.
Killed in action orDied of wounds
(47,434\
Non-hostiledeaths (70,
Total wounded = 303,644
Wounded in action,hospitalization required
(153,303)
Wounded in action,hospitalization notrequired (750,54i)
FIGURE 4. Schematic of troops killed and wounded in the Vietnam con-liicc, 1964 through 1975.
As an alternative way of expressing the same underlyinginformation, I constructed survival rates using a number ofwounded troops in the numerator and a denominator equal tothe sum of all wounded troops plus those killed in action orwho died of their wounds. Among troops wounded and hos-pitalized (the severely wounded) in Vietnam, 76.4% survived(final row of Table II). The corresponding survival rate was80.8% among troops not returned to duty within 72 hours inIraq through January 10, 2007. Among all wounded troops(this time including those who did not require hospitalizationor who returned to duty quickly), the survival rates were about10 percentage points higher: 86.5% in Vietnam and 90.4%in Iraq.
Using either metric, the improvement in survival betweenthe two conflicts is about 4 percentage points. A much largerimprovement was reported by AtuI Gawande. who com-puted lethality rates of 24% in Vietnam and 10% in Iraq andAfghanistan."' However. Gawande evidently compared thelethality rate of troops hospitalized for their wounds in Vietnam
MILITARY MEDICINE, Vol. 175. April 2010 223

Casualties in Iraq
(1-0.764) to a dissimilar lethality rate of ail wounded troops(whether hospitalized) in Iraq and Afghanistan (1-0.902).
DEATH AND INJURY RATES DURING THE SURGE
Estimation of the Population at Risk: How ManyTroops Comprised the Surge?The surge in forces that boosted the U.S. military presence inthe Iraq region began around February 2007 and ended in July2008 when President George W. Bush declared that all addi-tional troops had returned to the U.S.'' The precise numberof troops associated with the surge has been difficult to deter-mine. When announcing the surge during his January 2007speech. President Bush stated: "So I've committed more than20.000 additional American troops to Iraq. The vast major-ity of them—five brigades—^will be deployed to Baghdad.""^During a background briefing at that time, a senior adminis-tration official prospectively described the surge as consist-ing of 21,000 to 22,000 troops.''' Several newspapers beganreporting the size of the surge as 21,500 troops, a figure per-haps obtained by averaging the range in the senior official'sstatement.-**'' Shortly after President Bush's announcement,the Congressional Budget Office (CBO) pointed out that com-bat units require substantial numbers of supporting troops,such that total forces in the region would more likely increaseby between 35,000 and 48,000 troops.^-
The DoD Joint Chiefs of Staff reported that between June2006 and September 2007, ground forces (Army soldiers andMarines) in the Iraq theater (including Iraq proper as well asBahrain, Kuwait. Oman. Qatar. Saudi Arabia, and United ArabEmirates) increased by 37,900 (from 125,300 to 163,200).According to the same source, total U.S. military forces(excluding Navy personnel aboard ships) increased by 43.500(from 154.100 to 197,600). The Government AccountabilityOffice (GAO), using data it sources to the Joint Chiefs of Staffand the State Department, reported that between December2006 and August 2007 total U.S. military forces (apparentlyin Iraq proper, not the entire theater) increased by 37.000troops (from 132,000 in to 169,000).'^ By either estimate thesurge measures at least 37.000 troops and lies within the rangepredicted by the CBO after accounting for the necessity ofsupport units.
Casuaity Rates in IraqDuring the 18-month surge, some 7,058 U.S. troops werewounded in action, 867 were killed in action or died ofwounds, and 173 suffered nonhostile deaths. The ratio of WIAto all deaths was 6.8, and the ratio of WIA to hostile deathswas 8.1. Those ratios are lower than the presurge values of7.6 and 9.4, respectively (see Table II), indicating a declinein survival. More directly, the survival rate fell from the pre-surge value of 90.4% (see Table II) to 89.1%, a statisticallysignificant drop (odds ratio for wounded versus hostile deathsin the two periods = 0.86 with 95% confidence interval 0.79to 0.94). Although the drop in the survival rate may appear
modest numerically, the magnitude of the decline implies thatabout 100 (point estimate = 108, nearly the size of one riflecompany) fewer troops survived their wounds during the surgethan would have been the case had the (higher) presurge sur-vival rate still prevailed. The incidence of battle injuries, how-ever, was iower during the surge than previously. About 3.2%of soldiers were wounded per year before the surge (3,166per 100,000—see Table I). DoD's reports imply an averagetroop strength of 195,000 in Iraq during the surge. Using thatdenominator, the WIA rate fell to 2.4% per year, a decline sig-nificant at the 7.0% level in a two-sided test.̂ "*
The WIA rate during the surge in Iraq (2.409 per 100.000per year) is more in line with the WIA rate in Afghanistan(about 1.900 per 100,000 per year, measured from October2001 through July 2008) than with presurge Iraq levels.However, the OEF estimate is approximate because DoDpublished only fiscal year-end estimates of troop levels inAfghanistan until December 2004, when it began report-ing quarterly for that region. The WIA rate in Afghanistanfrom the end of that month through July 2008 was 2,367 per100.000 per year, remarkably similar to the WIA rate duringthe surge in Iraq. Indeed, starting with the presurge count of23,422 cumulative WIA in Iraq, the OEF WIA rate of 2,367per 100,000 (calculated from December 2004 through July2008) closely predicts the 30,480 cumulative WIA in Iraqthrough July 2008 (Figure 5). The fit is not exact, because theOEF model implies that WIA would accumulate essentiallylinearly between February 2007 and July 2008 (though notexactly linearly because WIA were projected in proportion totroop levels in Iraq, which peaked at 218.500 in September2007 and then declined).
As indicated by the concave "bump" in Figure 5, WIA inIraq accumulated more rapidly than predicted by the modelduring the first few months of the surge. WIA between
35,000
iV\tounded inactionI Projected at OEF rate
Z X
FIGURE 5. Cumulative U.S. military wounded-in-action in the Iraq the-ater, before and during the suige in forces.
224 MILITARY MEDICINE, Vol. 175, April 2010
Casualties in Iraq
February and August 2007 exceeded the presurge average of500 per month, peaking at 755 in June 2007 (though still onlyhalf of the 1.431 WIA that had been recorded in November2004 during the Battle of Fallujah, the steepest segment on thecumulative curve). WIA fell during subsequent months, goingas low as 143 in June 2008 and 154 in July 2008. enabling theOEF model to fit on average the entire 18-month surge periodof February 2007 through July 2008.
One month early in the surge—May 2007—was amongonly 3 mtinths in the conflict thus far during which more than120 hostile deaths were recorded. (The other 2 months withlike numbers of hostile deaths were April 2004 and November2004 during, respectively, the events leading up to the Battleof Fallujah and the actual battle; those months are bracketedfor emphasis in Figure 5.)
Although insurgents have used improvised explosivedevices (lEDs) throughout the entire conflict, other injurymechanisms were relatively more important during the peri-ods of intense fighting. Using amputations as a barometer forsevere injuries, the proportion of amputations for which anIED was the mechanism of injury was not particularly highduring the deadliest months of the war. In fact, that proportionwas at a minimum in November 2004 during the intense Battleof Fallujah; it had been nearly twice us high 2 months ear-lier, and would climb again to over twice the November levelby the following February. Other injury mechanisms, such asgunshot wounds, rocket-propel led grenades, and other typesof blast, increased in relative importance during the Battle ofFallujah and again during the surge in 2007; the greater lethal-ity of those other mechanisms correlates to the lower survivalrate among troops wounded during the surge.
Although wounds suffered during the surge were some-what less survivable than previously, there were fewer wound-ing incidents, and thus perhaps unexpectedly the fatality ratewas lower than it had been before the surge. The hostile death(combined KIA/DOW) rate was 335 per 100,000 troops peryear before the surge (see Table I) and fell to 296 per 100,000during the surge. The magnitude of that decline suggests thata total of about 117 hostile deaths (95% confidence interval:107 to 128 hostile deaths) may have been avoided duringthe 18-month surge (representing the net effect of 225 fewertroops wounded, partially offset by 108 additional deathsamong those wounded because the survival rate droppedfrom 90.4% to 89.1%). The reduction in mortality began inJuly 2007, 6 months into the surge and 2 months after thenumber of brigades had climbed from 15 to its maximum levelof 20 (refer back to Figure 2).
BASELINE LEVELS OF DEATH DURINGPEACETIMENot all disease and accidental injury or death that occurs in thatcombat theater should be attributed to the war. because somenumber of soldiers would have become ill or suffered acci-dents had the war not been fought and the soldiers remained inthe U.S. under peacetime conditions. Because DoD tabulates
nonbattle injuries and deaths in Iraq during all hours of theday, any peacetime baseline should include off-duty incidents,such as those resulting from commuting or weekend motor-vehicle accidents, as well as training and occupational acci-dents at the workplace. The average all-cause mortality ratebetween 1997 and 2000 was 52 per 100.(K)0 active duty mili-tary personnel.""" (Deaths due to occupational accidents were asmall subset of all deaths during that period. 7.2 per 100,000active duty military personnel.-*') As the U.S. military did notconduct any contingency operations during calendar years1997 through 20(X). the number of deaths among military per-sonnel during that period can be used to estimate the baselinemortality rate.
The nonhostile death rate in Iraq (including deaths due todisease, falls, vehicle accidents, and other causes not directlyinvolving enemy forces) before the surge was 81 per 100,000troops (Table I, the difference between the total death rate of416 and the hostile death rate of 335). a 56% elevation overpeacetime rate of 52 per 100,000. Stiglit/ and Bilmes cited anunpublished study by Harvard graduate student John Horton.who estimated that the nonhostile death rate was elevated by50% relative to the peacetime baseline.'"* Horton attributedapproximately 190 nonhostile deaths in Iraq to the highermortality rate in that conflict as compared to peacetime,apparently using data partway through 2007 (John Horton,Army Accident Fatalities Ailributuble to the War in Iraq.unpublished paper. Harvard University, Kennedy School ofGovernment. September 2007). I project that there would havebeen 54 occupational deaths and a total of 394 deaths betweenMarch 2003 and March 2007 in a population the size of thedeployed military population had it been subject to peacetimemortality rates. Applying my estimate of 56% excess mortal-ity, I estimate that ihere were 219 excess nonhostile deaths(i.e., nonhostile deaths above that baseline projection) throughMarch 2007 (Figure 6). To place thai number in perspective,219 of the 613 nonhostile deaths (just over one in three) dur-ing the first 4 years of the conflict may be attributed to the
700
600
500
400
-Non-hostile deaths
-Proiected at peacetime total rate
-Projected at peacetime occupational rate
-»613
FIGURE 6. Cutnulative nonhostile deaths in the Iraq theater and projec-tions under peacetime rates.
MILITARY MEDICINE, Vol. 173. April 2010 225
Casualties in Iraq
higher accidental death rate that prevails during wartime; thatestimate is in addition to the 2,628 hostile deaths in Iraq overthe same period.
SUMMARYThis article analyzed trends in death and injury rates for U.S.military personnel serving in the Iraq theater, compared thoserates to previous conflicts, and considered why different cal-culations may be appropriate for different purposes. From theinvasion of Iraq in March 2003 through January 2007,90.4% ofall wounded troops survived (compared to 86.5% in Vietnam);80.8% of troops wounded in action and hospitalized in Iraqsurvived (compared to 16.4% in Vietnam). Wounds sufferedduring the surge from February 2007 through July 2008 weresomewhat more lethal than before the surge (overall survivalfell to 89.1%), but the incidence of woundings fell signifi-cantly from 3.2% to 2.4% of troops per year. The net effectwas a lower hostile death rate during the surge than previously.Lastly, the nonhostile (accidental) death rate in Iraq before thesurge was elevated by 56% relative to the peacetime rate foractive duty military personnel, implying about 220 excessdeaths of that type during the first 4 years of the conflict.
ACKNOWLEDGMENTSThe author acknowledges editorial advice from Elizabeth Bass, J. MichaelGilmore. and Heidi Golding and computational assistance from RichardSperling.
REFERENCES1, Department of Defense; Operation Iraqi Freedom (OIF) U.S. Casualty
Stalus. Available at http://www.defensel ink, mi I/news/casual ty.pdf: accessedAugust 1, 2008 (updated weekly),
2, Department of Det'eníie: Military Casualty Information. Avaiiable alh[1p://siadapp.dmdc.osd,mil/personnel/CASUALTy/castop.hlm; accessedAugust 1. 2008 (updated weekly),
3, Depiulmeni of Defense: DoD Dictionary of Military and Associated Terms,Joint Publication i-02 (as amended through August 19, 2(X)9), Available athttp://www.dtic.mil/d(x;trinc/dod_dictionary/; accessed November 28, 2(X)9,
4, Holcomb JB. Stan.sbury LG, Champion HR, Wade C, Bellamy RF:Understanding combat casualty care statistics. J Trauma 2006; 60(2):397-401.
5, PrestonS, Buzzell E: Mortality of American troops in the Iraq war, PopulDev Rev 2007; 33(3): 555-66.
6, Department of Defense: Active Duty Military Personnel by Service byRegion/Country, Available at hup://siadapp.dm(lc.osd, mi I/personnel/MILITARY/miltop.htm: accessed August I, 2008 (updated quarterly).
7, Sanders JW, Putnam SD, Frankart C, et al: Impact of illness and non-combat injury during Operations Iraqi Freedom and Enduring Freedom(Afghanistan), Am J Trop Med Hyg 200.S: 73(4); 713-9.
8, Congressional Budget Office: Projecting the Costs to Care for Veteransof U.S. Military Operations in Iraq and Afghanistan, Testimony before
the U.S. House of Representatives, Committee on Veterans' Affairs,October 17. 2007. Available at http://veterdns.house,gov/hearings/hearing.aspx?NewslD=!38; accessed November 28, 2009.
9. Department of Defense: Vietnam Conflict—Casualty Summary (as ofMay 16, 2008), Available at http ://siadapp.dmdc,osd, mi I/personnel/CASUALTY/vietnam.pdf: accessed November 28, 2009,
10, Department of Defense: Principal Wars in Which the United StatesParticipated^U.S. Military Personnel Serving and Casualties. Avaiiableathttp;//siadapp,dmdc,osd.mil/personnel/CASUALTYAVCPRINCIPAL,pdf: accessed November 28. 2(H)9.
11, Jadick R: On Call in Hell; A Doctor's Iraq War Story, New York, NALCaliber, 2OÜ7.
12, Bilmes L: Soldiers Returning from Iraq and Afghanistan; The Long-Term Costs of Providing Veterans Medical Care and Disability Benefits,Harvard University. Kennedy School of Government. Working PaperRWP07-00I. January 2007. Avaiiable at hltp://ksghome.harvard,edu/~lbiimes/papers,htm: accessed Novesnber 28, 2009.
i 3, Bilmes L: The Battie of Iraq's Wounded: The U.S. Is Poorly Equipped toCare for the Tens of Thousands of Soldiers Injured in Iraq. Los AngelesTimes. January 5, 2(X)7.
14. Stiglitx JE. Bilmes U: The Three Trillion Dollar War; The True Cost ofthelraqConflict, p6 l . New York, Norton. 2008.
15. Department of Veterans Affairs: Fact Sheet: America's Wars, November2008, Available at http://wwwl,va.gov/opa/fact/amwars.asp; accessedNovember 28, 2009.
16. Gawande A: Casualties of war — military care for the wounded fromIraq and Afghanistan. N EngI J Med 2(H)4; 351(24): 2471-5,
17. Bush GW: President George W, Bush's White House press confer-ence, July 31, 2008. Available at hnp://www,whitehouse,gov/news/reieases/2O08/O7/20O8O73I.html: accessed September4. 2008.
18. Bush, GW: President George W Bush's Address to the Nation. January10. 2007. Avaitabie at www,whitehouse.gov/news/releases/2007/OI/;accessed September 4, 2008.
19. Background Briefmgby Senior Administration Officials regarding PresidentGeorge W, Bush's Address to the Nation, January 10, 2007. Avaiiabieat www, whitehouse.gov/news/releases/2007/01/; accessed September 4,2008,
20. Associated Press; Bush to Add 21,500 Troops in an Effort to StabilizeIraq. Washington Post, January I 1, 2007, p A1.
21. Associated Press: Bush Commits 21.500 More Troops. Los AtigelesTimes. January 11, 2007, p AI,
22. Congressional Budget Office: Estimated Costs of Increasing U.S. Forcesin Iraq. February I, 2007, Available at http;//www.cbo,gov/publ[cations/collections/coilections.cfm?coiiect=4; accessed November 28, 2009.
23. U.S. Government Accountabiiity Office: Securing. Stabilizing, andRebuilding Iraq. Progress Report: Some Gains Made, Updated StrategyNeeded (GAO-08-837)- June 23. 2008, p 18. Available at http://www,gao.gov/new.items/u08837.pdf; accessed November 28, 2009.
24. McCutlagh P, Neider JA: Generalized Linear Models, Ed 2. pp 204-208,323-327, London. Chapman and Hall, 1989,
25. Department of Defense: U,S. Active Duty Military Deaths—1980through 2(H)7 (as of April 22,2008), Available at http://siadapp,dmdc.osd.mi I/person nel/CAS U ALT Y/Death_Rates, pdf; accessed November 28,2009.
26. Pegula SM: Fatal Occupational Injuries to Members of the ResidentMilitary. 1992-2(X)3, April 25, 2005, Available at Bureau of LaborStatistics Web site: http;//www.bls,gov/opub/cwc/sh20050421arOIpl,htm;accessed November 28, 2009.
226 MILITARY MEDICINE, Vol. 175, April 2010

Copyright of Military Medicine is the property of Association of Military Surgeons of the United States and its
content may not be copied or emailed to multiple sites or posted to a listserv without the copyright holder's
express written permission. However, users may print, download, or email articles for individual use.