deana crumbling epa osrti crumbling.deana@epa - … · deana crumbling epa osrti...
TRANSCRIPT
121st Annual NARPM Training ProgramFRTR Meeting, May 5, 2011
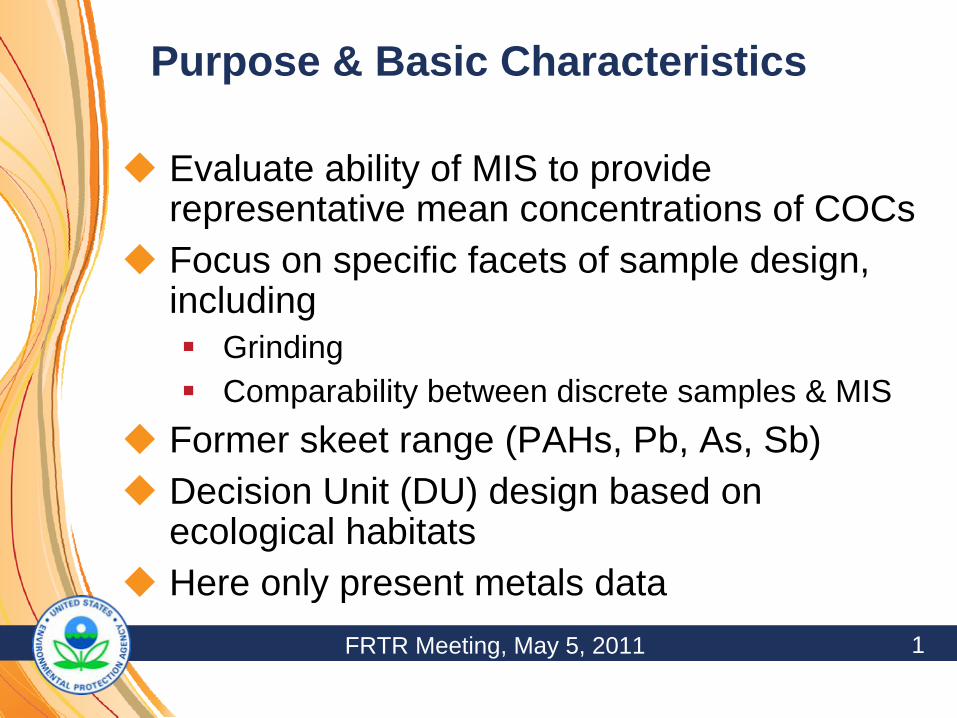
Purpose & Basic Characteristics
Evaluate ability of MIS to provide representative mean concentrations of COCs
Focus on specific facets of sample design, including
Grinding
Comparability between discrete samples & MIS
Former skeet range (PAHs, Pb, As, Sb)
Decision Unit (DU) design based on ecological habitats
Here only present metals data

221st Annual NARPM Training ProgramFRTR Meeting, May 5, 2011

321st Annual NARPM Training ProgramFRTR Meeting, May 5, 2011
Study Design
DU# Field Replicate Sample (3)
LaboratoryPre-Grind Replicates (5) *
LaboratoryPost-Grind Replicates (5)*
Laboratory Post-Grind Replicates (3)*
Discrete (49)
1
2
3
4
5
6
* - Only 1 of the 3 field replicate samples from each DU was included in thisportion of the evaluation. The other field replicates were simply sub-sampled once after sieving, drying and grinding.

421st Annual NARPM Training ProgramFRTR Meeting, May 5, 2011
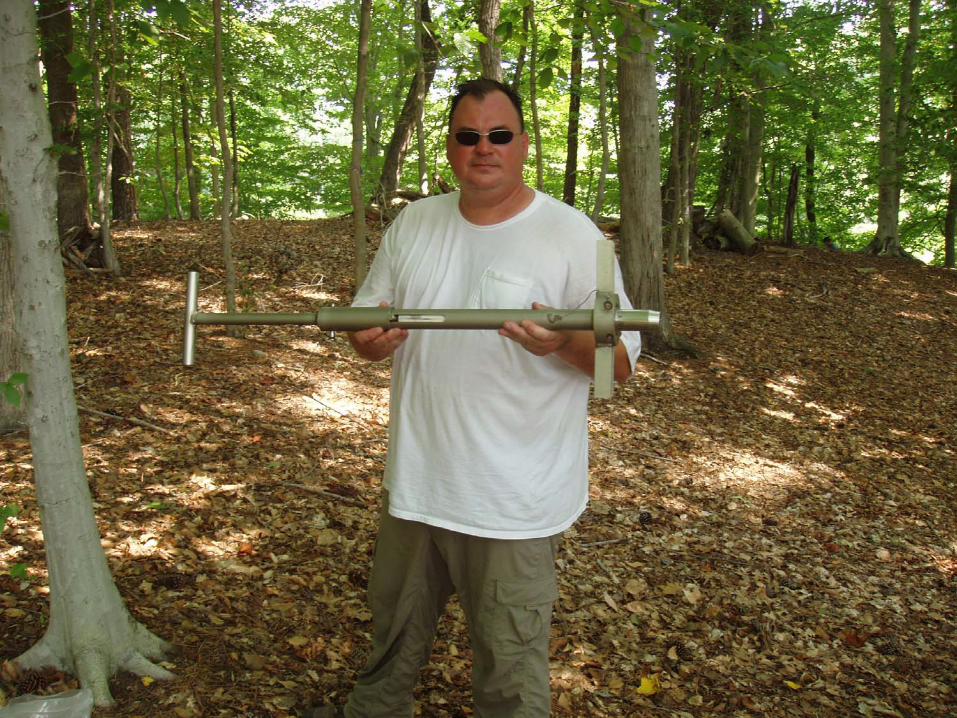
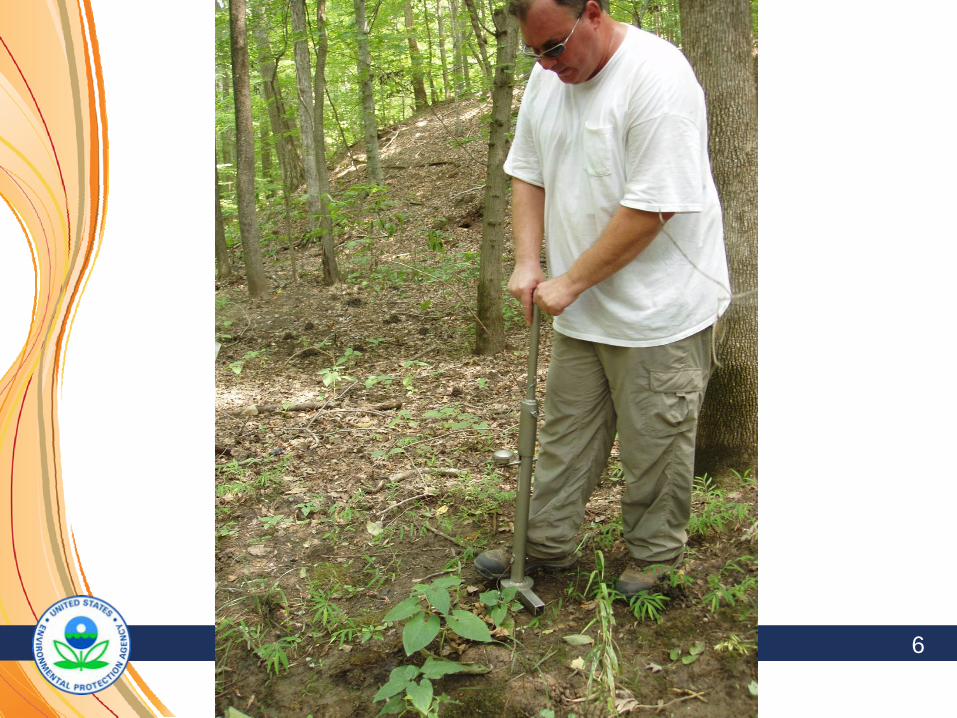
Pictures
521st Annual NARPM Training ProgramFRTR Meeting, May 5, 2011
621st Annual NARPM Training ProgramFRTR Meeting, May 5, 2011

721st Annual NARPM Training ProgramFRTR Meeting, May 5, 2011
821st Annual NARPM Training ProgramFRTR Meeting, May 5, 2011
Two Questions the Ft Eustis Data Can Address
Does grinding a sample increase the acid solubility of the matrix and release metals that would normally not be measured by ICP and that probably would not be bioavailable?
Can incremental sampling produce data comparable to what would be obtained by a reasonably dense discrete sampling design?

921st Annual NARPM Training ProgramFRTR Meeting, May 5, 2011
Does Grinding Increase Metal Solubilization During Digestion?
Short answer: a qualified “No”, might depend on matrix
Long answer: The evidence from 2 of the DUs is solidly against the conclusion that grinding elevates metal concentration results.
Forested wetland DU (DU2) did show statistical elevation of Sb, As and Pb in ground vs unground samples.
Cannot be ruled out that something about the forested wetland matrix facilitates greater solubilization of Sb, As and Pb from ground samples.
But other metals in the DU’s data set did not show this pattern
There is another explanation for this observation
1021st Annual NARPM Training ProgramFRTR Meeting, May 5, 2011
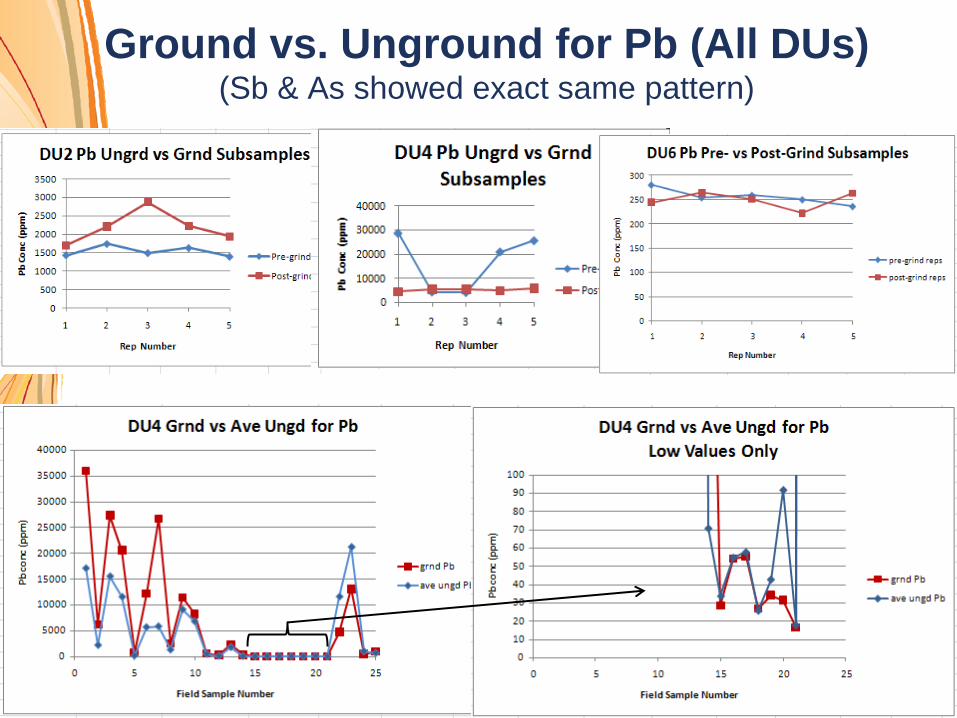
Ground vs. Unground for Pb (All DUs) (Sb & As showed exact same pattern)

1121st Annual NARPM Training ProgramFRTR Meeting, May 5, 2011
Why Do We Sometimes See Higher Metal Concentrations in Ground
Samples?
1) Part of the explanation is simple chance. By chance, some ground sample results will be higher than unground sample results.
This study looked at a large amount of data amenable to statistical analysis
Frequency of ground samples being higher is balanced by frequency of being lower or the same.

1221st Annual NARPM Training ProgramFRTR Meeting, May 5, 2011
This study contained 4 experiments testing whether analyte concentrations increased after grinding. This table presents the results for Sb, As & Pb.
# of experiments finding the ground conc to be statistically:
Higher The Same
Lower
Sb 3 1As 2 1 1Pb 2 2
1321st Annual NARPM Training ProgramFRTR Meeting, May 5, 2011
“Bleed” from Grinder Can Add Certain Metals
This seems to be the case for Cr in this study.
Cr was the only element with ground concentrations consistently higher than the corresponding unground samples’ concentrations.
A stainless steel grinder was used.

14FRTR Meeting, May 5, 2011
Increase in Cr with Grinding

1521st Annual NARPM Training ProgramFRTR Meeting, May 5, 2011
Particle Effects Can Make It Appear that Ground Conc’s Are Higher than Unground
Given the particulate nature of soil, this is to be expected
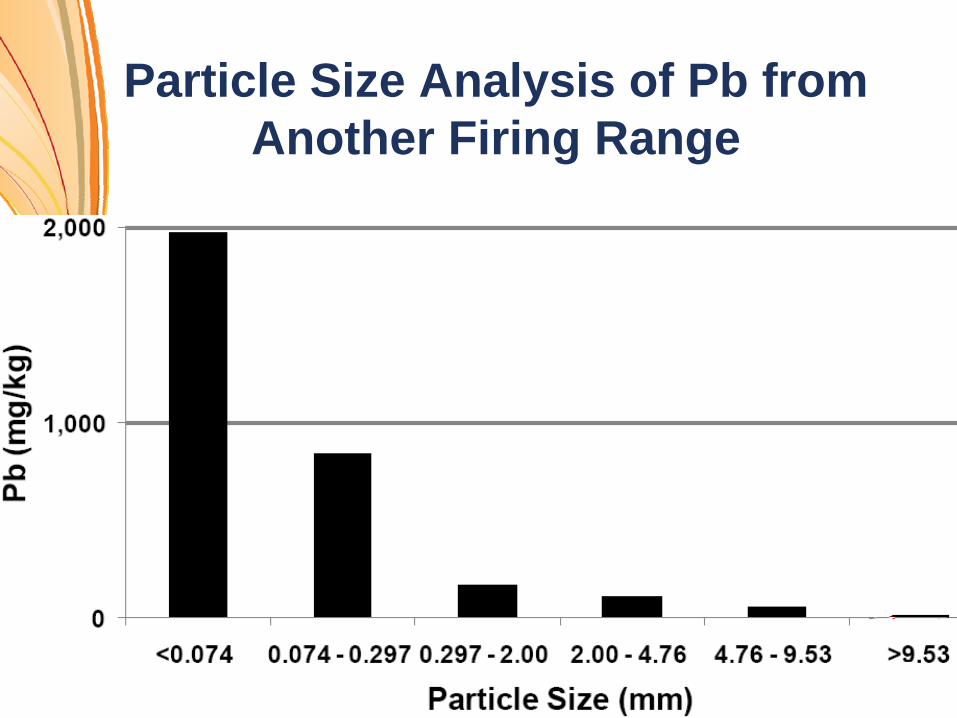
It is well-known that contaminants concentrate in the very small particle size fractions
For Pb shot, this happens in several ways
Corrosion via OC, DO and Eh (Cao et al, 2003)
Dust from firing and abrasion by travel through soil (Hardison et al, 2004)
1621st Annual NARPM Training ProgramFRTR Meeting, May 5, 2011
Particle Size Analysis of Pb from Another Firing Range
1721st Annual NARPM Training ProgramFRTR Meeting, May 5, 2011
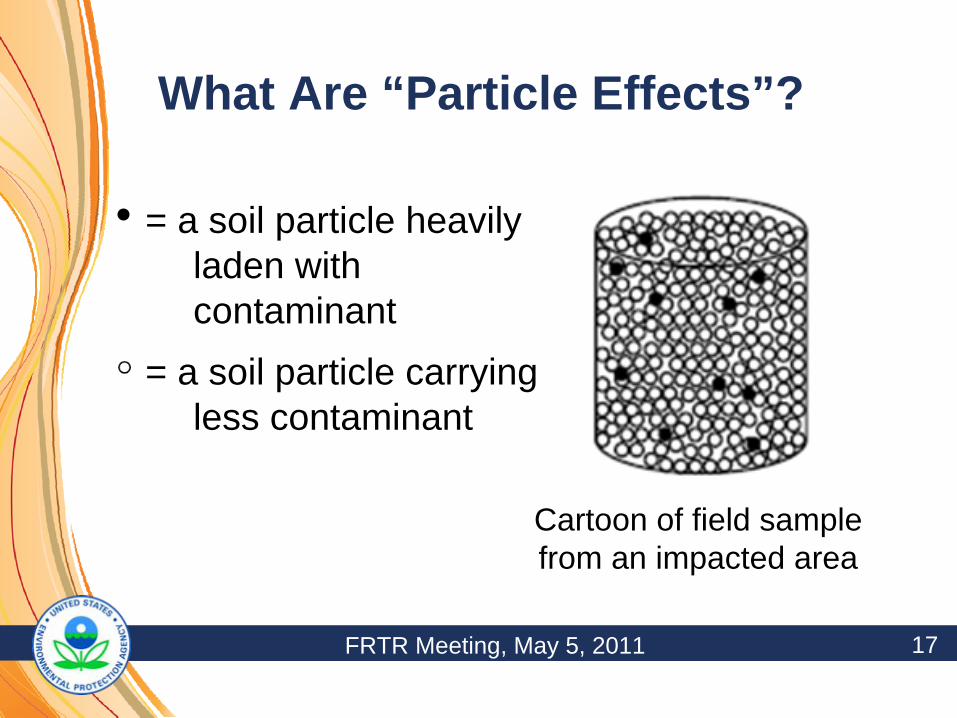
What Are “Particle Effects”?
= a soil particle heavily laden with contaminant
= a soil particle carrying less contaminant
Cartoon of field sample from an impacted area

1821st Annual NARPM Training ProgramFRTR Meeting, May 5, 2011
Subsampling a Particulate MaterialSmall subsamples & large particles => data variability
Reduction of particle size required for more representative sampling
Can reduce, but not entirely eliminate particle effects!Grinding creates a physical average for sample
1921st Annual NARPM Training ProgramFRTR Meeting, May 5, 2011
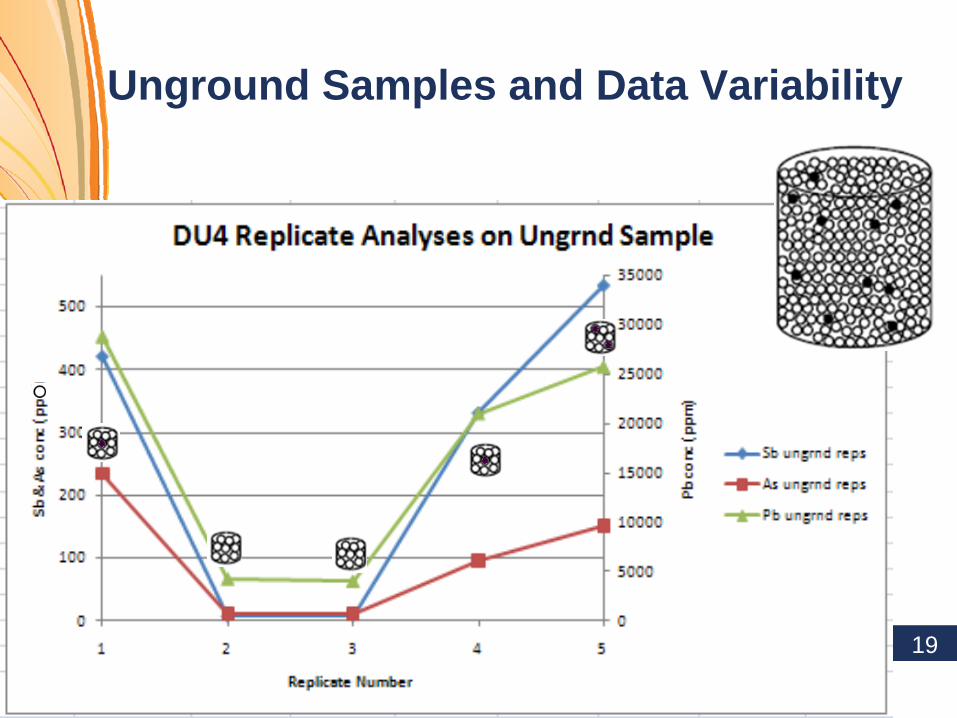
Unground Samples and Data Variability

2021st Annual NARPM Training ProgramFRTR Meeting, May 5, 2011
Fluctuations in Sb, As & Pb Conc
For a mild to moderately contaminated soil, more likely to get Subsample A rather than B.
Produces lognormal data populations.
Subsample C Average conc for ground
samples higher than the unground results, which
are very common

2121st Annual NARPM Training ProgramFRTR Meeting, May 5, 2011
Did Grinding Markedly Reduce Variability?
Sometimes
Hg consistently saw decreased variability across all DUs
Other metals and DUs were variable
All samples had been sieved
Possibly the sieving was as effective as grinding in this case
2221st Annual NARPM Training ProgramFRTR Meeting, May 5, 2011
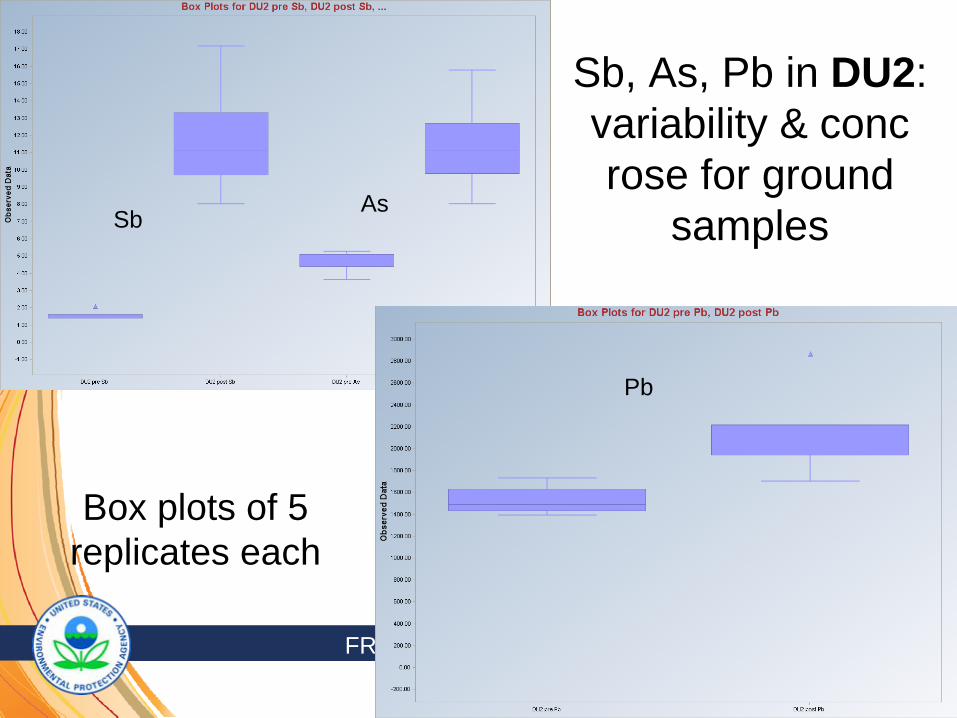
Sb, As, Pb in DU2: variability & conc rose for ground
samples
Box plots of 5 replicates each
Sb
Pb
As
2321st Annual NARPM Training ProgramFRTR Meeting, May 5, 2011
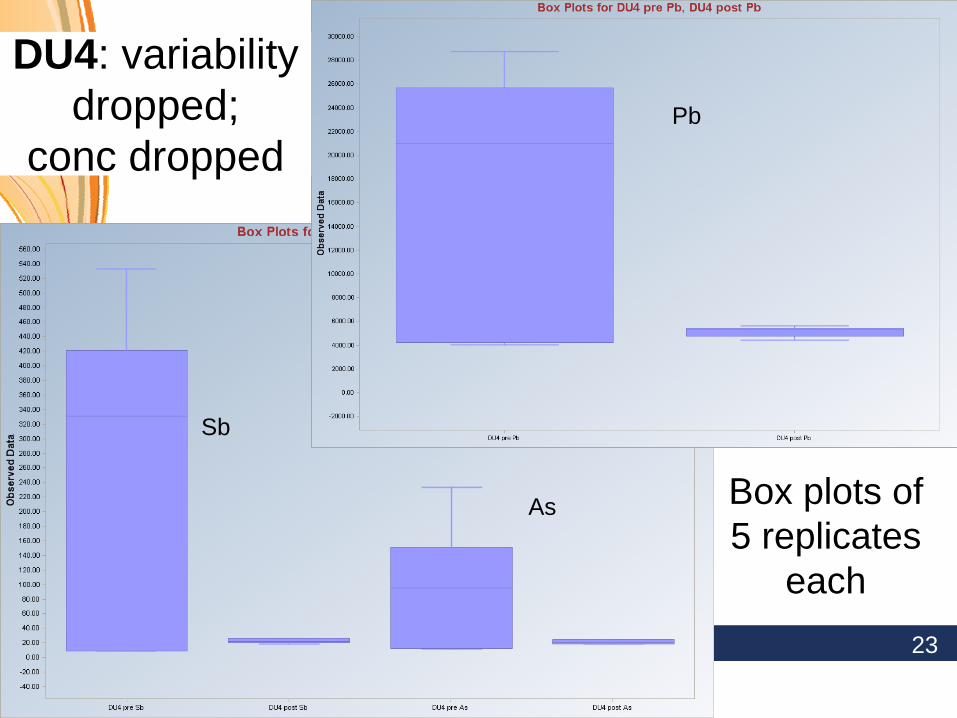
DU4: variability dropped;
conc dropped
Box plots of 5 replicates
each
Sb
As
Pb
2421st Annual NARPM Training ProgramFRTR Meeting, May 5, 2011
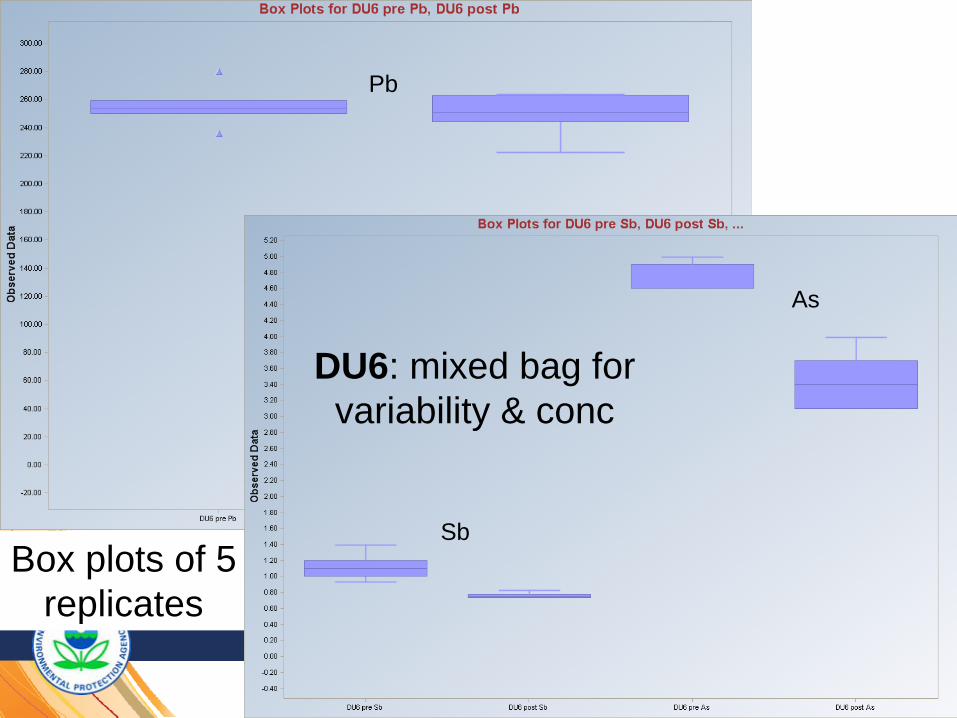
Box plots of 5 replicates
DU6: mixed bag for variability & conc
Pb
As
Sb

25FRTR Meeting, May 5, 2011
Next Question: Are Incremental Sampling Data Comparable to Discrete Data Sets with a High Number of Samples?
2621st Annual NARPM Training ProgramFRTR Meeting, May 5, 2011
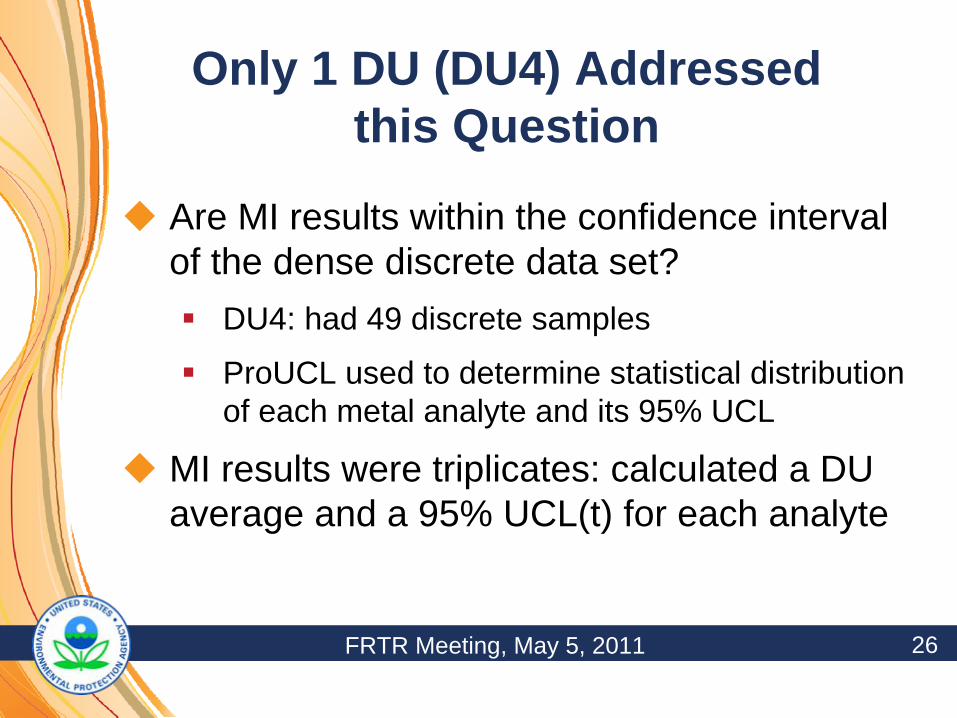
Only 1 DU (DU4) Addressed this Question
Are MI results within the confidence interval of the dense discrete data set?
DU4: had 49 discrete samples
ProUCL used to determine statistical distribution of each metal analyte and its 95% UCL
MI results were triplicates: calculated a DU average and a 95% UCL(t) for each analyte
2721st Annual NARPM Training ProgramFRTR Meeting, May 5, 2011
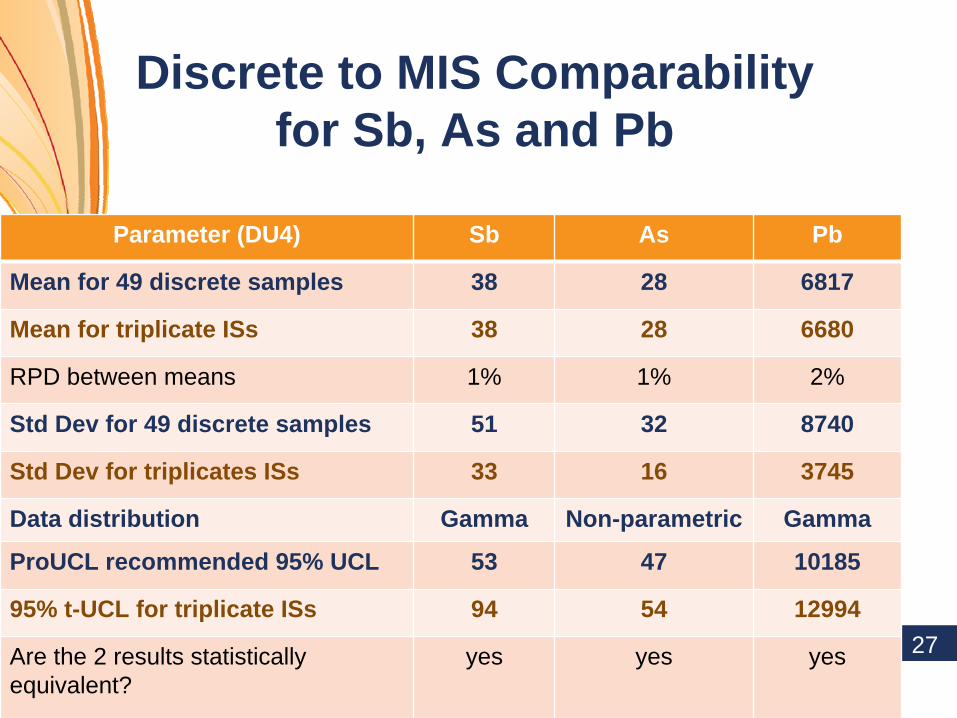
Discrete to MIS Comparability for Sb, As and Pb
Parameter (DU4) Sb As Pb
Mean for 49 discrete samples 38 28 6817
Mean for triplicate ISs 38 28 6680
RPD between means 1% 1% 2%
Std Dev for 49 discrete samples 51 32 8740
Std Dev for triplicates ISs 33 16 3745
Data distribution Gamma Non-parametric Gamma
ProUCL recommended 95% UCL 53 47 10185
95% t-UCL for triplicate ISs 94 54 12994
Are the 2 results statistically equivalent?
yes yes yes
2821st Annual NARPM Training ProgramFRTR Meeting, May 5, 2011
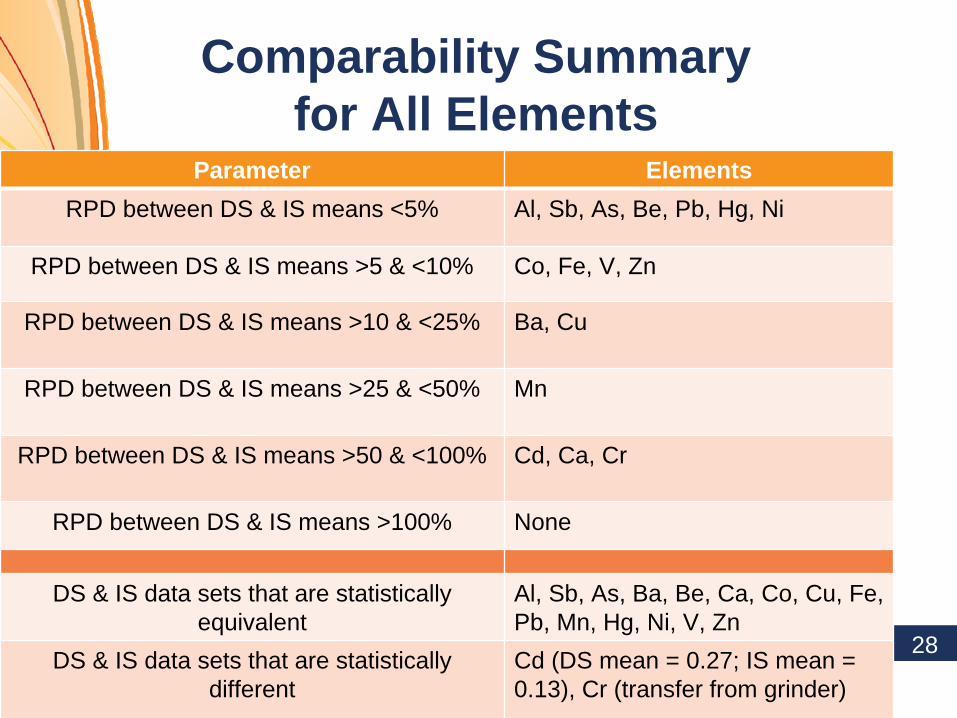
Comparability Summary for All Elements
Parameter ElementsRPD between DS & IS means <5% Al, Sb, As, Be, Pb, Hg, Ni
RPD between DS & IS means >5 & <10% Co, Fe, V, Zn
RPD between DS & IS means >10 & <25% Ba, Cu
RPD between DS & IS means >25 & <50% Mn
RPD between DS & IS means >50 & <100% Cd, Ca, Cr
RPD between DS & IS means >100% None
DS & IS data sets that are statistically equivalent
Al, Sb, As, Ba, Be, Ca, Co, Cu, Fe, Pb, Mn, Hg, Ni, V, Zn
DS & IS data sets that are statistically different
Cd (DS mean = 0.27; IS mean = 0.13), Cr (transfer from grinder)

2921st Annual NARPM Training ProgramFRTR Meeting, May 5, 2011
Summary
The concern that grinding samples would produce non-representative high metals results is partially laid to rest by the project
Until more experience accumulated, should probably check any unusual matrices
Incremental sampling does produce data comparable to a discrete sampling design when there is a high density of discrete samples.