deakin research onlinedro.deakin.edu.au/eserv/du:30019758/mathews-itsyourmovereport5... · philip...
TRANSCRIPT

Deakin Research Online Deakin University’s institutional research repository
DDeakin Research Online Research Online This is the published version (version of record) of: Mathews, L., Simmons, A., Sanigorski, A., Bell, A. C., De Courten, M., Kremer, P., Malakellis, M. and Swinburn, B. 2009, It's your move : implementation report 5 - evaluation Deakin University, Geelong, Vic. Available from Deakin Research Online: http://hdl.handle.net/10536/DRO/DU:30019758 Reproduced with the kind permission of the copyright owner. Copyright : 2009, Deakin University

It’s Your Move!
East Geelong / Bellarine Youth Project
Promoting Healthy Eating and Physical Activity
Implementation Report 5 – Evaluation

IYM Implementation Report 5 Evaluation 2
Copyright protects this publication. This report was produced for the It’s Your Move! Project.
Mathews, L., Simmons, A., Sanigorski, A., Bell, A.C., de Courten, M., Kremer, P., Malakellis, M. and Swinburn, B. (2009) It‟s Your Move! Implementation Report 5 – Evaluation. WHO Collaborating Centre for Obesity Prevention and Related Research and Training, Deakin University, Geelong.

IYM Implementation Report 5 Evaluation 3
Acknowledgments Schools, Principals and School Project Officers Bellarine Secondary College
Colin Sing, Lauren Reading, Sue Blackett Christian College (Bellarine)
Scott Elliss, Kerryn Fearnsides Geelong High School
David Whelan, Christine Green, Kate Meadows, Sonia Kinsey Newcomb Secondary College
Philip Honeywell, Toni Sharkey, Lee Denny, Kirsty Licheni Saint Ignatius College
Michael Exton, Lyndal Taylor Baimbridge SC Bayview SC Casterton SC Monivae SC Mortlake SC Portland SC The Hamilton Alexandria College. Teachers, Staff and Students at each of the schools. The It’s Your Move! Student Ambassadors. Deakin University Support and Evaluation Team WHO Collaborating Centre for Obesity Prevention and Related Research and Training Boyd Swinburn Andrea Sanigorski Peter Kremer Annie Simmons Louise Mathews Mary Malakellis Marita McCabe Rob Carter Mark Lawrence Lina Ricciardelli Helen Mavoa Marj Moodie Catherine Keating Jisheng Cui Caryn Kave Lawrie Meade Lily Meloni Phil Day Narelle Robertson Colin Bell Max de Courten Other researchers and students from the WHO Collaborating Centre for Obesity Prevention and Related Research and Training; and the Public Health Research, Evaluation and Policy Cluster at Deakin University. A special thanks to Narelle Robertson for her writing and editorial contributions.
This project was funded by the Victorian Department of Human Services as part of the Victorian „Go for your life‟ Healthy Eating and Physical Activity initiative, in conjunction with VicHealth and the National Health and Medical Research Council

IYM Implementation Report 5 Evaluation 4

IYM Implementation Report 5 Evaluation 5
Contents
ACKNOWLEDGMENTS ................................................................................................................. 3
INTRODUCTION ......................................................................................................................... 9
OBJECTIVES OF THE EVALUATION .................................................................................................. 9
DESIGN ................................................................................................................................. 10
THE LOGIC MODEL .................................................................................................................. 10
SAMPLE ................................................................................................................................. 11
SAMPLE CHARACTERISTICS ..................................................................................................... 12
COMPONENTS OF THE EVALUATION ............................................................................................. 13
FORMATIVE EVALUATION (PROJECT DESIGN) ............................................................................ 13 PROCESS EVALUATION .......................................................................................................... 13 IMPACT EVALUATION ........................................................................................................... 13 OUTCOME EVALUATION ....................................................................................................... 13 ECONOMIC AND QUALITY OF LIFE EVALUATION ......................................................................... 14
SUMMARY OF EVALUATION ....................................................................................................... 14
THE EVALUATION PLAN ............................................................................................................ 15
ETHICS .................................................................................................................................. 15
PROCEDURES .......................................................................................................................... 15
PROCESS EVALUATION .......................................................................................................... 15 IMPACT AND OUTCOME EVALUATION ...................................................................................... 15 ANTHROPOMETRY ............................................................................................................... 15
PROTOCOLS AND BODY SIZE CALCULATIONS........................................................................... 15 BEHAVIOURS USING THE ADOLESCENT BEHAVIOUR, ATTITUDES AND KNOWLEDGE QUESTIONNAIRE .... 16 SCHOOL ENVIRONMENTAL AUDIT ........................................................................................... 18 CAPACITY BUILDING USING COMMUNITY READINESS TO CHANGE ................................................. 20 CAPACITY BUILDING USING THE COMMUNITY CAPACITY INDEX ..................................................... 21 CAPACITY BUILDING USING GROUP INTERVIEWS WITH AMBASSADORS ........................................... 24 QUALITY OF LIFE (AQOL-2 AND PEDSQL) ............................................................................... 26
DISSEMINATION ...................................................................................................................... 28
KEY LEARNINGS AND RECOMMENDATIONS ................................................................................... 28
CONCLUSION .......................................................................................................................... 29
REFERENCES ........................................................................................................................... 30

IYM Implementation Report 5 Evaluation 6
List of Figures FIGURE 1: THE LOGIC MODEL FOR IT’S YOUR MOVE! ..................................................................... 11

IYM Implementation Report 5 Evaluation 7
List of Tables TABLE 1: CHARACTERISTICS OF THE IT’S YOUR MOVE! SAMPLE ........................................................ 12 TABLE 2: SUMMARY OF EVALUATION TOOLS USED FOR IT’S YOUR MOVE! .......................................... 14

IYM Implementation Report 5 Evaluation 8
List of Appendices
APPENDIX A: PROCESS EVALUATION TEMPLATE ............................................................................ 33 APPENDIX B: EVALUATION PLAN ............................................................................................... 35 APPENDIX C: PROTOCOLS FOR TAKING ANTHROPOMETRIC MEASUREMENTS ....................................... 47 APPENDIX D: ADOLESCENT BEHAVIOUR, ATTITUDES AND KNOWLEDGE QUESTIONNAIRE ...................... 51 APPENDIX E: SCHOOL ENVIRONMENTAL AUDIT ............................................................................ 61 APPENDIX F: COMMUNITY READINESS TO CHANGE ....................................................................... 81 APPENDIX G: COMMUNITY CAPACITY WORKBOOK (FACILITATOR) ................................................... 87 APPENDIX H: CAPACITY BUILDING INDEX MICROSOFT POWER POINT PRESENTATION ........................ 113 APPENDIX I: STUDENT AMBASSADOR GROUP INTERVIEW QUESTIONS .............................................. 115

IYM Implementation Report 5 Evaluation 9
Introduction
It’s your Move! was a 3-year community-based obesity prevention project conducted across the Barwon-South Western region of Victoria during 2002-2008. The background to the project is outlined in Implementation Report 1 – Project Design. It’s Your Move! involved several components;
develop and implement the It’s Your Move! intervention activities to promote healthy eating, physical activity and a healthy body shape and size among youth;
evaluate It’s Your Move! (process, costs, impacts, and outcomes);
support economic, socio-cultural and policy sub-studies (as part of the Obesity Prevention in Communities (OPIC) project); and,
build the community capacity to promote healthy eating and physical activity and build research and evaluation capacity in Australia.
The Sentinel Site for Obesity Prevention at Deakin University was responsible for the evaluation of the project. As a demonstration project, It’s Your Move! had a strong evaluation component. It contributed to the body of evidence around which programs and interventions would be successful in combating obesity, that is, what is best practice?
Objectives of the evaluation
The primary objectives of the evaluation component were as follows: 1. to determine the effectiveness and cost-effectiveness of a multi-setting, multi-
strategy program of interventions aimed at improving the healthy eating and physical activity patterns of youth on changes in body mass index z-score over 3 years; and
2. to determine the feasibility and impacts of each of the key components of the
intervention program.
The secondary objectives were:
1. to identify key obesogenic socio-cultural factors (attitudes, beliefs, perceptions and values) in relation to food and eating, physical activity and inactivity, and body size;
2. to identify key policies that influence eating patterns and physical activity and
how they might be changed; and 3. to assess quality of life in relation to overweight and obesity in adolescents.

IYM Implementation Report 5 Evaluation 10
The purpose of this report is to outline the comprehensive evaluation framework for It’s Your Move! This report does not include evaluation results but rather describes the design of the evaluation, the characteristics of the target population and its setting, the methodology and the tools used to undertake the evaluation of It’s Your Move! A separate results report containing the results for It’s Your Move! will be produced in due course, following these implementation reports.
Design
The design of the evaluation component for It’s Your Move! was quasi-experimental using a longitudinal cohort follow up, rather than serial cross-sectional design so as to increase study power. The Project had measurements in intervention and comparison (control) populations at baseline, in 2005 and after three years of intervention, in 2008.
The Logic Model The general logic model for It’s Your Move! is shown in Figure 1. The input can be assessed as 0 (no intervention) or 1 (intervention) and as a graded input through the economic evaluation (i.e. amount of resource use including paid and volunteer time). The mediators of behavioural change at a population level are policy and environmental change and at the individual level are changes in attitudes, knowledge, beliefs, etc. The changes in behaviour then influence body size, quality of life and eventually disability-adjusted life years gained. The influences moderating these proposed direct links include age, gender, ethnicity and socio-economic factors.

IYM Implementation Report 5 Evaluation 11
Logic model for interventions
1 Intervention dose is either 1 or 0 (intervention, control) or $$ (economic input – all schools)2 Capacity is leadership, skills/knowledge, structures, resources3 Relevant environments are schools, homes, neighbourhoods, churches4 Weight, BMI, BMI-z, waist, waist:height, %fat, prevalence of o/w+obesity
Intervention
Dose1
Δ Community
capacity2
Δ Environments3
Δ Knowledge,
attitudes, beliefs,
perceptions etc
Δ Behaviours Δ Anthropometry4
INPUTS
POPULATION
MEDIATORS
INDIVIDUAL
MEDIATORSOUTCOMES
MODERATORS
Ethnicity, socio-cultural
factors, gender, age, SES
Δ QoL
Δ QALYs gained
Δ Policy
= Measured = Modelled
Figure 1: The logic model for It’s Your Move!
Sample The intervention site for It’s Your Move! was East Geelong/Bellarine and the comparison population was the rest of the Barwon-South Western region. All the intervention secondary schools were selected from the East Geelong and Bellarine Peninsula regions of Geelong. The five schools in the selected area (Newcomb Secondary College, Bellarine Secondary College, Geelong High School, St Ignatius College and Christian College [years 7-9 only]) had a total available enrolment of 3,075. The comparison sample was a stratified random sample of schools (n=8) from the Barwon-South Western Region. The selection of the intervention community was based on a number of criteria. The community had to have sufficient numbers of youth to reach the sample sizes; sufficient numbers of settings (mainly schools, community organisations) to provide the structures for interventions; a degree of geographical cohesiveness to be able to define the sampling frame; and reasonable proximity to the intervention and evaluation teams.

IYM Implementation Report 5 Evaluation 12
Sample size estimates were determined for the principal quantitative outcome variable for the intervention and control cohorts; being change in BMI (which is closely related to changes in weight, BMI Z-score and prevalence of overweight/obesity). Weight (SD=16.8 kg) and BMI (SD=5.22kg/m2) from one of the OPIC intervention schools in New Zealand. A survey was used for sample size calculations. For a within-person correlation of 0.8, a sample of about 1000 in each arm of the study would detect a difference in weight of 1.3 kg and BMI of 0.41 kg/m2 (equivalent to about 4 percentage points difference in overweigh/obesity prevalence) with 80% power and alpha=0.05. The Auckland High School Survey showed no design effect associated with the clustered sampling for analyses restricted to a subset of Pacific Island students once other variables were accounted for. A target initial sample size of ~1500 in each arm was used to allow for drop-outs and loss to follow up. The baseline sample of 3075 out of a potential 6327 participants represented a response rate of 48.6%. There was a 60% response rate for the school environmental audits.
Sample characteristics
Details of the baseline sample for It’s Your Move! are summarised in Table 1. Table 1: Characteristics of the It’s Your Move! sample It’s your Move!
n Mean (years)
SD (years)
Range (years)
Female (%)
Lower SES (%)
Upper SES (%)
Year 7-8 1475 13.5 0.7 11.4-15.4 43.0 39.3 60.7
Year 9-11 1551 15.7 0.8 12.6-18.3 44.9 41.9 58.1
ALL 3026 14.6 0.8 11.4-18.3 44.0 40.6 59.4

IYM Implementation Report 5 Evaluation 13
Components of the evaluation
Formative Evaluation (Project Design)
This aspect of the evaluation involved monitoring the establishment of the project, engagement of key stakeholders and formation of a steering committee. This has been written up as a separate report (Implementation Report 1 - Project Design)
Process Evaluation
The processes and their outcomes were recorded by Project Staff using a standard template (Appendix A) which was also used to capture costs. It recorded the amount of time and costs associated with an objective, type of actions required to implement a strategy and it also recorded some of the lessons gained along the way.
Impact Evaluation
The main sets of measurements were behaviours, attitudes and knowledge questionnaires, and settings environmental audits (impact variables).
The primary impact measures were;
behaviour change;
improvements in school setting; and,
increase in capacity to promote physical activity and healthy eating. The tools used were a Behaviours, Attitudes and Knowledge Questionnaire, which included an 84 question survey self-administered using Personal Digital Assistants (PDAs); School Environmental Audits which entailed a 3 part survey, completed within schools by the Principal, Canteen Manager and three teachers. Capacity was assessed using Community Readiness to Change interviews, the Community Capacity Index and group interviews with the Ambassadors.
Outcome Evaluation
The outcome measures included change in Body Mass Index (BMI), change in BMI Z-score (BMI score which is standardised by age and sex) and change in percentage body fat. Overall, the outcome of the project will be determined by two main factors: the degree to which the intervention objectives have been achieved, including increasing the community‟s capacity to promote the healthy eating and physical activity; and the changes in BMI z-scores.

IYM Implementation Report 5 Evaluation 14
The primary outcome measures (variables) were;
% body fat;
weight;
BMI;
z-BMI scores; and
change in community capacity
The secondary outcome measure was the relative decrease in the prevalence of overweight/obesity in the intervention group compared to the comparison group.
Economic and Quality of Life Evaluation
The economics component was administered to ascertain outcomes of cost-effectiveness, quality of life and modelled disability-adjusted life years (DALYs) saved.
Two quality of life instruments were used for It’s Your Move! First the AQoL (The Assessment of Quality of Life (AQoL2) Instrument, modified for use with adolescents, and second, the Paediatric Quality of Life Inventory (PedsQL), generic module for 13-18 year olds.
Summary of evaluation Table 2 summarises the tools used for each area of evaluation. Table 2: Summary of evaluation tools used for It’s Your Move!
Type of Evaluation Tools
Anthropometry Height and Weight to calculate BMI Waist circumference Body composition (% body fat)
Behaviours Adolescent Behaviours, Attitudes and Knowledge Questionnaire (ABAKQ)
Environments School Environmental Audit
Community Capacity
Community Readiness to Change Community Capacity Index Ambassador Group Interviews
Quality of Life PedsQoL AQoL

IYM Implementation Report 5 Evaluation 15
The Evaluation Plan The evaluation plan for It’s Your Move! is presented in Appendix B.
Ethics Deakin University Human Research Committee approved the ethical aspects of the evaluation (Reference # EC 22-200) The ethics process entailed the development of Plain Language Statements outlining the nature of the project and its research basis, and Consent Forms for Organisations signed by the Principals of the five intervention schools and the seven control schools. For the intervention schools, consent was also obtained from parents on behalf of students that opted to participate in the evaluation component of the project. The Consent Form covered baseline evaluation measures in 2005 and follow up in 2008. Plain Language Statements and Consent Forms were distributed to students in the schools by project staff, collected by teachers, and returned to project staff in preparation for baseline data collection.
Procedures
Process Evaluation
Process evaluation information was collected throughout the project from the Project Coordinator and School Project Officers via a paper based or electronic template (Appendix A). Information was collected about various processes undertaken during the project for the uptake and penetration of program components into the schools. Process data was entered into Microsoft Access for further analysis.
Impact and Outcome Evaluation
Anthropometry
Protocols and body size calculations
An explanation of the protocols for measuring height, waist circumference and obtaining body composition data and the body size calculations are in Appendix C.

IYM Implementation Report 5 Evaluation 16
Height Height was measured using a portable stadiometer. Waist circumference A standard tape measure was used to measure waist circumference. Weight and Body Composition (%fat) A TANITA Body Composition Analyser (Model BC 418) was used to collect weight and bio-electrical impedance data, used to assess body composition. Individual data was exported directly to a prepared Microsoft Excel spreadsheet file via connection interface between the TANITA device and a laptop PC. A customised program (provided by Wedderburn Australia) was used to derive the values and to facilitate data transfer between the TANITA and the PC. Specific equations to estimate lean mass and fat mass from the impedance data were developed for the project in a separate study based in Auckland. These have not been included in this report.
Behaviours using the Adolescent Behaviour, Attitudes and Knowledge Questionnaire
Purpose The Adolescent Behaviour, Attitudes and Knowledge Questionnaire (ABAKQ) consisted of four sections; 1. Demographics survey; 2. Behaviours, attitudes and knowledge survey; 3. A quality of life scale (AQoL); and 4. A child quality of life measure (PedsQoL) The ABAKQ is shown in Appendix D. The QoL instruments are described in detail below. The final survey instrument was set-up using the e-STEPS Questionnaire Designer program1 . The constructed questionnaire was then copied across to sixty Personal Digital Assistants (PDAs) for administration. Content The first section of the ABAKQ incorporated a short demographic survey that included questions about the adolescent‟s date of birth, gender, school, year level, and adults in the household. This was supplemented by a paper demographics survey which had more personal identifying data on it: ID number, date of birth, date of testing (all used to cross check with the data on the PDA and other data), student‟s full name, home address, including house number, street name, suburb and postcode (the latter collected for the purposes of area-level SES).

IYM Implementation Report 5 Evaluation 17
The behaviour, attitudes and knowledge questions were developed and used across the four sites of the Obesity Prevention in Communities (OPIC) Projects. The survey comprised of 87 questions which took approximately 15-20 minutes to complete and focused on key behaviours such as nutrition/dietary practices, amount of physical activity, the school environment (teachers, canteens, participation in sport), home (the role of parents/siblings), the neighbourhood, and perception and attitudinal questions. Some of the questions were country/community specific such as the role of the church, various food practices, perceived food and physical activity practices within their culture. Source and validation The ABAKQ included several questions from the 1995 Australian National Nutrition Survey2 , New Zealand 2002 National Children‟s Survey3 and National Health and Medical Research Council (NHMRC) Dietary Key Indicators Study4. Of these studies, some questions had good reliability data, some were from standard questionnaires and provided scope to develop questions to specifically measure the objectives of the It’s Your Move! action plan. The survey was initially piloted with 95 students in Australia. The feedback from the students about the wording and comprehensibility of the questions plus the range of responses were used to further modify the questionnaire. Upon using the survey for the baseline measures, students felt that the survey was easily understood, comprehensible, relevant and produced a reasonable spread of answers and was both age and ethnically appropriate. The first section of the survey spanning questions 1-4 and questions 6-12 were standard demographic questions. Due to their widespread and common use, they didn‟t require validity or reliability testing. Question 5, which addresses the adolescent‟s ethnicity, was taken from the Australian Census data. The majority of the questions in the questionnaire have either been taken directly from or been adapted from existing larger surveys. Questions 15, 17 and 19 were taken from the 1995 National Nutrition Survey (NNS)2. The basis for these questions was related to how many days a week a certain food was eaten for breakfast. It was adapted to ask about the last 5 school days instead of in the last week and applied it to morning tea and lunch also. In the NNS, all respondents provided a useable answer with only <0.5% unable to recall their frequency of breakfast intake. Questions 20 and 21 were directly from the NNS2. Of the sample, 99% provided useable answers for both questions. The results of these questions suggest that it is possible to derive a quantitative estimate of overall consumption based on a question that asks about consumption on a usual day. Question numbers 27, 33, 35, 36, 37, 38, 39, 40, 41, 46, 47, 48, 49 were either used directly or adapted slightly from the National Children‟s Nutrition Survey which was used in New Zealand in 20023. Most of the adaptations revolved around giving specific time periods. Therefore, instead of saying „on how many school days‟ it was modified to ask „in the last 5 school days‟. Instead of asking how much time do you

IYM Implementation Report 5 Evaluation 18
normally spend…?‟ it was modified to ask, „on the last school day…‟ The basis of the questions are identical, and if anything, the modified way of asking allows for a more specific response and ensures a more user friendly way of recalling information. Questions 28 – 32 were adapted from the 1996 NHMRC Dietary Key Indicators Study4. These used the same base questions used in the large survey but were changed to ask about „after school‟ and different foods types were added to elicit improved qualitative information. The basic questions from the Dietary Key Indicators Study revealed a good spread of responses across the board. The remainder of the questions developed for use in this survey were specifically designed for this project and were piloted amongst adolescents in the existing sample. Overall, very few of the questions were amenable to true validity testing but comprehensibility and repeatability were important and testable. Administration The baseline questionnaire was administered to each student using a Personal Digital Assistant (PDA). This occurred from July to November 2005 with students in year 7-12 in the participating schools across the Barwon-South Western region. Students were given a class period (55 minutes) at school to complete the survey and anthropometry measures. The familiarisation process with the PDA was very rapid. As students completed the questionnaire on the PDA, research assistants would call up students individually to complete the anthropometry measures in a discrete/private area. Notes The use of the PDA made filling out of the questionnaire rather novel for students and it kept up their concentration levels. Some of the adolescents in similar projects in Fiji and Tonga had never seen such an instrument but they very quickly understood how to use the PDA. It would have been a long and tedious paper questionnaire, and the PDA allowed a more complex questionnaire to be developed with multiple skips over „not applicable‟ questions. However, there were some technical issues with using the PDA. Within the earlier programs, the skips sometimes were not activated, generation of new ID codes did not always occur and the stability of the PDA (hardware, software and battery life) also caused problems over the three years.
School Environmental Audit
Purpose The aim of the School Environmental Audit (Appendix E) was to assess the schools as settings for promoting healthy eating and physical activity. Content There were three parts to the Audit. Part 1 was filled out by the Principal or a senior administrator and focused on elements of policy, food service, physical

IYM Implementation Report 5 Evaluation 19
education / physical activity, facilities and staff professional development. Part 2 was filled out by the Canteen Manager and centred on the food service operation, food preparation, pricing and promotion and external facilities such as vending machines and water fountains. Part 3 comprised of 24 questions and was completed by 3 teachers at the school. The questions examined food, nutrition, physical education/activity practices in the curriculum. It also assessed the awareness of policies within the school to support healthy eating and physical activity and whether teachers complied/ supported the policy. Questions were also asked about parental support, adequacy of indoor/outdoor space (including bicycle storage) and the strength of community links. Source and validation Questions for the Secondary School Environmental Audit primarily came from the Primary School Audit tool (used in the Be Active Eat Well Project). Here the audit tool was adapted from a similar tool developed by Carter and Swinburn5 from a series of semi structured interviews with 11 primary and secondary Health and Physical Education teachers within the Auckland region. The questions were designed around the key elements of the physical, economic, policy and socio-cultural environments in schools for nutrition and physical activity. Food sold at the canteen/ food service was also included as an index of foods eaten. Academic staff of the University of Auckland reviewed the questionnaire to ensure that the questions were free from bias and easily understood. The questionnaire was then pre-tested in three primary and three secondary schools with Health and Physical Education teachers to ensure that the questions were interpreted and answered by respondents as the researcher had intended. For It’s Your Move! additional questions were included from a Queensland audit tool titled Assessing your school the Active-Ate Way: a nutrition and physical activity needs assessment and planning guide6 and the Centre for Disease Control‟s (CDC) School Health Index which is a school self-assessment and planning guide7 developed by the CDC in partnership with school administrators and staff, school health experts, parents, and national non-governmental health and education agencies. Administration The audit tool is divided into the three parts which can be sent to the key people in the school for self-administration or be administered. Each survey took approximately 10 minutes to fill out each part. All parts of the audit were self-administered. Notes There is potential for this survey to be further developed so that it could be administered in a web based version. This would allow surveys to be sent to key informants within each school, monitored and collated electronically. This could allow a greater representation of the school population and less labour intensive way of administering the survey.

IYM Implementation Report 5 Evaluation 20
Capacity Building using Community Readiness to Change
Purpose The aim of implementing the Community Readiness to Change assessment (Appendix F) was to score the community involved in It’s Your Move! on six dimensions using Community Readiness Stages (how well equipped is the community to undertake the promotion of healthy eating and physical activity environments and behaviours?). Content The six dimensions are community knowledge about the issue, existing community efforts, community knowledge of the efforts, leadership (includes appointed leaders & influential community members), community attitudes, and resources related to the issue (people, money, time, space, etc). In theory, the Community Readiness assessment potentially offers an accurate way to measure readiness before, during and after interventions. The assessment also provides essential qualitative data to help guide the community and / or program toward development of effective prevention strategies. Based on information from the baseline Community Readiness assessment, interventions that are appropriate to the community‟s level of readiness can be implemented with a higher potential of success and in a more cost effective manner. The „readiness score‟ of the community served as a means for diagnosing the community‟s needs. It formed the basis of understanding the community‟s overall level of readiness to act. The Community Readiness assessment can give insight into key factors explaining success or failure of community based activities, for example, shifts in community norms and support of local leadership. This can be especially useful because evaluation of obesity prevention interventions representing a multi-component, community-wide effort can be challenging and certain aspects of change might not be captured by the baseline and follow-up evaluation. The lessons learned from the baseline Community Readiness assessment should contribute to program development for the interventions. Together with the findings from the follow-up assessment the learnings can directly contribute to recommendations for ensuring sustainability of the obesity prevention efforts beyond the life-span of the projects. The results allowed the community to determine which dimension(s) they should address as priorities and begin the development of appropriate strategies appropriate for moving them to the next level of readiness. At the completion of the projects, the Community Readiness assessment assisted in explaining changes in the outcome variables of the projects and contributed to recommendations for ensuring sustainability.

IYM Implementation Report 5 Evaluation 21
Source and validation The Community Readiness Model and methodology for applying it were developed at the Tri-Ethnic Centre for Prevention Research at Colorado State University, USA8. The Model was adapted with permission from the authors and changes in the accompanying handbook were made by the WHO Collaborating Centre staff. The Handbook provides an overview on the key concepts of the Community Readiness Model and shows the practical, step-by-step application to a specific issue/setting. Administration The Community Readiness Model was administered at baseline and follow up for It’s Your Move!. Key project personnel and stakeholders were identified to participate in a one-on-one interview taking between 45-60 minutes. Each interview was audio-taped and transcribed. The scoring process is outlined in detail in the CRC Handbook, but was modified to allow the scores to be determined from a written script rather than listening to a tape. Five interviews, with the Principal, two teachers, a parent, and a student, were completed at each of the intervention and control schools involved in It’s Your Move!. Notes In practice the Community Readiness to change instrument was time consuming to implement. The number of questions (n=39) meant that interviews took between 45 and 75 minutes. Some key stakeholders, Principals and teachers contributed well, taking up to 75 minutes to complete. Students and parents who were interviewed felt more intimidated by the process and hence the interviews were shorter in duration. Care needs to be taken not to over-burden respondents with evaluation tools. The prescribed analysis process, where two people independently score and meet to determine a consensus score was difficult to administer when working with a small evaluation team. A more efficient method was to have the interview tapes transcribed and to score from the written transcripts which made the process more manageable. The prolonged scoring process meant that results were not available in time for the communities to be of any significant value to inform the development of the action plans.
Capacity Building using the Community Capacity Index
Purpose The Community Capacity Index was developed to assist communities or networks identify the extent of existing capacity available within a network of organisations and groups working together at a local level9. Its purpose was to gather evidence about the capacity of the network and to map that evidence against a set of indicators within four domains; network partnerships, knowledge transfer, problem solving and infrastructure.
IYM Implementation Report 5 Evaluation 22
Content Within the Community Capacity Index (CCI), community capacity is defined as „a collection of characteristics and resources which, when combined, improve the ability of a community to recognise, evaluate and address key problems‟. The CCI examines capacity within four domains; Network Partnerships
- the relationships between groups and organisations within a community or network.
Knowledge Transfer
- the development, exchange and use of information within and between the groups and organisations within a network or community
Problem Solving
- the ability to use well-recognised methods to identify and solve problems arising in the development and implementation of an activity or program
Infrastructure - the level of investment in a network by the groups and organisations that
make up the network. Infrastructure includes investment in the development of policy, social capital, human capital and financial capital.
For each of the first three domains, three levels of capacity are identified, with each level measured by a set of indicators. The fourth domain, infrastructure, is not constructed of three levels but rather four sub-domains and their indicators. The indicators within the CCI represent the abilities, behaviours or characteristics of the network. For each level of each domain, a brief overview of supporting evidence from each respondent accompanies the capacity assessment. Upon completion of all of the indicators within the CCI, each member is required to summarise current capacity of the network to achieve its objectives and identify further plans to build capacity to achieve program objectives. Source and validation The CCI9 was developed by Robert Bush, Jo Dower and Allyson Mutch from the University of Queensland and the CCI Manual10 outlines its development and validation process. It was not possible to pilot the CCI with key stakeholders due to the small finite sample. Learnings from implementation with another project (Be Active Eat Well) informed the implementation process for It’s Your Move! The implementation method employed for It’s Your Move! allowed for any difficulties to be addressed. Administration Initially the CCI was not intended for administration with the It’s Your Move! Project because a decision was made to utilise another tool, the Community Readiness to Change (CRTC) questionnaire (see above).

IYM Implementation Report 5 Evaluation 23
The prolonged scoring process meant that results were not available in time for the communities to be of any significant value to inform the development of the action plans. An outcome measure of built capacity was deemed to be useful and was required for other work (Doctorate in Health Science, Annie Simmons) therefore the CCI was administered at the end of the implementation phase of the It’s Your Move! Project. To utilise this tool, the judgments to obtain a score of capacity at baseline were then made retrospectively. In obtaining this data, discussion were held with the Project Coordinator for It’s Your Move! in May 2008 about the unexpected requirement to administer the CCI and potential scenarios for administering the CCI. Based on anecdotal feedback from a few key stakeholders after the administration of the CCI for the Be Active Eat Well Project, which were comments about the degree of difficulty in completing the Index, it was proposed that the key stakeholders complete the CCI while at their Project Management Meeting, so more support could be provided. Recent meetings had been one hour in duration. It was recognised that the administration of the Index (workshop plus completing the Index) would require more than one hour. Instead of asking the key stakeholders to spend additional time at the meeting, when at previous meetings various members have other commitments to get to after the meeting; it was proposed that the administration of the Index should be conducted over two consecutive meetings. Approval was obtained from the Project Coordinator to itemise the CCI on the agenda for discussion at the next Project Management Meeting in May 2008. The aim was to seek agreement among the key stakeholders to participate in completing the CCI over the following two consecutive meetings. During the regular Project Management Meeting in May 2008, all key stakeholders agreed to participate to complete the CCI. Consensus was also reached that the CCI could be administered over the next two consecutive Project Management Meetings. The next regular meeting, scheduled in two weeks time in May 2008 was dedicated to the CCI and the following in June 2008 at the same time. Similar to Be Active Eat Well, a workshop approach was taken by the same facilitator (Annie Simmons) at the first meeting. Again, the purpose of the workshop was to introduce the CCI as a tool to measure capacity, introduce and discuss the key concepts to capacity building (including a definition) and to discuss the domains of capacity used within the CCI within the context of the It’s Your Move! Project. This was to ensure each key stakeholder understood the terminology of each domain and its dimension, and its application to the project. A facilitator‟s manual and workbook (Appendix G) were developed to aid in the delivery of the workshop and to allow the participants to complete the CCI. The facilitator‟s manual was a detailed version of the workbook. Both contain the CCI. These were modified from the Be Active Eat Well Project documents.

IYM Implementation Report 5 Evaluation 24
Only minor changes were required, i.e. reference to the project‟s name and use of different examples when referencing key settings and other key stakeholders. The workbook containing the CCI tool was handed out at the commencement of the workshop. In addition, a Microsoft PowerPoint presentation was made to assist in guiding the workshop (Appendix H). The facilitator felt this may assist the key stakeholders focus on the process since the majority of key stakeholders join the meeting after a day‟s teaching at school. Also the use of a PowerPoint presentation contributed to one of three common delivery methods used in adult learning11, namely visual, discussion and the use of the workbook. The whole meeting was then dedicated to the administration of the CCI (the workshop component and commencing the completion of the Index). At the end of the meeting the workbooks were collected and stored by the facilitator until the next scheduled meeting, in two weeks time, at which the Index was completed. Notes The CCI can be administered in a variety of ways. Users of the Index can: 1) individually interview key informants, 2) conduct a focus group with members within a network, 3) conduct a network meeting or workshop with members, or 4) conduct the Index as a self-reflective tool based on experiences within a network. It was anticipated that the Index might produce some concerns so it was decided to opt for a workshop type approach. However respondents noted when completing the Index with this format, they still found it a difficult tool to use. In terms of analysis, the Index is quick and easy to collate and analyse providing both quantitative and qualitative measures. The qualitative items however lacked depth and those completing the CCI found it difficult to think of examples to qualify the corresponding level of capacity that was scored.
Capacity Building using Group Interviews with Ambassadors
Purpose Group interviews were conducted with each set of Ambassadors in each school as they exited their role. The interview utilised an interview guide which included a series of open-ended standardised questions. The purpose of the interview was to obtain experiential feedback from each set about their role as Ambassadors to ascertain a sense of usefulness of the Student Ambassador Model and to assess what domains of capacity were built during the implementation of this model. Content The interview guide allowed for a general introduction followed by eight open-ended standardised questions (Appendix I).

IYM Implementation Report 5 Evaluation 25
Source and Validation The questions were developed specifically for the purpose of the group interview. The first draft was shown to the Project Coordinator for feedback and approval, with minor adjustments made. The second draft was taken to a Project Management Meeting for scrutiny and approval by the five School Project Officers. Since all Ambassadors were required for interview, the questions were not pilot tested with them, instead the School Project Officers were the final source of validation. This was considered appropriate since the School Project Officers are teachers within the school hence it was accepted that they would be able to comment that level of comprehension or interpretation be appropriate for the Student Ambassadors.
The School Project Officers were employed by the project and hence had an intimate knowledge and having been briefed on the purpose of the group interview, it was considered that they would be able to make an informed judgement on the level and type of questioning posed. No issues were found with the format of the interviews or the type of questions.
Administration Five group interviews were conducted, one at each school, at two time points, i) when the first set of Ambassadors (n=25) departed their role at the end of 2006 which marked the half way point of the project (Group 1, G1) and ii) when the second set (n= 40) departed and the end of the implementation phase of the project in June 2008 (Group 2, G2). The interview process involved an interview guide utilising a series of eight open-ended standardised questions. The questions were developed specifically for the purpose of the group interview. The first draft was shown to Project Coordinator for feedback and approval, with minor adjustments made. The second draft was taken to a Project Management Meeting for scrutiny and approval by the five SPOs. Since all Ambassadors were required for interview, the questions were not piloted with them. Instead the SPOs were the final source of validation. This was deemed appropriate since they were 1) employed by the project and had an intimate knowledge of the project; 2) briefed on the purpose of the group interview and 3) as teachers, it was considered they would be able to make an informed judgement on the level and type of questioning posed be appropriate for the Ambassadors.
The interviews were arranged by the SPOs (previously briefed) who informed their Ambassadors of the purpose of the interview and encouraged them to attend. The interviews were held during the lunch break at each school at a convenient date to the group. Lunch was provided as a reward i.e. as one way to formally thank them for their contribution to the It’s Your Move! project. The size of each group varied from four to eight with the SPO present in each group. The Ambassadors were made aware of the interview format (questions provided) and encouraged to offer their opinions in response to the questions. Assent was sought to audio-tape the interview. Participants were assured transcriptions would

IYM Implementation Report 5 Evaluation 26
remain anonymous and responses collated across schools. The main intentions of the results were disclosed. At the conclusion of the interview, the Student Ambassadors were thanked for their participation and the process of handling the data was reiterated i.e. anonymous transcription, analysis, feedback and use of the data. Immediately following the interview, at a prioritised convenient time, the audio tape was checked and notes made about the context of the interview and any outstanding observations. The tape was played in its entirety as soon as possible and any additional thoughts/comments were added to the notes. Notes The Ambassadors responded well to the interviews. Most were keen to tell of their experiences and spoke with enthusiasm. No one objected to having the interview taped. Providing lunch was valued and the Ambassadors appreciated the recognition of their role. Having the School Project Officers present allowed the Ambassadors to feel supported and the School Project Officers could also prompt the Ambassadors for detail.
Quality of Life (AQoL-2 and PedsQL)
It is best practice to combine a utility-based instrument (i.e. one that can be used for economic analyses using quality-adjusted life-years [QALYs] or disability-adjusted life-years [DALYs]) with a condition-specific instrument. In the It’s Your Move! study, it was decided to utilise the Australian Quality of Life instrument Mark-2 (AQoL-2, a utility-based instrument designed for Australian adults) coupled with the Pediatric Quality of Life Inventory (PedsQL), a paediatric general health profile instrument. The latter was chosen given the absence of readily available condition-specific instrument suitable for adolescents. Content The AQoL2, is a multi-attribute utility instrument developed in Australia by a team led by Professor Jeff Richardson, Monash University10,11. The AQoL2 comprises 20 health state questions across six dimensions, namely physical ability, social and family relationships, mental health, coping, pain, sensory. With respect to the sensitivity of the AQoL-2, the developers of the instrument are firmly of the opinion that there is no other utility-based instrument available, suitable for economic evaluation, which will provide greater sensitivity. The PedsQL is a paediatric general health profile instrument, specifically designed for use with adolescents and children. The generic module was used for 13-18 year olds. The PedsQL has been adapted for specific conditions (e.g. cancer, asthma, and diabetes), but not as yet for obesity. The questions, however, fitted neatly with obesity, and, in this study, were employed as a proxy condition specific instrument. The PedsQL is a brief (one page) instrument, comprising 23 questions. It covers four dimensions of physical functioning, emotional functioning, social and school functioning.
IYM Implementation Report 5 Evaluation 27
Source and validation The AQoL, a utility-based instrument suitable for economic evaluation, was originally developed for Australian adults using „state of the art‟ psychometric procedures12,13,14. It was recalibrated for use with adolescents. It is acknowledged, however, that population-based interventions such as It’s Your Move! may not produce a detectable effect on AQoL2 at a population level. The instrument is rated highly in terms of validity and reliability with internal consistency of alpha = 0.81. As the AQoL2 was developed for Australian adults, its use in It’s Your Move! (and the wider OPIC study) required its adaptation for use with adolescents, and for use in cultural settings other than Australia. The questions were originally tested for cultural and language appropriateness in two focus groups of adolescents (in each of the countries). In order to preserve the psychometric qualities of the AQoL, adaptation meant that changes were kept to a minimum and preserved the original intent of the question. Given that the utility values reflected the preferences of Australian adults, the values were recalibrated to reflect those of Australian adolescents. This was done using the „time-trade-off‟ method, the same method as employed in the original development of the instrument. Sixty-eight students participated in this exercise in a classroom setting, each completing a set of ten scenarios. The recalibration of the AQoL2 for Australian adolescents, means that there is now a utility-based quality of life instrument (AdQoL2) available suitable for use in other studies involving Australian adolescents. The PedsQL is a paediatric general health profile instrument specifically designed for use with adolescents and children15, and which is shown to have high validity and reliability16,17. Whilst the PedsQL is not a preference based instrument, it still provides an index score which is obtained through simple arithmetic addition with all dimensions weighted equally (i.e. no utility trade-off weights are involved). The PedsQL index score can be compared to that produced by the AQoL-2. The comparability of the relationship in the study population between BMI and QoL as established by the two different instruments will increase the level of confidence with which the QoL results from the AQoL2 are viewed. The two quality of life instruments were piloted with 95 students in the It’s Your Move! schools, before being administered at baseline. Administration The instruments were completed by students using PDAs as part of the baseline batch of surveys. The length of the AQoL questions and the response categories meant that a question and the associated response categories could not fit on a single screen. As a result, the students completed the questions by using the PDA in conjunction with a hard copy of the instrument. This process was piloted and found not to impact on the results. The PedsQL added little to the cognitive burden of participants, was easily administered and lent itself to electronic administration using the PDAs. It is very easy to score. The items on the scale are reversed scored and linearly

IYM Implementation Report 5 Evaluation 28
transformed to a 0-100 scale, such that higher scores indicate better health-related quality of life, (never 0=100; almost never 1=75; sometimes 2 = 50; often 3 = 25; almost always 4 = 0). To create scale scores, the mean is computed as the sum of the items divided by the number of items answered (thereby taking into account missing data). Separate scores can also be calculated for each of the four scales (physical functioning, emotional functioning, social functioning and school functioning) using the same method. Notes Both instruments are suitable for use with adolescents. The two surveys take approximately 10 to 15 minutes in total to administer (the PedsQL alone is only about two minutes),
Dissemination When the baseline data was completed, all schools (both intervention and comparison) were provided with their own local data in the form of a presentation (to staff) or as a report. This data was their school only and did not include anthropometry information due to it being unavailable at the time. Further reports have been generated in line with the other countries participating in the OPIC study, with the most recent titled: Lifestyle and Obesity in South Pacific Youth: Baseline Results from the Pacific Obesity Prevention In Communities (OPIC) Project in New Zealand, Fiji, Tonga and Australia. Auckland: 2008. Ongoing analysis, publications and dissemination of results will continue throughout 2009 and 2010.
Key Learnings and Recommendations At a school level, engaging with intervention and comparison schools was quite a challenge due to the project commencing in the second half of the year. This left term three and the first four weeks of term four to collect the baseline data. In term four, from week four, students in Years 10, 11 and 12 leave on a staggered basis, therefore collecting their data was problematic and required a highly coordinated approach by the research team and the school. This often required repeat visits to the school to collect the data of students who were absent on the first day. This emerged as an issue for the budget allocated to the baseline data phase (as there was no real „contingency money‟ allocated in the first year of data collection). In all, the baseline data collection took approximately nine months to collect.

IYM Implementation Report 5 Evaluation 29
In working with schools, many issues emerged during the baseline data collection phase. Some difficulties involved some schools having a vertical curriculum (e.g. students from Years 8-10 in amalgamated classes), interruptions in the school programs (e.g. camps, excursions, sport days), distribution and collection of consent forms (e.g. designating a teacher to collect and collate) and timing of testing (e.g. duration of testing from start to finish, with the number of students that consented). Some of the recommendations in relation to setting up the evaluation components of this study include: extensive planning by the research team before contacting schools, having a clear outline of the tools and instruments (e.g. survey, audits and other measurements) that are to be used and an estimated time it takes to administer, enter data and analyse. Additionally, the budget needs to be clearly defined by the research team to ensure that the costs of casual research assistants, hiring cars, equipment and accommodation are covered. The research team needs to allow at least six to eight months lead time to work with schools. The process requires obtaining official sign on from the State and Regional Educational Managers, conducting the consultation phase and relevant workshops with local stakeholders (e.g. Principals) and the appointment of a key contact within the school to assist in the coordination of data collection requirements. Once at the schools, the research team needs to have a system whereby they can administer and collect the required data within an approximate time of 55 minutes (1 period). This also includes recording the students ID numbers, checking that the surveys have been filled in correctly and ensuring that all of the students have completed the required tasks.
Conclusion It’s Your Move!, like the other projects conducted by the Sentinel Site for Obesity Prevention, has used a comprehensive evaluation framework with formative evaluation, process evaluation, impact evaluation, outcome evaluation, economic evaluation and, capacity building evaluation. When working with schools, data collection has to be a highly organised and well timed exercise for the school and the research team. Having a process whereby the school Principal selects a key contact, e.g. teacher who can distribute and collect consent forms, organise rooms/students and teachers to supervise is paramount.

IYM Implementation Report 5 Evaluation 30
References 1. The eSTEPS software. World Health Organisation STEPS team
http://www.who.int/chp/steps/contact/en/index.html)
2. AusStats. 4805.0 National Nutrition Survey: Nutrient Intakes and Physical Measurements Australia. 1995. Survey. Canberra: Australian Bureau of Statistics; 1998 17/12/98. Report No.: 4805.0.
3. Parnell, W., Scragg, R., Wilson, N., Schaaf, D. and Fitzgerald, E. (2003)
NZ Food NZ Children: key results of the 2002 National Children‟s Nutrition Survey. Wellington: Ministry of Health New Zealand.
4. Rutishauser , IHE., Webb, K., Abraham, B. and Allsop, R. (2001)
Evaluation of short dietary questions with weighted dietary records. Canberra: Australian Food and Nutrition Monitoring Unit, Commonwealth Department of Health and Aged Care.
5. Carter, M. A. and Swinburn, B. (2004) Measuring the 'obesogenic' food
environment in New Zealand primary schools. Health Promotion International. Mar;19(1):15-20.
6. Tropical Public Health Unit‟s Health Promotion / Nutrition team,
Queensland Health, Queensland Government (2004) Assessing your school the Active-Ate way: A Nutrition and Physical Activity Needs Assessment and Planning Guide.
7. Prevention CfDCa. (2005) School Health Index (SHI): Self-Assessment &
Planning Guide Middle school/high school version. 8. Plested, B.A., Edwards, R.W. and Jumper-Thurman, P. (2004) Community
readiness: a handbook for successful change. Fort Collins, CO: Tri-Ethnic Center for Prevention Research, Colorado State University.
9. Bush, R., Dower, J. and Mutch A. (2002) Community Capacity Index. Brisbane: Centre for Primary Health Care.
10. Bush, R., Dower, J. and Mutch A. (2002) Community Capacity Index Manual. Brisbane: Centre for Primary Health Care.
11. Knowles, M. S. (1990) The adult learner: a neglected species. 4th ed.
Houston, Texas: Gulf Publishing. 12. Richardson, J., Day, N. and Peacock, S. (2004) Measurement of the
quality of life for economic evaluation and the assessment of quality of life (AQoL) Mark 2 instrument. The Australian Economic Review. 37(1):62-88.

IYM Implementation Report 5 Evaluation 31
13. Hawthorne, G., Richardson, J., Osborne, R. and McNeil. H. (1997) The Assessment of Quality of Life (AQoL) instrument: construction, initial evaluation and utility scaling. Working Paper 76. Melbourne: CHPE, Monash University.
14. Hawthorne ,G. and Richardson, J. Using the Assessment of Quality of Life (AQoL) Instrument Version 1.0. 2000.
15. Varni, J.W., Seid, M. and Rode, C.A. (1999) The PedsQL: measurement
model for the Pediatric Quality of Life inventory. Med Care. Feb;37(2):126-39.
16. Varni, J.W. Knight, S.M, Uzark, T.S. and Szer, I.S. (2002) The PedsQLTM
4.0 Generic Core Scales: Sensitivity, responsiveness and impact on clinical decision-making. Journal of Behavioral Medicine. 25:175-93.
17. Varni, J.W. and Seid, M. (2001) The PedsQLTM 4.0: Reliability and validity
of the Pediatric Quality of Life InventoryTM Version 4.0 Generic Core Scales in healthy and patient populations. Medical Care. 39(8):800-12.

IYM Implementation Report 5 Evaluation 32

IYM Implementation Report 5 Evaluation 33
Appendix A: Process Evaluation Template
Your name: _____________________________
Your position: _____________________________
Contact details: ______________________________
Project name:
School name:
Date of activity:
Activity / Event (brief description): Location of activity: ________
Purpose of activity/event: ________________________________ Relevant objective/strategy:
___________
Staff involved Category of staff Number of staff Time spent Comments 1. 2. 3. 4. Students involved Number of students Time spent Parents/volunteers involved No. parents 1. Duration 2. Organising activity ___________________________________ 1. Organising activity _______________________ 3. Attending activity ____________________________________ 2. Attending activity _______________________ Resources used Type of resource Quantity Nature of units Cost (if available) Comments
1. 2. 3. 4. 5. ___________________________________________________________________________________________________ The following page asked about processes, lessons learnt and how would things be done differently
A B
C D
E
F G
H
Please turn over

IYM Implementation Report 5 Evaluation 34

IYM Implementation Report 5 Evaluation 35
Appendix B: Evaluation Plan
It’s Your Move! Project Evaluation Plan
February, 2008

IYM Implementation Report 5 Evaluation 36
Objective 1: To increase the capacity of families, schools and community organisations to promote healthy eating and physical activity
Measure Instrument When
Process:
Project structures: stakeholders, Terms of Reference, Committees, meeting minutes
Process Evaluation 2005-2008
Project Coordinator’s/officer’s work plans, diaries, time allocations etc
Process Evaluation 2005-2008
Formation of Action Plan, project coordination, project brief
Action Plan 2005
Versions of the action plans and other implementation documents
Process Evaluation Action Plan
2005-2008 2005-2008
Training for project staff, teachers and students Process Evaluation 2005-2008
Impact:
Development and implementation of resources and strategies in schools
Process Evaluation 2005-2008
Implementation of policies in secondary schools School Environmental Audit 2005 & 2008
Successful funding proposals to support the direction of the project
Process Evaluation (attach copies of grants)
2005-2008
Integration of health promotion strategies into the community/organisations
Process Evaluation Community Health Promotion Plans
2005-2008
Presentations, publications, workforce development Process Evaluation 2005-2008
Outcome:
Increased knowledge and skills of staff in secondary schools School Environmental Audit 2005 & 2008
Organisational changes-reorientation of existing staff and Integration of health promotion strategies into the organisation’s activities
Key Informant Interviews, Community Capacity Index Community Readiness to Change
2005 & 2008
Sustainable structure of the Student Ambassador Model Process Evaluation Student Ambassador Interviews
2006 and 2008
IYM Implementation Report 5 Evaluation 37
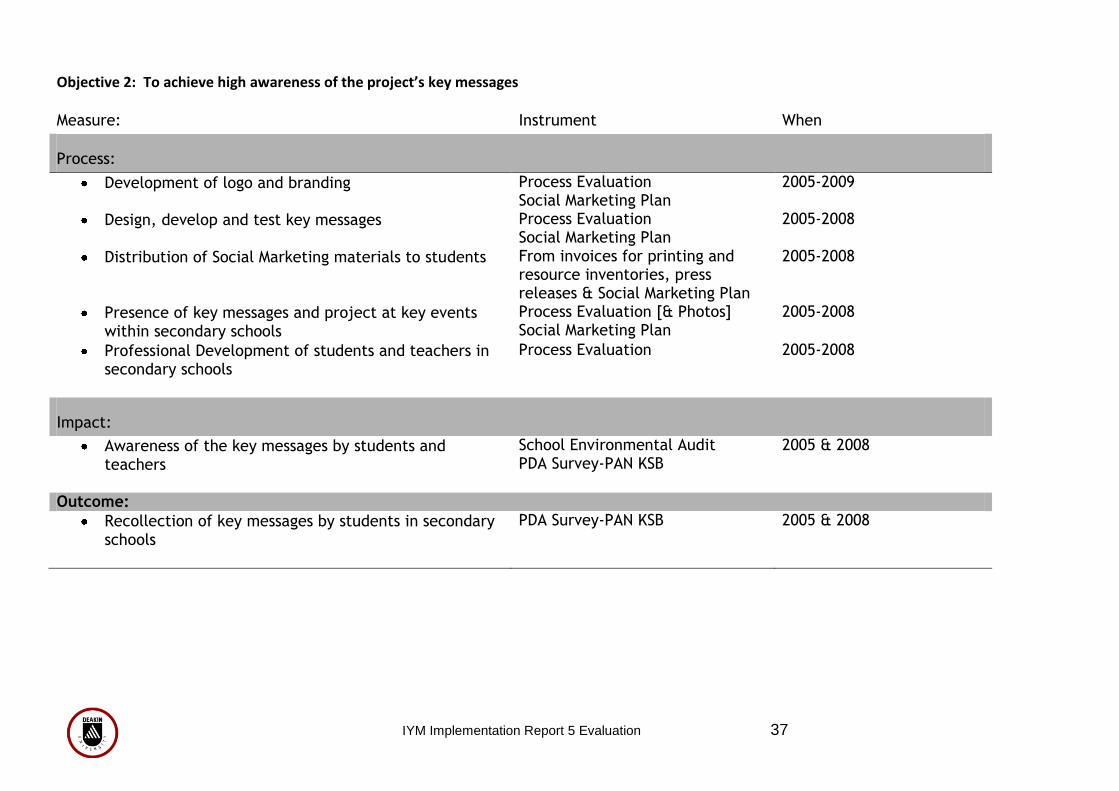
Objective 2: To achieve high awareness of the project’s key messages
Measure: Instrument When
Process:
Development of logo and branding Process Evaluation Social Marketing Plan
2005-2009
Design, develop and test key messages Process Evaluation Social Marketing Plan
2005-2008
Distribution of Social Marketing materials to students From invoices for printing and resource inventories, press releases & Social Marketing Plan
2005-2008
Presence of key messages and project at key events within secondary schools
Process Evaluation [& Photos] Social Marketing Plan
2005-2008
Professional Development of students and teachers in secondary schools
Process Evaluation 2005-2008
Impact:
Awareness of the key messages by students and teachers
School Environmental Audit PDA Survey-PAN KSB
2005 & 2008
Outcome:
Recollection of key messages by students in secondary schools
PDA Survey-PAN KSB 2005 & 2008

IYM Implementation Report 5 Evaluation 38
Objective 3: To evaluate the project
Measure: Instrument When
Process: Formative processes recorded by project staff Action Plan 2005
Process Evaluation Forms recorded by project staff Process Evaluation 2005-2008
Evaluation of training programs Individual Evaluation Forms of training
2005-2008
Evaluation Plan Evaluation Plan 2007-2008
Impact:
Project Progress reports Project Progress Reports 2005, 2006, 2007, 2008, 2009
Social Marketing Plan Social Marketing Plan 2005-2008
Communication Plan Communication Plan 2005-2008
Action Plan Action Plan 2005-2008
Outcome: Process Evaluation Primary measure: Implementation of
the action plan 2005-2008
Impact Evaluation Primary measures: Behaviour change, improvements in school setting, increased capacity of students
2005 & 2008
Outcome Evaluation Primary outcome measure(s): %body fat, weight, BMI, z-BMI Secondary outcome measure: relative decrease in the prevalence of overweight/ obesity in the intervention group compared to the comparison group
2005 & 2008
IYM Implementation Report 5 Evaluation 39
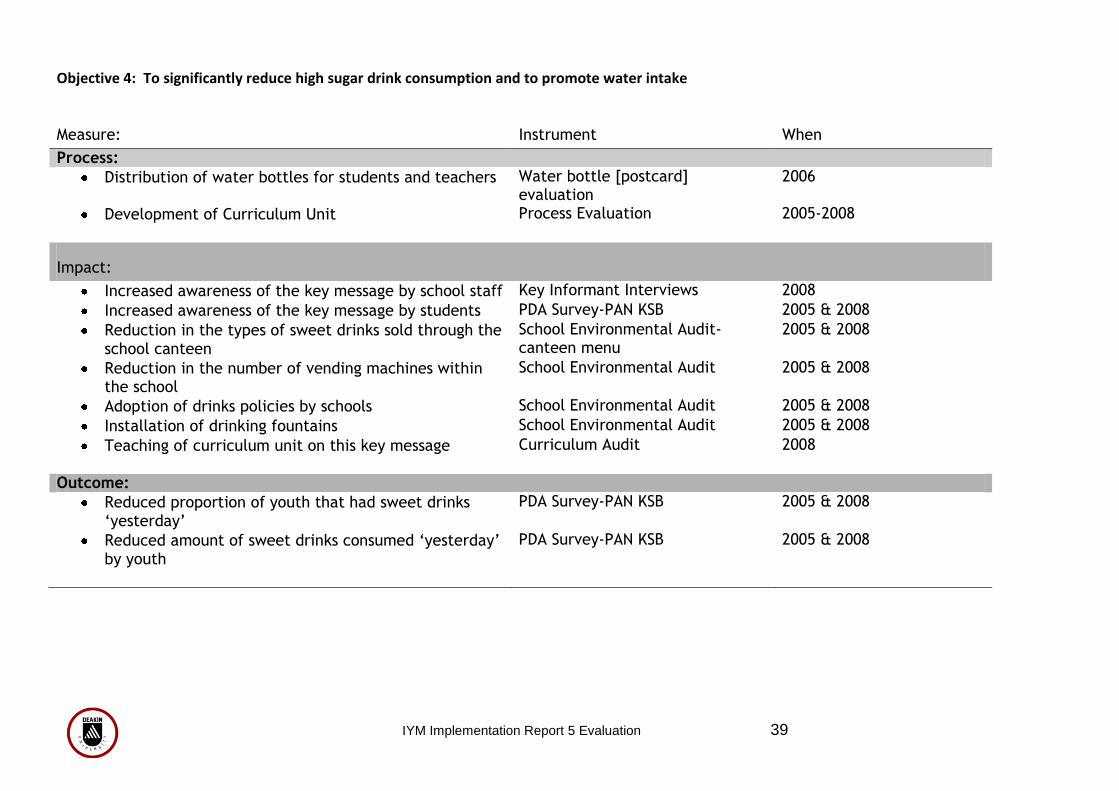
Objective 4: To significantly reduce high sugar drink consumption and to promote water intake
Measure: Instrument When
Process:
Distribution of water bottles for students and teachers Water bottle [postcard] evaluation
2006
Development of Curriculum Unit Process Evaluation 2005-2008
Impact:
Increased awareness of the key message by school staff Key Informant Interviews 2008
Increased awareness of the key message by students PDA Survey-PAN KSB 2005 & 2008
Reduction in the types of sweet drinks sold through the school canteen
School Environmental Audit-canteen menu
2005 & 2008
Reduction in the number of vending machines within the school
School Environmental Audit 2005 & 2008
Adoption of drinks policies by schools School Environmental Audit 2005 & 2008
Installation of drinking fountains School Environmental Audit 2005 & 2008
Teaching of curriculum unit on this key message Curriculum Audit 2008
Outcome:
Reduced proportion of youth that had sweet drinks ‘yesterday’
PDA Survey-PAN KSB 2005 & 2008
Reduced amount of sweet drinks consumed ‘yesterday’ by youth
PDA Survey-PAN KSB 2005 & 2008

IYM Implementation Report 5 Evaluation 40
Objective 5: To significantly increase the proportion of young people eating breakfast
Measure Instrument When
Process:
Development of curriculum unit on the key message Process Evaluation 2005-2008
Development of breakfast menus for students Process Evaluation 2005-2008
Social Marketing for students [15 Minutes of Food Recipe Books]
Process Evaluation 2007
Impact:
Increased awareness of key message by students PDA Survey-PAN KSB 2005 & 2008
Teaching of curriculum unit on the key message Curriculum Audit 2008
Proportion of healthy breakfast options increased in the canteen
School Environmental Audit 2005 & 2008
Outcome:
Decreased proportion of youth not eating breakfast PDA Survey-PAN KSB 2005 & 2008

IYM Implementation Report 5 Evaluation 41
Objective 6: To significantly increase fruit and vegetable consumption Measure:
Instrument When
Process:
Development of key messages for students Process Evaluation Social Marketing Plan
2005-2008 2005-2008
Implementation of programs and activities Process Evaluation 2005-2008
Impact:
Point-of-sale promotion of fruit and vegetables at the school canteen
Process Evaluation 2005-2008
Increased awareness of the key message by students PDA Survey-PAN KSB 2005 & 2008
Changes to canteen menus -Decrease in price of fruit and vegetables sold at the school canteen
School Environmental Audit-canteen menus
2005 & 2008
Outcome:
Increased number of serves of fruit eaten per day PDA Survey-PAN KSB 2005 & 2008
Increased number of serves of vegetables eaten per day
PDA Survey-PAN KSB 2005 & 2008
Increased number of days per week where fruit is eaten after school
PDA Survey-PAN KSB 2005 & 2008

IYM Implementation Report 5 Evaluation 42
Objective 7: To significantly increase the healthiness of school food Measure
Instrument When
Process:
Colour coding of canteen menus Process Evaluation 2005-2008
Develop the strategies needed to fulfil the Food @ School Guidelines
Process Evaluation 2008
Provide Professional Development to assist schools in the implementation/development of nutrition policies within their school
Process Evaluation Evaluation of Individual Professional Development Sessions
2005 – 2008 2005 - 2008
Impact:
Implement the Food @ School Guidelines Process Evaluation 2005- 2008
Policies in place about the foods provided through the school: Canteen, Vending Machines, Camps, excursions and sport days, Fundraising, Catering, & also about rewarding students
School Environmental Audit 2005 & 2008
Increased promotion of healthy food choices throughout the school
Process Evaluation 2005-2008
Increased proportion of students rating their teachers to be positive role models for healthy eating
PDA Survey-PAN KSB 2005 & 2008
Outcome:
Increase in healthy options sold at the school canteen School Environmental Audit (canteen menus)
2005 & 2008
Increase in rating of canteen foods by staff School Environmental Audit 2005 & 2008
Increase in rating of canteen foods by students PDA Survey-PAN KSB 2005 & 2008
Increased rating of school’s support for healthy eating by students
PDA Survey-PAN KSB 2005 & 2008

IYM Implementation Report 5 Evaluation 43
Objective 8: To significantly increase active transport (walking and cycling)
Measure: Instrument When
Process:
Development of social marketing for students Process Evaluation Social Marketing Plan
2005-2008 2005-2008
Development of school strategies to increase active transport
Process Evaluation 2005-2008
Implementation of existing programs (such as Travel Smart & Bicycle Victoria)
Process Evaluation 2005-2008
Impact:
Increased awareness of this Key Message by students PDA Survey-PAN KSB 2005 & 2008
Establishment of school drop off zones School Environment Audit 2005 & 2008
Outcome:
Increased number of students walking to school who live within 15 minutes walking distance
PDA Survey-PAN KSB
2005 & 2008
Increased number of students cycling to school who live within 30 minutes cycling distance
PDA Survey-PAN KSB
2005 & 2008

IYM Implementation Report 5 Evaluation 44
Objective 9: To significantly increase participation in organised sports and other active recreation
Measure: Instrument When
Process:
Development of partnerships with sporting clubs Process Evaluation 2008
Development of PE Teachers Network Process Evaluation
Development of social marketing materials for students Process Evaluation 2005-2008
Development of Policies on participation Process Evaluation 2005-2008
Impact:
Professional development of PE Teachers through PE Teachers Network
Process Evaluation Leisure Networks Strategic Plan
2008
Increase in number of lunchtime activities for students Process Evaluation 2005-2008
Increased proportion of students rating their teachers as positive role models for physical activity
PDA Survey-PAN KSB 2005 & 2008
Outcome:
Increased number of students being active at lunchtime
PDA Survey-PAN KSB 2005 & 2008
Increased number of students being physically active after school
PDA Survey-PAN KSB 2005 & 2008
Increased number of students participating in organised sport
PDA Survey-PAN KSB 2005 & 2008

IYM Implementation Report 5 Evaluation 45
Objective 10: To create an acceptance of different healthy body sizes/ shapes and decrease episodes of inappropriate dieting
Measure: Instrument When
Process:
Curriculum development around the key message Process Evaluation 2005-2008
Design, develop and test key messages in relation to body size/shapes & weight
Process Evaluation Social Marketing Plan
2005-2008
Programs and events Process Evaluation Event Evaluation
2005-2008
Impact:
Increased awareness of the key message by students PDA Survey-PAN KSB 2005 & 2008
Curriculum implementation Curriculum Audit 2008
Outcome:
Decrease in the proportion of students that are ‘unhappy’ with their shape & size but are a healthy weight
PDA Survey-PAN KSB 2005 & 2008
Decrease in the proportion of students that are trying to lose weight but are a healthy weight
PDA Survey-PAN KSB 2005 & 2008
Decrease in prevalence of students classifying themselves as overweight or obese who are within a healthy weight category
Anthropometry 2005 & 2008

IYM Implementation Report 5 Evaluation 46

IYM Implementation Report 5 Evaluation 47
Appendix C: Protocols for taking anthropometric measurements In conducting the children‟s height, weight, waist circumference and body fat percentages measures, a team of Research Assistants (RA‟s) were trained in the administration process. Students moved through three stations: height measured using a stadiometer, weight (and relative body composition indicators) using a TANITA and their waist using an expandable tape measure. In setting up the measurement process within a school context, measurements were conducted in areas that were deemed appropriate and available with screens dividing rooms where necessary and that matched gender RAs measured students (i.e. male research assistants were used for measurement of male students). The process of obtaining the anthropometry measures involved a series of stations set up within an unused classroom or alternative room within the school. Height The first station measured the students‟ height. This involved the research assistant asking the student to remove any bulky clothing including shoes and socks or any other items that could affect the measurements. Ideally, students should only have one thin layer of clothing only. Students were then asked to step on to the stadiometer with their back and heels against the stand (students were asked not to lean back on the stand). They were then asked to stand up straight (stretching upwards without heels leaving the ground and to look straight ahead. To measure the students, the research assistant checked the lower body is in proper position and that line of vision is at right angles to the body before taking measurement (to the nearest 0.1 cm). The desired position of the body and the head for height measurement are shown in figures 1 and 2. The research assistant rolled the tape measure down to the top of the students head. The measurement was then recorded onto the students Demographic Sheet.
Figure 1: Position of body for measurement of height (Source: http://www.state.me.us/education/sh/figure%201.doc)
IYM Implementation Report 5 Evaluation 48
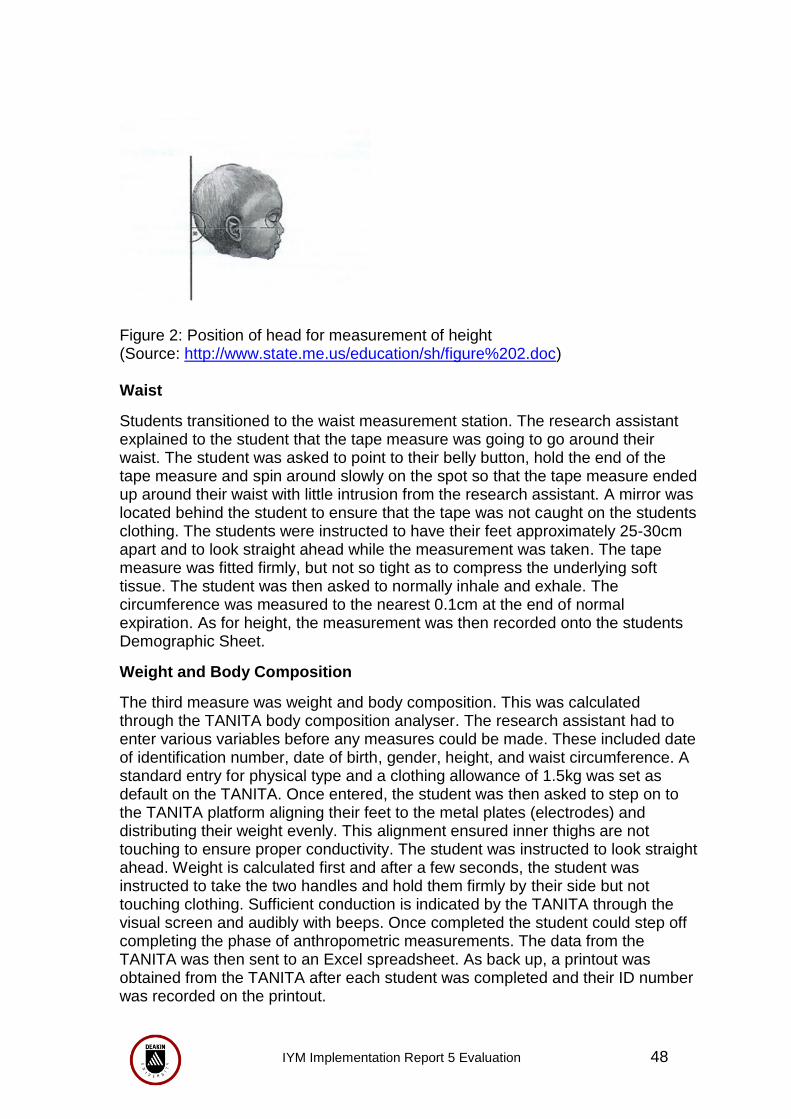
Figure 2: Position of head for measurement of height (Source: http://www.state.me.us/education/sh/figure%202.doc) Waist
Students transitioned to the waist measurement station. The research assistant explained to the student that the tape measure was going to go around their waist. The student was asked to point to their belly button, hold the end of the tape measure and spin around slowly on the spot so that the tape measure ended up around their waist with little intrusion from the research assistant. A mirror was located behind the student to ensure that the tape was not caught on the students clothing. The students were instructed to have their feet approximately 25-30cm apart and to look straight ahead while the measurement was taken. The tape measure was fitted firmly, but not so tight as to compress the underlying soft tissue. The student was then asked to normally inhale and exhale. The circumference was measured to the nearest 0.1cm at the end of normal expiration. As for height, the measurement was then recorded onto the students Demographic Sheet.
Weight and Body Composition
The third measure was weight and body composition. This was calculated through the TANITA body composition analyser. The research assistant had to enter various variables before any measures could be made. These included date of identification number, date of birth, gender, height, and waist circumference. A standard entry for physical type and a clothing allowance of 1.5kg was set as default on the TANITA. Once entered, the student was then asked to step on to the TANITA platform aligning their feet to the metal plates (electrodes) and distributing their weight evenly. This alignment ensured inner thighs are not touching to ensure proper conductivity. The student was instructed to look straight ahead. Weight is calculated first and after a few seconds, the student was instructed to take the two handles and hold them firmly by their side but not touching clothing. Sufficient conduction is indicated by the TANITA through the visual screen and audibly with beeps. Once completed the student could step off completing the phase of anthropometric measurements. The data from the TANITA was then sent to an Excel spreadsheet. As back up, a printout was obtained from the TANITA after each student was completed and their ID number was recorded on the printout.

IYM Implementation Report 5 Evaluation 49
Body size calculations BMI (weight in kg/(height in m)2), waist/height ratio and BMI-z score (calculated against the 2000 CDC growth reference from the United States using the zanthro module in STATA) were calculated. The International Obesity Task Force (IOTF) age-specific BMI cut-offs were also used to classify children‟s weight status as either thinness grades 1-3, healthy weight, overweight or obese (1, 2) using the LMS Growth Microsoft Excel module (2).
1. Cole TJ, Bellizzi MC, Flegal KM, Dietz WH. Establishing a standard definition for child overweight and obesity worldwide: international survey. BMJ. 2000 May 6;320(7244):1240-3.
2. Cole TJ, Flegal KM, Nicholls D, Jackson AA. Body mass index cut offs to define
thinness in children and adolescents: international survey. BMJ. 2007 Jun 25.

IYM Implementation Report 5 Evaluation 50

IYM Implementation Report 5 Evaluation 51
Appendix D: Adolescent Behaviour, Attitudes and Knowledge Questionnaire
Instructions: Is this today‟s date? ______/______/_______ What is the name of your school? ____________________ 1. What year are you in? Year 9 10 11 12 13 2. Which ethnic group do you most associate with? European Australian Indian Chinese Indigenous Australian Other 3. Were you born in Australia? Yes No 4. I am Male Female 5. What is your date of birth? Day Month Year 6. Do you live with your parents/step-parents during the school week? Yes with two parents Yes with one parent Don‟t live with my parents 7. Do you live with other ADULT relatives during the school week? (e.g. grandparents, uncle, aunt, cousin) Yes No 12. How many people usually live at your home including yourself during the school week? 1-15 ____ 13. On school days, where do you usually get your breakfast from?
Home School canteen or tuck shop Shop (outside school) From friends I don‟t eat breakfast
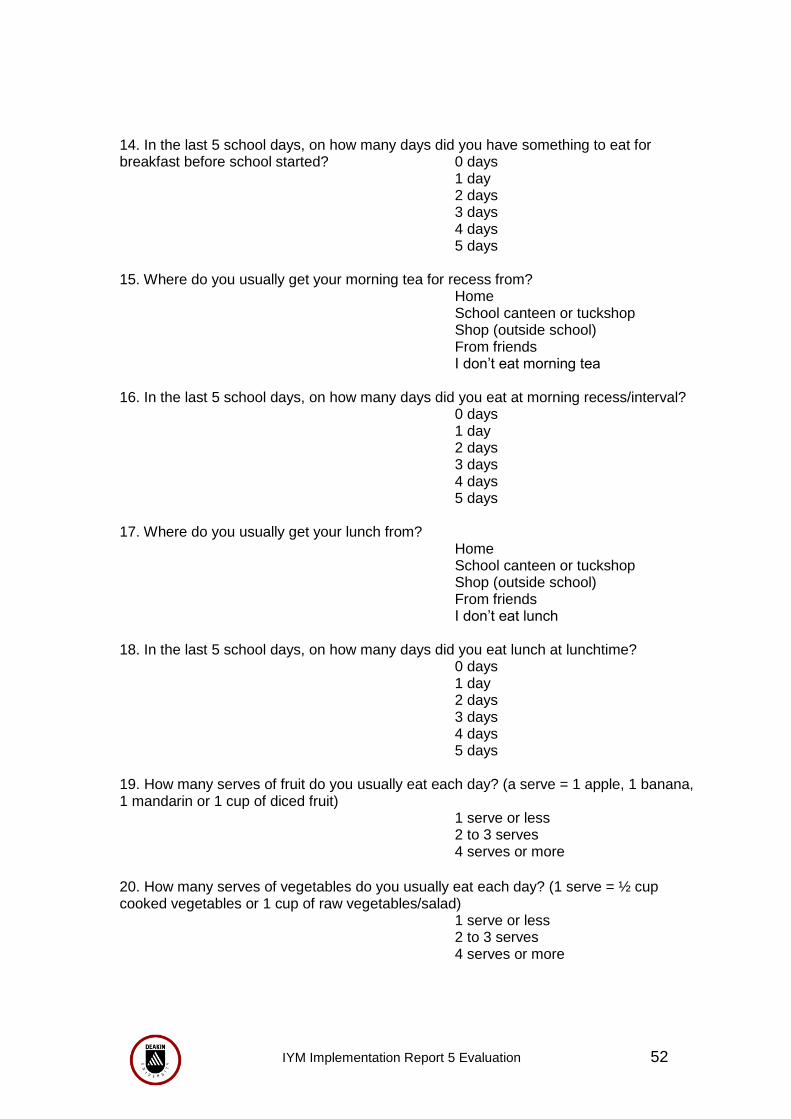
IYM Implementation Report 5 Evaluation 52
14. In the last 5 school days, on how many days did you have something to eat for breakfast before school started? 0 days 1 day
2 days 3 days 4 days 5 days
15. Where do you usually get your morning tea for recess from? Home
School canteen or tuckshop Shop (outside school) From friends I don‟t eat morning tea 16. In the last 5 school days, on how many days did you eat at morning recess/interval? 0 days 1 day
2 days 3 days 4 days
5 days 17. Where do you usually get your lunch from?
Home School canteen or tuckshop Shop (outside school) From friends I don‟t eat lunch 18. In the last 5 school days, on how many days did you eat lunch at lunchtime? 0 days 1 day
2 days 3 days 4 days
5 days 19. How many serves of fruit do you usually eat each day? (a serve = 1 apple, 1 banana, 1 mandarin or 1 cup of diced fruit)
1 serve or less 2 to 3 serves 4 serves or more
20. How many serves of vegetables do you usually eat each day? (1 serve = ½ cup cooked vegetables or 1 cup of raw vegetables/salad) 1 serve or less 2 to 3 serves 4 serves or more

IYM Implementation Report 5 Evaluation 53
21. In the last 5 school days(including time spent at home), on how many days did you have regular (non diet) soft drinks? (Soft drinks = drinks like Coke, Sprite, Fanta) 0 days 1 day
2 days 3 days 4 days
5 days 22. On the last school day, how many glasses or cans of non-diet soft drinks did you have? 0-More than 2 litres 23. In the last 5 school days, on how many days did you have fruit drinks or cordial? (Such as Ribena and Cottees) 0 days 1 day
2 days 3 days 4 days
5 days 24. On the last school day, how many glasses of fruit drinks or cordial did you have? 0-9 glasses ____ 25. How often do you usually eat food from a takeaway? (e.g. McDonalds, KFC, Subway, fried chicken, fish and chips, hamburgers, Chinese takeaway) Once a month or less 2-3 times a month Once a week 2-3 times a week Most days 26. In the last 5 school days, on how many days did you buy snack food from a shop or takeaway after school? 0 days 1 day
2 days 3 days 4 days
5 days 27. How often do you usually eat fruit after school? Everyday or almost everyday Most days Some days Hardly ever or never 28. How often do you usually eat bread, toast, buns or sandwiches after school? Everyday or almost everyday Most days Some days Hardly ever or never
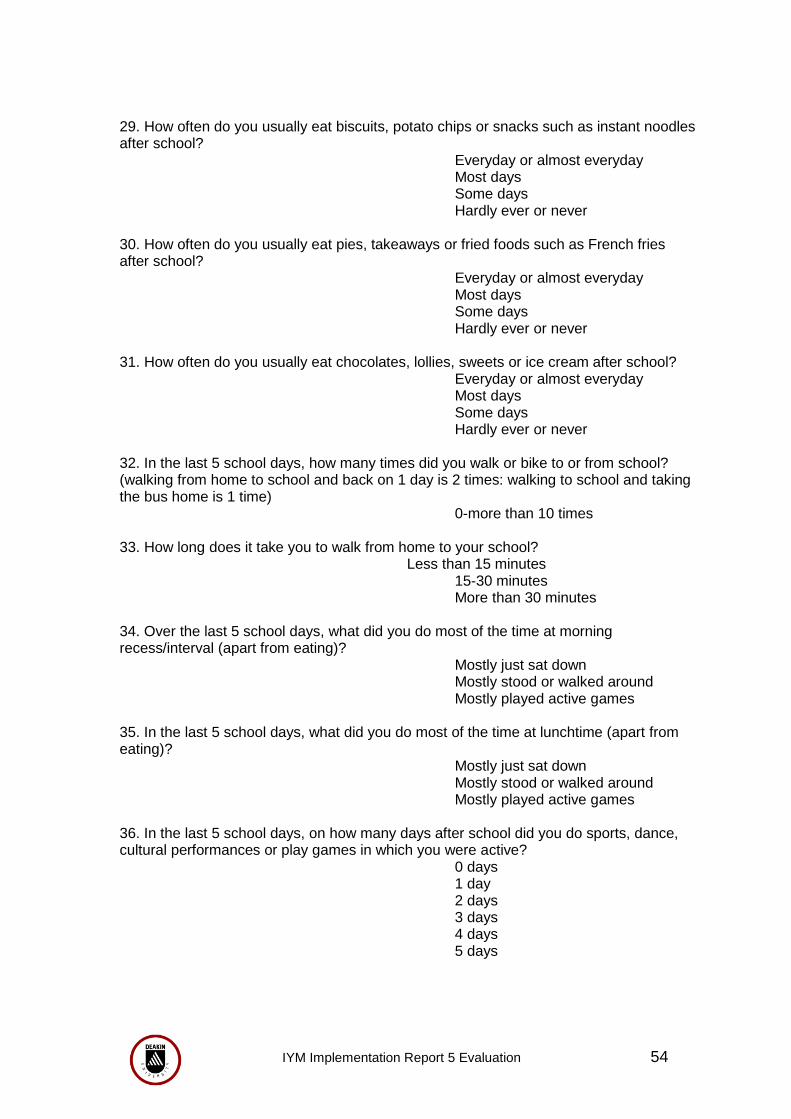
IYM Implementation Report 5 Evaluation 54
29. How often do you usually eat biscuits, potato chips or snacks such as instant noodles after school? Everyday or almost everyday Most days Some days Hardly ever or never 30. How often do you usually eat pies, takeaways or fried foods such as French fries after school? Everyday or almost everyday Most days Some days Hardly ever or never 31. How often do you usually eat chocolates, lollies, sweets or ice cream after school? Everyday or almost everyday Most days Some days Hardly ever or never 32. In the last 5 school days, how many times did you walk or bike to or from school? (walking from home to school and back on 1 day is 2 times: walking to school and taking the bus home is 1 time)
0-more than 10 times 33. How long does it take you to walk from home to your school? Less than 15 minutes 15-30 minutes More than 30 minutes 34. Over the last 5 school days, what did you do most of the time at morning recess/interval (apart from eating)? Mostly just sat down Mostly stood or walked around Mostly played active games 35. In the last 5 school days, what did you do most of the time at lunchtime (apart from eating)? Mostly just sat down Mostly stood or walked around Mostly played active games 36. In the last 5 school days, on how many days after school did you do sports, dance, cultural performances or play games in which you were active? 0 days 1 day
2 days 3 days 4 days 5 days

IYM Implementation Report 5 Evaluation 55
37. In the last 5 school days, how many days did you watch TV, videos or DVDs in your free time? 0 days 1 day
2 days 3 days 4 days 5 days 38. On the last school day that you watched TV, videos or DVDs, how long did you watch for?
Less than 1 hour – More than 4 hours 39. Last Saturday, how many hours did you spend watching TV, videos or DVDs? 0-more than 10 hours 40. Last Sunday, how many hours did you spend watching TV, videos or DVDs? 0-more than 10 hours 41. During the school week, do your parents (or caregivers) limit the amount of TV you are allowed to watch? (including videos and DVDs)
No limits, I can watch anything Yes, but not very strict limits Yes, strict limits 42. In the last 5 school days, how many times did you watch TV while eating your evening meal? 0 days 1 day
2 days 3 days 4 days 5 days 43. Do you have a TV in your home? Yes No 44. Do you have a TV in your bedroom? Yes No 45. In the last 5 school days, how many days did you play video games, electronic games or use the computer (not for homework)? 0 days 1 day
2 days 3 days 4 days 5 days

IYM Implementation Report 5 Evaluation 56
46. On the last school day that you spent time playing video games or using the computer (not for homework), how long did you play for?
Have not played for ages Less than 1 hour 1 hour 2 hours 3 hours 4 hours More than 4 hours
47. Last Saturday, how many hours did you spend playing video games or using the computer (not for homework)? 0 – More than 5 hours 48. Last Sunday, how many hours did you spend playing video games or using the computer (not for homework)? 0 – More than 5 hours 49. Do you have video games, electronic games or a computer in your home? Yes No 50. How would you describe your weight? Very underweight Slightly underweight About the right weight Slightly overweight Very overweight 51. How happy or unhappy are you with your BODY WEIGHT? Very happy Happy In between / OK Unhappy Very unhappy Never thought about my body
weight 52. How happy or unhappy are you with your BODY SHAPE?
Very happy Happy In between / OK Unhappy Very unhappy Never thought about my
shape 53. Which of these statements most closely applies to you? I am…
Trying to lose weight Trying to gain weight Trying to stay at my current weight Not doing anything about my weight

IYM Implementation Report 5 Evaluation 57
54. Which of the following statements most closely applies to you? I am…
Trying to gain muscle size Trying to stay at the same muscle size Not doing anything about my muscles
55. How much does your mother (or female caregiver) encourage you to eat healthy foods? A lot Some A little Not at all Don‟t live with my mother 56. How much does your father (or male caregiver) encourage you to eat healthy foods? A lot Some A little Not at all Don‟t live with my father 57. How often do you have food from a takeaway shop for dinner? More than once a week About once a week 2-3 times a month Once a month or less 58. How often is fruit available at home for you to eat? Everyday or almost everyday Most days Some days Hardly ever or never 59. How often are potato chips or similar snacks available at home for you to eat? Everyday or almost everyday Most days Some days Hardly ever or never 60. How often are chocolates or sweets available at home for you to eat? Everyday or almost everyday Most days Some days Hardly ever or never 61. How often are non-diet soft drinks available at home for you to drink? (soft drinks = drinks like Coke, Sprite, Fanta) Everyday or almost everyday Most days Some days Hardly ever or never

IYM Implementation Report 5 Evaluation 58
62. In the last 5 school days, how much money did you spend in total on food or drinks for yourself at takeaway shops or milkbars (not at the school canteens)? 0 – 20 Dollars 63. How much does your mother (or female caregiver) encourage you to be physically active or play sports? A lot Some A little Not at all Don‟t live with my mother 64. How much does your father (or male caregiver) encourage you to be physically active or play sports? A lot Some A little Not at all Don‟t live with my father 65. How much do your older brothers or male cousins encourage you to be physically active or play sports? A lot Some A little Not at all Don‟t have older
Brother/cousin 66. How much does your older sister or female cousins encourage you to be physically active or play sports? A lot Some A little Not at all Don‟t have older sister/cousin 67. How much do your best friends encourage you to be physically active or play sports? A lot Some A little Not at all 68. In the last 5 school days, how many times did all or most of your family living in your house eat an evening meal together? 0 days 1 day
2 days 3 days 4 days 5 days

IYM Implementation Report 5 Evaluation 59
69. How much does your school encourage ALL students play organised sport?
A lot Some A little Not at all 70. How much does your school encourage ALL students to be physically active at lunchtime? A lot Some A little Not at all 71. How do you rate the teachers at your school as role models for being physically active? Excellent Good OK Not very good Poor 72. How do you rate the teachers at your school as role models for healthy eating? Excellent Good OK Not very good Poor 73. How do you rate the food and drink choices available at your school canteen? Mostly healthy Half healthy/half unhealthy Mostly unhealthy 74. How much does your school encourage students to make healthy food choices? A lot Some A little Not at all 75. How safe do you feel being out alone in your neighbourhood at night? Very safe Safe Unsafe Very unsafe 76. How safe do your parents (or caregivers) think it is for you to be out alone in your neighbourhood at night? Very safe Safe Unsafe Very unsafe Don‟t know

IYM Implementation Report 5 Evaluation 60
77. How much do dogs bother you when you are walking in your neighbourhood? A lot Somewhat A little Not at all 78. How much does traffic bother you when you are walking in your neighbourhood? A lot Somewhat A little Not at all 79. How much do other people bother you when you are walking in your neighbourhood? A lot Somewhat A little Not at all How strongly do you agree or disagree with the following statements 80. Skipping breakfast or lunch is a good way to lose weight Strongly agree Agree Neither agree nor disagree Disagree Strongly disagree 81. Fruit drinks and cordials have less sugar than non-diet soft drinks like Coke and Sprite Strongly agree Agree Neither agree nor disagree Disagree Strongly disagree 82. Watching a lot of TV does not lead to weight gain Strongly agree Agree Neither agree nor disagree Disagree Strongly disagree 83. Eating a lot of fruit and vegetables is bad for your weight Strongly agree Agree Neither agree nor disagree Disagree Strongly disagree This completes the questionnaire!! Thank you for your participation!!…well done!

IYM Implementation Report 5 Evaluation 61
Appendix E: School Environmental Audit Instructions Schools can influence students‟ nutrition and physical activity behaviours in a lot of ways (policies, curriculum, role modelling, etc). The purpose of this audit is to attain a picture of your school‟s policies and practices relating to nutrition and physical activity. There are three parts of this audit: Part 1 (this part) is to be filled out by the Principal or a Senior Administrator. It is expected as part of this audit to attach copies of relevant policies or documents (where defined). Part 2 is to be filled out by the Canteen Manager or food service operator; and Part 3 is to be completed by at least 3 Teachers from your school. It will take approximately 15 minutes to fill out each part. All parts of the audit are self-administered. Answer the questions honestly; your answers will remain confidential. Where research related to this information is reported, your name and your school will not be identified. Thank you for taking the time to complete this audit. Please return completed audits to: __________________

IYM Implementation Report 5 Evaluation 62
Secondary School Environmental Audit - Part 1
To be filled in by the Principal/Senior Administrator/or other senior person who has access to the school policies
School Name: ____________________________________ Your Name: ______________________________________ Your phone number: _______________________________ (In case a member of the research team would like to contact you to clarify any of your responses). Date of Completion of the audit __________________________
What is your position?
Principal
Deputy Principal/ Senior Administrator
Other _________________ Initials of administrator of audit: ____________________________

IYM Implementation Report 5 Evaluation 63
Food Availability
1. In the 2008 school year, which students were allowed to leave school grounds during
the school day? (Without special permission) Choose all that apply
Year 7
Year 8
Year 9
Year 10
Year 11
Year 12
None of the students are permitted to leave (go to question 3)
2. At what times during the day were the students permitted to leave the school grounds? (Without special permission) Choose all that apply
During lunch
During morning and afternoon tea/intervals
Other times
3. How close is the nearest milk bar/dairy to your school?
Within 100 metres
100m to 500m
500m to 1000m
More than 1000m 4. How close is the nearest takeaway/ fast food outlet to your school?
Within 100 metres
100m to 500m
500m to 1000m
More than 1000m
School food service
5. In the 2008 school year, was there a food service (food service means canteen, tuck-shop, or lunch order system, breakfast clubs etc) operating at your school?
Yes
No (go to question 9)

IYM Implementation Report 5 Evaluation 64
6. Who operated the food service?
Canteen manager employed by the school (go to question 8)
Volunteers (students, parents, etc) coordinated by school staff (go to
question 8)
External food company (eg, local shop, food service organisation)
Other ____________________________
7. If an external food service company operated the school food service was it covered
by a written contract?
No
Yes, and it is up for renewal within 2 years
Yes, and it is not up for renewal within 2 years
8. In the 2008 school year, was the school food service an important source of funds for
the school?
Yes
No 9. Did your school food service provider have a contract with a soft drink bottler or other food manufacturer giving the company exclusive rights or preference to sell soft drinks or other foods at your school in 2008?
Yes
No
Food and nutrition
10. At the beginning of 2008, did your school have a written policy (or policies) relating to promoting and supporting nutrition and healthy eating at school?
Yes (If yes, please attach a copy/ copies)
No (If no, go to q12)

IYM Implementation Report 5 Evaluation 65
11. Did the policy (or policies) include: Yes No
What foods are available in the canteen?
The availability of drinking water for students?
Vending machines at school?
Foods used for fundraising?
Using food as a reward? (e.g. chocolate fish)
Food associated with school events? (eg sports days,
parent evenings)
Teaching food and nutrition in the curriculum?
Staff acting as role models for healthy eating?
12. About how often in the 2008 school year did your school give information to parents about healthy food and eating (at school events, in newsletters, etc.) (If possible, please attach some examples)?
0 times
1-3 times
4-6 times
7-10 times
More than 10 times
I don‟t know 13. About how often in the 2008 school year, did you have sporting, social or cultural events in your school be sponsored by soft-drink, fast food or confectionary companies?
0 times
1-3 times
4-6 times
7-10 times
More than 10 times

IYM Implementation Report 5 Evaluation 66
14. In 2008, were students allowed to drink water in the classroom during class time?
Yes
No
Not sure 15. In 2008, were students allowed to eat in the classroom during class time?
Yes
No
Not sure 16. In 2008, did your school have a school vegetable garden?
Yes
No
Physical education, sports and physical activity
17. In 2008, did the school have a written policy / policies relating to promoting and
supporting physical activity at school?
Yes (If yes, please attach a copy / copies)
No (If no, go to q18) 18. Did this policy include: Yes No
The use of school grounds „out of school hours‟?
Providing access to sports equipment outside of formal sport
or P.E?
Promoting cycling and/or walking to school?
Encouraging participation in sports or other active programs
(e.g. Dance, aerobics)

IYM Implementation Report 5 Evaluation 67
19. On average in 2008, how many periods a week were devoted to formal physical education (PE) for the following year levels? If PE was not compulsory for a year level, please tick the box for either „Optional PE or equivalent‟ or „No option for PE or equivalent‟
1 period /week
2 periods / week
3 periods / week
4 periods / week
5 periods / week
6 periods / week
7 periods / week
Optional PE or equivalent
No option for PE or equivalent
Year 7
Year 8
Year 9
Year 10
Year 11
Yea 12
20. On average, how often are the school grounds utilised by external clubs and other groups for supervised sports?
0 days a week
1 day a week
2 days a week
3 days a week
4 days a week
5 days a week
6 days a week
Every day of the week 21. In the 2008 school year, how many different clubs or community groups utilised the
school grounds for sports and other recreational activities?
_________________ Number of clubs/groups 22. In the 2008 school year, could students access the school‟s outdoor facilities at any time outside of school hours (i.e. Weekends and holidays)?
Yes
No

IYM Implementation Report 5 Evaluation 68
23. Were there indoor facilities for physical activity in 2008 (e.g. a gym, basketball court)?
Yes
No 24. Do most teachers participate in professional development / continuing education at least once a year?
Yes
No
25. Do staff have the opportunity for professional development training regarding the health benefits of nutrition and physical activity?
Yes
No
Thank you for taking the time to complete this audit.

IYM Implementation Report 5 Evaluation 69
Secondary School Environmental Audit
Instructions Schools can influence students‟ nutrition and physical activity behaviours in a lot of ways (policies, curriculum, role modelling, etc). The purpose of this audit is to attain a picture of your school‟s policies and practices relating to nutrition and physical activity. There are three parts of this audit: Part 1 is to be filled out by the Principal or a senior administrator; Part 2 (this part) is to be filled out by the canteen manager or food service operator; and Part 3 is to be completed by teachers at the school. It will take approximately 15 minutes to fill out this part. All parts of the audit are self-administered. It is important to keep in mind that when filling out the audit to answer the questions honestly; your answers will remain confidential. Where research related to this information is reported, your name and your school will not be identified. Thank you for taking the time to complete this audit. Please return the completed audit together with a copy of your canteens current price list (including all items for sale) to______________________________.

IYM Implementation Report 5 Evaluation 70
Secondary School Environmental Audit - Part 2
This part of the audit is to be completed by someone who has a close working knowledge of the school food service.
Thank you for taking the time to complete this audit. This should be answered by someone who has a close working knowledge of the school food service such as a canteen manager or food service operator. Please answer the questions as best as you can. The contents of this audit will remain confidential to the research team and to your school. Where research related to this information is reported, your school name will not be identified. School Name _________________________________ Your Name ___________________________________ Your phone number ____________________________ (In case a member of the research team would like to contact you to clarify any of your responses.)
Date of Completion of the audit: _________________ What is your position?
Canteen manager
Other: ______________________________
Initials of administrator of audit: ____________________________
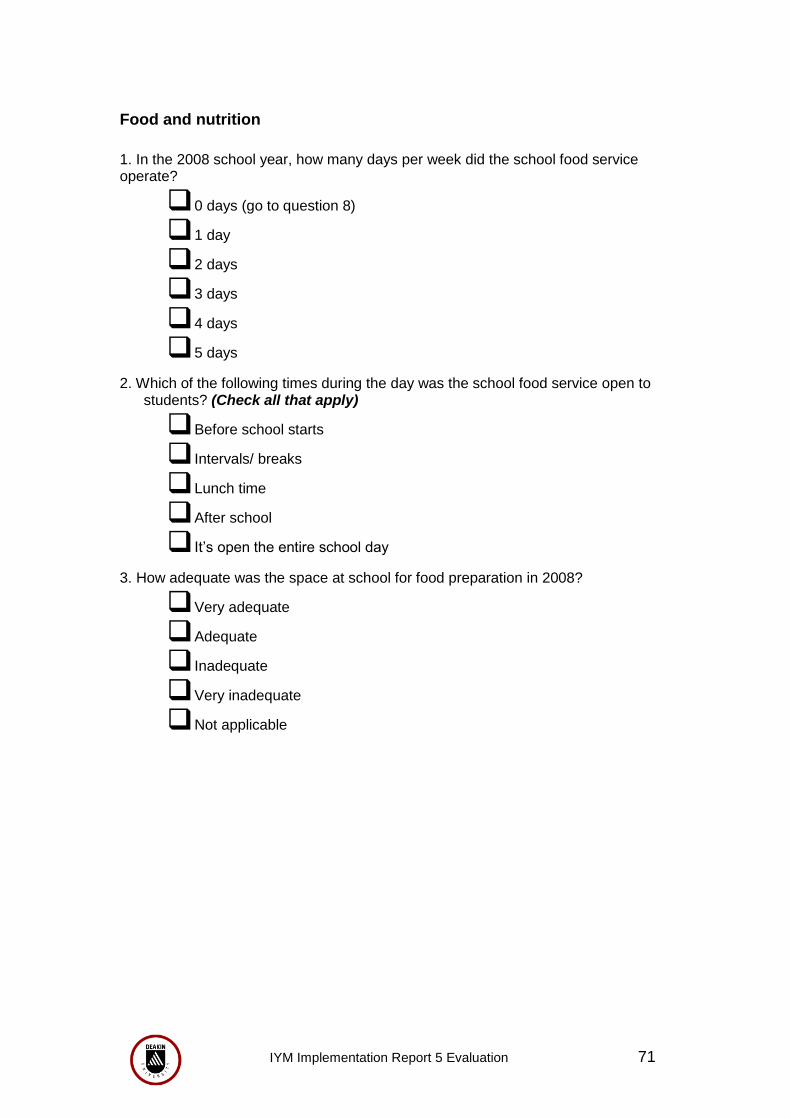
IYM Implementation Report 5 Evaluation 71
Food and nutrition
1. In the 2008 school year, how many days per week did the school food service operate?
0 days (go to question 8)
1 day
2 days
3 days
4 days
5 days
2. Which of the following times during the day was the school food service open to students? (Check all that apply)
Before school starts
Intervals/ breaks
Lunch time
After school
It‟s open the entire school day
3. How adequate was the space at school for food preparation in 2008?
Very adequate
Adequate
Inadequate
Very inadequate
Not applicable

IYM Implementation Report 5 Evaluation 72
4. In 2008, were the following foods and beverages usually (usually meaning most days of the week) available from the school food service? Yes No Fruit Salad options Milk (including flavoured milk) Yoghurt Filled rolls/ sandwiches Lollies/ chocolate Hot Chips Crisps Pies Sausage rolls
100% fruit juice Sugar drinks (soft drinks, sports drinks and fruit cordials) Water Ice blocks, ice poles, or ice creams
5. Did the school food service have a pricing policy that encouraged the sale of healthy food choices at a reduced cost in 2008?
Yes
No
Don‟t know 6. In the 2008 school year, did the school food service routinely promote and
advertise healthy food choices (e.g., highlight healthy foods on menu, offer taste testing opportunities for new food, have best position in food displays)?
Yes
No
Don‟t know 7. How often did the schools food service review the food and drinks available in 2008?
Never
Less than once a year
About once a year
About once every 6 months
About once a term
Once a month or more 8. How many vending machines did your school have in 2008?
_____________ (number of machines) (If none, answer 0 and go to qn 11)

IYM Implementation Report 5 Evaluation 73
9. How many of these vending machines sold drinks alone? ____________ (number of machines) (if none, answer 0) 10. How many vending machines were accessible for staff alone? _____________ (number of machines) (if none, answer 0) 11. How many water fountains or drinking taps were in your school in 2008?
0
1-3
3-6
7-10
More than 10 12. Please attach a copy of your canteens current price list including all items for sale Thank you for taking the time to complete this audit

IYM Implementation Report 5 Evaluation 74
Secondary School Environmental Audit - Part 3
This part of the audit is to be completed by a teacher
Thank you for taking the time to complete this audit. This part of the audit contains a number of personal ratings and judgements about the effectiveness of policies at your school. Please answer the questions as best as you can. The contents of this audit will remain confidential to the research team and to your school. Where research related to this information is reported, your name and the name of your school will not be identified. School Name: _________________________________ Your Name: __________________________________ (In case a member of the research team would like to contact you to clarify any of your responses) Date of Completion of the audit: __________________ Person 1: What is your position?
Teacher
Nurse
Other _________________
Tick box if you are a health or PE teacher Initials of the administrator of the audit: _____________________

IYM Implementation Report 5 Evaluation 75
Food and nutrition
1. Indicate your level of agreement/ disagreement with the following statement,
“In the 2008 school year, our school canteen (food service) mainly provided foods with high nutritional value”
Strongly agree
Agree
Neither agree nor disagree
Disagree
Strongly disagree Questions 2, 3, 4 and 5 relate to a written policy that promotes healthy eating. 2. Does your school have a written school nutrition or healthy canteen policy?
Yes (If Yes, go to Q 4)
No (If no, go to Q 7)
Not sure 3. What proportion of teachers do you think were aware of this policy in 2008?
All or almost all
Most
About half
Some
Very few or none
School doesn‟t have a written policy
4. What proportion of parents do you think were aware of this policy(ies)?
All or almost all
Most
About half
Some
Very few or none
School doesn‟t have a written policy

IYM Implementation Report 5 Evaluation 76
5. How good was the School‟s compliance with the school nutrition/ healthy canteen policy(ies) in 2008?
Very good
Good
OK
Poor
Very poor 6. How would you rate the level of support for healthy eating provided by parents at your school in 2008?
Very high
High
Moderate
Low
Very low 7. What proportion of teachers at your school acted as good role models by eating
healthy foods in the 2008 school year?
All or almost all
Most
About half
Some
Very few or none 8. Overall, how effective was your school at promoting healthy eating among students in the 2008 school year?
Very effective
Moderately effective
Not very effective
Not effective at all

IYM Implementation Report 5 Evaluation 77
Physical education, sports and physical activity
Questions 8, 9 and 10 relate to a written policy that promotes sport and other physical activity 9. Does your school have a written school sport or physical activity policy?
Yes (If Yes, go to q…..)
No (If no, go to q……)
Not sure 10. In 2008, what proportion of teachers do you think were aware of this policy?
All or almost all
Most
About half
Some
Very few or none
School doesn‟t have a written policy 11. What proportion of parents do you think were aware of this policy?
All or almost all
Most
About half
Some
Very few or none
School doesn‟t have a written policy 12. How good was the Schools‟ compliance with this policy in the 2008 school year?
Very good
Good
OK
Poor
Very poor
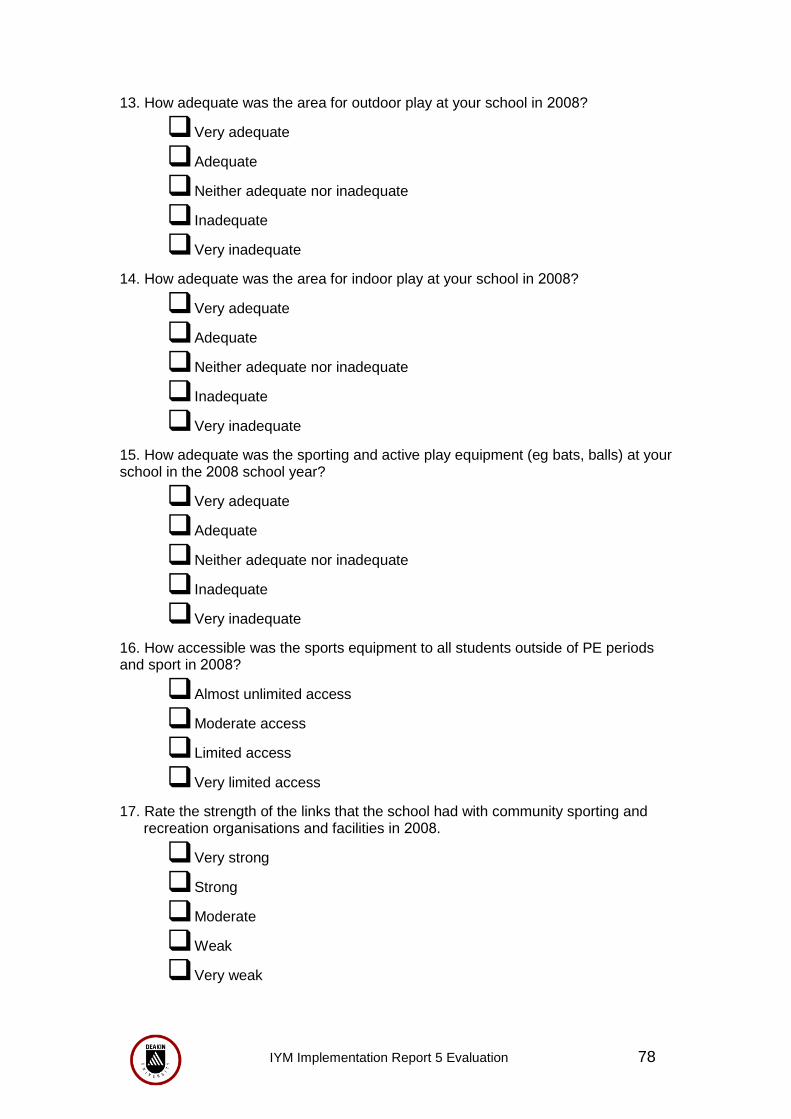
IYM Implementation Report 5 Evaluation 78
13. How adequate was the area for outdoor play at your school in 2008?
Very adequate
Adequate
Neither adequate nor inadequate
Inadequate
Very inadequate
14. How adequate was the area for indoor play at your school in 2008?
Very adequate
Adequate
Neither adequate nor inadequate
Inadequate
Very inadequate
15. How adequate was the sporting and active play equipment (eg bats, balls) at your school in the 2008 school year?
Very adequate
Adequate
Neither adequate nor inadequate
Inadequate
Very inadequate
16. How accessible was the sports equipment to all students outside of PE periods and sport in 2008?
Almost unlimited access
Moderate access
Limited access
Very limited access
17. Rate the strength of the links that the school had with community sporting and recreation organisations and facilities in 2008.
Very strong
Strong
Moderate
Weak
Very weak

IYM Implementation Report 5 Evaluation 79
18. What proportion of teachers at your school acted as good role models by being physically active in the 2008 school year?
All or almost all
Most
About half
Some
Very few
19. What proportion of parents at your school supported school-based physical activity programs in 2008 (i.e. by attendance at events, supervision, volunteering etc)?
All or almost all
Most
About half
Some
Very few or none
20. To what degree had your school implemented programs or strategies to reduce traffic congestion around the school by the end of the 2008 school year?
Strategies/Programs have been fully implemented
Strategies/Programs have been partly implemented
Strategies/Programs have not been implemented
Not applicable as traffic congestion was not a problem
21. How adequate was the cycle storage facilities at your school in 2008?
Very adequate
Adequate
Inadequate
Very inadequate
No students cycle to school

IYM Implementation Report 5 Evaluation 80
22. In the 2008 school year, how much did nutrition and physical activity classroom assignments encourage students to make changes at home?
Strongly encouraged
Somewhat encouraged
Slightly encouraged
Didn‟t encourage
23. In 2008, the school encouraged participation by ALL students in sports and other physical activities (e.g. not allow highly skilled students to dominate activities and games):
Strongly agree
Agree
Neither agree nor disagree
Disagree
Strongly disagree
24. Overall, in 2008, how effective was your school at promoting physical activity among students?
Very effective
Moderately effective
Not very effective
Not effective at all
Thank you for taking the time to complete this audit.

IYM Implementation Report 5 Evaluation 81
Appendix F: Community Readiness to Change Community Readiness questions for interviews to key stakeholders - adolescents
Introduction 1. What part of the xxx (insert community name) community can you report on? 2. Community knowledge about obesity 3. In general, what does your community know about obesity? 4. Is obesity in youth a concern in your community? 5. Is underweight in youth a concern in your community? 6. Is overweight or underweight a bigger problem in your community? 7. What type of information about obesity is available for your community? 8. What local data are available on obesity for your community? [if No data, skip to Q 9] 9. How do people from your community obtain this information? Community efforts (programs, activities, policies, etc)
10. What efforts are present in your community to promote physical activity and/or
healthy eating, which were intended to address overweight or obesity? Please explain. [If no programs/activities or policies: skip to Q 16 and omit Q 19, 20]
11. How long have these efforts been going on in your community? 12. What works well out of these prevention efforts? 13. What could be improved of these prevention efforts? 14 Whom do these programs serve? (Prompt: For example, populations by ethnicity, religion, sex.) 15 Do these prevention efforts exclude or leave out some groups in the community? 16. Is there a need to expand these effort/services? If not, why not? 17. Is there any planning for new efforts/services going on in your community regarding promotion of physical activity and/or healthy eating? If yes, please explain 18. Are you aware of any efforts being made to evaluate the efforts or policies that are in place? 19. Are the evaluation results being used to make changes in programs, activities, or policies or to start new ones? Community knowledge of efforts 20. What does the community know about the efforts you described above? 21. How could the communities‟ knowledge about these efforts be improved? 22. What does the community know about future plans to promote physical activity and/or healthy eating? 23. How does the community view these programs, policies and practices?

IYM Implementation Report 5 Evaluation 82
Leadership 24. What “leaders” in your community are involved in efforts regarding promotion of physical activity and/or healthy eating? Please list. 25. Can you identify any potential leaders? (Please list) 26. How are these leaders involved? If involved in a committee, task force, etc., how often do they meet? 27. Would the leaders support changing or improving current prevention efforts? Please explain. 28. Do other leaders in your community also see obesity in youth as a problem? Please explain. Community attitude 29. Are there circumstances in which members of your community might think that overweight/obesity is not a concern? Please explain.
30. Does the community support the efforts to promote physical activity and/or healthy eating in youth? If so, how?
31. What are the obstacles to promotion of physical activity and/or healthy eating in your community?
32. Does the community see physical activity and healthy eating as the answer to prevent obesity?
33. Based on the answers that you have provided so far, what do you think the attitude of community members is about overweight or obesity? Resources for prevention efforts 34. A person who was concerned about adolescents gaining too much weight – where would he turn to for help in your community? 35. Who provides resources or services dealing with promotion of physical activity and/or healthy eating? 36. What is the level of competence among those working on promotion of physical activity and/or healthy eating in your community? 37. Are organizations, schools, clubs or churches involved in promotion of physical activity and/or healthy eating in your community? Please list. 38. Do local businesses support promotion of physical activity and/or healthy 39. Are you aware of any proposals or grants for funding that promote physical activity and/or healthy eating in your community? If yes, which?

IYM Implementation Report 5 Evaluation 83
Scoring the Community Readiness Interviews – the anchored rating scale Dimension A. Community Knowledge about the Issue
1 Overweight/obesity in youth is not viewed as an issue/ there is no awareness of it. 2 Vague awareness of overweight/obesity in youth – but no link is made to the community. 3 A few individuals recognize overweight/obesity in youth as a problem locally but other
issues are seen as far more important 4 Some community members have recognized the issue as a problem and have begun a
discussion of developing efforts to obtain local data/information. 5 Information and local data on overweight/obesity in youth are available. 6 Information and local data about overweight/obesity in youth are available and
disseminated in an accessible format. 7 Efforts (programs/activities) to monitor the issue are in place. 8 Several different programs, activities and policies are in place, covering different age
groups and reaching a wide range of people to quantify the burden of the issue. New efforts are being developed to obtain up-to-date data.
9 Data and information about the issue are routinely collected and the results disseminated to make changes and improvements.
Dimension B. Existing Community Efforts
1 No awareness of the need for efforts to address overweight/obesity in youth. 2 No efforts promoting physical activity and/or healthy eating to address overweight/obesity in
youth. 3 A few individuals recognize the need to initiate some type of effort, but there is no immediate
motivation to do anything. 4 Some community members have met and have begun a discussion of developing community
efforts. 5 Some efforts (programs/activities) are being planned. 6 Some efforts (programs/activities) have been implemented. 7 Some efforts (programs/activities) have been running for several years. 8 Several different programs, activities and policies are in place, covering different age groups
are reaching a wide range of people. New efforts are being developed based on evaluation data.
9 Evaluation plans are routinely used to test effectiveness of many different efforts, and the results are being used to make changes and improvements.
Dimension C. Community Knowledge of the Efforts
1 Community has no knowledge of the need for efforts addressing overweight/obesity in youth
2 Community has no knowledge about efforts promoting physical activity and/or healthy eating in youth.
3 A few members of the community have heard about efforts, but the extent of their knowledge is limited.
4 Some members of the community know about local efforts. 5 Members of the community have basic knowledge about local efforts (e.g.,
purpose). 6 An increasing number of community members have knowledge of local efforts and
are trying to increase the knowledge of the general community about these efforts. 7 There is evidence that the community has specific knowledge of local efforts
including contact persons, training of staff, clients involved, etc. 8 There is considerable community knowledge about different community efforts, as
well as the level of program effectiveness. 9 Community has knowledge of program evaluation data on how well the different
local efforts are working and their benefits and limitations.

IYM Implementation Report 5 Evaluation 84
Dimension D Leadership (includes appointed leaders & influential community members)
Dimension E. Community Attitudes
1 The prevailing attitude is that overweight/obesity in youth is an accepted part of community life. “It‟s just the way things are.”
2 The prevailing attitude is “There‟s nothing we can do,” or “Only „those‟ people do that.”
3 Community climate is neutral, disinterested, or believes that overweight/obesity in youth does not affect the community as a whole.
4 The attitude in the community is now beginning to reflect interest in the issue. “We have to do something, but we don‟t know what to do.”
5 The attitude in the community is “overweight/obesity in youth is our problem” and they are beginning to reflect modest support for efforts
6 The attitude in the community is “overweight/obesity in youth is our responsibility” and is now beginning to reflect modest involvement in efforts
7 The majority of the community generally supports programs, activities, or policies to promote physical activity and/or healthy eating in youth. “We have taken responsibility.”
8 Some community members or groups may challenge specific programs, but the community in general is strongly supportive of the need for efforts. Participation level is high. “We need to keep up on this issue and make sure what we are doing is effective.”
9 All major segments of the community are highly supportive; community members are actively involved in evaluating and improving efforts and demand accountability.
1 Leadership has no recognition of overweight/obesity in youth. 2 Leadership believes that overweight/obesity in youth is not an issue in their community. 3 Leader(s) recognize(s) the need to do something regarding overweight/obesity in youth. 4 Leader(s) is/are trying to get something started. 5 Leaders are part of a committee or group that promote physical activity and/or healthy
eating in youth. 6 Leaders are active and supportive of the implementation of efforts. 7 Leaders are supportive of continuing basic efforts and are considering resources
available for self-sufficiency. 8 Leaders are supportive of expanding/improving efforts through active participation in the
expansion/improvement. 9 Leaders are continually reviewing evaluation results of the efforts and are modifying
support accordingly.

IYM Implementation Report 5 Evaluation 85
Dimension F. Resources Related to the Issue (people, money, time, space, etc.)
1 There is no awareness of the need for resources to deal with overweight/obesity in youth.
2 There are no resources available for promoting physical activity and/or healthy eating in youth.
3 The community is not sure what it would take, or where the resources would come from, to initiate efforts.
4 The community has individuals, organizations and/or space available that could be used as resources.
5 Some members of the community are looking into the available resources.
6 Resources have been obtained and/or allocated for promotion of physical activity and/or healthy eating.
7 A considerable part of support of on-going efforts is from local sources that are expected to provide continuous support. Community members and leaders are beginning to look at continuing efforts by accessing additional resources.
8 Diversified resources and funds are secured and efforts are expected to be permanent. There is additional support for further efforts.
9 There is continuous and secure support for programs and activities, evaluation is routinely expected and completed, and there are substantial resources for trying new efforts.
Interpretation of scoring results
Score Stage of Readiness
1 No Awareness 2 Denial/Resistance 3 Vague Awareness 4 Preplanning 5 Preparation 6 Initiation 7 Stabilization 8 Confirmation / Expansion 9 High Level of Community Ownership

IYM Implementation Report 5 Evaluation 86
Self-scoring of communities’ stage of readiness by the key stakeholder
Community STAGE
DESCRIPTION
1 No Awareness
Obesity is not generally recognized by the community or by its leaders as a problem (it may truly not be an issue).
2 Resistance
At least some community members recognize that obesity in youth is a problem, but there is little recognition that it might be a local problem.
3 Vague Awareness
Most feel that obesity in youth is a local problem, but there is no immediate motivation to do anything about it.
4
Preplanning
There is clear recognition that something must be done to prevent obesity, and there may even be a committee. However, efforts are not focused or detailed.
5 Preparation
Active leaders begin planning in earnest. The community offers modest support of prevention efforts.
6 Initiation
Enough information is available to justify efforts. Activities to promote physical activity and/or healthy eating are underway.
7 Stabilization
Activities are supported by administrators or community decision makers. Staff working in this area are trained and experienced.
8
Confirmation/ Expansion
Standard efforts on promoting physical activity and/or healthy eating are in place. Community members feel comfortable participating in activities, and they support expansions. Local data are regularly obtained.
9 High Level of
Community Ownership
Detailed and sophisticated knowledge exists about prevalence, causes, and consequences of obesity. Effective evaluation guides new directions for prevention efforts. These efforts are applied to other issues/other communities as a model.

IYM Implementation Report 5 Evaluation 87
Appendix G: Community Capacity Workbook (Facilitator)
COMMUNITY
CAPACITY BUILDING
It’s your move! Project
Geelong/bellarine

IYM Implementation Report 5 Evaluation 88
COMMUNITY CAPACITY BUILDING
Definitions Community
can be any existing or potential network of individuals, groups and organisations that share or have the potential to share common concerns, interests and goals1.
Community Capacity
the characteristics of communities that affect their ability to identify, mobilise and address social and public health problems
the cultivation and use of transferable knowledge, skills, systems and resources that affect community and individual level changes consistent with public health-related goals and objectives2
is a collection of characteristics and resources which, when combined, improve the ability of a community to recognise, evaluate and address key problems
Community Capacity Building
can be considered as the work that is done to develop the capacity of a network of groups and organisations
development work that strengthens the ability of community organisations and groups to build their structures, systems, people and skills so that they are better able to define and achieve their objectives and engage in consultation and planning, manage community projects and take part in partnerships and community enterprises
it includes aspects of training, organisational and personal development and resource building, organised in a planned and self-conscious manner, reflecting the principles of empowerment and equity

IYM Implementation Report 5 Evaluation 89
Why CCB?
In the health field, CCB is the foundation for processes aimed
at maintaining and promoting wellbeing. CCB is a multi-level,
multi-organisational approach providing access to resources
that would not otherwise be identified or used.
In essence, capacity is the ability to utilise and develop
existing resources within a district. It requires an ongoing level
of commitment and investment to ensure these resources are
enhanced rather than depleted.
A capacity approach advocates the use of locally based skills,
combined with the resources of a range of organisations and
government to ensure the provision of services and programs
that are broadly based and appropriately matched to the
district.
The identification and utilisation of resources from an array of
settings works to minimise duplication and maximise diversity.
A capacity approach aims to increase levels of sustainability in
both implementation and health outcomes by extending the
health development resource base.
Organisations and groups at a number of levels provide
resources that can be used to maintain and support the
community’s health.
The use of these resources is important for the development
and implementation of health-based interventions.
There is an emphasis on supporting and creating health by
utilising the capacity of the community and its structures and
organisations, wherever possible, rather than creating new
structures and organisations.

IYM Implementation Report 5 Evaluation 90
Why are people interested?
There are many important reasons for concentrating efforts on CCB… Participation and inclusion
CCB seeks to engage all groups, including the marginalised, in decision-making, recognising that greater participation can lead to better solutions and outcomes
Holistic
CCB approaches take into account the interdependence that exists between groups within communities and, more broadly, between communities and the wider regional, national and global contexts
Diversity
CCB acknowledges and works with diversity within communities through the identification and utilisation of resources from an array of settings.
Responsive
Capacity building recognises that change is an integral aspect of community life and emphasises the value of working in an evolving and adaptive manner
Sustainability
Building community capacity has sustainable qualities because the groups and organisations develop the abilities and resources to maintain community „owned‟ initiatives3. Much of the knowledge, skill and confidence accumulated through achievements by a network in one project are transferable to other initiatives.

IYM Implementation Report 5 Evaluation 91
Community Capacity Index
Aim
The aim of the Index is to gather evidence about the capacity of a
network and to map that evidence against a set of indicators. The
indicators are placed into four domains – network partnerships, knowledge
transfer, problem solving and infrastructure.
The Index
The Index is a practical tool designed to facilitate action. It is intended
to be used in a developmental manner, such that application of the Index
within a particular project or community will assist in the identification
and selection of future directions for successful achievement of specific
goals.
It is not designed as a numerical tool to rate or rank communities
according to their capacity.
It is not designed to be used to examine organisational capacity.
Use of The Index
Can be used for a variety of research and planning purposes including:
To establish baseline indicators of the capacity of a network to
introduce a program and later to determine improvements from
this baseline;
For strategic planning to identify the resources that a network
has to carry out a program;
To identify the capacity of an organisation to work with other
organisations and groups to implement a program;
To evaluate the capacity of a network to sustain the effects of a
program over time; and
For capacity building mapping and planning, that is, to identify what
capacities have been achieved from time to time and to plan
development of further capacities.

IYM Implementation Report 5 Evaluation 92
Structure of The Index
Domains of Capacity – the index examines capacity within 4 domains
namely Network Partnerships, Knowledge Transfer, Problem Solving and
Infrastructure.
Levels of Capacity – for each of the first 3 domains there are three
levels of capacity, for the final domain there are 4 levels of capacity.
The presence of particular activities and abilities indicates the level of
capacity achieved. As the activities and abilities of a network are
accumulated, so the level of capacity increases.
Note: a network may not have all of the elements of one level but may
display some of the elements of the next level.
Indicators of Capacity – within each of the levels, a series of indicators
are provided which highlight essential characteristics of capacity for
that component of the Index. The indicators represent elements of
capacity that are considered essential to functioning at that particular
level of capacity. These progress across the levels from relatively
straightforward indicators of capacity to indicators of more complex
network processes. There are four different grades of achievement
against each indicator: not at all/very limited; somewhat; substantial or
almost entirely/entirely. To achieve a grade of almost entirely/entirely,
there must be sufficient evidence to suggest that there is little room for
improvement on this indicator.
Aggregate Indicators – contain a summary indicator for each level of
capacity
The Community Capacity Index is also concerned with the sustainability
of networks and the structure of the Index assumes a progressive
association between network capacities and sustainability. As a network’s
actions become increasingly consistent with a greater number of
indicators at higher levels of capacity across the domains, greater
sustainability of the network exists.

IYM Implementation Report 5 Evaluation 93
Domains of Capacity The Index is constructed as a set of four domains which when combined capture the main features of a network‟s capacity to implement and sustain a health development program.
The four domains
Network Partnerships Problem Solving Knowledge Transfer Infrastructure
Network Partnerships Network partnerships are the relationships between groups and organisations within a community or network. This includes both the comprehensiveness and the quality of the relationships, ie are all of the significant groups and organisations involved and what is the nature of their involvement? The Index assumes that higher quality relationships between network partners are based on reciprocal relations of investment and exchange between members. The identification of mutual benefits of becoming network partners increases the sustainability of the network and helps to maximise the capacity to achieve health developments. Our definition…. Network: the people in key settings that are in a position to implement the IYM Project eg: SPOs, schools, i.e. the interim steering group DHS, Deakin, Schools, SPO‟s Network Partners = the relationship between these groups _____________________________________________________________ ______________________________________________________________

IYM Implementation Report 5 Evaluation 94
Knowledge Transfer Knowledge transfer is the development, exchange and use of information within and between the groups and organisations within a network or community. Usually knowledge development will incorporate both research based knowledge and locally based knowledge; knowledge exchange utilises the network partnerships; and knowledge use relies on a set of strategies that encourages the incorporation of new awareness and practices across the network and amongst the wider community who link to the network partners.
Our definition …… _________________________________________________________ _________________________________________________________ _________________________________________________________ _________________________________________________________
Problem Solving Problem solving is the ability of the groups and organisations within the network or community and of the network or community itself to use well recognised methods to identify and solve problems that arise in the development and implementation of an activity or program. Our definition….. Includes strategies of anticipation as well as actions; managing differences of opinion; flexibility Method: discussion, majority consensus, review and voting _____________________________________________________________ ______________________________________________________________

IYM Implementation Report 5 Evaluation 95
Infrastructure Infrastructure refers to the level of investment in a network by the groups and organisations that make up the network. This includes both tangible and non-tangible investments, such as investment in policy and protocol development, social capital, human capital and financial capital. Our definition… ______________________________________________________________ ______________________________________________________________ ______________________________________________________________ ______________________________________________________________ Other Definitions Resources: funding, personnel, skills, buildings and equipment ______________________________________________________________ ______________________________________________________________ Original Sponsoring group: DHS Central Office, Melbourne ______________________________________________________________

IYM Implementation Report 5 Evaluation 96
Sustainability
The Community Capacity Index is concerned with the sustainability of
networks and the structure of the Index assumes a progressive
association between network capacities and sustainability.
Sustainability in community capacity is different to the common
understanding of the term. It is common for the term ‘sustainability’ to
refer to lasting improvements in health status of individuals as a result of
an intervention or treatment. In public health terms, it may refer to the
evidence for a lasting reduction in a risk factor in the environment. In
both cases it is the lasting qualities of a specific health outcome that
sustainability refers to.
Rather than referring to the health outcome specifically, sustainability in
community capacity is concerned with the sustainable qualities of the
network itself.
A sustainable network has certain qualities that make it more likely to
maintain itself in a number of useful ways. Essentially these should ensure
a program can be implemented through local groups and organisations and
even re-implemented or changed over time as conditions change.
Flexibility as well as durability are important to the sustainable qualities
of community capacity. The capacity of an existing network must maintain
flexibility through forms of investment to ensure sustainability.
The sustainability of a network is achieved when:
The network is able to maintain a program over time or reintroduce
a program using already established partnerships and problem
solving abilities and processes (Durability)
The network had enough investment in financial, human and social
capital to continue a program using its own resources (Investment,
self-reliance)
The network has the flexibility to change a program, if necessary,
to whatever is needed to maintain it over time (Flexibility, open to
change)
Investments in groups and organisations increases the capacity of
the network to undertake other programs using already established
partnerships, knowledge transfer and problem solving processes
(Generalisation of capacity)

IYM Implementation Report 5 Evaluation 97
These qualities of sustainability are built into the Index in two ways:
First, as the user of the Index progresses down the list of indicators
within each domain, the capacity indicators begin to include elements of
sustainability described above. One of the ways this is achieved is by
setting indicators that not only relate to the internal activities of a single
organisation or group but also relate to that organisation’s or group’s
concern about other partners in the network.
Second, the Infrastructure Domain is constructed to consider
sustainability. This domain specifically provides indicators of the level of
investment in the network by organisations and groups. The
infrastructure domain is divided into four sub-domains. Each sub-domain
contains indicators of investment by an organisation or group in the
network and is therefore most significant to the sustainability of the
network overall.
The four sub-domains of infrastructure are:
Policy Investments
Refer to that collection of activities that achieves agreement
about direction the network will take to achieve outcomes
Financial Investments
Concern the funding of initiatives that maintain the network
Human/Intellectual Investments
Seek to ensure the level of knowledge, skill and competence is
maintained and developed by members of the network – often
through training opportunities
Social Investments
Concern the commitment to building trust and working relationships
between the network partners.
The term investment is used to emphasise that capacity building is a form
of investment in local community relations and structures that either
directly or indirectly serves to improve the ability of a community overall
to sustain its own health developments

IYM Implementation Report 5 Evaluation 98
STRUCTURE OF THE COMMUNITY CAPACITY INDEX
Domain 1
Network Partnerships
Domain 2
Knowledge Transfer
Domain 3
Problem Solving
Domain 4
Infrastructure
Levels of Capacity
Subdomains of Sustainability
First Level Capacity The network has capacity to identify the organisations and groups with resources to implement/sustain a program
First Level Capacity
The network has capacity to develop a program that meets local needs
First Level Capacity There is capacity within the network to work together to solve problems
Policy Investments
The network has capacity to develop program related policy
Second Level Capacity
The network has capacity to deliver a program
Second Level Capacity
The network has capacity to transfer knowledge in order to achieve the desired outcomes/implement a program within a network
Second Level Capacity There is the capacity to identify and overcome problems encountered in achieving the desired outcomes
Financial Investments The network has capacity to develop financial capital
Human/Intellectual Investments The network has capacity to develop human/intellectual capital
Third Level Capacity
There is a sustainable network established to maintain and resource a program
Third Level Capacity The network has capacity to integrate a program into the mainstream practices of the network partners
Third Level Capacity There is capacity to sustain flexible problem solving
Social Investments The network has capacity to develop social capital
Increasing Capacit
y
Increasing sustainability

IYM Implementation Report 5 Evaluation 99
References 1. Bush, R., Dower, J. & Mutch, A. (2002) Community Capacity Index Manual.
Centre for Primary Health Care, University of Queensland 2. Goodman, R., Speers, M., McLeroy, K., Fawcett, S., Keegler, M., Parker,
E., Smith, S., Sterling, T., Wallerstein, N. (1998) Identifying and defining the dimensions of community capacity to provide a basis for measurement. Health Education & Behaviour 25(3): 256-278
3. Rissel, C., Finnegan, J. & Bracht, N. (1995) Evaluating quality and
sustainability: Issues and Insights from the Minnesota Heart Health Program. Health Promotion International 10:199-207

IYM Implementation Report 5 Evaluation 100
COMMUNITY CAPACITY BUILDING Results Sheet
Network Partnerships First Level Capacity 1. There is a reservoir of potential leaders within the community who are available and
interested in the community. Not at all/ very limited Somewhat Substantial Almost entirely/ entirely
2. Members of the network can identify the outcomes the network desires to achieve
Not at all/ very limited Somewhat Substantial Almost entirely/ entirely
3. Members of the network can identify the resources needed to achieve the desired
outcomes/implement a program. Not at all/ very limited Somewhat Substantial Almost entirely/ entirely
4. Members of the network can identify the individuals, groups or organisations within
the network with resources necessary to achieve the desired outcomes/implement a program.
Not at all/ very limited Somewhat Substantial Almost entirely/ entirely
5. Members of the network can identify the other individuals or groups outside the
network with resources necessary to achieve the desired outcomes/implement a program.
Not at all/ very limited Somewhat Substantial Almost entirely/ entirely
Aggregate of First Level
The network has capacity to identify the organisations and groups with resources to implement/sustain a program.
Not at all/ very limited Somewhat Substantial Almost entirely/ entirely
Network Partnerships Examples / Evidence - First Level Capacity

IYM Implementation Report 5 Evaluation 101
Network Partnerships Second Level Capacity 6. There are community members who are already taking on a visible leadership role in
community activities.
Not at all/ very limited Somewhat Substantial Almost entirely/ entirely
7. Members of the network can state the benefits for themselves of their own
involvement in the network.
Not at all/ very limited Somewhat Substantial Almost entirely/ entirely
8. Members of the network can describe the benefits other members will gain from involvement in the network.
Not at all/ very limited Somewhat Substantial Almost entirely/ entirely
9. Members of the network have formalised arrangements within their own
group/organisation to implement/sustain a program.
Not at all/ very limited Somewhat Substantial Almost entirely/ entirely
10. There is tangible evidence that resources have been allocated to a program by
network members.
Not at all/ very limited Somewhat Substantial Almost entirely/ entirely
Aggregate of Second Level The network has the capacity to deliver a program.
Not at all/ very limited Somewhat Substantial Almost entirely/ entirely
Network Partnerships Examples / Evidence - Second Level Capacity

IYM Implementation Report 5 Evaluation 102
Third Level Capacity 11. Existing community leaders have experience, knowledge and skills in capacity
building efforts.
Not at all/ very limited Somewhat Substantial Almost entirely/ entirely
12. There is tangible evidence of investment in a program by groups and organisations
beyond the original sponsoring group.
Not at all/ very limited Somewhat Substantial Almost entirely/ entirely
13. There is tangible evidence that a program is now „owned‟ by the participants of the
network.
Not at all/ very limited Somewhat Substantial Almost entirely/ entirely
14. There is tangible evidence that a program is being maintained by the network using
its own resources.
Not at all/ very limited Somewhat Substantial Almost entirely/ entirely
Aggregate of third level There is a sustainable network established to maintain and resource a program.
Not at all/ very limited Somewhat Substantial Almost entirely/ entirely
Network Partnerships Examples / Evidence - Third Level Capacity

IYM Implementation Report 5 Evaluation 103
Knowledge Transfer First Level Capacity 1. Members of the network have identified what resources will be transferred to others
within the network.
Not at all/ very limited Somewhat Substantial Almost entirely/ entirely
2 Members of the network have identified what resources from outside the network will
be transferred to them.
Not at all/ very limited Somewhat Substantial Almost entirely/ entirely
3. Members of the network have reviewed and changed the activities/programs/initiative
so that it meets local needs (ie target group needs).
Not at all/ very limited Somewhat Substantial Almost entirely/ entirely
4. Members of the network have reviewed and modified the activities/program/initiative
so that it meets the needs of the network.
Not at all/ very limited Somewhat Substantial Almost entirely/ entirely
Aggregate of first level The network has the capacity to develop a program that meets local needs.
Not at all/ very limited Somewhat Substantial Almost entirely/ entirely
Knowledge Transfer Examples / Evidence - First Level Capacity

IYM Implementation Report 5 Evaluation 104
Second Level Capacity 5. Members of the network have implemented some knowledge transfer activities.
Not at all/ very limited Somewhat Substantial Almost entirely/ entirely
6. Members of the network have reviewed and changed the activities/program/initiative
so that it is evidence based/reflects current good practices.
Not at all/ very limited Somewhat Substantial Almost entirely/ entirely
7. Members of the network have made structural arrangements to support knowledge
transfer.
Not at all/ very limited Somewhat Substantial Almost entirely/ entirely
Aggregate of second level The network has the capacity to transfer knowledge in order to achieve the desired
outcomes/implement a program within a network.
Not at all/ very limited Somewhat Substantial Almost entirely/ entirely
Knowledge Transfer Examples / Evidence - Second Level Capacity

IYM Implementation Report 5 Evaluation 105
Third Level capacity 8. Members of the network have in place mechanisms to obtain feedback about
progress towards achieving the desired outcomes/implementing a program.
Not at all/ very limited Somewhat Substantial Almost entirely/ entirely
9. Members of the network have incorporated a program into the mainstream activities
of each organisation and group in the network.
Not at all/ very limited Somewhat Substantial Almost entirely/ entirely
Aggregate of third level
The network has the capacity to integrate a program into the mainstream practices of the network partners.
Not at all/ very limited Somewhat Substantial Almost entirely/ entirely
Knowledge Transfer Examples / Evidence - Third Level Capacity
.

IYM Implementation Report 5 Evaluation 106
Problem Solving First Level Capacity 1. Members of the network have identified the key players within the network to problem
solve difficulties encountered in achieving the desired outcomes.
Not at all/ very limited Somewhat Substantial Almost entirely/ entirely
2. Members of the network have identified the key players outside the network to
problem solve difficulties encountered in achieving the desired outcomes.
Not at all/ very limited Somewhat Substantial Almost entirely/ entirely
3. There is evidence that members of the network recognise the strengths of key
players within the network.
Not at all/ very limited Somewhat Substantial Almost entirely/ entirely
4. Members of the network can gain agreement to work together to solve problems.
Not at all/ very limited Somewhat Substantial Almost entirely/ entirely
Aggregate of first level
There is capacity within the network to work together to solve problems.
Not at all/ very limited Somewhat Substantial Almost entirely/ entirely
Problem Solving Examples / Evidence - First Level Capacity

IYM Implementation Report 5 Evaluation 107
Second Level Capacity 5. Members if the network can gain agreement to work with others outside the network
to solve problems.
Not at all/ very limited Somewhat Substantial Almost entirely/ entirely
6. There is evidence that members of the network recognise the strengths of those both
within and outside the network.
Not at all/ very limited Somewhat Substantial Almost entirely/ entirely
7. Members of the network have adopted a well-recognised problem solving process.
Not at all/ very limited Somewhat Substantial Almost entirely/ entirely
8. Members of the network have moved from identifying problems to implementing
activities designed to overcome problems within the network.
Not at all/ very limited Somewhat Substantial Almost entirely/ entirely
Aggregate of second level
There is the capacity to identify and overcome problems encountered in achieving the desired outcomes.
Not at all/ very limited Somewhat Substantial Almost entirely/ entirely
Problem Solving Examples / Evidence - Second Level Capacity

IYM Implementation Report 5 Evaluation 108
Third Level Capacity 9. There have been demonstrations of problem solving across the network partners.
Not at all/ very limited Somewhat Substantial Almost entirely/ entirely
10. There is evidence of flexibility in problem solving across the network.
Not at all/ very limited Somewhat Substantial Almost entirely/ entirely
Aggregate of third level There is capacity to sustain flexible problem solving
Not at all/ very limited Somewhat Substantial Almost entirely/ entirely
Problem Solving Examples / Evidence - Third Level Capacity
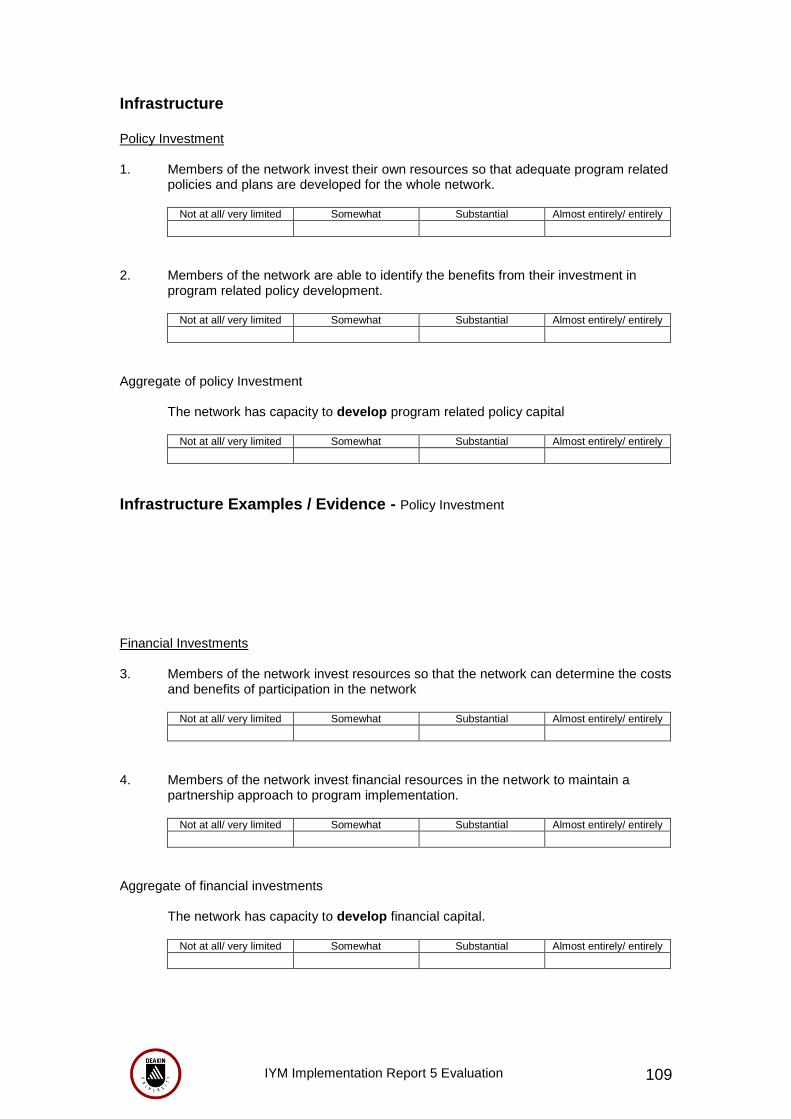
IYM Implementation Report 5 Evaluation 109
Infrastructure Policy Investment 1. Members of the network invest their own resources so that adequate program related
policies and plans are developed for the whole network.
Not at all/ very limited Somewhat Substantial Almost entirely/ entirely
2. Members of the network are able to identify the benefits from their investment in
program related policy development.
Not at all/ very limited Somewhat Substantial Almost entirely/ entirely
Aggregate of policy Investment The network has capacity to develop program related policy capital
Not at all/ very limited Somewhat Substantial Almost entirely/ entirely
Infrastructure Examples / Evidence - Policy Investment
Financial Investments 3. Members of the network invest resources so that the network can determine the costs
and benefits of participation in the network
Not at all/ very limited Somewhat Substantial Almost entirely/ entirely
4. Members of the network invest financial resources in the network to maintain a
partnership approach to program implementation.
Not at all/ very limited Somewhat Substantial Almost entirely/ entirely
Aggregate of financial investments The network has capacity to develop financial capital.
Not at all/ very limited Somewhat Substantial Almost entirely/ entirely

IYM Implementation Report 5 Evaluation 110
Infrastructure Examples / Evidence - Financial Investments
Human / Intellectual Investments 5. Members of the network invest in helping emerging leaders develop necessary
expertise and skills.
Not at all/ very limited Somewhat Substantial Almost entirely/ entirely
6. Members of the network invest in education and training of network members to
facilitate the achievement of network objectives.
Not at all/ very limited Somewhat Substantial Almost entirely/ entirely
7. Members of the network can identify returns on investment in education and training.
Not at all/ very limited Somewhat Substantial Almost entirely/ entirely
Aggregate of human/intellectual investment The network has capacity to develop human/intellectual capital
Not at all/ very limited Somewhat Substantial Almost entirely/ entirely
Infrastructure Examples / Evidence - Human / Intellectual Investments

IYM Implementation Report 5 Evaluation 111
Social Investments 8. Members of the network invest in developing and maintaining social relations
between the members of the network.
Not at all/ very limited Somewhat Substantial Almost entirely/ entirely
9. There is evidence of responsiveness to the concerns of other partners in the network.
Not at all/ very limited Somewhat Substantial Almost entirely/ entirely
Aggregate of social investment The network has the capacity to develop social capital.
Not at all/ very limited Somewhat Substantial Almost entirely/ entirely
Infrastructure Examples / Evidence - Social Investments
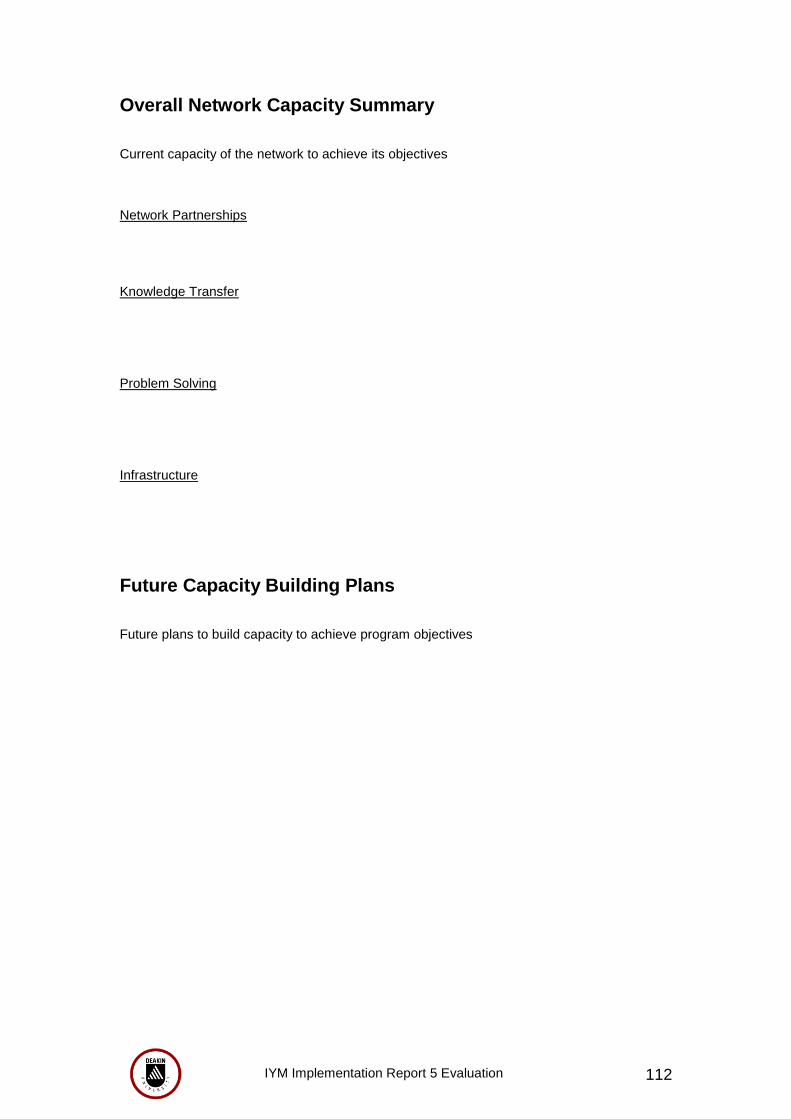
IYM Implementation Report 5 Evaluation 112
Overall Network Capacity Summary Current capacity of the network to achieve its objectives Network Partnerships Knowledge Transfer Problem Solving Infrastructure
Future Capacity Building Plans Future plans to build capacity to achieve program objectives

IYM Implementation Report 5 Evaluation 113
Appendix H: Capacity Building Index Microsoft Power Point Presentation

IYM Implementation Report 5 Evaluation 114

IYM Implementation Report 5 Evaluation 115
Appendix I: Student Ambassador Group Interview Questions
IYM Ambassadors at <School> Focus Group <date> @ <venue><time>
Did you enjoy your role as an Ambassador? What sort of things did you do? /What were you able to achieve? What opportunities arose for you because you were an Ambassador? What sorts of things did you learn?/ What skills did you learn? What were some of the challenges you faced over the year being an Ambassador? What were some of the highlights? What advice would you give to the new Ambassadors? Overall, what did it mean to you to be an It‟s Your Move Ambassador?
