dc current in nanosilica-based polyethylene...
TRANSCRIPT

DC Current in Nanosilica-based Polyethylene Nanocomposites
Yan Wang, Zhiqiang Xu, George Chen and Alun Vaughan The Tony Davies High Voltage Laboratory, University of Southampton
Southampton, United Kingdom [email protected]
Abstract – In the present paper, DC current of polyethylene nanocomposites containing different nanosilica loading ratios, either the untreated or the surface treated using the trimethoxy(propyl)silane coupling agent has been investigated. TGA was used to identify the true loading concentration in the samples and the nanofillers dispersion was studied using SEM. A range of electric field from 10 kV/mm to 50 kV/mm were applied It has been found that two dynamic processes are involved in the current observed over a period of 3 hours. The initial process was dominated by trap filling where a decreasing current versus time was observed. The second process was related to the transient space charge limited current in the unfilled sample but taken over by the effect of nanofillers that shows a continuous current increase versus time rather than peaking. The exact mechanism responsible for the increasing current is not known yet. The influence of surface treatment of the nanofillers on the current is significant, resulting in a lower current comparing with the untreated samples. A current dip has been observed for samples with lower loading concentration, supporting the deep trap concept.
Keywords—nanodielectrics; nanosilica; conductivity;
I. INTRODUCTION
For meeting the demand of requirements for future insulation materials, the research has been focused on finding a high performance and multifunction material by loading the nanometer-sized particles, which is currently termed as nanodielectrics or nanocomposites. During past 20 years, many experimental results have shown that some electrical properties of the nanocomposites such as discharge resistance and space charge suppression can be improved [1]. Despite this, the current achievement is still far away from the practical application because it is hard to find materials that can effectively operate under high voltage but at the same time offer excellent thermal and mechanical properties. The space charge reduction in nanodielectrics has frequently been reported but the related mechanisms are not fully understood. In addition, the measurement of the DC conductivity in nanodielectrics also does not obtain consistent results, which leads to difficulty in mechanism explanation [1, 2]. Nevertheless, connecting the result of space charge behavior associated with DC conductivity will be a very informative approach to further investigate the interaction between the nanoparticles and a host polymer [3, 4]. This is because the results of DC conductivity can directly embody the space charge accumulation and movement in nanodielectrics [4]. It has also been reported that after corona charged, the surface
potential decay of nanocomposites when in higher loading ratios is faster than the pure polymer [5].
In this paper, the current which can be used to compare the conductivity of different insulation materials is measured after applying constant electric fields from 10kV/mm to 50kV/mm at an interval of 10kV/mm. The current measurement is sensitive to the nanofillers loading ratio [4], possibly to the dispersion and the aggregation of nanofillers in the composites. However, the latter is difficult to attain and evaluate [6-8]. It is feasible that some of the nanofillers can be lost during the sample preparation, resulting in lower loading level. One way that can be used to obtain the useful information about real loading is to utilize the thermogravimetric analysis (TGA) [6, 9 - 10]. Furthermore, it has been widely reported that the electrical properties of nanocomposites is sensitive to the absorbed water [6-11]. The possible effect on DC conductivity of the nanocomposites has been discussed.
II. EXPERIMENTAL DETAILS REFERENCE
A. Specimen Preparation
The nanosilica powder was obtained from Sigma-Aldrich, and the range of its size is from 10nm to 20nm. Four weight percentages including 0.5wt%, 2wt%, 5wt% and 10wt% were applied in this investigation. The functionalization used was the trimethoxy(propyl)silane for each loading ratio via an anhydrous route [12]. The nanocomposites without surface treated referred as untreated while those after treatment referred as C3-treated. The host polymer utilized was blend 20% high-density polyethylene (HDPE) grade Rigidex HD5813A, obtained from BP Chemical with 80% low-density polyethylene (LDPE) grade LD100BW, obtained from ExxonMobil Chemicals. The control group without the addition of nanofillers is referred as unfilled. The required amount of nanofillers was dispersed in xylene with probe sonication by applying Hielsher UP200S probe sonicator for 1 hour. Each sample was dried by using a vacuum oven at 60 ℃ for at least 72 hours [4]. The required specimen thickness for conductivity test was ~120μm and this was achieved by utilizing a heated hydraulic large press at 150 ℃ . Once removed from the press, the specimen was placed into an oil bath going through isothermal crystallization at 115℃for 1 hour. After that, all samples were stored in a desiccator. The DC conductivity measurements were performed at 19±3℃and 45-65% RH.
515
2015 Annual Report Conference on Electrical Insulation and Dielectric Phenomena
978-1-4673-7498-9/15/$31.00 ©2015 IEEE
B. Specimen Characterisation
To observe the dispersion/distribution of nanofillers in polyethylene blends, SEM was carried out. The emphasis in the present study was placed on the influence of surface treatment on the nanofillers dispersion. The specimens from each type were etched before imaged using scanning electron microscopy (SEM), the etching procedure was performed based on a standard permanganic reagent [6, 7]. After etching processing, all sample was put on the aluminium stub and sputter-coated with gold. A Jeol JSM6500F high resolution FEG-SEM was used to measure all sample at 15kV.
Perkin Elmer Pryis 1 TGA system was employed and 5mg sample tested in the ambient environment. The heating rate is 20 ℃ /min from 100 ℃ to 670 ℃ . The conductivity measurements were carried on a Keithley 6487 picoammeter and the electrode with a diameter of 20 mm was applied. The sample for conductivity test was gold sputtered to achieve better electrical contact. A high voltage dc supply was used to provide the required electric field and the current flowing through the sample was recorded every 5 seconds for 3 hours. All the current measurements were carried out at room temperature.
III. RESULTS AND ANALYSIS
A. SEM images
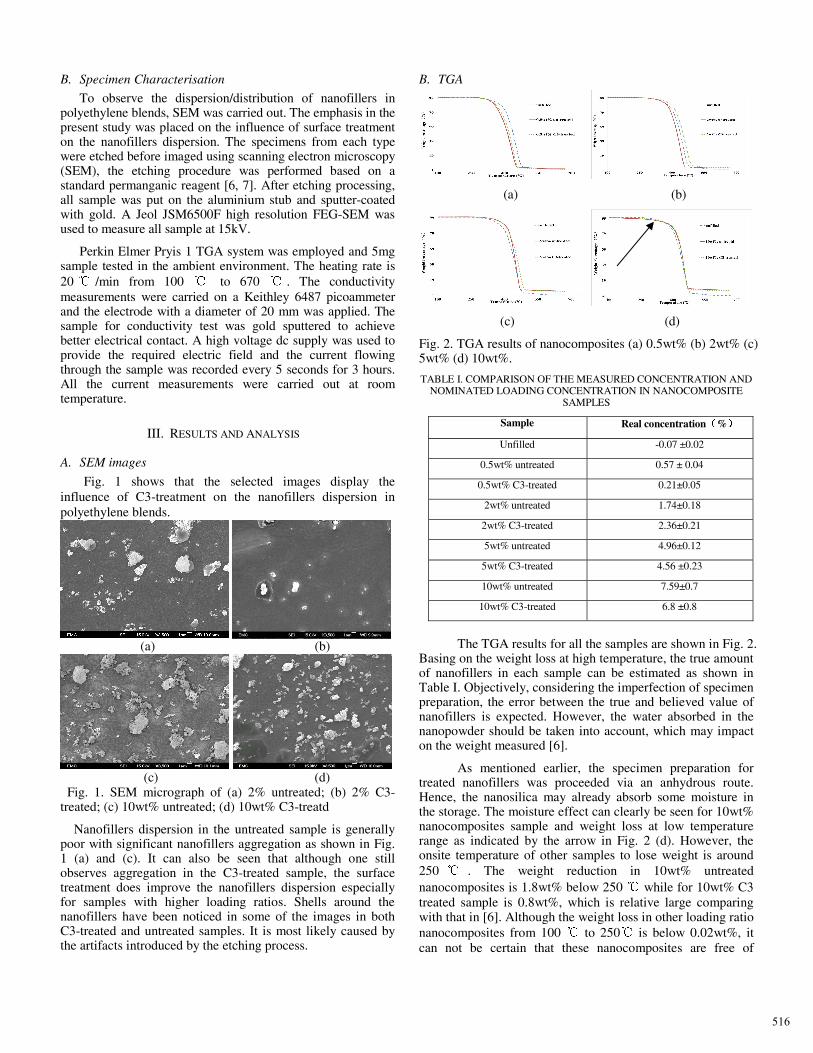
Fig. 1 shows that the selected images display the influence of C3-treatment on the nanofillers dispersion in polyethylene blends.
(a) (b)
(c) (d)
Fig. 1. SEM micrograph of (a) 2% untreated; (b) 2% C3-treated; (c) 10wt% untreated; (d) 10wt% C3-treatd
Nanofillers dispersion in the untreated sample is generally poor with significant nanofillers aggregation as shown in Fig. 1 (a) and (c). It can also be seen that although one still observes aggregation in the C3-treated sample, the surface treatment does improve the nanofillers dispersion especially for samples with higher loading ratios. Shells around the nanofillers have been noticed in some of the images in both C3-treated and untreated samples. It is most likely caused by the artifacts introduced by the etching process.
B. TGA
(a) (b)
(c) (d)
Fig. 2. TGA results of nanocomposites (a) 0.5wt% (b) 2wt% (c) 5wt% (d) 10wt%.
TABLE I. COMPARISON OF THE MEASURED CONCENTRATION AND NOMINATED LOADING CONCENTRATION IN NANOCOMPOSITE
SAMPLES
Sample Real concentration(%)
Unfilled -0.07 ±0.02
0.5wt% untreated 0.57 ± 0.04
0.5wt% C3-treated 0.21±0.05
2wt% untreated 1.74±0.18
2wt% C3-treated 2.36±0.21
5wt% untreated 4.96±0.12
5wt% C3-treated 4.56 ±0.23
10wt% untreated 7.59±0.7
10wt% C3-treated 6.8 ±0.8
The TGA results for all the samples are shown in Fig. 2.
Basing on the weight loss at high temperature, the true amount of nanofillers in each sample can be estimated as shown in Table I. Objectively, considering the imperfection of specimen preparation, the error between the true and believed value of nanofillers is expected. However, the water absorbed in the nanopowder should be taken into account, which may impact on the weight measured [6].
As mentioned earlier, the specimen preparation for treated nanofillers was proceeded via an anhydrous route. Hence, the nanosilica may already absorb some moisture in the storage. The moisture effect can clearly be seen for 10wt% nanocomposites sample and weight loss at low temperature range as indicated by the arrow in Fig. 2 (d). However, the onsite temperature of other samples to lose weight is around 250 ℃ . The weight reduction in 10wt% untreated nanocomposites is 1.8wt% below 250 ℃ while for 10wt% C3 treated sample is 0.8wt%, which is relative large comparing with that in [6]. Although the weight loss in other loading ratio nanocomposites from 100 ℃ to 250℃ is below 0.02wt%, it can not be certain that these nanocomposites are free of
516
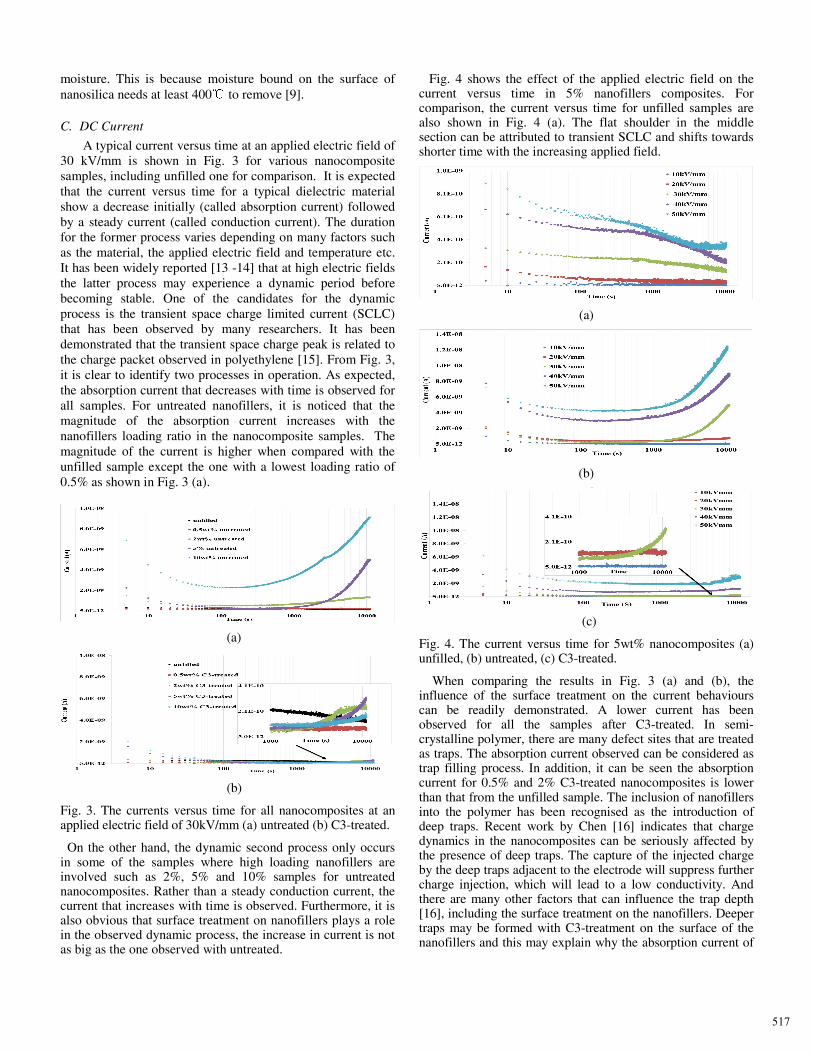
moisture. This is because moisture bound on the surface of nanosilica needs at least 400℃ to remove [9].
C. DC Current
A typical current versus time at an applied electric field of 30 kV/mm is shown in Fig. 3 for various nanocomposite samples, including unfilled one for comparison. It is expected that the current versus time for a typical dielectric material show a decrease initially (called absorption current) followed by a steady current (called conduction current). The duration for the former process varies depending on many factors such as the material, the applied electric field and temperature etc. It has been widely reported [13 -14] that at high electric fields the latter process may experience a dynamic period before becoming stable. One of the candidates for the dynamic process is the transient space charge limited current (SCLC) that has been observed by many researchers. It has been demonstrated that the transient space charge peak is related to the charge packet observed in polyethylene [15]. From Fig. 3, it is clear to identify two processes in operation. As expected, the absorption current that decreases with time is observed for all samples. For untreated nanofillers, it is noticed that the magnitude of the absorption current increases with the nanofillers loading ratio in the nanocomposite samples. The magnitude of the current is higher when compared with the unfilled sample except the one with a lowest loading ratio of 0.5% as shown in Fig. 3 (a).
(a)
(b)
Fig. 3. The currents versus time for all nanocomposites at an applied electric field of 30kV/mm (a) untreated (b) C3-treated.
On the other hand, the dynamic second process only occurs in some of the samples where high loading nanofillers are involved such as 2%, 5% and 10% samples for untreated nanocomposites. Rather than a steady conduction current, the current that increases with time is observed. Furthermore, it is also obvious that surface treatment on nanofillers plays a role in the observed dynamic process, the increase in current is not as big as the one observed with untreated.
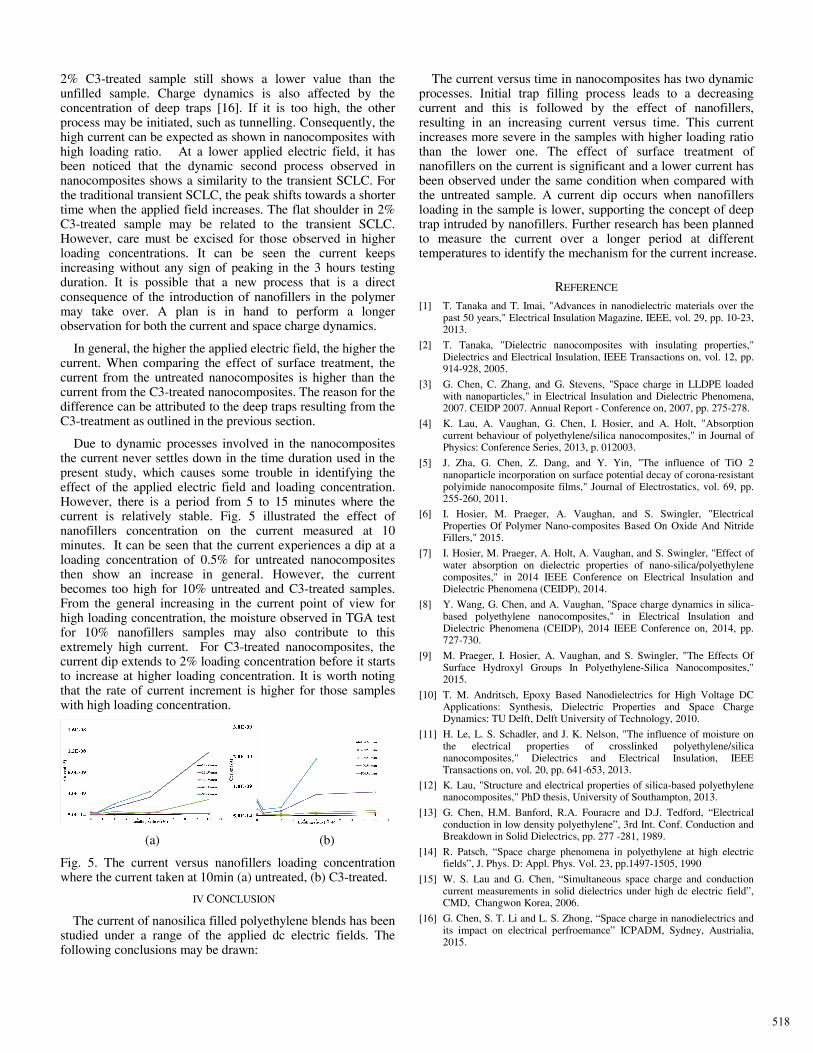
Fig. 4 shows the effect of the applied electric field on the current versus time in 5% nanofillers composites. For comparison, the current versus time for unfilled samples are also shown in Fig. 4 (a). The flat shoulder in the middle section can be attributed to transient SCLC and shifts towards shorter time with the increasing applied field.
(a)
(b)
(c)
Fig. 4. The current versus time for 5wt% nanocomposites (a) unfilled, (b) untreated, (c) C3-treated.
When comparing the results in Fig. 3 (a) and (b), the influence of the surface treatment on the current behaviours can be readily demonstrated. A lower current has been observed for all the samples after C3-treated. In semi-crystalline polymer, there are many defect sites that are treated as traps. The absorption current observed can be considered as trap filling process. In addition, it can be seen the absorption current for 0.5% and 2% C3-treated nanocomposites is lower than that from the unfilled sample. The inclusion of nanofillers into the polymer has been recognised as the introduction of deep traps. Recent work by Chen [16] indicates that charge dynamics in the nanocomposites can be seriously affected by the presence of deep traps. The capture of the injected charge by the deep traps adjacent to the electrode will suppress further charge injection, which will lead to a low conductivity. And there are many other factors that can influence the trap depth [16], including the surface treatment on the nanofillers. Deeper traps may be formed with C3-treatment on the surface of the nanofillers and this may explain why the absorption current of
517
2% C3-treated sample still shows a lower value than the unfilled sample. Charge dynamics is also affected by the concentration of deep traps [16]. If it is too high, the other process may be initiated, such as tunnelling. Consequently, the high current can be expected as shown in nanocomposites with high loading ratio. At a lower applied electric field, it has been noticed that the dynamic second process observed in nanocomposites shows a similarity to the transient SCLC. For the traditional transient SCLC, the peak shifts towards a shorter time when the applied field increases. The flat shoulder in 2% C3-treated sample may be related to the transient SCLC. However, care must be excised for those observed in higher loading concentrations. It can be seen the current keeps increasing without any sign of peaking in the 3 hours testing duration. It is possible that a new process that is a direct consequence of the introduction of nanofillers in the polymer may take over. A plan is in hand to perform a longer observation for both the current and space charge dynamics.
In general, the higher the applied electric field, the higher the current. When comparing the effect of surface treatment, the current from the untreated nanocomposites is higher than the current from the C3-treated nanocomposites. The reason for the difference can be attributed to the deep traps resulting from the C3-treatment as outlined in the previous section.
Due to dynamic processes involved in the nanocomposites the current never settles down in the time duration used in the present study, which causes some trouble in identifying the effect of the applied electric field and loading concentration. However, there is a period from 5 to 15 minutes where the current is relatively stable. Fig. 5 illustrated the effect of nanofillers concentration on the current measured at 10 minutes. It can be seen that the current experiences a dip at a loading concentration of 0.5% for untreated nanocomposites then show an increase in general. However, the current becomes too high for 10% untreated and C3-treated samples. From the general increasing in the current point of view for high loading concentration, the moisture observed in TGA test for 10% nanofillers samples may also contribute to this extremely high current. For C3-treated nanocomposites, the current dip extends to 2% loading concentration before it starts to increase at higher loading concentration. It is worth noting that the rate of current increment is higher for those samples with high loading concentration.
(a) (b)
Fig. 5. The current versus nanofillers loading concentration where the current taken at 10min (a) untreated, (b) C3-treated.
IV CONCLUSION
The current of nanosilica filled polyethylene blends has been studied under a range of the applied dc electric fields. The following conclusions may be drawn:
The current versus time in nanocomposites has two dynamic processes. Initial trap filling process leads to a decreasing current and this is followed by the effect of nanofillers, resulting in an increasing current versus time. This current increases more severe in the samples with higher loading ratio than the lower one. The effect of surface treatment of nanofillers on the current is significant and a lower current has been observed under the same condition when compared with the untreated sample. A current dip occurs when nanofillers loading in the sample is lower, supporting the concept of deep trap intruded by nanofillers. Further research has been planned to measure the current over a longer period at different temperatures to identify the mechanism for the current increase.
REFERENCE [1] T. Tanaka and T. Imai, "Advances in nanodielectric materials over the
past 50 years," Electrical Insulation Magazine, IEEE, vol. 29, pp. 10-23, 2013.
[2] T. Tanaka, "Dielectric nanocomposites with insulating properties," Dielectrics and Electrical Insulation, IEEE Transactions on, vol. 12, pp. 914-928, 2005.
[3] G. Chen, C. Zhang, and G. Stevens, "Space charge in LLDPE loaded with nanoparticles," in Electrical Insulation and Dielectric Phenomena, 2007. CEIDP 2007. Annual Report - Conference on, 2007, pp. 275-278.
[4] K. Lau, A. Vaughan, G. Chen, I. Hosier, and A. Holt, "Absorption current behaviour of polyethylene/silica nanocomposites," in Journal of Physics: Conference Series, 2013, p. 012003.
[5] J. Zha, G. Chen, Z. Dang, and Y. Yin, "The influence of TiO 2 nanoparticle incorporation on surface potential decay of corona-resistant polyimide nanocomposite films," Journal of Electrostatics, vol. 69, pp. 255-260, 2011.
[6] I. Hosier, M. Praeger, A. Vaughan, and S. Swingler, "Electrical Properties Of Polymer Nano-composites Based On Oxide And Nitride Fillers," 2015.
[7] I. Hosier, M. Praeger, A. Holt, A. Vaughan, and S. Swingler, "Effect of water absorption on dielectric properties of nano-silica/polyethylene composites," in 2014 IEEE Conference on Electrical Insulation and Dielectric Phenomena (CEIDP), 2014.
[8] Y. Wang, G. Chen, and A. Vaughan, "Space charge dynamics in silica-based polyethylene nanocomposites," in Electrical Insulation and Dielectric Phenomena (CEIDP), 2014 IEEE Conference on, 2014, pp. 727-730.
[9] M. Praeger, I. Hosier, A. Vaughan, and S. Swingler, "The Effects Of Surface Hydroxyl Groups In Polyethylene-Silica Nanocomposites," 2015.
[10] T. M. Andritsch, Epoxy Based Nanodielectrics for High Voltage DC Applications: Synthesis, Dielectric Properties and Space Charge Dynamics: TU Delft, Delft University of Technology, 2010.
[11] H. Le, L. S. Schadler, and J. K. Nelson, "The influence of moisture on the electrical properties of crosslinked polyethylene/silica nanocomposites," Dielectrics and Electrical Insulation, IEEE Transactions on, vol. 20, pp. 641-653, 2013.
[12] K. Lau, "Structure and electrical properties of silica-based polyethylene nanocomposites," PhD thesis, University of Southampton, 2013.
[13] G. Chen, H.M. Banford, R.A. Fouracre and D.J. Tedford, “Electrical conduction in low density polyethylene”, 3rd Int. Conf. Conduction and Breakdown in Solid Dielectrics, pp. 277 -281, 1989.
[14] R. Patsch, “Space charge phenomena in polyethylene at high electric fields”, J. Phys. D: Appl. Phys. Vol. 23, pp.1497-1505, 1990
[15] W. S. Lau and G. Chen, “Simultaneous space charge and conduction current measurements in solid dielectrics under high dc electric field”, CMD, Changwon Korea, 2006.
[16] G. Chen, S. T. Li and L. S. Zhong, “Space charge in nanodielectrics and its impact on electrical perfroemance” ICPADM, Sydney, Austrialia, 2015.
518