dbaccess esg conference - infineon technologies
TRANSCRIPT

Dr. Peter Wawer, Division President Industrial Power Control
dbAccess ESG Conferencevirtual, 1 March 2021
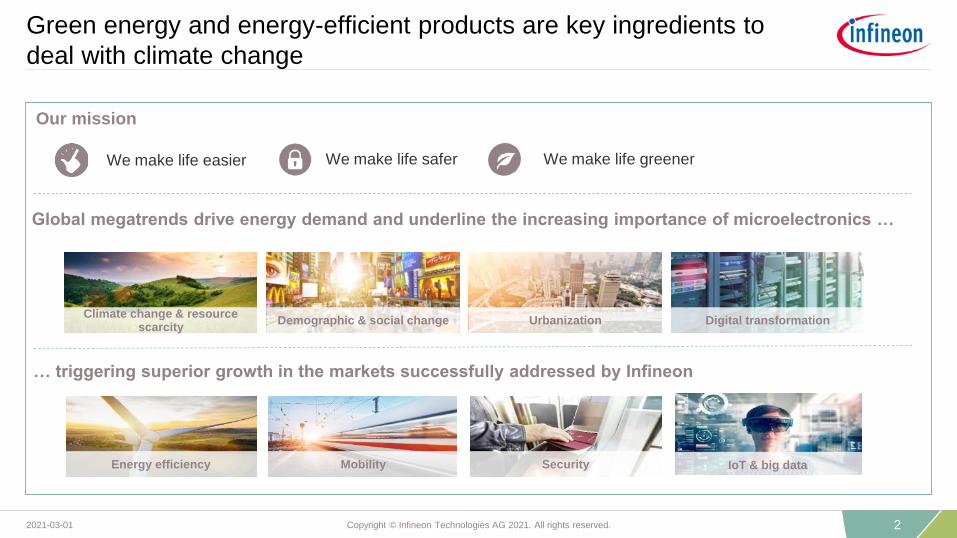
Green energy and energy-efficient products are key ingredients to
deal with climate change
We make life easier We make life safer We make life greener
Our mission
MobilityEnergy efficiency Security IoT & big data
… triggering superior growth in the markets successfully addressed by Infineon
Demographic & social changeClimate change & resource
scarcityUrbanization Digital transformation
Global megatrends drive energy demand and underline the increasing importance of microelectronics …
22021-03-01 Copyright © Infineon Technologies AG 2021. All rights reserved.
Our products and innovations together with an efficient production
are key elements to deal with climate change
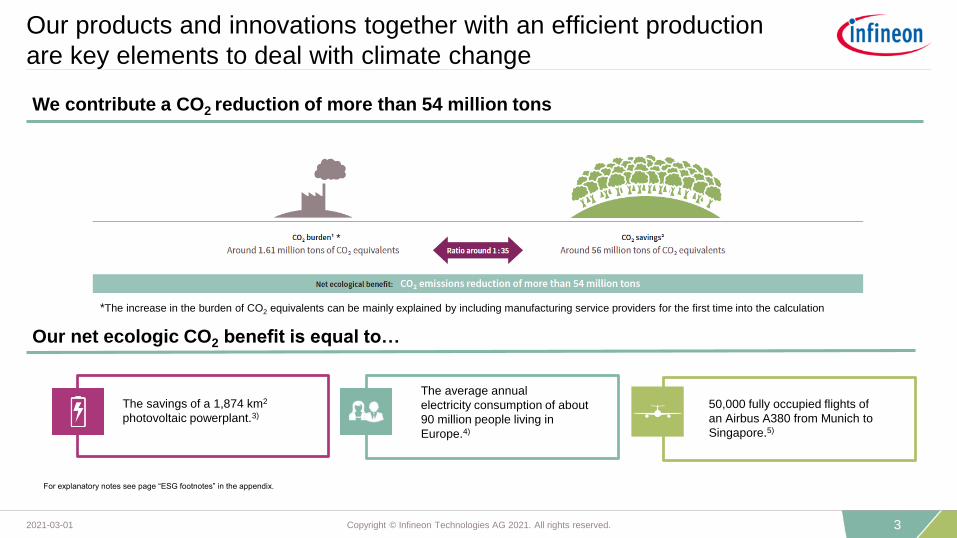
Our net ecologic CO2 benefit is equal to…
The savings of a 1,874 km2
photovoltaic powerplant.3)
The average annual
electricity consumption of about
90 million people living in
Europe.4)
50,000 fully occupied flights of
an Airbus A380 from Munich to
Singapore.5)
We contribute a CO2 reduction of more than 54 million tons
For explanatory notes see page “ESG footnotes” in the appendix.
*The increase in the burden of CO2 equivalents can be mainly explained by including manufacturing service providers for the first time into the calculation
*
32021-03-01 Copyright © Infineon Technologies AG 2021. All rights reserved.
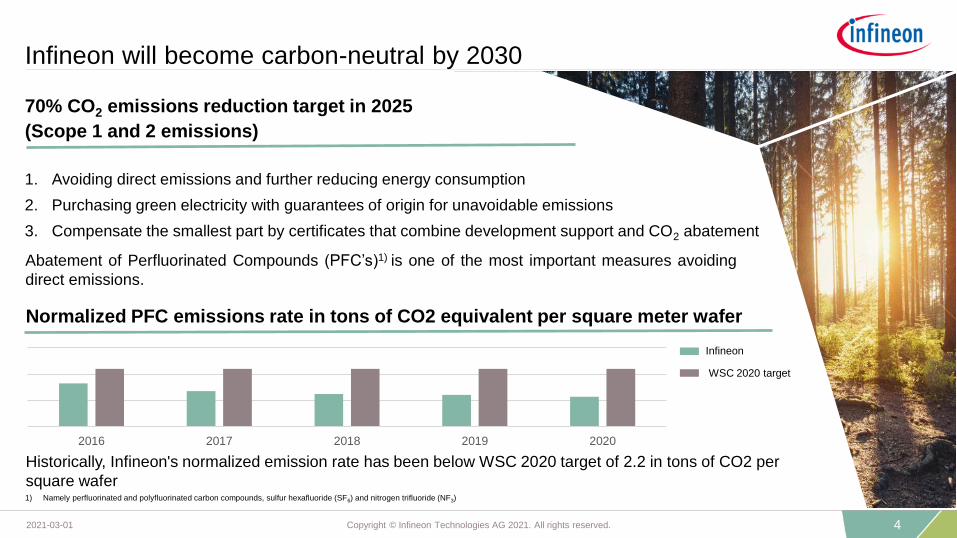
Infineon will become carbon-neutral by 2030
1. Avoiding direct emissions and further reducing energy consumption
2. Purchasing green electricity with guarantees of origin for unavoidable emissions
3. Compensate the smallest part by certificates that combine development support and CO2 abatement
1) Namely perfluorinated and polyfluorinated carbon compounds, sulfur hexafluoride (SF6) and nitrogen trifluoride (NF3)
70% CO2 emissions reduction target in 2025
(Scope 1 and 2 emissions)
Abatement of Perfluorinated Compounds (PFC’s)1) is one of the most important measures avoiding
direct emissions.
Normalized PFC emissions rate in tons of CO2 equivalent per square meter wafer
Infineon
WSC 2020 target
Historically, Infineon's normalized emission rate has been below WSC 2020 target of 2.2 in tons of CO2 per
square wafer
2016 2017 2018 2019 2020
42021-03-01 Copyright © Infineon Technologies AG 2021. All rights reserved.
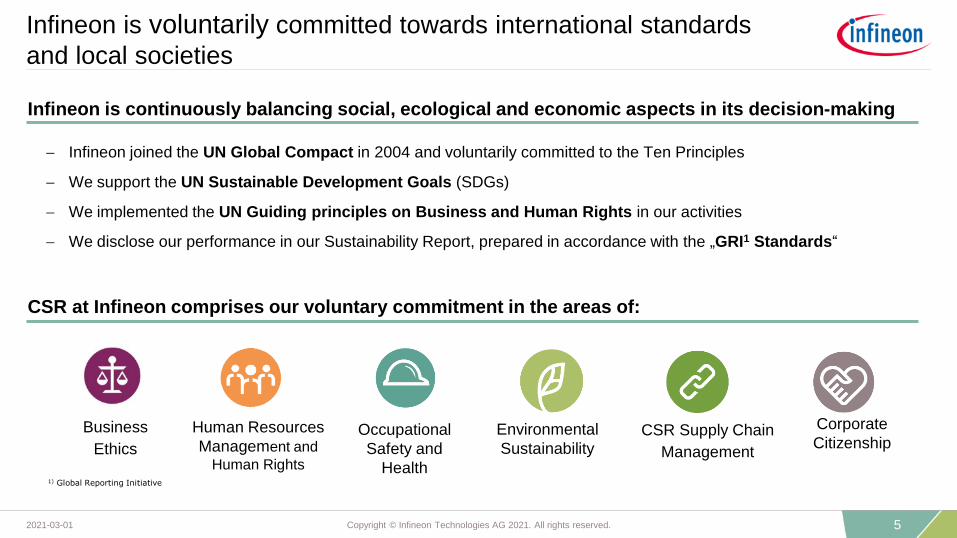
Infineon is voluntarily committed towards international standards
and local societies
Infineon is continuously balancing social, ecological and economic aspects in its decision-making
1) Global Reporting Initiative
Business
Ethics
Human Resources
Management and
Human Rights
Occupational
Safety and
Health
Environmental
SustainabilityCSR Supply Chain
Management
Corporate
Citizenship
CSR at Infineon comprises our voluntary commitment in the areas of:
− Infineon joined the UN Global Compact in 2004 and voluntarily committed to the Ten Principles
− We support the UN Sustainable Development Goals (SDGs)
− We implemented the UN Guiding principles on Business and Human Rights in our activities
− We disclose our performance in our Sustainability Report, prepared in accordance with the „GRI1 Standards“
52021-03-01 Copyright © Infineon Technologies AG 2021. All rights reserved.
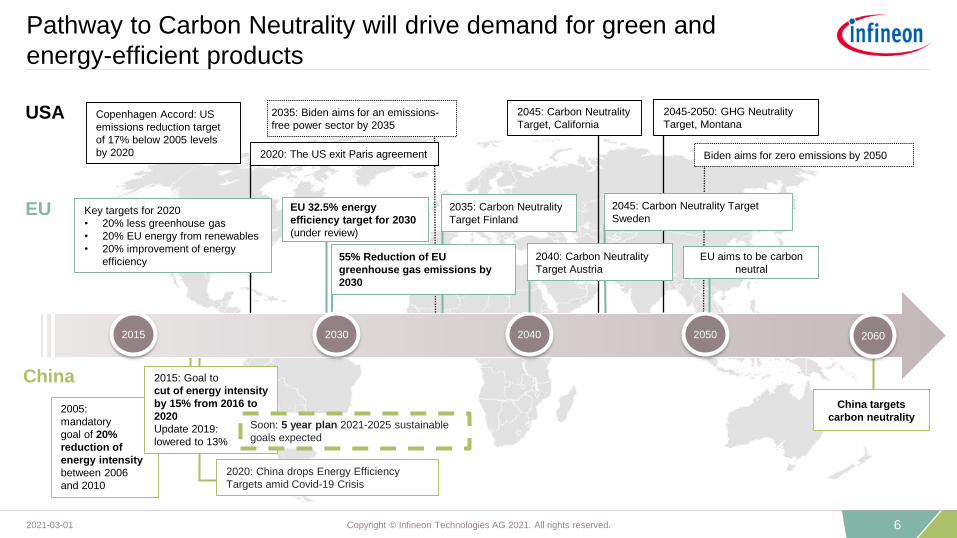
Pathway to Carbon Neutrality will drive demand for green and
energy-efficient products
2015 2040 2050 20602030
Copenhagen Accord: US
emissions reduction target
of 17% below 2005 levels
by 2020
2045: Carbon Neutrality
Target, California
2045-2050: GHG Neutrality
Target, Montana 2035: Biden aims for an emissions-
free power sector by 2035
2020: The US exit Paris agreement Biden aims for zero emissions by 2050
EU aims to be carbon
neutral
2045: Carbon Neutrality Target
Sweden2035: Carbon Neutrality
Target Finland
2040: Carbon Neutrality
Target Austria55% Reduction of EU
greenhouse gas emissions by
2030
EU 32.5% energy
efficiency target for 2030
(under review)
Key targets for 2020
• 20% less greenhouse gas
• 20% EU energy from renewables
• 20% improvement of energy
efficiency
China targets
carbon neutrality2005:
mandatory
goal of 20%
reduction of
energy intensity
between 2006
and 2010
2015: Goal to
cut of energy intensity
by 15% from 2016 to
2020
Update 2019:
lowered to 13%
2020: China drops Energy Efficiency
Targets amid Covid-19 Crisis
Soon: 5 year plan 2021-2025 sustainable
goals expected
USA
EU
China
62021-03-01 Copyright © Infineon Technologies AG 2021. All rights reserved.
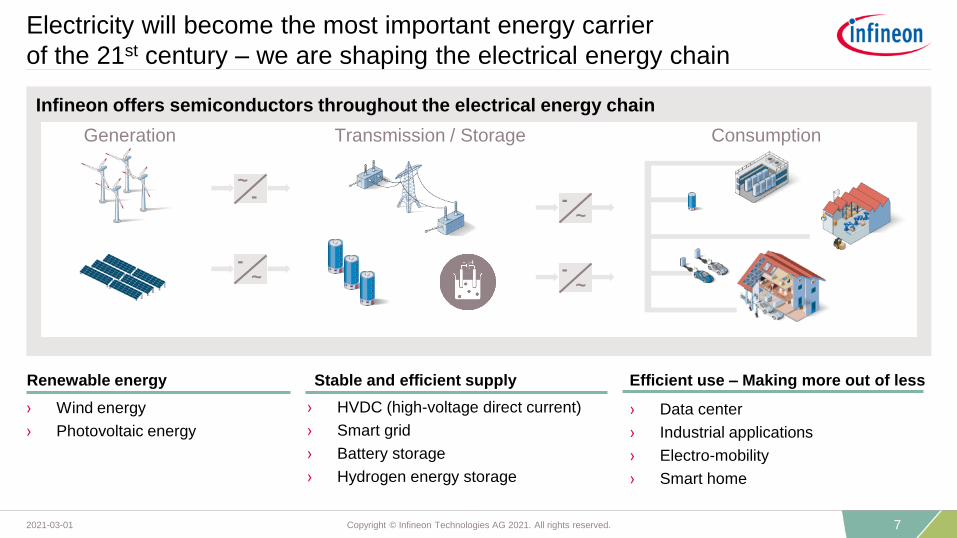
Electricity will become the most important energy carrier
of the 21st century – we are shaping the electrical energy chain
Infineon offers semiconductors throughout the electrical energy chain
~--
~
~-
~-
Generation Transmission / Storage Consumption
› Wind energy
› Photovoltaic energy
› HVDC (high-voltage direct current)
› Smart grid
› Battery storage
› Hydrogen energy storage
› Data center
› Industrial applications
› Electro-mobility
› Smart home
Renewable energy Stable and efficient supply Efficient use – Making more out of less
72021-03-01 Copyright © Infineon Technologies AG 2021. All rights reserved.
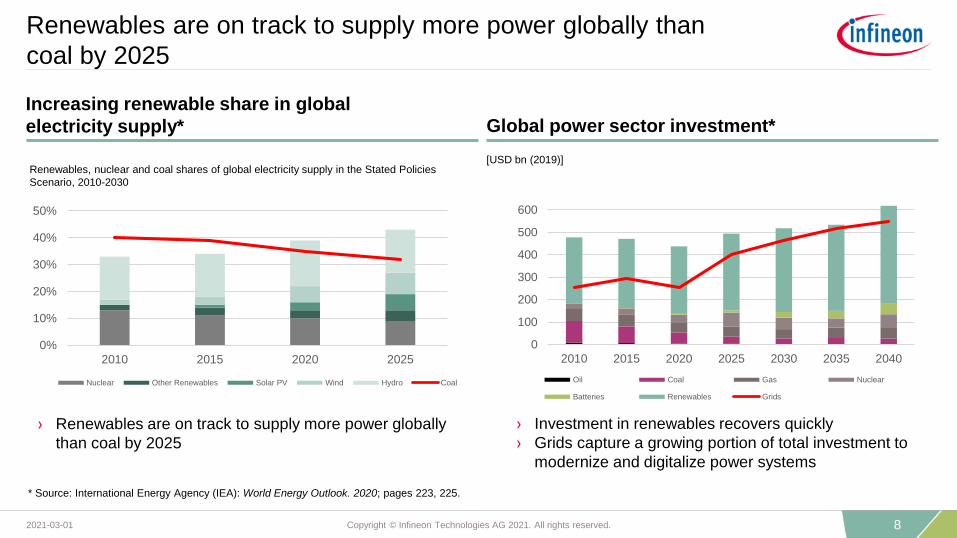
Renewables are on track to supply more power globally than
coal by 2025
* Source: International Energy Agency (IEA): World Energy Outlook. 2020; pages 223, 225.
Increasing renewable share in global
electricity supply*
82021-03-01 Copyright © Infineon Technologies AG 2021. All rights reserved.
Global power sector investment*
0%
10%
20%
30%
40%
50%
2010 2015 2020 2025
Nuclear Other Renewables Solar PV Wind Hydro Coal
0
100
200
300
400
500
600
2010 2015 2020 2025 2030 2035 2040
Oil Coal Gas Nuclear
Batteries Renewables Grids
› Investment in renewables recovers quickly
› Grids capture a growing portion of total investment to
modernize and digitalize power systems
› Renewables are on track to supply more power globally
than coal by 2025
[USD bn (2019)]Renewables, nuclear and coal shares of global electricity supply in the Stated Policies
Scenario, 2010-2030
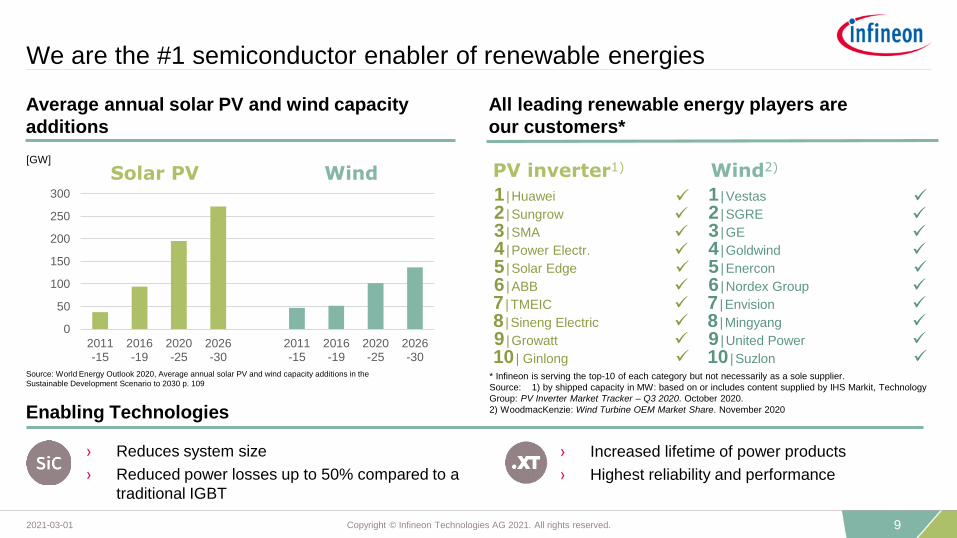
We are the #1 semiconductor enabler of renewable energies
Average annual solar PV and wind capacity
additions
All leading renewable energy players are
our customers*
Enabling Technologies
› Increased lifetime of power products
› Highest reliability and performance
› Reduces system size
› Reduced power losses up to 50% compared to a
traditional IGBT
PV inverter1) Wind2)
Source: World Energy Outlook 2020, Average annual solar PV and wind capacity additions in the
Sustainable Development Scenario to 2030 p. 109
0
50
100
150
200
250
300
2011-15
2016-19
2020-25
2026-30
2011-15
2016-19
2020-25
2026-30
Solar PV Wind
92021-03-01 Copyright © Infineon Technologies AG 2021. All rights reserved.
[GW]
8 |Sineng Electric 8 |Mingyang
7 | TMEIC 7 |Envision
9 |Growatt 9 |United Power
10 | Ginlong 10 |Suzlon
6 |ABB 6 |Nordex Group
3 |SMA 3 |GE
2 |Sungrow 2 |SGRE
1 |Huawei 1 |Vestas
5 |Solar Edge 5 |Enercon
4 |Power Electr. 4 |Goldwind
✓
✓
✓
✓
✓
✓
✓
✓
✓
✓
✓
✓
✓
✓
✓
✓
✓
✓
✓
✓
* Infineon is serving the top-10 of each category but not necessarily as a sole supplier.
Source: 1) by shipped capacity in MW: based on or includes content supplied by IHS Markit, Technology
Group: PV Inverter Market Tracker – Q3 2020. October 2020.
2) WoodmacKenzie: Wind Turbine OEM Market Share. November 2020
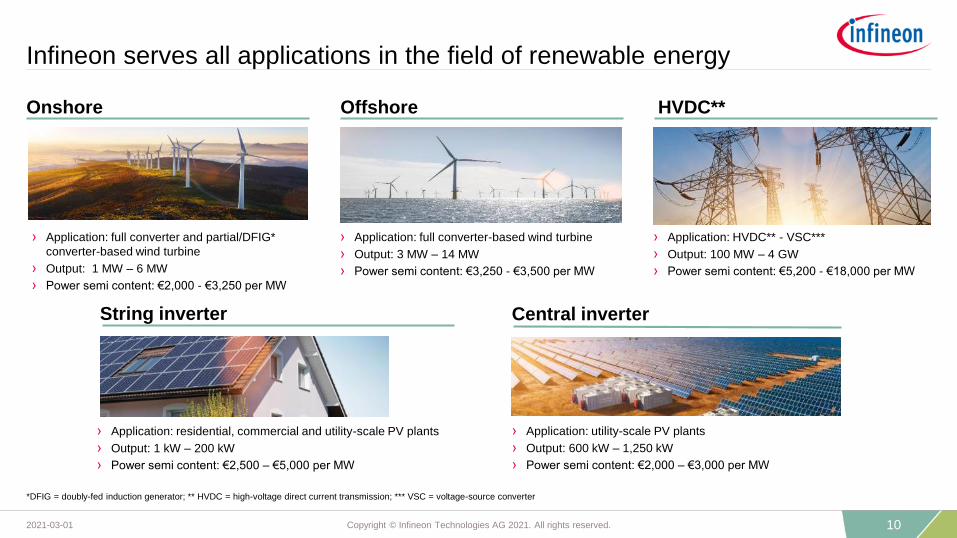
Infineon serves all applications in the field of renewable energy
Onshore Offshore HVDC**
String inverter Central inverter
› Application: full converter and partial/DFIG*
converter-based wind turbine
› Output: 1 MW – 6 MW
› Power semi content: €2,000 - €3,250 per MW
› Application: full converter-based wind turbine
› Output: 3 MW – 14 MW
› Power semi content: €3,250 - €3,500 per MW
› Application: HVDC** - VSC***
› Output: 100 MW – 4 GW
› Power semi content: €5,200 - €18,000 per MW
› Application: residential, commercial and utility-scale PV plants
› Output: 1 kW – 200 kW
› Power semi content: €2,500 – €5,000 per MW
› Application: utility-scale PV plants
› Output: 600 kW – 1,250 kW
› Power semi content: €2,000 – €3,000 per MW
*DFIG = doubly-fed induction generator; ** HVDC = high-voltage direct current transmission; *** VSC = voltage-source converter
102021-03-01 Copyright © Infineon Technologies AG 2021. All rights reserved.
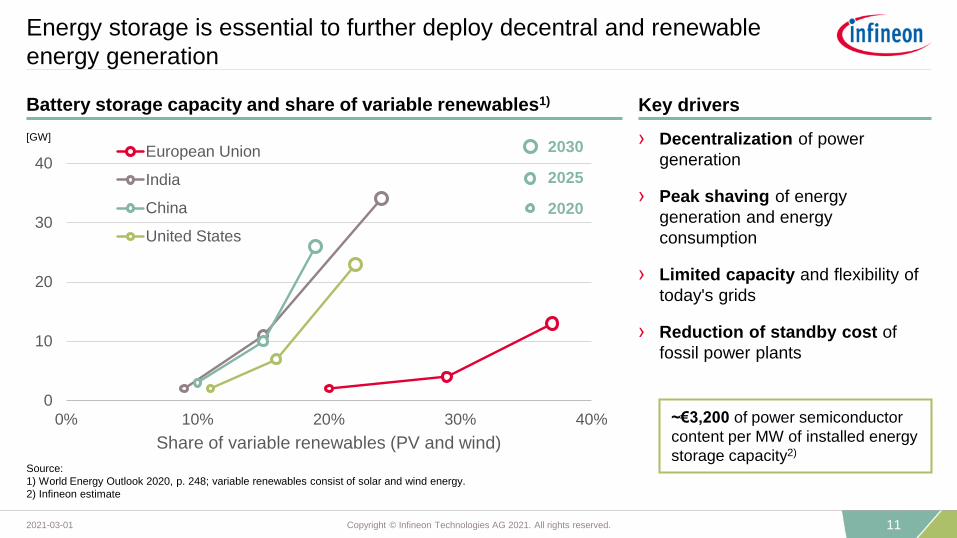
Energy storage is essential to further deploy decentral and renewable
energy generation
› Decentralization of power
generation
› Peak shaving of energy
generation and energy
consumption
› Limited capacity and flexibility of
today's grids
› Reduction of standby cost of
fossil power plants
~€3,200 of power semiconductor
content per MW of installed energy
storage capacity2)
0
10
20
30
40
0% 10% 20% 30% 40%
Share of variable renewables (PV and wind)
European Union
India
China
United States
2030
2025
2020
Source:
1) World Energy Outlook 2020, p. 248; variable renewables consist of solar and wind energy.
2) Infineon estimate
Battery storage capacity and share of variable renewables1) Key drivers
112021-03-01 Copyright © Infineon Technologies AG 2021. All rights reserved.
[GW]
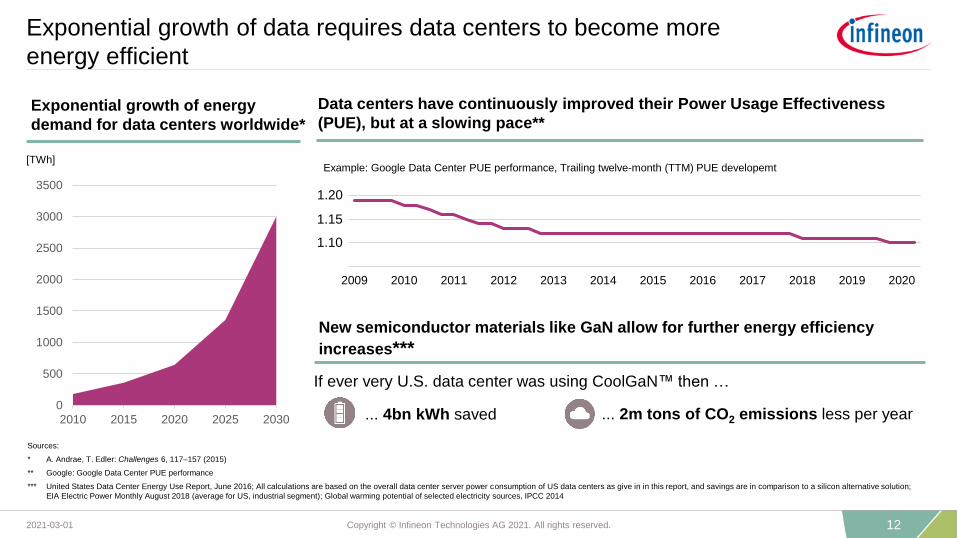
Exponential growth of data requires data centers to become more
energy efficient
Exponential growth of energy
demand for data centers worldwide*
Sources:
* A. Andrae, T. Edler: Challenges 6, 117–157 (2015)
** Google: Google Data Center PUE performance
*** United States Data Center Energy Use Report, June 2016; All calculations are based on the overall data center server power consumption of US data centers as give in in this report, and savings are in comparison to a silicon alternative solution;
EIA Electric Power Monthly August 2018 (average for US, industrial segment); Global warming potential of selected electricity sources, IPCC 2014
New semiconductor materials like GaN allow for further energy efficiency
increases***
If ever very U.S. data center was using CoolGaN™ then …
... 4bn kWh saved ... 2m tons of CO2 emissions less per year
122021-03-01 Copyright © Infineon Technologies AG 2021. All rights reserved.
Data centers have continuously improved their Power Usage Effectiveness
(PUE), but at a slowing pace**
Example: Google Data Center PUE performance, Trailing twelve-month (TTM) PUE developemt
2009 2010 2011 2012 2013 2014 2015 2016 2017 2018 2019 2020
1.20
1.15
1.10
0
500
1000
1500
2000
2500
3000
3500
2010 2015 2020 2025 2030
[TWh]
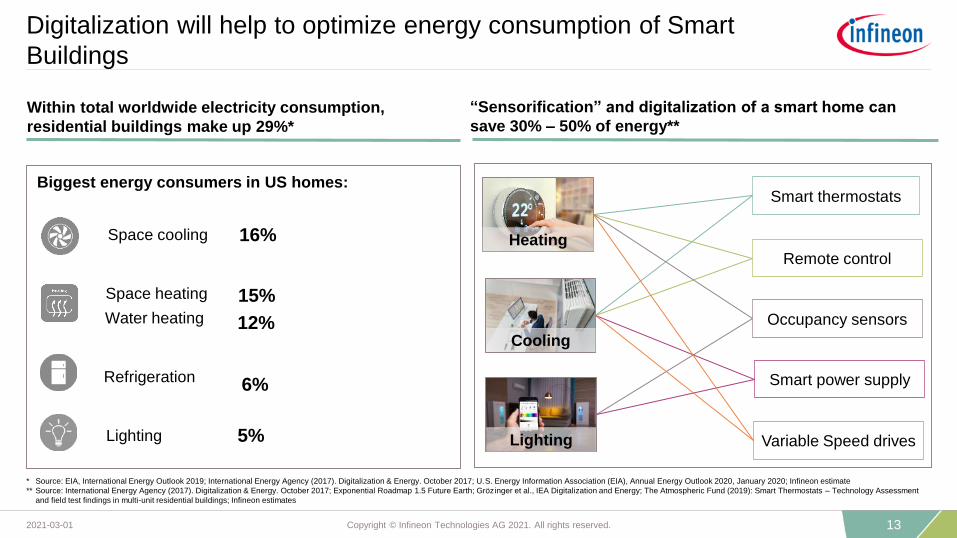
Digitalization will help to optimize energy consumption of Smart
Buildings
Within total worldwide electricity consumption,
residential buildings make up 29%*
“Sensorification” and digitalization of a smart home can
save 30% – 50% of energy**
Biggest energy consumers in US homes:
Space cooling
Refrigeration
Lighting
Space heating
Water heating
Smart thermostats
Remote control
Occupancy sensors
Smart power supply
Variable Speed drives
16%
15%
12%
6%
5%
132021-03-01 Copyright © Infineon Technologies AG 2021. All rights reserved.
* Source: EIA, International Energy Outlook 2019; International Energy Agency (2017). Digitalization & Energy. October 2017; U.S. Energy Information Association (EIA), Annual Energy Outlook 2020, January 2020; Infineon estimate
** Source: International Energy Agency (2017). Digitalization & Energy. October 2017; Exponential Roadmap 1.5 Future Earth; Grözinger et al., IEA Digitalization and Energy; The Atmospheric Fund (2019): Smart Thermostats – Technology Assessment
and field test findings in multi-unit residential buildings; Infineon estimates
Heating
Cooling
Lighting
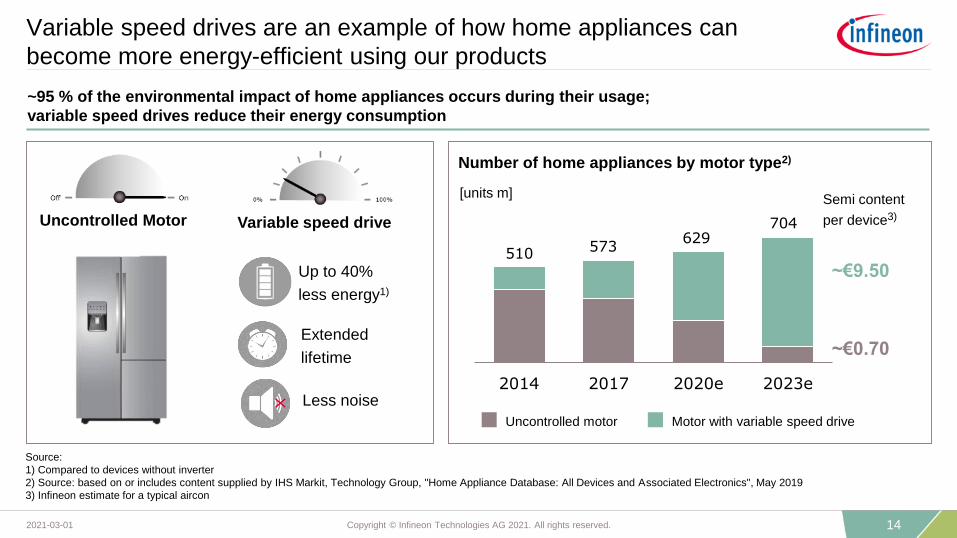
~95 % of the environmental impact of home appliances occurs during their usage;
variable speed drives reduce their energy consumption
Uncontrolled Motor Variable speed drive
Up to 40%
less energy1)
Extended
lifetime
Less noise2014 2017 2020e 2023e
510 573629
704
Uncontrolled motor Motor with variable speed drive
[units m]
Number of home appliances by motor type2)
Semi content
per device3)
~€9.50
~€0.70
Source:
1) Compared to devices without inverter
2) Source: based on or includes content supplied by IHS Markit, Technology Group, "Home Appliance Database: All Devices and Associated Electronics", May 2019
3) Infineon estimate for a typical aircon
Variable speed drives are an example of how home appliances can
become more energy-efficient using our products
142021-03-01 Copyright © Infineon Technologies AG 2021. All rights reserved.

The EV market is witnessing strong growth driven by more stringent
legal guidelines, demanding significant infrastructure investment
enacted targethistorical performance
-15% vs 2021
-37.5% vs 2021
US (2026):
108g/km
Japan
(2030):
73.5g/km
EU (2030):
59g/km
China (2025):
93.4g/km
CO
2e
mis
sio
n v
alu
es (
g/k
m; n
orm
aliz
ed t
o N
ED
C
Passenger car CO2 emission development and
regional regulations
Source: The International Council on Clean Transportation (ICCT): Passenger vehicle fuel economy. May 2020.
Infineon offers power semiconductor solutions for all
types of charging stations
Most common power ranges of DC charging systems
20 kW
(~$40 - $90 Si / SiC - based semi-content)*
150 kW
(~$300 - $900 Si / SiC - based semi-content)*
50 kW
(~$100 - $300 Si / SiC - based semi-content)*
350 kW
(~$1,500 - $3,000 Si / SiC - based semi-content)*
› Highest efficiency is key while charging for hours: less
cooling efforts; more compact designs
152021-03-01 Copyright © Infineon Technologies AG 2021. All rights reserved.
* Infineon estimates for a charging pole
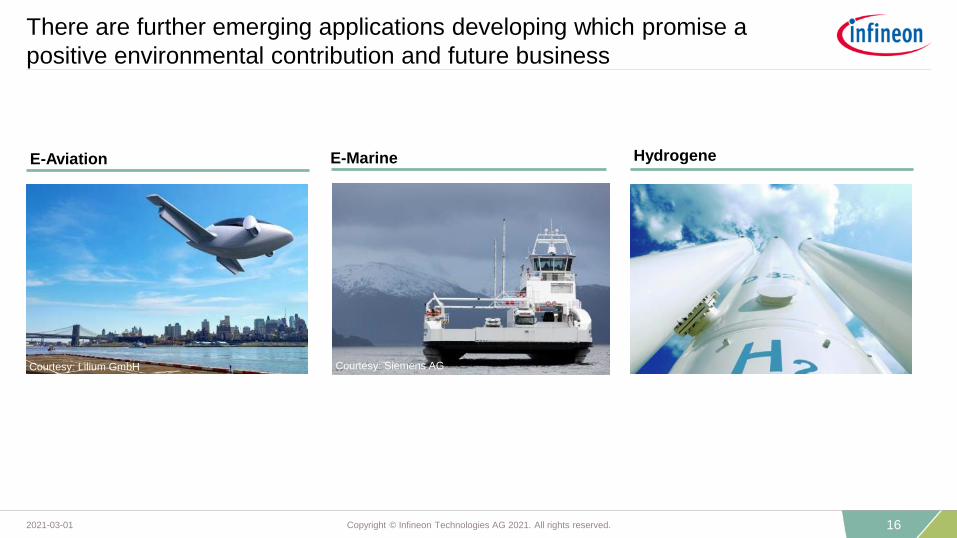
There are further emerging applications developing which promise a
positive environmental contribution and future business
E-Marine HydrogeneE-Aviation
Courtesy: Siemens AGCourtesy: Lilium GmbH
162021-03-01 Copyright © Infineon Technologies AG 2021. All rights reserved.
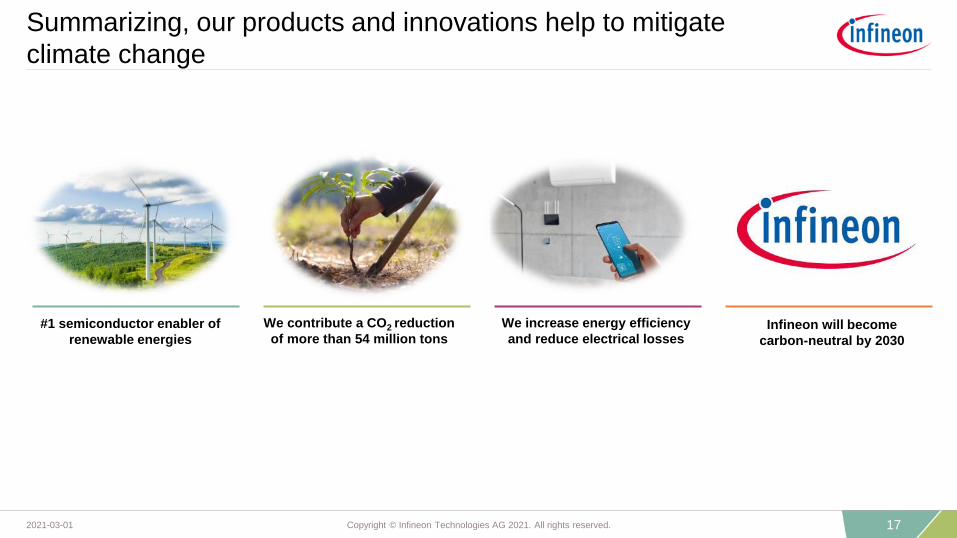
Summarizing, our products and innovations help to mitigate
climate change
172021-03-01 Copyright © Infineon Technologies AG 2021. All rights reserved.
#1 semiconductor enabler of
renewable energiesInfineon will become
carbon-neutral by 2030
We contribute a CO2 reduction
of more than 54 million tons
We increase energy efficiency
and reduce electrical losses
Disclaimer
Disclaimer
This presentation contains forward-looking statements about the business, financial condition and earnings performance of the Infineon Group.
These statements are based on assumptions and projections resting upon currently available information and present estimates. They are subject to a multitude of uncertainties and risks.
Actual business development may therefore differ materially from what has been expected.
Beyond disclosure requirements stipulated by law, Infineon does not undertake any obligation to update forward-looking statements.
Specific disclaimer for Omdia – part of Informa Tech – reports, data and information referenced in this document:
The Omdia reports, data and information referenced herein (the “Omdia Materials – mostly former IHS Markit Technology Materials") are the copyrighted property of Informa Tech Research
Ltd. and its subsidiaries or affiliates (together "Informa Tech") and represent data, research, opinions or viewpoints published by Informa Tech, and are not representations of fact. The Omdia
Materials speak as of the original publication date thereof and not as of the date of this document. The information and opinions expressed in the Omdia Materials are subject to change
without notice and neither Informa Tech nor, as a consequence, Infineon have any duty or responsibility to update the Omdia Materials or this publication as a result. Omdia Materials are
delivered on an "as-is" and "as-available" basis. No representation or warranty, express or implied, is made as to the fairness, accuracy, completeness or correctness of the information,
opinions and conclusions contained in the Omdia Materials. To the maximum extent permitted by law, Informa Tech and its affiliates, IHS Markit and its Affiliates and their respective, officers,
directors, employees and agents, disclaim any liability (including, without limitation, any liability arising from fault or negligence) as to the accuracy or completeness or use of the Omdia
Materials. Informa Tech and/or IHS Markit will not, under any circumstance whatsoever, be liable for any trading, investment, commercial or other decisions based on or made in reliance of the
Omdia Materials. The "IHS Markit" brand and logo have been licensed for use by Informa Tech. The "IHS Markit" brand and logo and any third-party trademarks used in the IHS Markit
Technology Materials are the sole property of IHS Markit Group or their respective third-party owners.
Specific disclaimer for IHS Markit – reports, data and information referenced in this document:
The IHS Markit reports, data and information referenced herein (the "IHS Markit Materials") are the copyrighted property of IHS Markit Ltd. and its subsidiaries ("IHS Markit") and represent
data, research, opinions or viewpoints published by IHS Markit, and are not representations of fact. The IHS Markit Materials speak as of the original publication date thereof and not as of the
date of this document. The information and opinions expressed in the IHS Markit Materials are subject to change without notice and neither IHS Markit nor, as a consequence, Infineon have
any duty or responsibility to update the IHS Markit Materials or this publication. Moreover, while the IHS Markit Materials reproduced herein are from sources considered reliable, the accuracy
and completeness thereof are not warranted, nor are the opinions and analyses which are based upon it. IHS Markit and the trademarks used in the Data, if any, are trademarks of IHS Markit.
Other trademarks appearing in the IHS Markit Materials are the property of IHS Markit or their respective owners.
182021-02-12 Copyright © Infineon Technologies AG 2021. All rights reserved.