day3 panel1a jasonfuller -...
TRANSCRIPT

Framework for Large-‐Scale Communica5on and Power Co-‐Simula5on
Jason C. Fuller Pacific Northwest Na6onal Laboratory
ISGT 2014 -‐ 02/21/2014 [email protected]
PNNL-‐SA-‐101044
1
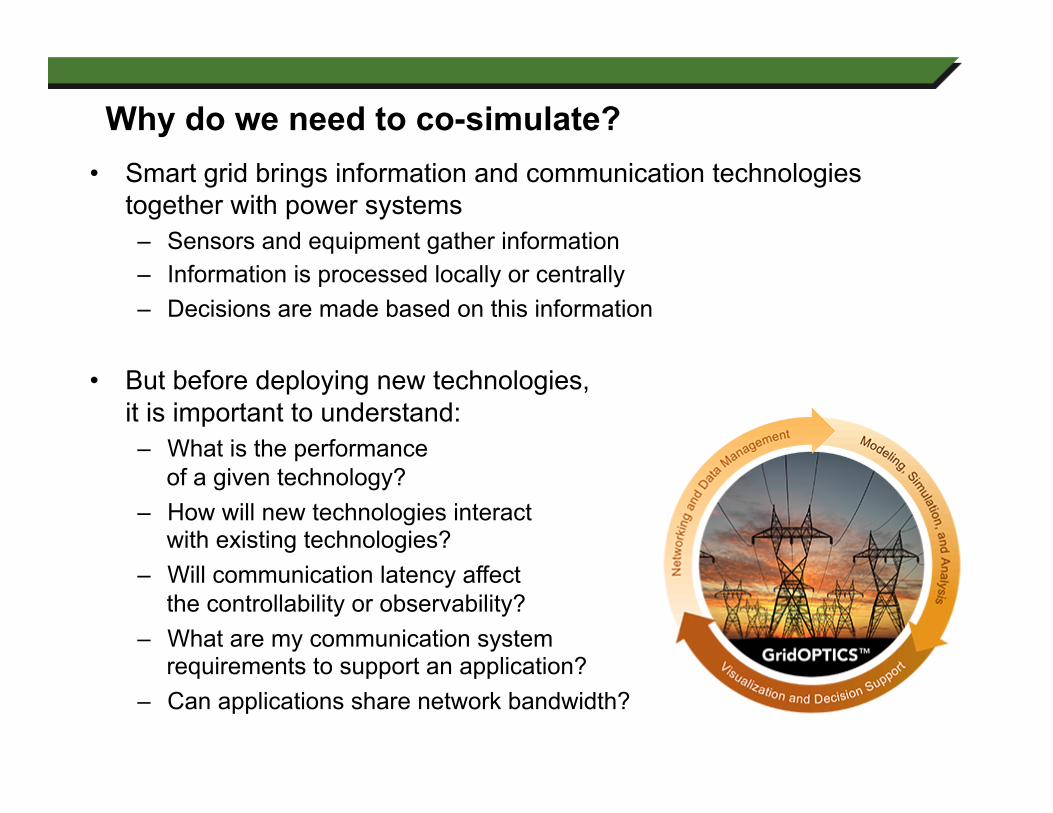
Why do we need to co-simulate? • Smart grid brings information and communication technologies
together with power systems – Sensors and equipment gather information – Information is processed locally or centrally – Decisions are made based on this information
• But before deploying new technologies, it is important to understand: – What is the performance
of a given technology? – How will new technologies interact
with existing technologies? – Will communication latency affect
the controllability or observability? – What are my communication system
requirements to support an application? – Can applications share network bandwidth?
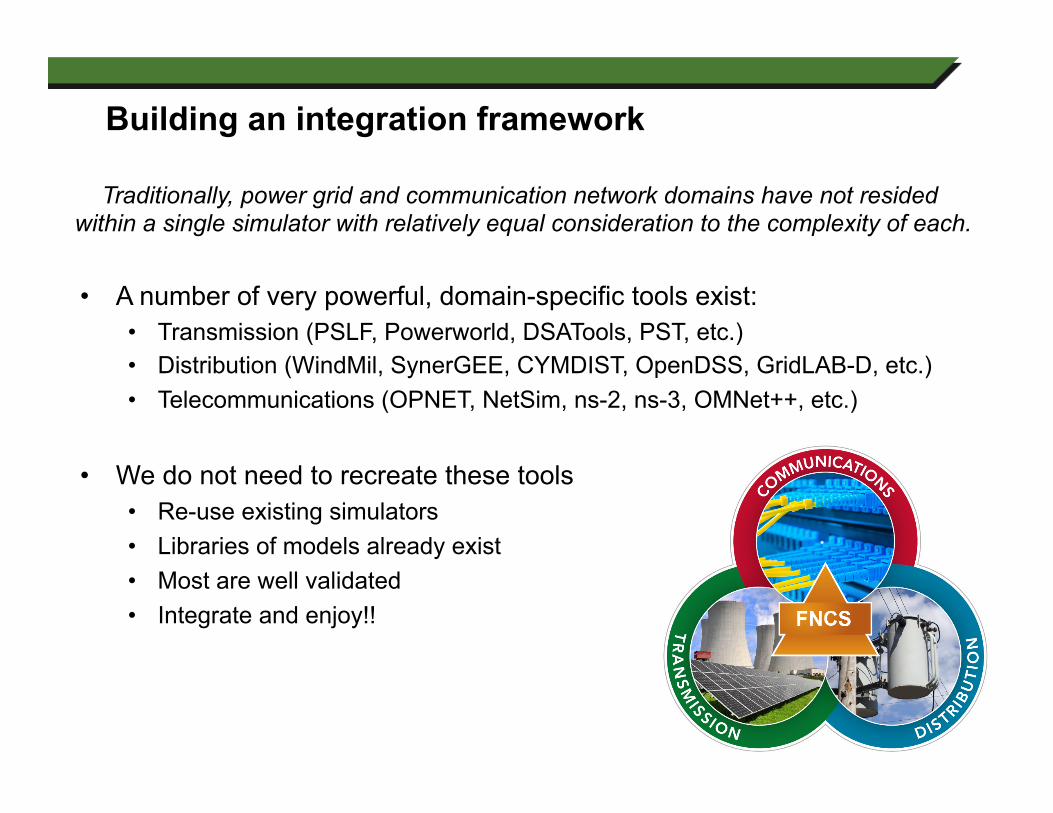
Building an integration framework
Traditionally, power grid and communication network domains have not resided within a single simulator with relatively equal consideration to the complexity of each.
• A number of very powerful, domain-specific tools exist: • Transmission (PSLF, Powerworld, DSATools, PST, etc.) • Distribution (WindMil, SynerGEE, CYMDIST, OpenDSS, GridLAB-D, etc.) • Telecommunications (OPNET, NetSim, ns-2, ns-3, OMNet++, etc.)
• We do not need to recreate these tools • Re-use existing simulators • Libraries of models already exist • Most are well validated • Integrate and enjoy!!
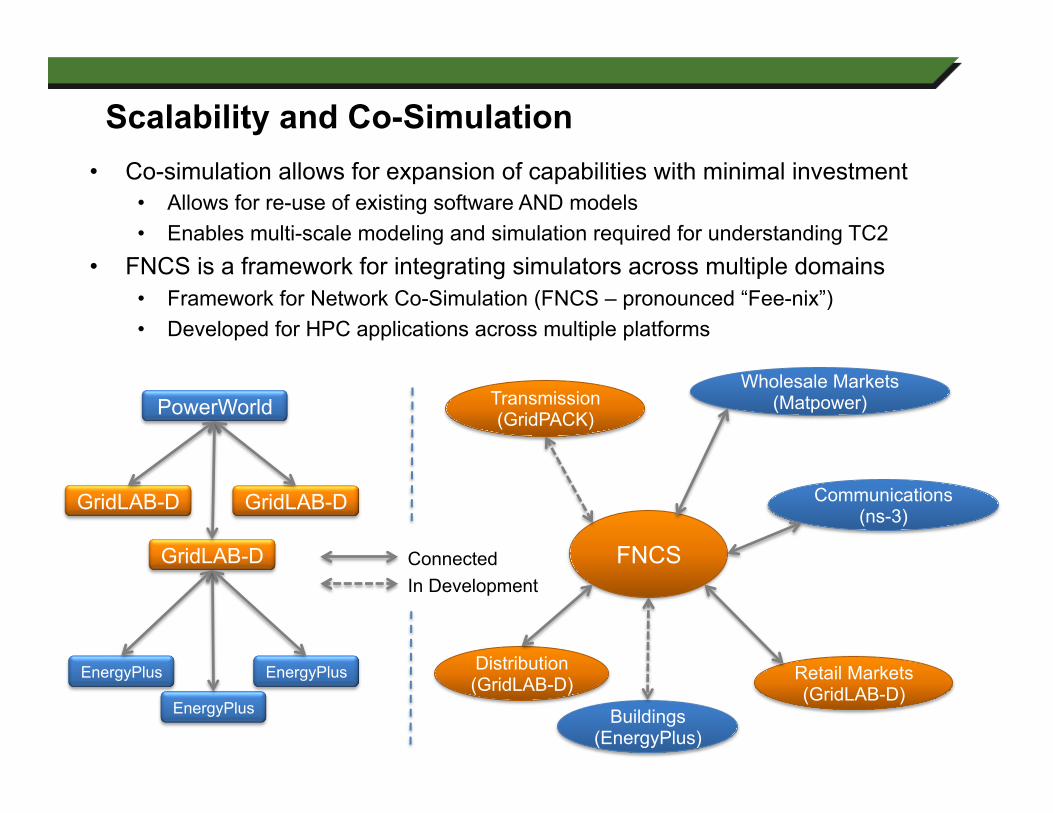
Scalability and Co-Simulation • Co-simulation allows for expansion of capabilities with minimal investment
• Allows for re-use of existing software AND models • Enables multi-scale modeling and simulation required for understanding TC2
• FNCS is a framework for integrating simulators across multiple domains • Framework for Network Co-Simulation (FNCS – pronounced “Fee-nix”) • Developed for HPC applications across multiple platforms
FNCS
Distribution (GridLAB-D)
Transmission (GridPACK)
Wholesale Markets (Matpower)
Retail Markets (GridLAB-D)
Buildings (EnergyPlus)
Communications (ns-3)
GridLAB-D
EnergyPlus
EnergyPlus
EnergyPlus
GridLAB-D GridLAB-D
PowerWorld
Connected In Development
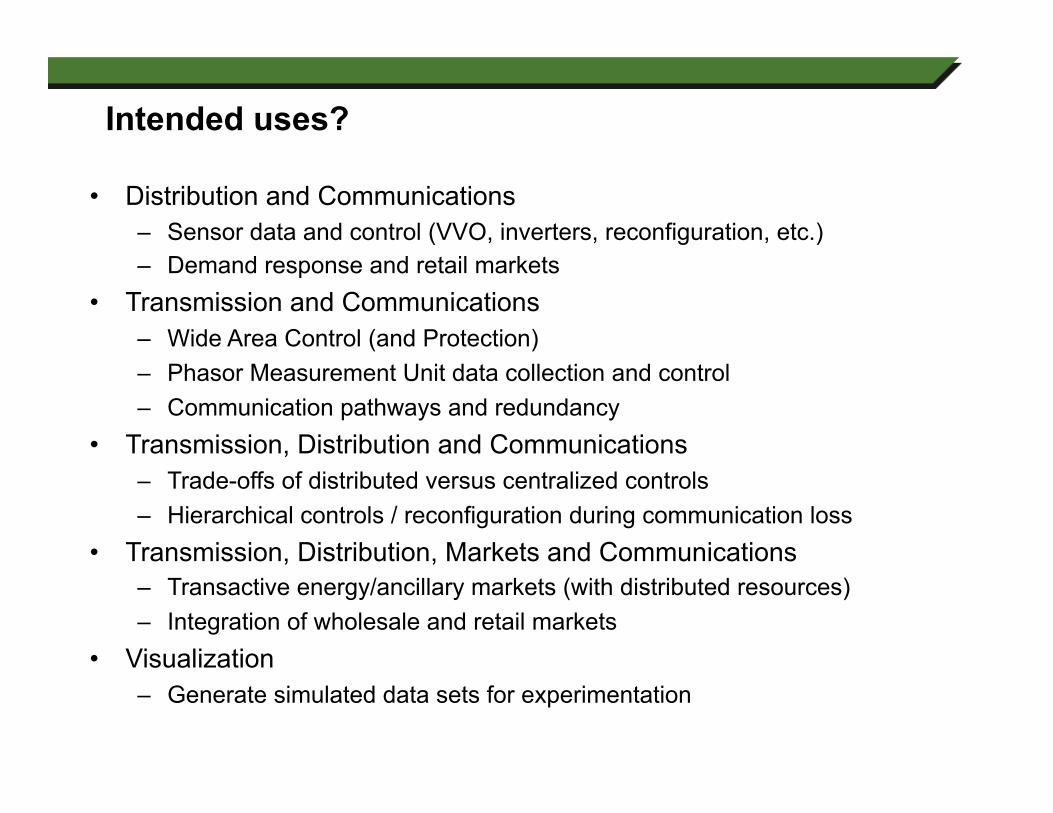
Intended uses?
• Distribution and Communications – Sensor data and control (VVO, inverters, reconfiguration, etc.) – Demand response and retail markets
• Transmission and Communications – Wide Area Control (and Protection) – Phasor Measurement Unit data collection and control – Communication pathways and redundancy
• Transmission, Distribution and Communications – Trade-offs of distributed versus centralized controls – Hierarchical controls / reconfiguration during communication loss
• Transmission, Distribution, Markets and Communications – Transactive energy/ancillary markets (with distributed resources) – Integration of wholesale and retail markets
• Visualization – Generate simulated data sets for experimentation

FNCS Framework Architecture
• FNCS API consists of three (minimal) components • Time management / synchronization • Communication interface between broker and simulator(s) • Message delivery and serialization
• Programmers need to use the components • All other components are hidden to ease the programming requirements • FNCS is programmed in C++, and interfaces for C, Java, Fortran are
provided with FNCS distribution

Demand Response/Real-Time Pricing Example
• RTP, double-auction, retail market • Market accepts demand and supply bids • Clears on five minute intervals • Designed to also manage capacity constraints at substation
More Comfort
More Savings
• Acts as a distributed agent to offer bids & respond to clearing prices
• Consumer sets a preference for “savings” versus “comfort”
• Currently being tested as part of the AEP gridSMART® ARRA Demonstration in Columbus, OH
• Residential energy management system
Pbase
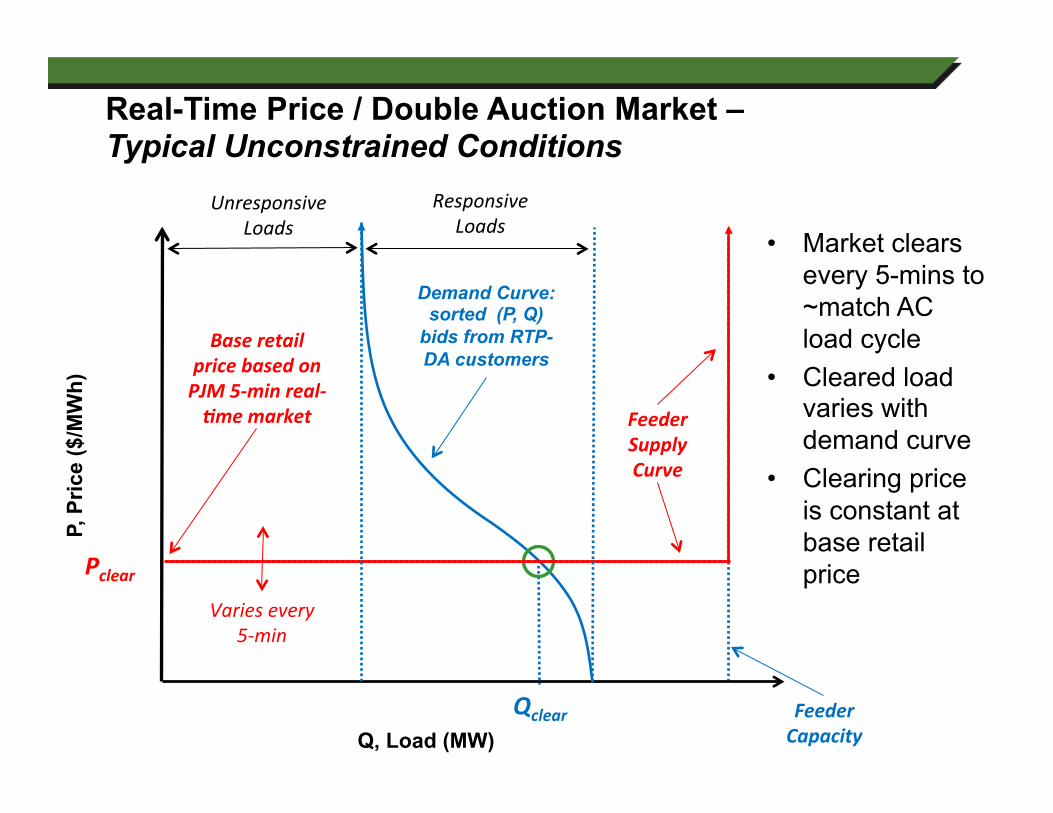
Real-Time Price / Double Auction Market – Typical Unconstrained Conditions
Base retail price based on PJM 5-‐min real-‐6me market
Unresponsive Loads
Q, Load (MW)
P, P
rice
($/M
Wh)
Responsive Loads
Demand Curve: sorted (P, Q)
bids from RTP-DA customers
Pclear
Qclear Feeder Capacity
Varies every 5-‐min
Feeder Supply Curve
• Market clears every 5-mins to ~match AC load cycle
• Cleared load varies with demand curve
• Clearing price is constant at base retail price

Real-Time Price / Double Auction Market – Typical Constrained Conditions
Base retail price based on PJM 5-‐min real-‐6me market
Unresponsive Loads
Q, Load (MW)
P, P
rice
($/M
Wh)
Responsive Loads
Demand Curve: sorted (P, Q)
bids from RTP-DA customers
Pclear
Qclear
Feeder Capacity
Feeder Supply Curve
Pbase
• Market clears every 5-mins
• Cleared load is constant at feeder capacity
• Clearing price varies to keep load at capacity
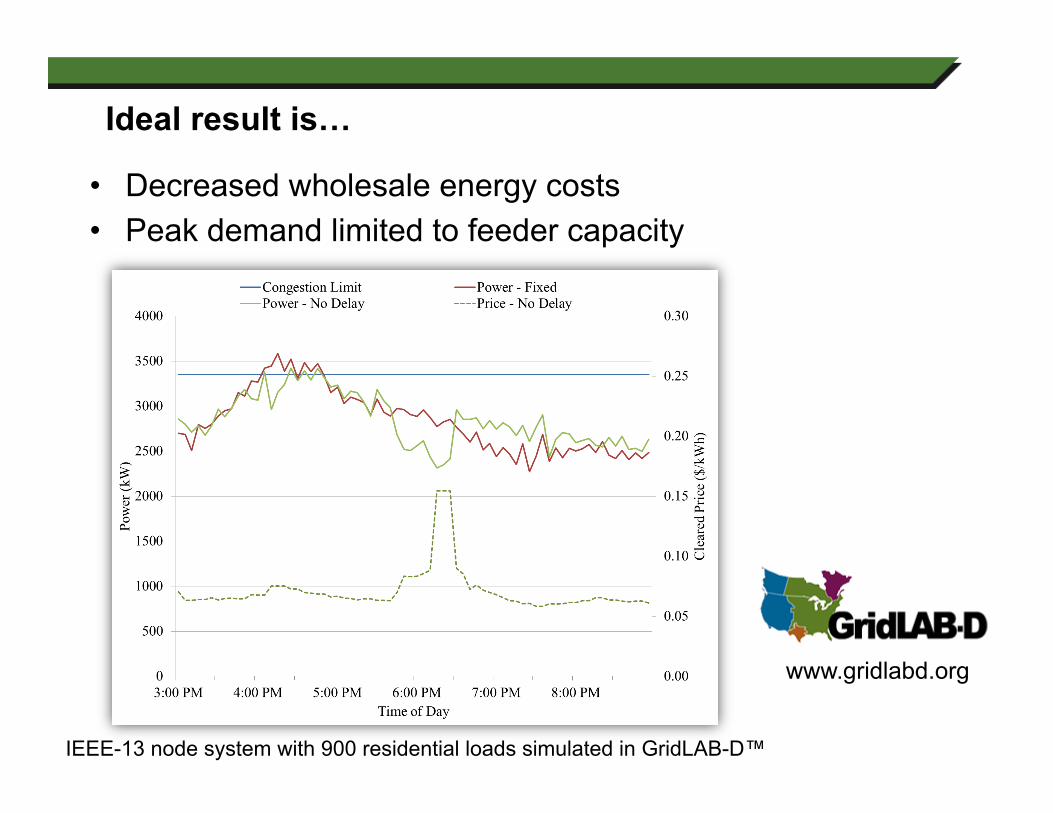
Ideal result is…
• Decreased wholesale energy costs • Peak demand limited to feeder capacity
IEEE-13 node system with 900 residential loads simulated in GridLAB-D™
www.gridlabd.org
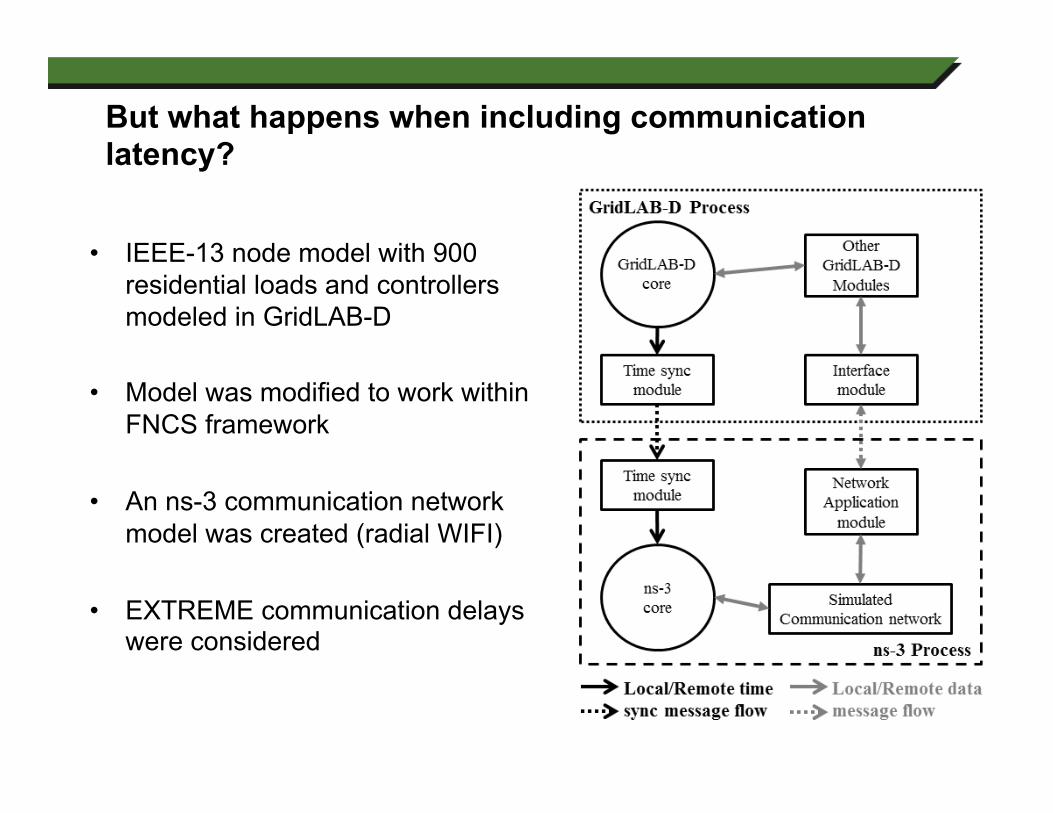
But what happens when including communication latency?
• IEEE-13 node model with 900 residential loads and controllers modeled in GridLAB-D
• Model was modified to work within
FNCS framework
• An ns-3 communication network model was created (radial WIFI)
• EXTREME communication delays
were considered
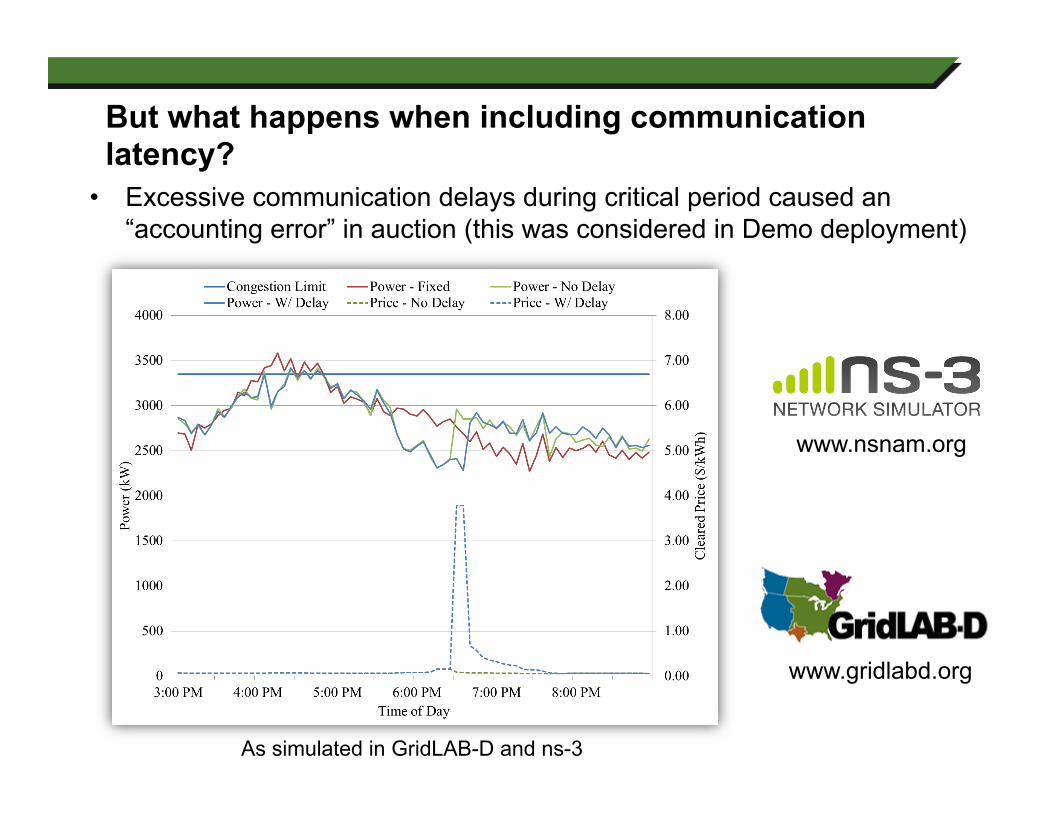
But what happens when including communication latency?
• Excessive communication delays during critical period caused an “accounting error” in auction (this was considered in Demo deployment)
As simulated in GridLAB-D and ns-3
www.gridlabd.org
www.nsnam.org
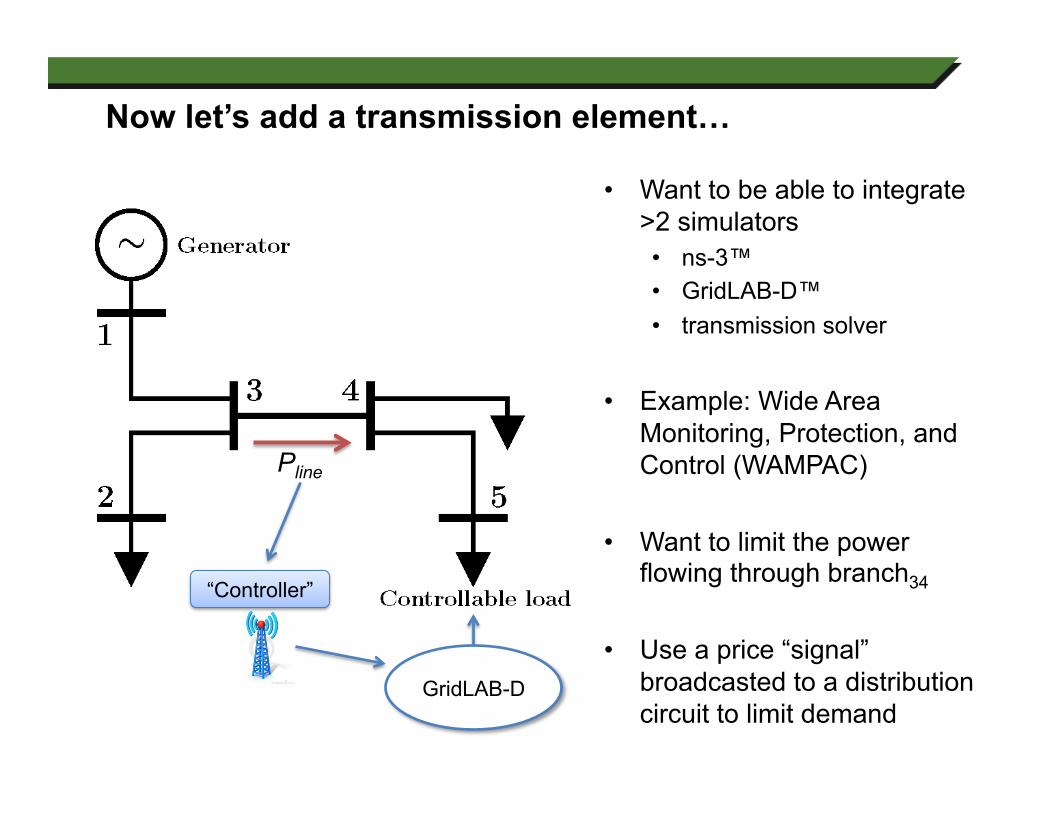
Now let’s add a transmission element…
Pline
• Want to be able to integrate >2 simulators • ns-3™ • GridLAB-D™ • transmission solver
• Example: Wide Area Monitoring, Protection, and Control (WAMPAC)
• Want to limit the power flowing through branch34
• Use a price “signal” broadcasted to a distribution circuit to limit demand
GridLAB-D
“Controller”
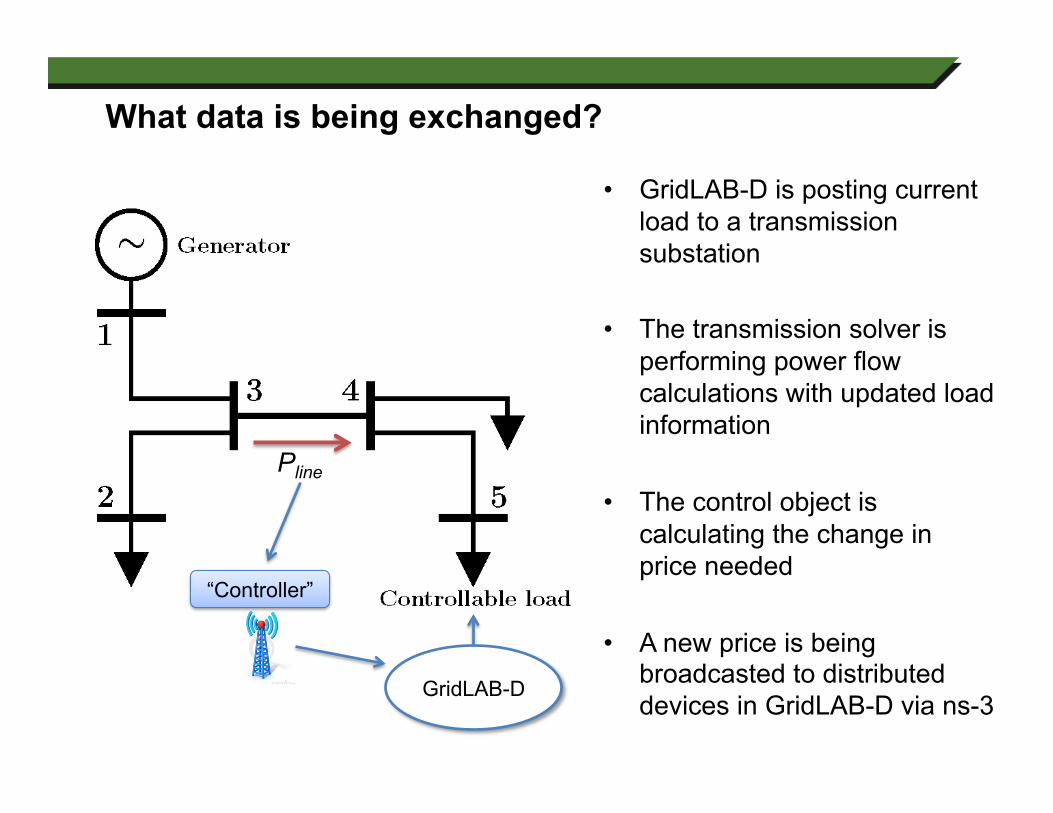
• GridLAB-D is posting current load to a transmission substation
• The transmission solver is performing power flow calculations with updated load information
• The control object is calculating the change in price needed
• A new price is being broadcasted to distributed devices in GridLAB-D via ns-3
Pline
GridLAB-D
“Controller”
What data is being exchanged?

Some results…
• PI controller takes some time to learn the necessary price adjustment (not well tuned)
• But, we can see the response within GridLAB-D • Reduces the demand from
hour 40 through 46 • Price signal is being
produced in the transmission solver (this could be replaced with MATPOWER & LMPs)
• Price is broadcasted via ns-3 (we could look at affects of communication delays)
Pow
er (M
W)
Time (hours)
Reduced demand in distribution simulator, but reflected in
transmission simulator
A few comments…
• Simple example to demonstrate the simulation environment – Any tool could be replaced with another of “better value” – Complexity of design is up to the user – We are testing multiple distribution and communication networks on a
single small network
• A co-simulation environment can help determine the most economic means of deploying smart grid technologies, specifically in terms of communication requirements for successful system operations – How much communication infrastructure do I need? – What affect will latency have on my monitoring / control scheme?
• This will become more important as multiple applications are layered over the same communication systems
Questions?
Why a federated approach?
• Does not require users to provide additional models (e.g., expectation models) for co-simulation.
• Support both transmission and distribution level power simulators.
• Message delivery without incurring delays. • Re-use of existing power grid and network models. • Efficient synchronization algorithms
to handle performance issues.
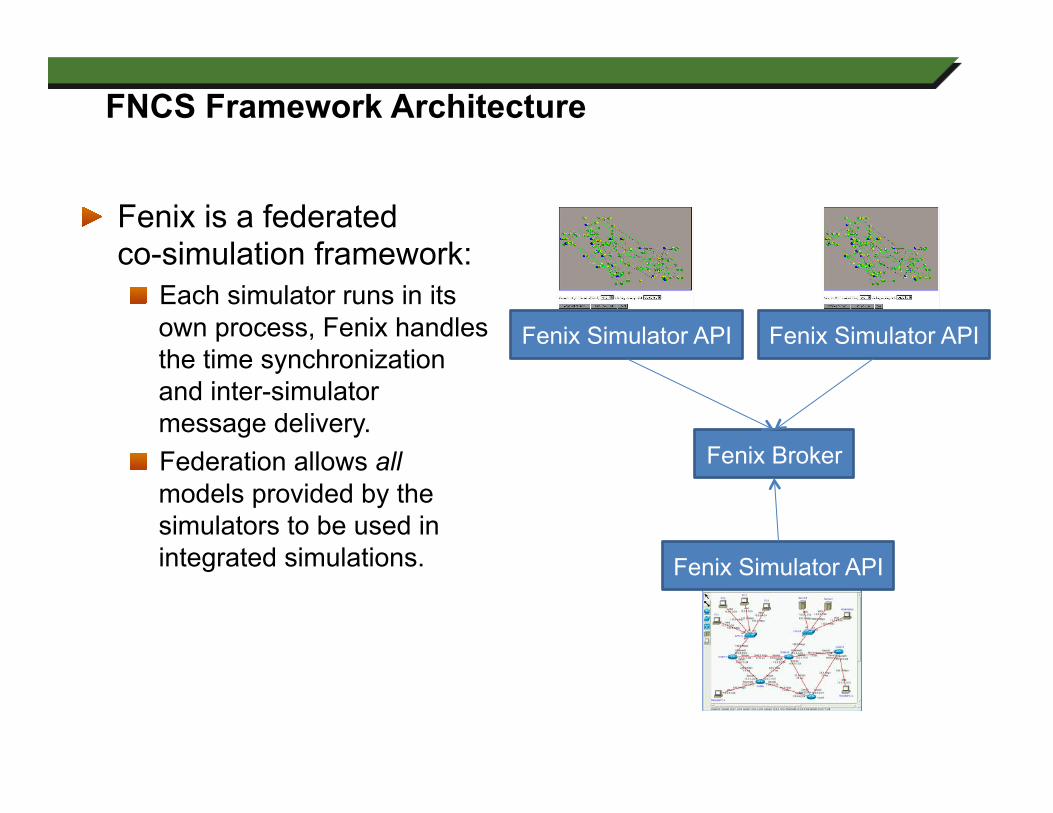
FNCS Framework Architecture
" Fenix is a federated co-simulation framework: " Each simulator runs in its
own process, Fenix handles the time synchronization and inter-simulator message delivery.
" Federation allows all models provided by the simulators to be used in integrated simulations.
Fenix Simulator API
Fenix Simulator API
Fenix Broker
Fenix Simulator API
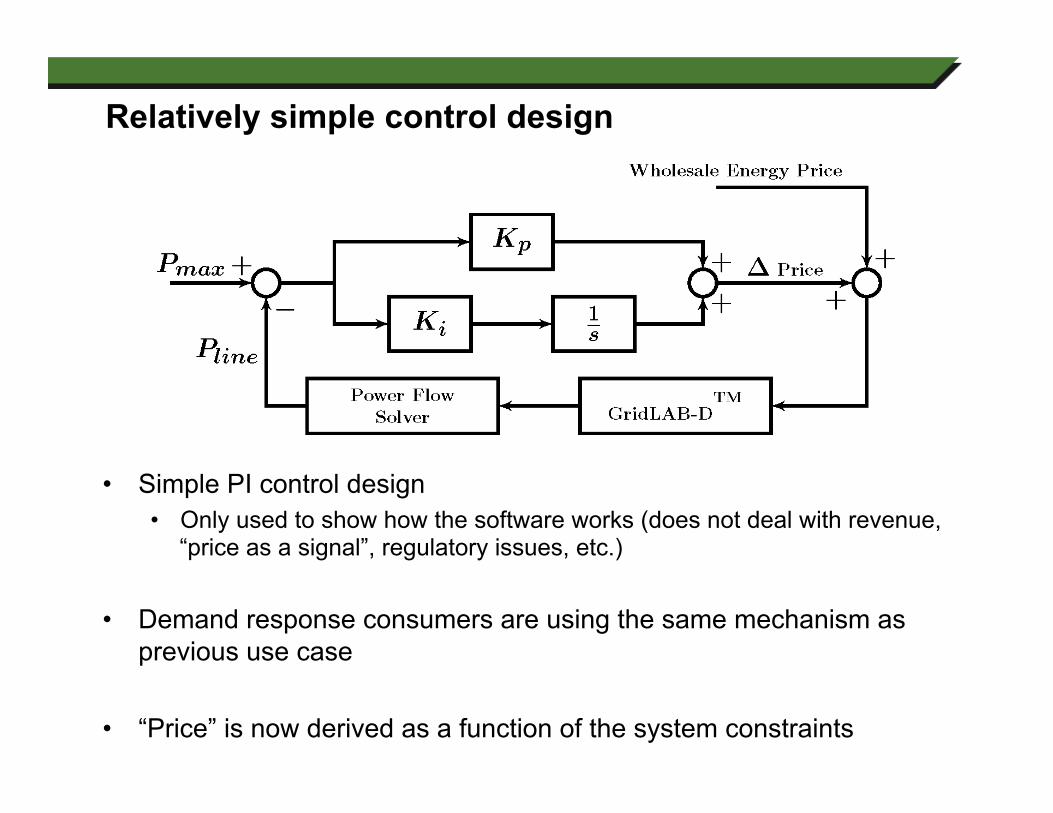
Relatively simple control design
• Simple PI control design • Only used to show how the software works (does not deal with revenue,
“price as a signal”, regulatory issues, etc.)
• Demand response consumers are using the same mechanism as previous use case
• “Price” is now derived as a function of the system constraints