dawn of the new decade - huon aquaculture
TRANSCRIPT

ANNUAL REPORT 2020HUON AQUACULTURE GROUP LIMITED
THE NEW DECADEDAWN OF

Contents02 Chairman’s and
Managing Director’s Review04 Review of operations10 Operating in unique environments12 Huon investment and innovation14 The Ronja Storm16 The outlook for the salmon market17 Huon’s approach to marketing18 Risk Management and Sustainability22 Financial Summary26 Board of Directors29 Directors’ Report46 Auditor’s Independence Declaration47 Corporate Governance Statement53 Financial Statements59 Notes to the Financial Statements102 Director’s Declaration103 Independent Auditor’s Report110 Shareholder Information112 Glossary of Terms114 Corporate Directory
Annual General Meeting 2020The Annual General Meeting of Huon Aquaculture Group Limited will be held online as a Virtual AGM on 30 October 2020. Details on how to participate will be included in the Notice of Meeting.

AFTER FIVE YEARS OF INVESTMENT AND INNOVATION
HUON AQUACULTURE IS READY TO DOUBLE ITS
PRODUCTION
1

Dear shareholder,This has been a milestone year in relation to Huon’s successful completion of a major capital investment program, finalising one of the business’ core strategic components of growing production capacity safely and sustainably. It also addressed key agriculture and climate risks associated with growing salmon in Australia, increasing our resilience to factors over which we have limited control. However the impacts on the business arising from a global pandemic have presented a unique set of challenges that Huon is not alone in having to manage.
Up until the end of March 2020, Huon had achieved its objective of making up the ground lost due to the setbacks in production from biological and weather events in FY2018 and FY2019. Biomass levels were back to where they would have been, had these setbacks not occurred and we were confident of exceeding our base-line harvest forecast for the year of 25,000 tonnes.
While Huon continued to operate through the most restrictive lockdown periods over the two months to the end of May, the closure of restaurants, clubs and the food catering industry more generally, virtually closed the food services sector in Australia during that period. While sales through retail channels were strong, Huon’s high exposure to the valuable food service channel meant that a significant drop in volumes in its wholesale market, accompanied by lower prices, was unavoidable. Access to export markets has also been interrupted since late March due to the disruption to international air freight services. Despite the disruptions during Q4, Huon achieved guidance volume with a 25,566 tonne harvest for FY2020. The strong performance of the 19 Year Class salmon, and some delay of the harvest in Q4, has the positive benefit of increasing our original expectations for the FY2021 harvest. It is now expected to be around 20% above the base line forecast of 30,000 tonnes, which will be a record for Huon.
Business performanceThe performance of Huon’s farming operations in FY2020 was the best for many years as good growing conditions, combined with increased productivity from the infrastructure, delivered through the investment program, produced better than expected fish performance. However, legacy issues in the first quarter of the financial year from the jellyfish issues in November and hot summer in 2018, continued to impact the growth of the 18 Year Class fish. This resulted in lower tonnages and weaker prices for the harvest in that period. In the final four months of FY2020 the harvest had to be slowed significantly due to the closure of many of our channels to market as a result of the COVID-19 pandemic.
Huon delivered revenues of $339.9 million, an increase of 21% on the previous year, largely due to the 36% increase in harvest volumes from 18,849 tonnes to 25,566 tonnes. Revenues were impacted by an average 11% fall in salmon prices to $13.30/HOG kg due to the increased volumes sold through the lower priced export market and lower domestic wholesale pricing in the second half.
Huon’s statutory net result after tax (NPAT) recorded a profit of $4.9 million, down from $9.5 million in FY2019. This included a $1.5 million increase in the Fair Value Adjustment (FVA) due to the growth in biological assets over the year. The lower pricing environment resulted in a 14% fall in Operating EBITDA from $47.3 million to $40.8 million (pre AASB 16).
The increase in the FVA reflects the 28% increase in the overall fair value of biological assets during FY2020 from $209.1 million to $262.8 million (pre AASB 16) as Huon has focused on rebuilding and expanding its biomass. Following the strong performance of the 19 Year Class salmon, with high survival rates and improved feed conversion, the June biomass levels were higher than expected, but with easing average prices, the fair value did not represent the increased biomass holding. The June biomass levels will underpin the substantial increase in the harvest to at least 36,000 tonnes in FY2021.
The level of investment required to expand our business to take advantage of the continued growth in domestic demand for salmon and to develop new markets overseas, has seen net debt rise from $138.8 million to $167.3 million with gearing sitting at 53% (pre AASB 16).
Chairman’s and Managing Director’s Review
NEIL KEARNEY Chairman
PETER BENDER Managing Director and Chief Executive Officer
Following five years of investment and innovation Huon is set to double its harvest tonnage…
Huon Aquaculture Group Limited
Annual Report 2020
2

StrategyHuon’s growth has been guided by its commitment to an overarching business strategy based on three key requirements; – growing the market; – increasing production and enhancing operational
efficiency; and – operating safely and sustainably.
From 2014 to 2019 significant focus was placed on ensuring that the infrastructure was in place to enable Huon to increase production and operate efficiently.
This required a major investment in upgrading our systems and technology to a standard that is unquestionably world class. We have encouraged innovation and designed new approaches to the way we farm that has enabled us to build additional layers of efficiency and resilience into our business that will stand us in good stead over the long term. The arrival in Hobart of the wellboat Ronja Storm in February 2020, marked the completion of Huon’s infrastructure program which has been the central platform of its five year strategy to grow the business. As a result Huon’s harvest capacity has at least doubled to more than 40,000 tonnes.
The strategic focus over the past year has been to concentrate on ensuring that the new infrastructure is operating in line with expectations, including the delivery of improved productivity. At the same time we have been accelerating our push to develop new markets offshore to take up the increased volume that is now in production. There is strong demand in these markets for access to a reliable, high quality and guaranteed supply of product and Huon is now in a position to meet that demand.
The spread of the COVID-19 pandemic across the globe since February 2020 put a halt to the momentum that had been building in the business to grow the market both domestically and through Asia. While it remains our most important strategic priority, the pace with which we are able to pursue this will be determined by the extent to which the pandemic continues to depress global economies and their ability to recover.
Capital ManagementIn FY2018 Huon committed to funding the expansion stage of its investment in infrastructure through existing borrowing facilities and cash flow. Reduced revenue in both FY2019 and FY2020, first due to the impacts arising from contact with jellyfish and a hot summer and then COVID-19, resulted in net debt running at a higher level during FY2020 than originally budgeted. In order to conserve cash flow for the increased operational requirements of the business, the board has suspended the payment of dividends for FY2020.
Capital expenditure was already planned to moderate beyond FY2019 as the business moved into a phase of bedding down the significant investments made over the previous two years. The primary focus in FY2020 was on extracting the production efficiencies that are a significant part of that process. Capital expenditure was $21.6 million which is below the previous estimate of $25-30 million in annual maintenance capex for the business.
This focus on debt reduction will remain a key priority in FY2021 including a continued focus on costs within the business as well as an extension of the dividend suspension.
PeopleThe wellbeing of our people is of paramount importance at Huon and our investment in developing protocols and procedures to protect our employees provided a strong framework for managing the health risks associated with COVID-19. The business was permitted to operate ‘as normal’ with modified policies and procedures to contain any potential outbreaks of the virus within the business. At the end of June, there had been no disruptions to the ongoing operations of the business.
Huon continued to focus on updating and developing its health and safety programs within the business which helped manage the growing workforce, however overall safety performance measures declined slightly during FY2020.
ConclusionThe last two years have presented some significant challenges to the business whether from the secondary impact of lost growth and increased mortalities from the jellyfish and hot summer encounter through to the temporary closure of markets and significant impact of the current COVID-19 pandemic.
While Huon’s underlying business strategy is unaffected by these events, a number of the operational benefits that we expected would be delivered following the completion of our significant investment program in 2019 have now been delayed until FY2022. As the global economy contemplates recession, it would be unrealistic to expect that our business will not be affected by the ongoing changes we have already witnessed in consumer behaviour and our access to traditional channels to market.
Your board is, however, confident that the investments made in recent years will support the growth of the business over the long term. A strong foundation has been put in place that will not only enable Huon to increase the production of salmon through its high energy sites but that it will do so sustainably. As Huon expands its production further next year it will continue to drive down operating costs per HOG kg, setting the business up to generate the growth in revenue, earnings and shareholder returns that we know it to be capable of once the current period of economic uncertainty ends.
On behalf of the Board I wish to extend our appreciation to all Huon employees for their efforts and commitment shown during the current pandemic. Our thanks also go to our customers, suppliers, local communities, and our shareholders for their support over the past year.
Neil Kearney Chairman
Peter Bender Managing Director and Chief Executive Officer
3

Operating overviewHuon Aquaculture’s financial performance in FY2020 was affected by the significant disruption of two of its main channels to market, wholesale and export, as a number of measures were implemented by the state and federal governments to contain the spread of the COVID-19 in 2H2020. Up to this point, the business was on track to achieving a strong uplift in revenue, underpinned by the favourable growing season over summer and the exceptional performance of the 19 Year Class salmon, as a result of the structural improvements that had been made over the previous two years.
Huon began FY2020 with a reduction in sales through the retail channel due to the completion of a three year contract to supply salmon to a major supermarket chain at the end of June 2019. In addition it was faced with continued poor fish growth in the 18 Year Class and harvest weights being slow to recover from the effects of gill necrosis which had developed as a consequence of the jellyfish bloom at the end of 2018. This resulted in low sales volumes in the first quarter as the business predominantly had small fish to sell, reducing its competitiveness in the wholesale market. It also meant export sales were difficult, particularly in the China market where there is a preference for larger fish.
Growth rates picked up in spring with fish size being more competitive in the wholesale market and more acceptable for export markets, allowing harvest rates to increase through the second quarter. The recovery of harvest size drove volume increases into the export channel which coincided with a sharp drop in international pricing, the lowest since 2015, due to Norway and Chile unexpectedly increasing their harvest levels for a short period. With exports accounting for 28% of revenue, the fall in spot export prices in the second and fourth quarters was the main contributor to the 11% drop in the weighted average sales price for FY2020.
The increased availability of fish together with larger fish size both support Huon’s commitment to focus on providing a reliable source of supply to our key markets both domestically and offshore. As contracted sales in international markets increase, there will be less exposure to the more volatile pricing environment of the spot export market.
In the retail channel, Huon made strong, direct gains during the year with fresh salmon sales up 48% as a result of new supply agreements and increased focus on customer development.
Performance improvementThere is however another story that sits behind these numbers. It is one that reflects the gains that have been made over the past year in lifting operating performance by changing the way Huon farms salmon.
The average fish harvest weight for the year was 5.04kg, the best in a decade and well above the average over that period of 4.53kg.
The 19 Year Class salmon is the first to benefit from the suite of changes that have been put in place along the length of the entire production chain – from the hatcheries to the Whale Point Salmon Nursery; the increased security provided by the fortress pens and more efficient bathing with custom designed wellboats; centrally controlled feeding from purpose built barges; and the POMV vaccine and new biosecurity protocols that put fish in the right farming areas at the right time to minimise the biological risk.
East of Yellow BluffHuon was granted an Environmental Licence for a new lease at Storm Bay, in the area known as East of Yellow Bluff, in May 2019. The new lease site, 1.5 kilometres from Bruny Island, is a key addition to the region as it enables Huon to deliver improved biosecurity in Storm Bay by including better separation of year classes of fish and is one of the key components of the industry biosecurity plan. Having fish in the right farming areas at the right time minimises the biological risk, including jellyfish mitigation, and at the same time provides efficiencies in the management of the biological stock.
The new lease has played a key role in the expansion of capacity at Storm Bay to 13,500 tonnes. In combination with Huon’s hatcheries, wellboat and growout facility it also maximises throughput options, lifting Huon’s total production capacity from 36,500 tonnes to more than 40,000 tonnes.
Whale Point Salmon NurseryThis new growout facility at Whale Point started operating at the beginning of 2019. In its first year it has enabled Huon to grow smolt to a larger size before putting them to sea – the 19 Year Class average size when released was 20% higher at 282 grams across all of our hatcheries. Fish transferred to sea in May 2019 were harvested in April 2020 at 4.6 HOG kg and represented the first Year Class to be produced from hatchery to harvest under Huon’s upgraded infrastructure and expanded capacity.
Review of operations
Huon Aquaculture Group Limited
Annual Report 2020
4

The final piece of infrastructure was commissioned in 2H2020, the transfer pipe, taking fish directly from the nursery to the wellboat. This transfer method eliminates the use of truck transfers, and improves fish health and performance following the transfer from freshwater to seawater, as the fish are less stressed.
Ronja StormIn February 2020 the wellboat Ronja Storm arrived in Tasmania. It is the most advanced fish bathing and transportation vessel in the world, and represents the completion of Huon’s two year strategy to invest in growth infrastructure. The vessel is designed to achieve increased production capacity and do so more efficiently. The Ronja Storm includes technical advancements including on board freshwater production, disinfection and oxygen generation. The large size is designed to facilitate bathing of Huon’s existing 240m pens in one load to ensure freshwater bathing is efficient and low stress on fish. An important operational benefit from the increased efficiency of this vessel is that the number of baths required by each pen will reduce over the fish lifecycle, as a consequence of not needing to pre-emptively bath them ahead of when required. An on-board grader will allow progressive harvesting in the latter stages of the fish lifecycle. By progressively harvesting a specific fish size, more fish per pen are expected to be grown without impacting Huon’s existing low stocking density.
Second 600T Feed Barge Huon’s second 600 tonne feed barge Hulk was launched in May. Constructed over the last two years the barge represents the completion of the sustainable fish feeding systems. Located in the high-energy sites at Storm Bay, the new barge has been designed to ensure that the fish can be fed in any weather, allowing them to fully realise their growth potential. The barge is fully automated and remotely controlled from the Hobart feed control room using cutting-edge video pellet-recognition software, meaning less feed wastage and a reduced environmental impact.
Selective breeding and POMV vaccineThe expansion in Huon’s production capacity carried with it a recognition it needed to increase access to the output from Tasmania’s industry-owned Selective Breeding Program. As a result Huon invested $2.5 million into the program which is run out of the Saltas hatchery. This takes Huon’s share of the biological output from
Saltas to 50% from 21%. Recent technological advances introduced at Saltas should see step change improvements in the future biological output from the program. With larger populations going to sea and recent technological advances at the hatchery, this move has ensured that Huon will maintain its ability to receive maximum benefit from the breeding program which is aimed at developing fish suited to the Tasmanian environment and to combat Amoebic Gill Disease (AGD). The broodstock from the Saltas hatchery are used in Huon’s other hatcheries.
This year the industry also implemented a trial vaccine for POMV. The vaccine, developed with support from government and industry, has proved extremely beneficial with no vaccinated pens coming down with POMV. All smolt going to sea in 2020 are being vaccinated with the new vaccine.
All these measures are part of an ongoing research effort that has at its core mitigating the impact of climate change on the future potential of the Tasmanian salmon industry, particularly through varying sea water temperatures. It has also been the underlying driver of Huon’s decision to move its growth in production offshore, positioning its marine leases in high energy sites where it is less likely fish will be impacted by this climate trend.
Expanding capacityFollowing the completion of Huon’s two year program of investing in infrastructure to drive the expansion of its production capacity, FY2020 heralded the beginning of that new growth phase.
During the first six months the biomass was rebuilt with the objective of returning production levels back to where they would have been if not for the biological and weather events encountered in the previous two years. The target for FY2020 was for a harvest of at least 25,000 tonnes with fish in production to support an increase in tonnage to over 30,000 tonnes in FY2021.
The strong performance of the 19 Year Class salmon reflects the investment in infrastructure, and biological improvements Huon has made, and we have increased our original outlook for FY2021 to at least 36,000 tonnes.
The increased volume of salmon available for sale in FY2020 and beyond enables Huon to meet the steady growth in demand in the domestic market at the same time as developing new markets in the Asian region. Growing the market, one of Huon’s three strategic pillars, is therefore where its primary focus will be in the years ahead.
5

Growing the marketHuon has been developing close relationships with a range of distributors and retail clients throughout Asia over the past 5 years, something that will assume greater importance now that its increased production capacity enables it to guarantee supply to this growing market. With a third of sales going offshore over FY2020, strong headway was made during the year into the contracted international retail space with volumes up 226% on the previous corresponding period (pcp). Importantly supply went into multiple outlets, reducing Huon’s reliance on any one customer. Even during the COVID disrupted second half, volumes to this segment rose 258% on pcp. In total, just over 6% of export revenue came from contracted volume in Asia.
The domestic retail channel accounted for 4,421 tonnes in FY2020 or 19% of sales compared to 5,510 tonnes (28% of sales) the previous year, following the completion of a large 3-year MAP contract in FY2019. Excluding this contract, Huon made strong, direct gains in the retail segment with salmon sales up 110% as a result of new supply agreements and increased focus on customer development. Good progress was also made in establishing a larger Ocean Trout retail market with fresh deli, branded MAP and branded smoked products now in distribution across major retail outlets.
At the beginning of FY2020 Huon’s branded points of distribution doubled to around 2,700 retail outlets around Australia, placing the Huon brand in its strongest position since listing. It underscores the importance of the Ingleburn processing and distribution facility in NSW in developing direct relationships with a range of food retailers as well as the major supermarket chains.
Huon expects to continue to expand branded distribution in all product segments both domestically and internationally over FY2021, following a strong year of distribution growth in FY2020. This will be supported by a significant above the line investment in marketing at the end of the first half to drive Huon Salmon consumption domestically. This investment will increase salmon’s share of voice in the protein market where there is significant underlying demand ready to be unlocked. Previous spends of this nature domestically have driven single year, double digit volume growth whilst maintaining price.
Rebuilding and growing supply through the retail channel is a key focus of Huon’s strategy to grow the market and will remain a focus for FY2021.
The domestic wholesale market remains a very important sales channel for Huon, accounting for 47% of sales in FY2020. This market was significantly disrupted in the last quarter of the year with volumes down 19% in the second half on pcp. Huon responded with discount pricing and marketing efforts to help stimulate demand for wholesale partners, focussing on volume through fresh fish shops, independent retailers, quick service restaurant outlets and e-commerce businesses.
Salmon pricesPrices in the domestic market remained strong in the first half with the wholesale channel continuing to record prices above $15.00/HOG kg and just under $14.50/HOG kg in the retail market. The situation changed abruptly in the second half as the pandemic took hold with prices falling by 9% across the wholesale domestic market. Compared to the record prices received the previous year ($15.63/kg) in the wholesale market, Huon averaged $14.71/kg in FY2020 while retail prices rose from $14.25/kg in FY2019 to an average $14.91/kg.
International salmon prices have been volatile during FY2020, despite a general acknowledgment that global demand continues to outstrip supply. During the first six months the world’s two largest salmon producing countries, Norway and Chile, increased their harvest levels over a three month period resulting in a sharp drop in international pricing to an average 47.6 NOK/kg, the lowest level since 2015. Huon’s harvest program was coincidentally set to sell record tonnages into the export market at this time. By December 2019 prices had bounced back to 71 NOK/kg however the timing of Huon’s export activities meant that it received an average export price in the first half of A$10.44/kg.
While the pandemic softened pricing during April and May, the average Fish Pool salmon price over the six months to June was 64 NOK/kg. This is consistent with long term forecasts by Rabobank that the salmon price from 2019 to 2021 would average 62-63 NOK/kg due to supply constraints affecting the major producing countries. Nevertheless a weaker Australian dollar during March and April resulted in Huon’s average export price in the second half only increasing to A$10.92/kg.
The progress achieved during FY2020 in growing sales into the contracted international retail space reduces Huon’s exposure to the volatile pricing of the spot export market. Over the year the average price on sales into this segment was A$13.46/kg.
Review of operations
FY2020 Channel mix% of total revenue
Wholesale 47% (64%) Retail: Domestic 19% (28%) Retail: International 6% (2%) Export 28% (6%)
FY20FY20
FY19
Huon Aquaculture Group Limited
Annual Report 2020
6

COVID-19On March 11, 2020 the World Health Organisation officially declared the global spread of the novel coronavirus (COVID-19), a pandemic. From that time a number of measures were implemented by the state and federal governments in Australia to contain the spread of the virus. This included the closure of Tasmania’s border to non-residents on 21 March and the implementation of a stage 3 lockdown across Australia from 30 March. International travel bans were also put in place from 24 March which had the immediate impact of restricting access to flights carrying freight as the major airlines progressively grounded their fleets.
Huon adhered to government guidelines and was permitted to continue all operations ‘as normal’, albeit with modified policies and procedures to contain any potential outbreaks of COVID-19 within the business. There were no disruptions to the ongoing operations of the business. The Company applied for the Australian Government Scheme ‘Jobkeeper’ and commenced receiving grants under the scheme in May.
During April and May the impact of the lockdown, in particular the closure of restaurants, clubs and the food catering industry more generally, virtually closed the food services sector in Australia. While sales through retail channels were strong, Huon experienced a significant drop in sales in its wholesale market during April and May due to its high exposure to the food service channel. Access to export markets was interrupted from late March due to the disruption to international air freight services.
The disruption to the international and domestic markets had a material impact on the second half results. The increased fish size and volumes available for harvest in Q4, with the commencement of the 19 Year Class harvest, should have delivered high returns. Following the outbreak of the pandemic, international prices that lifted in December and January entered another period of volatility. Huon’s strong position in supplying the food services sector was a disadvantage in the domestic market as consumers moved their purchases into retail.
Huon’s supply into domestic retail and retail fish shops increased, along with e-commerce channels, but this did not compensate for the loss of food services volume.
The increased consumer activity in these markets is however expected to deliver long term benefits through increased per capita consumption with more consumers now familiar with salmon as a weekly family menu item.
People and Safety
Safety and WellbeingA number of significant wellbeing programs were implemented during the financial year. These programs not only focused on reducing the risk of worker injury, but also on proactive initiatives to increase physical, emotional and financial wellbeing. These included Mental Health First Aid, individual briefings with superannuation experts and health checks.
A focus on injury management processes saw a reduction in the number and severity of Worker’s Compensation claims. However, increased lost time in injuries resulted a small increase in the LTIFR, despite a significant increase in production.
A major achievement was the development and implementation of individual Safety Management Systems for every vessel in Huon’s fleet and implementation of a business-wide chemical management system.
The business continued its focus on embedding ISO45001 – Standard for Work Health and Safety Management Systems, including the development of policy and procedures to manage any high-risk activity across the business. The proactive implementation of these Standards are an ongoing focus for the business aimed at not only reducing risks but also improving the wellbeing of Huon’s workforce and supporting people and leaders to manage safety effectively.
Developing People, Culture and LeadershipHuon’s Workforce Development Strategy continued to be implemented with employee capability development and the employee experience remaining a key focus. The Huon Leaders Program in 2019 which assisted Huon in building resilient leaders has been further supported by the introduction of the Welcome to Leadership Mentoring Program 2020. This supports newly promoted employees transition into their first Leadership role.
There continues to be a strong focus on growing the skill sets within Huon with nearly 90 employees currently completing a Certificate III Aquaculture (at June 2020). Other employees are completing VET sector qualifications in seafood processing, engineering fabrication, marine mechanical and electrical apprenticeships.
Language, literacy and numeracy support continue to be made available to employees requesting support to assist them in their everyday work.
Incident Rate (IR) Lost Time Injuries per 100 employees
FY18 FY19 FY20
0.971.00.79
Lost Time Injury Frequency Rate (LTIFR) Per million hours worked
FY18 FY19 FY20
44 5
Average Lost Time Rate (ALTR) Hours lost per employee
FY18 FY19 FY20
10
14 13
Employees
FY18 FY19 FY20
665600723
7

During the year, Huon also introduced the Innovation Program to bring our employees’ ideas to life. Since the Program’s launch, the Innovation Team has received and reviewed ideas from across the business and worked with a number of employees to further develop and implement their innovations.
Huon employs 723 people across the Group, an addition of 58 since 30 June 2019 to support the increase in production during the year.
Outlook Huon’s focus in FY2021, as it builds towards another step change in harvest volume, will be growing the market and locking in contracted sales. The expected increase in harvest volume for FY2021 of around 50% to at least 36,000 tonnes will be supported by both company and industry investment in marketing to increase salmon’s share of the protein market.
Huon’s channel mix is likely to be similar to that in FY2020 with around a third of sales going offshore. The strong foundation that was established in that year with international retail partners throughout Asia will continue to be built on, aiming to progressively increase the share of exports going to contracted international retail sales.
There will be a similar focus in the domestic retail channel, particularly on such segments as supermarkets, independent retail, quick service restaurants and the growing e-commerce space. It is these segments that will deliver the certainty of known volume that will underpin more stable Group financial performance over time. We expect retail sales to at least reflect the growth in demand, supported by our increased capability to supply fresh salmon to outlets in Sydney and the regions following the opening of our Ingleburn processing facility in NSW last year.
The strong performance of the 19 Year Class salmon combined with the slower harvest in Q4 is expected to deliver an average HOG weight in FY2021 in excess of 5.3kg. This, together with the reduced cost of managing this class due to the productivity benefits derived from the investment in new infrastructure and farming methods, is expected to deliver a cost of production (excluding freight) of under $9.50/HOG kg.
Revenue will depend on pricing and in FY2021 this will be driven both by global and domestic supply dynamics and the economic environment as countries globally manage their response to the pandemic. While we are confident of recording increased revenue given the strong uplift in volume, the volatility in pricing over FY2020 and the increased uncertainty about the economic outlook makes it difficult to form a view about trends in pricing over the course of the year.
We expect that FY2021 will continue to present challenges as economies emerge from the constraints imposed by COVID-19. We are however optimistic about our ability to deliver continued productivity improvements in the way we farm which will realise our long term goal of lowering operating costs.
Review of operations
Huon Aquaculture Group Limited
Annual Report 2020
8

9

Operating in unique environments
Map Key Office Processing facilities Farming regions
A Bridport HatcheryB Springfield HatcheryC Millybrook HatcheryD SALTAS HatcheryE Derwent HatcheryF New Norfolk Brood FacilityG Bagdad Brood FacilityH Lonnavale HatcheryI Forest Home HatcheryJ Whale Point Salmon Nursery
Huon is fortunate to farm in Tasmania’s unique environment, allowing the Company to raise salmon in locations in which they thrive. From the time Huon Salmon start their life in hatcheries up until they are harvested, their environment plays a vital role in their health, growth and quality.
Onshore
HatcheriesHatcheries allow Huon to mimic the natural lifecycle of salmon, synchronising batches of salmon to go out to sea at different times of the year, enabling the supply of fresh healthy fish all year round. Located throughout Tasmania, they allow Huon to take advantage of different water and environmental conditions and maintain high standards of biosecurity.
Whale Point Salmon NurseryWhale Point Salmon Nursery is the southern hemisphere’s first onshore salmon nursery and represents a step change in Huon’s production capability.
ProcessingThe Paramatta Creek and Ingleburn (Sydney) processing facilities are two of the most advanced in the world, ensuring the fish are as fresh as possible when they go to market.
Marine regions
Macquarie HarbourLess than 10% of Huon’s salmon production comes from Macquarie Harbour with stocking densities kept low in order to manage sustainable farming in this unique water system.
Huon River and D’Entrecasteaux ChannelHideaway Bay on the Huon River operates as the shorebase for Huon’s operations. This sheltered bay, with its calm waters, is where Huon manages its harvest as well as undertaking Australia’s only experimental and pre-commercial use fish feed trials.
Storm BayHuon began farming Storm Bay in 2014 as part of its long term growth strategy to shift salmon farming into high-energy offshore sites. The addition of the East of Yellow Bluff lease in Strom Bay doubles the capacity of Huon’s offshore sites.
Western AustraliaThe Western Australian Government has recently announced it will accelerate development of the Geraldton-based finfish nursery project, allowing Huon to unlock the next chapter of its plans to commercially farm Yellowtail Kingfish (YTK) in WA’s Midwest.
Storm Bay
Hideaway Bay
Macquarie Harbour
C
DF
B
TASM ANIA
A
LAUNCESTON
DEVONPORT
Parramatta Creek Processing Facility
HOBARTE
H I
J
G
Processing Facility
PERTH
MELBOURNE
TASMANIA HOBART
SYDNEY
BRISBANE
AUSTR ALIA
Huon Aquaculture Group Limited
Annual Report 2020
10
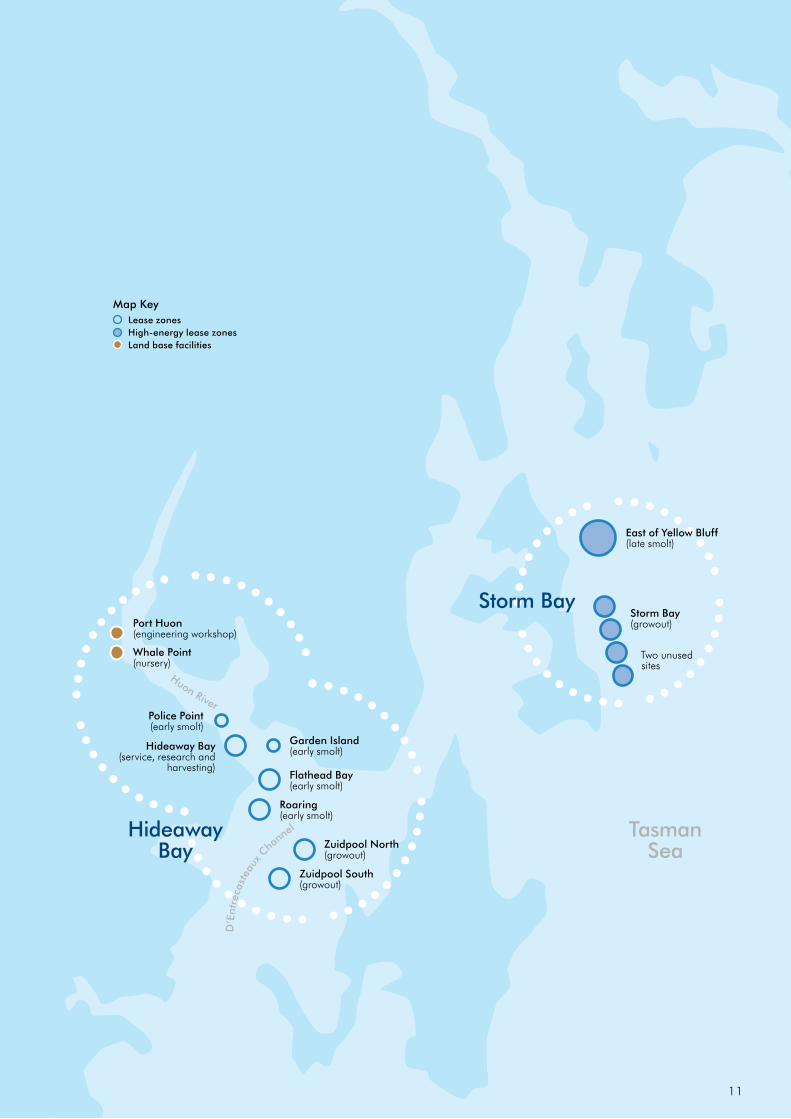
East of Yellow Bluff (late smolt)
Storm Bay (growout)
Two unused sites
Map Key Lease zones High-energy lease zones Land base facilities
Whale Point (nursery)
Port Huon (engineering workshop)
D’E
ntre
cast
eaux
Cha
nnel
Flathead Bay (early smolt)
Roaring (early smolt)
Garden Island (early smolt)Hideaway Bay
(service, research and harvesting)
Police Point (early smolt)
Zuidpool North (growout)
Zuidpool South (growout)
Huon River
Storm Bay
Tasman Sea
Hideaway Bay
11

Huon has a reputation for leading innovation across all areas of its operations which is supported by a highly skilled workforce with diverse and extensive expertise.
Huon investment and innovation
As a vertically integrated salmon producer, Huon’s operations span hatcheries, nurseries, marine farming, maintenance, harvesting, processing, value adding, marketing, sales and distribution.
Huon has invested $350 million over the past five years to ensure it is able to supply the growing demand for salmon in the years ahead. In order to operate on a larger scale, Huon has continued to innovate and engineer solutions by leveraging and developing technologies to position it at the cutting edge of aquaculture. Huon has a reputation for leading innovation across all areas of its operations which is supported by a highly skilled workforce with diverse and extensive expertise.
Hatcheries
Fish
Husbandry
Lighting
Processing
Nurseries
M
arine Farms Harvesting Pro
cessing Market
Feeding Fallowing
Value Added
Net
Management
Predator
Bathing
Maintenance
Program
Selec
tive Breeding
M
anagement
Huon Aquaculture Group Limited
Annual Report 2020
12

Huon has a reputation for leading innovation across all areas of its operations which is supported by a highly skilled workforce with diverse and extensive expertise.
Storm Bay
WellboatsRegular bathing and grading of salmon and harvest grade fish transferred to Hideaway Bay.
Fortress Pens Designed to operate in one of
the roughest farmable waters in the world with a double net system,
which has reduced predator risk.
HarvestingThere is a direct relationship between harvesting and the quality and freshness of the end-products and by focussing on low-stress, humane, night-harvesting, using RSPCA-UK certified equipment, Huon consumers experience fresher, high quality salmon year-round.
Whale Point Salmon NurseryBy growing our salmon larger on land, we improve the efficiency of our overall production cycle by reducing the time our salmon spend at sea from 14 months, to 9-10 months. Importantly the reduced time at sea reduces Huon’s agricultural and environmental risks.
Forest Home HatcheryA second generation recirculation hatchery that delivers outstanding smolt quality and larger smolt sizes with a reduced environmental footprint
Feed BargesTwo of the largest unstaffed fully automated feed barges are moored at Storm Bay.
Feed control-roomFeeding is monitored from Huon’s
central feed control-room in Hobart. Automated feeding software ensures
fish are fed 24/7, 365 days a year, in all weather conditions.
High-energy offshore sitesDeeper, high-energy sites at Storm Bay mean that pens are located in areas with stronger currents and greater water movement. Resulting in better fish performance.
Hobart
Feeding
Bathing
Feeding
Hideaway Bay
Tasman Sea
13

The Ronja Storm
The Ronja Storm, the world’s largest and most technically advanced wellboat, arrived in Hobart during February 2020 and is now operational at Huon’s sites in the South East of Tasmania.
The Ronja Storm is the final piece of investment in Huon’s Controlled Growth Strategy and is pivotal to the Company’s production expansion. The largest wellboat in the world will reduce production costs, strengthen biosecurity requirements and deliver the safest salmon farming operations in the world.
What is a wellboat?Wellboats have wells or tanks for the storage and transport of live fish. The term was first used in the 17th century and, before modern refrigeration methods, wellboats allowed for the delivery of live fish to port. Today wellboats are used extensively in the aquaculture industry around the world. They eliminate the need for time intensive, noisy towing of pens back and forth through Tasmanian waterways. Wellboats also provide a much safer working environment for employees, particularly as Huon grows its offshore farming.
Huon was the first company globally to use a wellboat for the purpose of bathing fish in freshwater.
Since 2014, Huon has been farming with the Ronja Huon, its first, smaller wellboat. The experience gained over that time was applied to the design of the Ronja Storm.
What are the benefits?– Strengthened sustainability of farming operations
through the treatment of Amoebic Gill Disease (AGD), a key fish health challenge in Tasmania, by bathing fish in freshwater in the wells of the wellboat.
– Bathing can be timed for when the fish need it rather than having to maintain fixed schedules. This is expected to save several baths a year.
– The efficiency and size of the Ronja Storm means we will never get behind with our bathing programme.
– Over a full year more fish can be put into each pen, without increasing the stocking density, as the Ronja Storm can carry more in each load. Eliminating multiple trips will reduce stress on the fish resulting in less mortalities.
– An on-board grader enables fish that are too small for harvest to be separated out and returned to the pen. This will increase total production from each pen in a year from 500 to 800 tonnes up to 1,000 tonnes.
– Improved biosecurity as wellboats have removed the need to tow pens of live fish, thereby eliminating fish escapes and the potential spread of communicable fish diseases.
Huon Aquaculture Group Limited
Annual Report 2020
14

Bathing Salmon are bathed in freshwater for a few hours to treat
gill amoeba.
Size Matters• Length: 116m
Width: 23m
• Desalination capacity: 16.8 million litres a day
• Bathing capacity: a complete fortress pen in one load
• Fish loading capacity: 1,000 tonnes per hour
How it works
Well capacityThe Storm can hold in
excess of 800 tonnes of fish at a time across its four wells.
Smaller graded fish are returned to fortress pen and
larger fish retained on-board for transportation to harvest.
On-board desalinationProduces 700,000 litres per hour of freshwater. Has 5,000 tonnes of extra water storage so new freshwater can be made while bathing fish.
Advanced water control system monitors the
levels of CO2, Ammonia and oxygen.
Live fish graderThe fish loading system has a built-in live fish grader that allows for progressive harvesting of fish of a specific size.
The technology is more robust than ever – a specialised offshore power management system has been fitted to the Ronja Storm, the first in a wellboat, which reduces energy use and noise emissions. The vessel includes backup power systems that ensure it can continue to operate with a minimum of 50% power capacity in case of system failure. This is essential in delivering robust, secure fish welfare practices.
The Ronja Storm is an investment into Huon’s future by enabling expansion in offshore, more challenging farming environments. It strengthens Huon’s animal welfare and biosecurity practices, delivers unparalleled safe working conditions and provides tangible evidence that Huon is committed to working with communities to reduce its environmental footprint.
Size matters When farming offshore sites, where conditions are challenging almost every day, size matters. The Ronja Storm’s well capacity and ability to produce freshwater on-board means it can also do considerably more work when conditions are fine and easier for farm crews.
The Ronja Storm is laden with cutting edge technology: – Every well has 30 sensors installed which deliver
constant, real-time monitoring data back to the bridge. – The well capacity is almost treble that of the
Ronja Huon, allowing an entire 240 metre pen of fish to be bathed at one time (upwards of 800 tonnes) significantly improving bathing efficiency.
– An on-board desalination plant can produce 700,000 litres of freshwater every hour, minimising use of Tasmania’s freshwater resource and eliminating the need for frequent travel movements back to shore to get water.
– An adjustable live fish grader in the loading system which can grade 300 tonnes of fish per hour. This allows for removal of small fish which can be returned to pens, ensuring only the correct size fish for the market are harvested.
Bathing
15

The Outlook for the Salmon Market
1 Kontali Aquaculture Bulletin 2020 No 82 ABS Import Data
Huon is committed to growing per capita consumption of salmon and ocean trout through a significant investment in advertising and promotion in the domestic market. Huon expects to increase its branded distribution across Australia as it captures the majority of growth in the market.
Weak global supply growth likely to match softened demand in short-mid termThe global salmon market has been in a relatively strong position in terms of supply. In 2019 farmed Atlantic salmon grew 7% on the previous year to 2.6 Mn tonnes.1
Whilst supply growth in the next 2-3 years is forecast in be in the low single digit growth it is likely that there will be a supply imbalance (over supply) during this time, depending on the strength of food service market recovery post COVID-19.
International imports into the Australian market have remained stable at around 11,500 tonnes for the last three years. That is expected to continue through FY20212, if not decline, as Huon targets import replacement in food service and retail sales channels.
Demand for salmon affected by COVID-19 but outlook remains positiveAs land-based proteins continue to increase in price, salmon continues to look more affordable to consumers year after year. Salmon (and seafood) consumption is low in many developed markets with many salmon producers and industry lobby groups focused on driving increased consumption of salmon both inside and outside the home. Farmed salmon is also increasingly being viewed as a better ‘green’ alternative than other land-based proteins due to its low carbon dioxide output, low water consumption and efficient food conversion ratios.
Global price neutral demand is still sitting between 7% and 10% according to Pareto Securities but the current impact of COVID-19 is driving significant short term oversupply as producers seek to move volume in a constricted market environment.
Looking beyond lockdown restrictions, it is unlikely that the hotel, restaurant and catering segment (HoReCa) which is estimated to be responsible for 45% of global salmon consumption, will bounce back overnight. In China (one of the first countries to ease restrictions) only half of all restaurants have re-opened, and those that have are operating at only 40-50% of ‘normal’ capacity. It is also unlikely that growth of salmon at the retail level will offset this loss, particularly in Australia, due to low consumer penetration of salmon for cooking in the home.
Nevertheless, the long-term demand dynamics for salmon still remain strong with low levels of penetration in many markets indicating there is plenty of room for growth in more ‘normal’ market conditions.
Like the international market, the fundamentals of salmon as a protein source for Australia are strong over the long term. Huon estimates the total impact from COVID-19 on Australian demand has been a loss of approximately 2,000 HOG tonnes in FY2020.
4.2%
2022
F
4.3%
4.4%
22.4
%
3.8%
-1.3
%
7.0
%
2018
2015
2012
2005
2009
2002
7.1%
-5.7
%Li
ce a
nd A
lgae
Blo
om Depending on biological factors 2-6% growth is possible in the mid term
ISA
Out
brea
k
2.1%
1.5%
-1.3
%
8.2%
2019
2019
2013
2006
2010
2003
2.1%
2020
E
1.9
%20
21E
2017
2014
2007
2011
2004
2008
2001
Year on year change in global Atlantic Salmon supply and forecast (%)
6.5%9.
1%10.1
%
12.2
%
5.4% 6.
9%
13.0
%
Source: Robobank
Huon Aquaculture Group Limited
Annual Report 2020
16

Huon’s Approach to Marketing
Strong contract focus for FY2021 and beyondFY2021 will be the year when Huon begins to realign its sales channels as the business moves more volume out of a trading environment, or the spot export market, into retail contracts in both the domestic and international markets.
Domestic retail sales volume growth is forecast to be strong through FY2021 as Huon benefits from increased exposure in this channel via newly won contracts.
International retail sales are also growing strongly with 170% volume sales growth recorded in FY2020 from new customers in new markets. Huon is in a strong position to continue growing this channel as it offers international retailers a distinct point of difference focused on Huon’s artisanal volumes when compared with global producers. Freshness to market in the key Asia region is another unique selling proposition.
Huon has also reduced its exposure to single export markets through the development of other regions, including North America where initial market interest and volume growth has been strong.
Prior to COVID-19, Huon’s wholesale business was on a strong growth trajectory and whilst that channel has been the most impacted by lockdown measures, it is expected to recover quickly as the economy emerges from COVID-19. Key areas of focus in this market continue to be quick service restaurants, sushi outlets, independent and specialty seafood retailers. At the same time Huon is using its strategically located processing facilities to move closer to the end customer.
FY2021 will continue to see high levels of trading volume internationally, given the large increase in production the business has generated following the completion of its controlled growth strategy. A conservative view has been adopted when forward pricing this volume and Huon is well placed to compete on product size and specifications in this market.
Positioning the Huon brand for long term sales growthHuon expects to continue to expand branded distribution in all product segments both domestically and internationally over FY2021, following a strong year of distribution growth in FY2020. This will be supported by a significant above the line investment in marketing at the end of the first half to drive Huon Salmon consumption domestically. This will be in addition to industry based marketing spend on both the seafood and salmon categories. This investment will increase salmon’s share of voice in the protein market where there is significant
underlying demand ready to be unlocked. Previous spends of this nature domestically have driven single year, double digit volume growth whilst maintaining price.
Huon is therefore confident that this initiative can deliver a major increase in domestic per capita consumption, even in a COVID-19 affected market.
There will be a strong focus on the launch of the entire Huon Salmon and Ocean Trout fresh pre-packed range into a major retailer in the December quarter. This will include a revamped Harvested By Night, Fresher By Day campaign, building on Huon’s already strong freshness credentials (a key purchase driver for consumers in seafood).
At the same time Huon continues to invest in its B2B loyalty program, Fresher Rewards, to ensure it maintains the strong connections and customer understanding it has established across the food service and wholesale environment. This program saw a 50% increase in users over the last quarter of FY2020 and the outlook remains strong for ongoing growth in the program.
Growth opportunities to watchThroughout FY2020 Huon continued to explore other sales channel opportunities with a particular focus on e-commerce. As COVID-19 took hold in the second half of FY2020 the business took advantage of its exposure to this channel, driving a 127% increase in volume whilst increasing value at a faster rate.
This channel to market is still coming off a low base however Huon’s own direct e-commerce experience and that of its channel partners in this sector, underpins a high level of confidence that there continues to be significant growth potential.
Huon is also exploring the opportunity for using salmon by-products in the pet food market with initial pet food product prototypes currently in development. Huon is set to trial these products in independent retail outlets in the first half of FY2021.
50%Increase in users of B2B loyalty program
‘Fresher Rewards’
170%Growth of volume sales in the international retail channel
127%Volume increase in e-commerce channel use
17
Risk Management and Sustainability
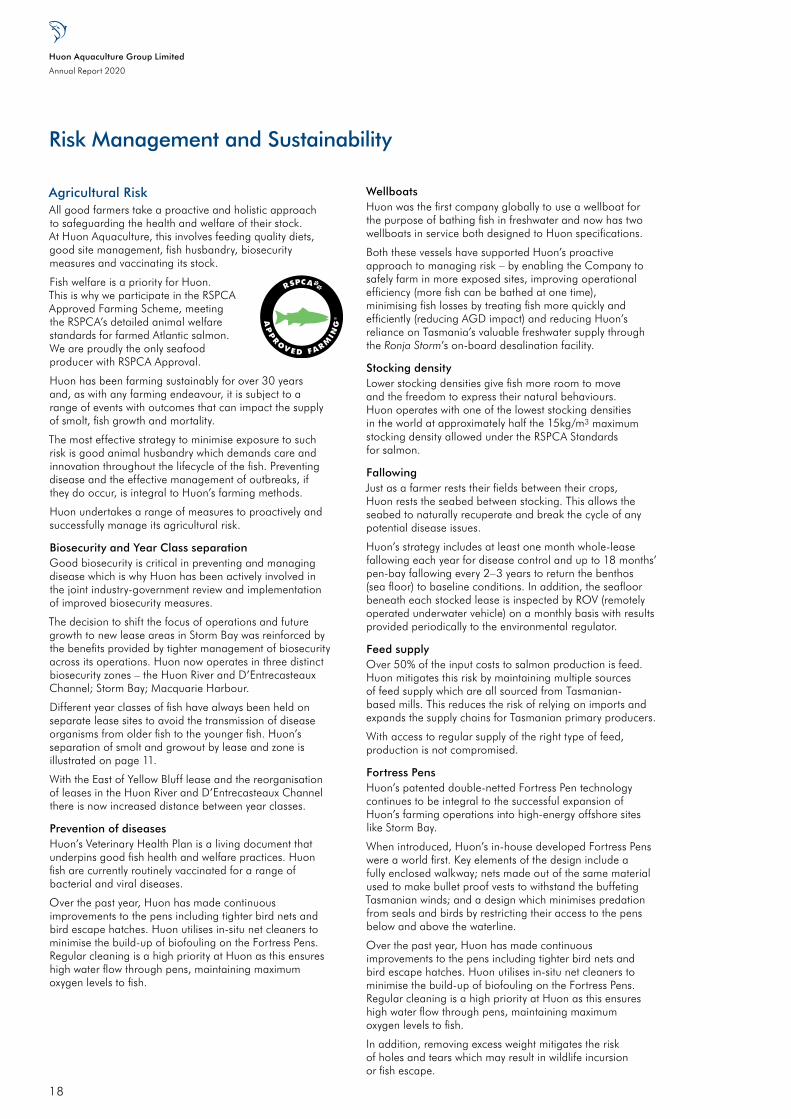
Agricultural RiskAll good farmers take a proactive and holistic approach to safeguarding the health and welfare of their stock. At Huon Aquaculture, this involves feeding quality diets, good site management, fish husbandry, biosecurity measures and vaccinating its stock.
Fish welfare is a priority for Huon. This is why we participate in the RSPCA Approved Farming Scheme, meeting the RSPCA’s detailed animal welfare standards for farmed Atlantic salmon. We are proudly the only seafood producer with RSPCA Approval.
Huon has been farming sustainably for over 30 years and, as with any farming endeavour, it is subject to a range of events with outcomes that can impact the supply of smolt, fish growth and mortality.
The most effective strategy to minimise exposure to such risk is good animal husbandry which demands care and innovation throughout the lifecycle of the fish. Preventing disease and the effective management of outbreaks, if they do occur, is integral to Huon’s farming methods.
Huon undertakes a range of measures to proactively and successfully manage its agricultural risk.
Biosecurity and Year Class separationGood biosecurity is critical in preventing and managing disease which is why Huon has been actively involved in the joint industry-government review and implementation of improved biosecurity measures.
The decision to shift the focus of operations and future growth to new lease areas in Storm Bay was reinforced by the benefits provided by tighter management of biosecurity across its operations. Huon now operates in three distinct biosecurity zones – the Huon River and D’Entrecasteaux Channel; Storm Bay; Macquarie Harbour.
Different year classes of fish have always been held on separate lease sites to avoid the transmission of disease organisms from older fish to the younger fish. Huon’s separation of smolt and growout by lease and zone is illustrated on page 11.
With the East of Yellow Bluff lease and the reorganisation of leases in the Huon River and D’Entrecasteaux Channel there is now increased distance between year classes.
Prevention of diseasesHuon’s Veterinary Health Plan is a living document that underpins good fish health and welfare practices. Huon fish are currently routinely vaccinated for a range of bacterial and viral diseases.
Over the past year, Huon has made continuous improvements to the pens including tighter bird nets and bird escape hatches. Huon utilises in-situ net cleaners to minimise the build-up of biofouling on the Fortress Pens. Regular cleaning is a high priority at Huon as this ensures high water flow through pens, maintaining maximum oxygen levels to fish.
WellboatsHuon was the first company globally to use a wellboat for the purpose of bathing fish in freshwater and now has two wellboats in service both designed to Huon specifications.
Both these vessels have supported Huon’s proactive approach to managing risk – by enabling the Company to safely farm in more exposed sites, improving operational efficiency (more fish can be bathed at one time), minimising fish losses by treating fish more quickly and efficiently (reducing AGD impact) and reducing Huon’s reliance on Tasmania’s valuable freshwater supply through the Ronja Storm’s on-board desalination facility.
Stocking densityLower stocking densities give fish more room to move and the freedom to express their natural behaviours. Huon operates with one of the lowest stocking densities in the world at approximately half the 15kg/m3 maximum stocking density allowed under the RSPCA Standards for salmon.
FallowingJust as a farmer rests their fields between their crops, Huon rests the seabed between stocking. This allows the seabed to naturally recuperate and break the cycle of any potential disease issues.
Huon’s strategy includes at least one month whole-lease fallowing each year for disease control and up to 18 months’ pen-bay fallowing every 2–3 years to return the benthos (sea floor) to baseline conditions. In addition, the seafloor beneath each stocked lease is inspected by ROV (remotely operated underwater vehicle) on a monthly basis with results provided periodically to the environmental regulator.
Feed supplyOver 50% of the input costs to salmon production is feed. Huon mitigates this risk by maintaining multiple sources of feed supply which are all sourced from Tasmanian-based mills. This reduces the risk of relying on imports and expands the supply chains for Tasmanian primary producers.
With access to regular supply of the right type of feed, production is not compromised.
Fortress PensHuon’s patented double-netted Fortress Pen technology continues to be integral to the successful expansion of Huon’s farming operations into high-energy offshore sites like Storm Bay.
When introduced, Huon’s in-house developed Fortress Pens were a world first. Key elements of the design include a fully enclosed walkway; nets made out of the same material used to make bullet proof vests to withstand the buffeting Tasmanian winds; and a design which minimises predation from seals and birds by restricting their access to the pens below and above the waterline.
Over the past year, Huon has made continuous improvements to the pens including tighter bird nets and bird escape hatches. Huon utilises in-situ net cleaners to minimise the build-up of biofouling on the Fortress Pens. Regular cleaning is a high priority at Huon as this ensures high water flow through pens, maintaining maximum oxygen levels to fish.
In addition, removing excess weight mitigates the risk of holes and tears which may result in wildlife incursion or fish escape.
Huon Aquaculture Group Limited
Annual Report 2020
18

NurseryHuon’s Whale Point Salmon Nursery is the only one of its kind in the southern hemisphere.
Huon’s success in growing salmon to a larger size on land (in a controlled environment) has reduced the time spent at sea by 30–40%. As a result Huon salmon is now being grown to harvest size in less than a year.
Larger smolt are more robust and less vulnerable to predation. This provides increased capacity to manage existing leases, lowering the environmental and biosecurity risk. The nursery has zero discharge to the environment due to the collection and composting of the fish nutrients for use by local land farmers.
Multiple site broodstock supplyHuon has broodstock facilities located at five, geographically separate sites around Tasmania, thereby guaranteeing supply.
This segregation of broodstock reduces biosecurity and production risks while each population is closely monitored to inform future breeding plans and to identify potential health issues.
Centralised Control of Operations including feed systemsHuon has long been a pioneer in feeding methods and technology. Its centralised feed operation has resulted in better control and oversight of on-water operations as well as supporting the Company’s move to offshore farming without compromising employee safety.
From the Hobart based control room, fish are remotely fed, to appetite, all at the same time. This replicates the fish’s natural behaviour and allows less dominant fish equal access to feed from anywhere in the pen.
National award-winning pellet-recognition software uses a combination of industrial automation and artificial intelligence to determine when the fish are no longer hungry. It then automatically turns off the feed, reducing feed wastage and minimising impact on the sea floor.
Locally-built feed barges, moored at each farming lease, are remotely operated from the control room. In the past year, the 600t Hulk, Huon’s seventh feed barge, joined the fleet, operating in Storm Bay.
Lift up SystemHuon’s Fortress Pens provide timely, automatic retrieval of fish mortalities, which is a critical component of good biosecurity management. Early detection and removal reduces the risk of potential spread of disease and minimises attraction of predators.
Huon’s control room operators also use cameras (positioned on pens and underneath the water) to identify and inspect any mortalities which minimises the use of divers, improving safety for on-water crews.
Social/Environmental RiskAs a fully vertically-integrated company, Huon’s compliance obligations span across all aspects of its operations. At the same time, Huon has a responsibility to ensure that its activities are understood by the communities in which it operates, and that its communication is transparent and authentic. Being part of any community brings with it a responsibility to do things that will help keep the community safe and connected.
Stakeholder engagementHuon encourages engagement with the community and others connected to, or invested in, activities associated with Huon’s operational footprint. Dedicated teams at Huon proactively manage relationships with all stakeholders including government, regulators, investors, suppliers, customers and communities.
Complaint management is undertaken transparently and evidence based data is regularly published in a bid to better inform stakeholders. Over the past year, significant effort has been invested in community educational activities to promote aquaculture as a career pathway.
Huon invests heavily in Tasmanian owned contractors and suppliers as well as providing direct funding into community grant schemes and sponsorships that focus on building capacity and resilience in regional communities.
Feed formulations including fishmeal/fish oilHuon fish are fed specialised diets that optimise health and performance at every stage of their lifecycle. All of Huon’s feed is now sourced from Tasmanian-based mills which reduces the risk of relying on imports, and expands the supply chains for Tasmanian primary producers.
Salmon rely on astaxanthin, an important anti-oxidant, for muscle growth and stimulation of the immune system as well as improving fertility and growth. It is also the source of salmon’s signature flesh colour. In the wild, astaxanthin is sourced from krill but is added to the diet of farmed salmon.
Huon has actively worked with feed suppliers to decrease the use of marine ingredients in feed. Huon has doubled the percentage of vegetables in its feed – now 60% compared with 31% in 2015.
Reducing the dependence on marine fish resources for aquaculture feed is increasingly receiving attention. This is why Huon only works with feed companies that ensure full traceability of feed ingredients and responsibly source marine ingredients from sustainably managed fisheries. Huon has also reduced the proportion of fishmeal in feed formulations by 20% from a high of 22% in 2013 to the current 18%.
AntibioticsConsumers are becoming increasingly conscious of inappropriate or excessive antibiotic use. Huon has not used antibiotics in its marine farming since 2016.
Antibiotics should only be used as a last line of defence and as such, Huon is continually working to develop proactive diet régimes and vaccines to allow stock to combat known illnesses and lead healthy lives. Huon voluntarily publishes its antibiotic usage as well as submitting fish stock for flesh testing, in addition to participating in the publicly available National Residue Survey.
19

Market RisksThe key market risks relate to the ability to maintain supply of product, market disruption factors and consumer confidence in the quality and safety of Huon’s product.
COVID-19On March 11, 2020 the World Health Organisation officially declared the global spread of the novel coronavirus, COVID-19, a pandemic. The potential key risks posed to Huon from the pandemic include operational, safety and market disruption.
Huon has adhered to government guidelines with no disruptions to the ongoing operations of the business.
The Australian food services sector of the wholesale market has been disrupted by the closure or severe restrictions placed on the operations of restaurants, clubs and the food catering industry, as a result of government imposed lockdowns. Access to the international salmon export markets was interrupted due to the disruption to international air freight services. Huon’s diversified presence in both the domestic and international market has enabled it to react and adapt to the changing conditions.
Product pricingHuon’s profitability and the market value of its biological assets are sensitive to salmon prices in both the domestic and international market. Prices are dependent on short and long term supply and demand variations, and market conditions. This risk is managed through Huon’s customer channel and product diversification strategies, through customer supply contracts and category marketing investment.
Product acceptance in the marketThe sale of any product is dependent on market perceptions of its quality and safety. Huon mitigates this risk through its rigorous quality assurance systems and constant product testing. Significant, ongoing marketing continues to raise the profile of the Huon brand as a premium product and position it for growth.
Diversification of channel mixReliance on one channel or a limited client base for the sale of any product introduces risk. Huon manages this through selling into the wholesale market, the retail sector both domestic and offshore via contracted sales, as well as through the export channel.
Workplace Health and SafetyProviding a workplace that is safe and ensuring that staff return home un-injured each day is a fundamental duty of all employers. It is also essential for attracting and retaining staff as well as providing an environment which supports learning, team work and innovation. Across the business, strengthening automation and use of technology has continued to secure jobs for the industry and Huon seeks out more and more ways to improve its operations.
Equipment and work processesHuon’s Fortress Pens are designed to protect staff from interactions with seals and provide a safe working environment. Extensive use of automation and technology is deployed throughout the business including in the areas of net cleaning and repair and remote feeding. The introduction of unmanned feed barges moored onsite at leases together with automated feeding, reduces the number of vessel movements and time employees spend on water.
At the Parramatta Creek processing facility, continuous modification to processes has included the introduction of automation and robot packers, minimising manual handling.
Training and professional developmentDevelopment of staff through training, increases productivity and reduces the risk of injury and accidents. It also increases the rate of staff retention. Huon staff continue to participate in development programs with many undergoing professional development including VET sector training courses specific to their role.
In addition, general literacy, numeracy and digital literacy support is offered to all employees and Huon continues to engage with the tertiary education sector to identify future workforce development requirements.
Third party, independent certification Huon seeks independent certification of its processes to assist with risk mitigation and as a means of validating compliance with global best-practice.
In 2018, Huon was the first (and remains the only) seafood producer in Australia to meet the RSPCA’s detailed animal welfare standards for farmed Atlantic Salmon, and cooperate with the rigorous ongoing assessments by the RSPCA to ensure compliance. The RSPCA Approved logo offers consumers the assurance that Huon Salmon have been farmed humanely and in an environment that meets their needs. The RSPCA’s standards currently don’t permit farming in Macquarie Harbour and therefore these salmon products won’t be labelled as RSPCA Approved. Currently less than 10% of Huon Aquaculture’s total salmon production is from Macquarie Harbour.
In 2012, Huon became the first Australian salmon producer to achieve the internationally recognised accreditation, Global G.A.P. This pre-farm gate standard covers the whole production process of the certified product from the hatchery to the point of harvest and packing and recognises ongoing, continuous improvement.
Risk Management and Sustainability
Huon Aquaculture Group Limited
Annual Report 2020
20

Huon is also a BRC AA-rated seafood processor. The BRC Global Standards specify requirements to be met to enable the production, packaging, storage and distribution of safe food and consumer products. These standards are specified by growing numbers of retailers and branded manufacturers across the globe. Huon’s Parramatta Creek processing facility first achieved BRC AA rating in 2016. At the time it was the first seafood processing facility in Australia to achieve the BRC AA rating.
Huon is also HACCP certified. Safe food production is achieved by applying HACCP techniques to ensure that potential hazards during the process are recognised, monitored and controlled.
Finally the Australian Quarantine and Inspection Service (AQIS) also undertakes regular inspections and assesses Huon’s certification process compliance to approve the sale of Huon products overseas.
In late 2019, Huon’s Forest Home hatchery farmland received organic certification from the National Association for Sustainable Agriculture Australia enabling a third party artisan cheese and milk producer to label its products as organic.
Managing Climate and Environmental RiskHuon has proactively taken steps to manage and mitigate the impact of climate change on their operations. The first step was pioneering offshore farming in Tasmania, where dissolved oxygen levels and water temperatures are better for the fish. Huon has been successfully farming offshore in Storm Bay since 2014 and it is a key component in Huon’s proactive management of climate change.
Other steps include selectively breeding fish that perform better in warmer waters; undertaking trials with global feed companies to develop an easy-to-digest summer diet; and investing in renewable energy sources.
Salmon farming is one of the most efficient ways of using natural resources to produce a healthy protein. It has a low carbon footprint, high energy and protein retention efficiency and low water footprint. Across all the different farmed animals, the Global Salmon Initiative has found that the Feed Conversion Ratio of salmon is the most efficient of all farmed animals. While a kilogram of beef meat requires between 6–10kgs of feed, a kilogram of salmon meat requires just 1.2–1.5kgs.
An example of the Huon’s efforts to mitigate the risk of climate change is its involvement in an industry selective breeding program. This produces high performing broodstock adaptable to Tasmania’s farming conditions. Since the founder populations were recruited, there has been a steady increase in genetic gain where growth potential and amoeba resistance have improved by roughly 2–3% a year. Initial results from the family-based program replicated those seen from earlier mass selection which identified that amoeba resistance is a heritable trait and can be increased through the generations. In the past year, Huon purchased a larger share in the program to ensure ongoing access to a bigger pool of genetically elite breeders.
Warming waters are a key challenge of salmon farming globally and a joint feed trial between Huon and BioMar, a leading feed company, aims to reduce the impact on stock by creating a better performing summer diet.
The aim of the current trial is to help the fish digest and convert feed in summer temperatures that are higher than their preferred range. Given that warming waters are a global issue for salmon farming, it is expected that the research taking place in Tasmania will have positive implications global. The trial is being conducted at Huon’s Hideaway Bay trial pens, which have hosted in-house and commercial feed trials for many years.
A further example of Huon’s commitment to managing the impact of climate change on public waterways is our participation in a research program into Giant Kelp run jointly by the Institute of Marine & Antarctic Studies (IMAS) and The Climate Foundation.
Giant Kelp has endless applications from being used in food and fertiliser, bioplastics, and high-value nutraceuticals. It also has the added benefit of being extremely fast-growing, providing habitat for numerous other species and soaks up nutrients in the water. However, warming Tasmanian waters have caused an alarming reduction in the size of the giant kelp forests in the State, leaving valuable food-webs at risk. The strengthening of the Eastern Australian Current is the primary reason for the decline in giant kelp. This is why Huon is supporting IMAS and The Climate Foundation to cultivate warm-water tolerant strains on our Storm Bay leases to assess their potential for the restoration of Tasmania’s kelp forests.
There is a company wide focus to reduce the costs of energy from the supply side. Huon is also involved in the Blue Economy – Cooperative Research Centre, partnering with other research institutions to examine current and future renewable energy options.
21
Financial Summary
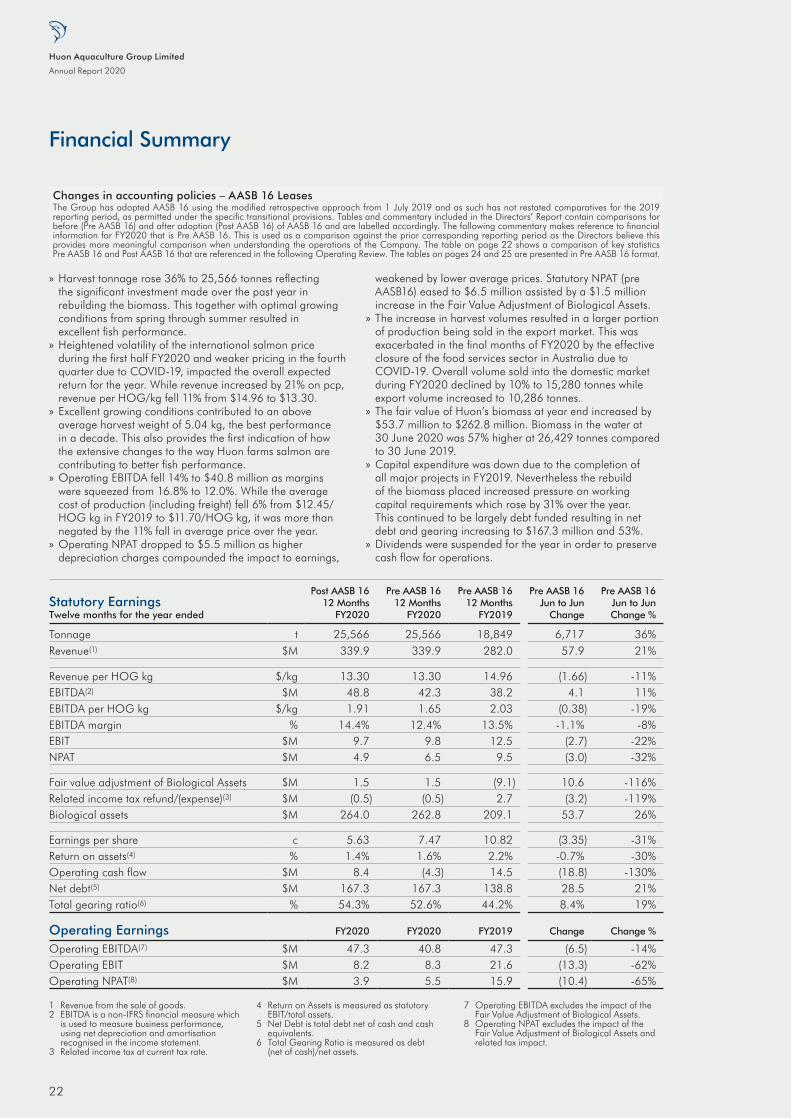
» Harvest tonnage rose 36% to 25,566 tonnes reflecting the significant investment made over the past year in rebuilding the biomass. This together with optimal growing conditions from spring through summer resulted in excellent fish performance.
» Heightened volatility of the international salmon price during the first half FY2020 and weaker pricing in the fourth quarter due to COVID-19, impacted the overall expected return for the year. While revenue increased by 21% on pcp, revenue per HOG/kg fell 11% from $14.96 to $13.30.
» Excellent growing conditions contributed to an above average harvest weight of 5.04 kg, the best performance in a decade. This also provides the first indication of how the extensive changes to the way Huon farms salmon are contributing to better fish performance.
» Operating EBITDA fell 14% to $40.8 million as margins were squeezed from 16.8% to 12.0%. While the average cost of production (including freight) fell 6% from $12.45/ HOG kg in FY2019 to $11.70/HOG kg, it was more than negated by the 11% fall in average price over the year.
» Operating NPAT dropped to $5.5 million as higher depreciation charges compounded the impact to earnings,
weakened by lower average prices. Statutory NPAT (pre AASB16) eased to $6.5 million assisted by a $1.5 million increase in the Fair Value Adjustment of Biological Assets.
» The increase in harvest volumes resulted in a larger portion of production being sold in the export market. This was exacerbated in the final months of FY2020 by the effective closure of the food services sector in Australia due to COVID-19. Overall volume sold into the domestic market during FY2020 declined by 10% to 15,280 tonnes while export volume increased to 10,286 tonnes.
» The fair value of Huon’s biomass at year end increased by $53.7 million to $262.8 million. Biomass in the water at 30 June 2020 was 57% higher at 26,429 tonnes compared to 30 June 2019.
» Capital expenditure was down due to the completion of all major projects in FY2019. Nevertheless the rebuild of the biomass placed increased pressure on working capital requirements which rose by 31% over the year. This continued to be largely debt funded resulting in net debt and gearing increasing to $167.3 million and 53%.
» Dividends were suspended for the year in order to preserve cash flow for operations.
Changes in accounting policies – AASB 16 Leases The Group has adopted AASB 16 using the modified retrospective approach from 1 July 2019 and as such has not restated comparatives for the 2019 reporting period, as permitted under the specific transitional provisions. Tables and commentary included in the Directors’ Report contain comparisons for before (Pre AASB 16) and after adoption (Post AASB 16) of AASB 16 and are labelled accordingly. The following commentary makes reference to financial information for FY2020 that is Pre AASB 16. This is used as a comparison against the prior corresponding reporting period as the Directors believe this provides more meaningful comparison when understanding the operations of the Company. The table on page 22 shows a comparison of key statistics Pre AASB 16 and Post AASB 16 that are referenced in the following Operating Review. The tables on pages 24 and 25 are presented in Pre AASB 16 format.
Statutory Earnings Twelve months for the year ended
Post AASB 1612 Months
FY2020
Pre AASB 1612 Months
FY2020
Pre AASB 1612 Months
FY2019
Pre AASB 16Jun to Jun
Change
Pre AASB 16Jun to JunChange %
Tonnage t 25,566 25,566 18,849 6,717 36%Revenue(1) $M 339.9 339.9 282.0 57.9 21%
Revenue per HOG kg $/kg 13.30 13.30 14.96 (1.66) -11%EBITDA(2) $M 48.8 42.3 38.2 4.1 11%EBITDA per HOG kg $/kg 1.91 1.65 2.03 (0.38) -19%EBITDA margin % 14.4% 12.4% 13.5% -1.1% -8%EBIT $M 9.7 9.8 12.5 (2.7) -22%NPAT $M 4.9 6.5 9.5 (3.0) -32%
Fair value adjustment of Biological Assets $M 1.5 1.5 (9.1) 10.6 -116%Related income tax refund/(expense)(3) $M (0.5) (0.5) 2.7 (3.2) -119%Biological assets $M 264.0 262.8 209.1 53.7 26%
Earnings per share c 5.63 7.47 10.82 (3.35) -31%Return on assets(4) % 1.4% 1.6% 2.2% -0.7% -30%Operating cash flow $M 8.4 (4.3) 14.5 (18.8) -130%Net debt(5) $M 167.3 167.3 138.8 28.5 21%Total gearing ratio(6) % 54.3% 52.6% 44.2% 8.4% 19%
Operating Earnings FY2020 FY2020 FY2019 Change Change %
Operating EBITDA(7) $M 47.3 40.8 47.3 (6.5) -14%Operating EBIT $M 8.2 8.3 21.6 (13.3) -62%Operating NPAT(8) $M 3.9 5.5 15.9 (10.4) -65%
1 Revenue from the sale of goods.2 EBITDA is a non-IFRS financial measure which
is used to measure business performance, using net depreciation and amortisation recognised in the income statement.
3 Related income tax at current tax rate.
4 Return on Assets is measured as statutory EBIT/total assets.
5 Net Debt is total debt net of cash and cash equivalents.
6 Total Gearing Ratio is measured as debt (net of cash)/net assets.
7 Operating EBITDA excludes the impact of the Fair Value Adjustment of Biological Assets.
8 Operating NPAT excludes the impact of the Fair Value Adjustment of Biological Assets and related tax impact.
Huon Aquaculture Group Limited
Annual Report 2020
22

Summary of Operational Performance
There were many operational highlights during FY2020, a year in which the last pieces of our strategy to grow production and improve operational efficiency fell into place. These included:
» the first release of salmon from the Whale Point Salmon Nursery. The 19 Year Class average size was 20% higher on release at 282 grams and represented the first Year Class to be produced from hatchery to harvest under Huon’s upgraded infrastructure and expanded capacity.
» the stocking of East of Yellow Bluff, a new lease site 1.5km from Bruny Island, with up to 2.5 million smolt. This site is crucial in enabling Huon to complete the arrangement of all Huon marine leases in Storm Bay to meet key components of the industry biosecurity plan.
» the arrival in Hobart of the Ronja Storm, Huon’s second wellboat and the most advanced fish bathing and transportation vessel in the world.
» the launch of Hulk, Huon’s second unmanned, fully automated 600 tonne feed barge. Both barges are permanently moored in Storm Bay and supplied by the Huon Supply, a 1,000 tonne feed delivery boat.
These and other investments in new infrastructure and technology have laid the foundation for the ramp up in production that commenced in mid-2018.
Biomass in the water at 30 June 2020 was 26,429 tonnes, double the 12,960 tonnes two years earlier. This highlights the scale of Huon’s rebuild and expansion which is now being realised through the 36% increase in this year’s harvest volume. A further increase of at least 40% is expected in FY2021. The fair value of Huon’s biomass at year end increased by $53.7 million from 30 June 2019 to $262.8 million.
After a slow start to the year, with fish growth affected by health impacts from contact with jellyfish in early 2019, growth rates picked up rapidly in spring. This, together with optimal growing conditions through summer, resulted in an average weight for the year of 5.04kg – the best result in over a decade. The increased production volumes supported an 11% reduction in cost of production per HOG kg to $10.46.
However, the investment in growing and feeding the increased volume of fish placed significant demands on cash flow, particularly over the past year. Adjusted Cash Flow from Operations fell from $24.9 million to minus $1.9 million and this, combined with $21.6 million in maintenance capital expenditure, resulted in an increase in net debt from $138.8 million to $167.3 million. Repayment of debt will be a priority over the next two years.
The increase in production volume was sold into the international market with around 6% of this going to a number of contracted international retail outlets in Asia. Sales into the domestic retail channel were below the previous year due to the completion of a large MAP contract in June 2019, however good gains were made in recovering over a third of that volume through new supply agreements. The wholesale channel was heavily impacted by the restrictions imposed due to COVID-19 in the fourth quarter. Huon’s high exposure to the food service channel meant that a significant drop in sales in its wholesale market was unavoidable. While retail prices held up during this time, pricing in both the wholesale and export channels came under pressure.
Reduced pricing during the second half, particularly in Huon’s dominant wholesale and export channels, resulted in revenue increasing by only 21% against a 36% increase in tonnage. Despite lower per kg production costs, the slower rate of revenue growth resulted in operating margins being squeezed from 16.8% to 12.0% and Operating EBITDA falling by 14% to $40.8 million.
Huon’s primary focus in FY2021 will be the efficient management of the biggest harvest in its corporate history. This will be happening at a time of great economic uncertainty as the global community navigates its way through the travel and trade restrictions imposed by the pandemic. While the domestic demand for salmon is likely to recover quickly as restrictions ease, there is little certainty about how the next twelve months will play out for the global salmon market and the impact that will have on pricing.
1 Revenue from the sale of goods.2 Operating EBITDA excludes the impact of the Fair Value Adjustment of Biological Assets.3 Operating NPAT excludes the impact of the Fair Value Adjustment of Biological Assets and related tax impact.
Operating Earnings and Cash FlowSales revenue(1)
$339.9MFY2019: $282.0m
Operating NPAT(3)
$5.5MFY2019: $15.9m
Operating EBITDA(2)
$40.8MFY2019: $47.3m
Operating Cash Flow
($4.3M)FY2019: $14.5m
FY2020 Channel mix% of total revenue
FY17FY16 FY17FY16FY18 FY18FY19 FY19FY17FY16 FY17FY16FY18 FY18FY19 FY19FY20FY20 FY20 FY20 Wholesale 47% (64%) Retail: Domestic 19% (28%) Retail: International 6% (2%) Export 28% (6%)
FY20FY20
FY19
23

Biological AssetsSix months ended
30 Jun 2020
31 Dec 2019
30 Jun 2019
31 Dec 2018
Biological assets at fair value $M 262.8 251.6 209.1 228.5 Fair value adjustment (FVA) $M 28.1 52.8 26.6 60.7 Biological assets (excluding FVA) $M 234.7 198.8 182.5 167.8 Total weight of live finfish at sea t 26,429 23,001 16,886 18,939 Biological asset value/kg (live) $/kg 9.94 10.94 12.38 12.07 Fair value adjustment/kg (live) $/kg 1.06 2.30 1.58 3.21 Biological assets/kg (live) (excluding FVA) $/kg 8.88 8.64 10.81 8.86 Number of fish (harvest) 000’s 2,445 2,629 2,397 1,888 Sales volume (HOG kg) t 12,245 13,321 9,830 9,019 Average HOG weight kg 5.01 5.07 4.10 4.78 Average price/HOG kg (net sales) $/kg 13.21 13.37 14.82 15.11 Net sales $M 161.8 178.1 145.7 136.3
Fish weight and price – The fair value of biological assets rose 26% (over pcp) to $262.8 million while the value at cost rose 29% (over pcp) to $234.7 million. This reflects the significant rebuild of the biomass that commenced last year to return Huon’s production level to its long term average growth rate.
– The average value of biological assets at cost declined by 18% from $10.81/HOG kg (pcp) to $8.88/HOG kg due to lower production costs and improved growth.
– Live weight at sea increased 57% from 16,886 tonnes to 26,429 tonnes, a combination of the increased number of fish (+27%) and a 23% improvement in the average weight over pcp.
– Average harvest weight rose 22% on pcp in the second half to 5.01kg. The second half is characterised by the start of the new Year Class which typically is lower weight. The new 19 Year Class salmon has however grown exceptionally well, delivering a record harvest weight for new fish.
12.50
13.00
13.50
14.00
14.50
15.00
15.50$/HOG kg
DEC 2017 JUN 2018 DEC 2018 JUN 2019 DEC 2019 JUN 2020
kg
3.00
3.50
4.00
4.50
5.00
5.50
6.00
Average price/HOG kgAverage HOG weight (kg)
* Operating EBITDA excludes the impact of the Fair Value Adjustment of Biological Assets.
Key Financials
Operational PerformanceSix months ended
30 Jun 2020
31 Dec 2019
30 Jun 2019
31 Dec 2018
Harvest volume HOG t 12,245 13,321 9,830 9,019 Revenue from operations $M 161.8 178.1 145.7 136.3 Revenue $/HOG kg $/kg 13.21 13.37 14.82 15.11 Cost of production $M (123.6) (143.7) (112.7) (108.4)Cost of production $/HOG kg $/kg (10.09) (10.79) (11.46) (12.02)Freight and distribution $M (17.8) (14.0) (7.2) (6.3)Freight and distribution $/HOG kg $/kg (1.45) (1.05) (0.73) (0.70)Operating EBITDA* $M 20.4 20.4 25.7 21.6 Operating EBITDA $/HOG kg $/kg 1.67 1.53 2.62 2.39 Margin % 12.6% 11.5% 17.7% 15.8%Fair value adjustment $M (24.7) 26.2 (34.1) 25.0
Operational Performance – The increase in harvest volumes is the outcome of the strategy to rebuild the biomass.
– The cost of production per kg fell in the second half to $10.09 with production efficiencies and lower mortality costs compared to 2H2019 ($11.46) and a record average harvest weight (5.04kg). The cost of production could have been even lower if the harvest of the 19 Year Class salmon had not been slowed due to COVID-19.
– The majority of the increase in production was sold into the lower priced export market. This lifted the proportion of revenue exported in the second half to 27% and contributed to the 11% fall in the overall average price from $14.82 in 2H2019 to $13.21. As a result while volumes for the second half finished up 25% on pcp, revenue was up by only 11%.
– The higher proportion of exports also pushed freight costs up in the second half to $1.45/HOG kg from $0.73/HOG kg (pcp).
0
4
8
12
16$/HOG kg
Revenue Cost of production
Freight and distributionOperating EBITDA
DEC 2017 JUN 2018 DEC 2018 JUN 2019 DEC 2019 JUN 2020
Huon Aquaculture Group Limited
Annual Report 2020
24

Sales ChannelSix months ended
30 Jun 2020
31 Dec 2019
30 Jun 2019
31 Dec 2018
Wholesale HOG t 4,815 6,045 5,981 5,507 Retail Domestic HOG t 2,407 2,014 2,615 2,895 Retail International HOG t 1,032 602 288 213Export HOG t 3,991 4,661 945 405Total HOG t 12,245 13,322 9,830 9,019 Wholesale % of revenue % 42% 52% 63% 64%Retail Domestic % of revenue % 23% 16% 26% 30%Retail International % of revenue % 8% 4% 3% 2%Export % of revenue % 27% 27% 8% 4%Wholesale $/HOG kg $/kg 14.08 15.21 15.46 15.81 Retail Domestic $/HOG kg $/kg 15.30 14.43 14.30 14.21 Retail International $/HOG kg $/kg 13.14 14.43 14.06 14.08Export $/HOG kg $/kg 10.92 10.44 12.48 12.47
Distribution Channels by Price and Contribution to Sales – The increase in production has shifted the sales mix heavily towards the overseas market (34%). Pricing was unusually volatile during the year with the international salmon price falling in Q2 to its lowest point in 5 years. The international salmon market was further disrupted as the COVID-19 pandemic forced the reduction of international airfreight.
– While the wholesale market continues to be Huon’s dominant market (47%), it experienced a challenging year. First quarter sales volumes slowed due to underweight fish and pricing came under pressure in Q3 as a result of increased supply from all Tasmanian producers. In Q4 the pandemic closed restaurants and the food service sector, a large portion of Huon’s customers.
– Sales into the retail channel eased with the loss of the MAP contract in FY2019. Nevertheless most of this volume was recovered through continued supply into supermarkets outside contractual requirements as well as picking up new value added and fresh contracts.
International$/HOG kg% of sales
Wholesale DomesticRetail: Retail:
Export
0.00
4.00
8.00
12.00
16.00$/HOG kg
DEC 2017 JUN 2018 DEC 2018 JUN 2019 DEC 2019 JUN 20200%
20%
40%
60%
80%
100%% of revenue
Cash GenerationSix months ended
30 Jun 2020
31 Dec 2019
30 Jun 2019
31 Dec 2018
Operating EBITDA* $M 20.4 20.4 25.7 21.6 Cash flow from operations $M (19.2) 14.2 16.0 (1.6)Add – net interest paid $M 3.9 2.6 5.4 2.8 – tax paid/(refunded) $M (3.7) 0.3 (5.2) 7.5
Adjusted cash flow from operations $M (19.0) 17.1 16.2 8.7 EBITDA conversion % -93% 84% 63% 40%Capex $M 9.1 12.5 22.9 41.4 Cash at end of period $M 5.9 15.5 2.6 4.5
Operational Cash Flow – Cash flow was not supported by Operating EBITDA which fell 21% on FY2019 due to harvesting of the high cost 18 Year Class, the slow start to the harvest of the 19 Year Class due to COVID-19 and a reduction in the net sales price as a result of the increased weighting of sales to exports.
– Cash flow from operations was impacted by higher payments to suppliers, driven predominantly from the build of biological stock (+29%). Feed is a high proportion of this and also reflects the strong growth performance of fish. In addition fuel costs increased due to high fuel prices in the first half together with the arrival of the new wellboat in February 2020. Higher exports drove increased freight costs with the annual spend up 134% to $31.8 million in FY2020.
– Huon spent $21.6 million in capex in FY2020, focused on maintenance following the completion of all major infrastructure projects at the end of FY2019.
-20
0
20
40$M
-100%
0%
100%
200%
DEC 2017 JUN 2018 DEC 2018 JUN 2019 DEC 2019 JUN 2020
Adjusted Cash Flow from OperationsEBITDA Conversion
25

Huon Board of Directors
Neil Kearney B.Ec– Chairman– Director since August 2014
Peter Bender– Managing Director and
Chief Executive Director– Director since May 2005
Frances Bender– Non-independent Executive Director– Director since May 2005
Founder of Huon with over 30 years’ experience in fish farming operations.
Peter is responsible for the leadership, operations and strategic direction of Huon and has always been committed to delivering high quality salmon that is raised responsibly. He sets business strategy and leads the executive team to deliver growth.
He is well recognised for farming innovation both in Australia and internationally and his extensive knowledge of aquaculture coupled with a strong continuous improvement ethic is the foundation on which Huon’s success is built.
Peter is a Non-executive Director of Salmon Enterprises of Tasmania Pty Ltd.
Founder of Huon with over 30 years’ experience in fish farming operations.
Frances has been instrumental in the design of the Huon brand and its marketing direction and continues to be responsible for these areas.
Frances was a Member of the New South Wales Primary Industry Ministerial Advisor Council.
Frances’ former directorships and committees include Board member of Tasmanian Aquaculture and Fisheries Institute, member of the Huon Valley Economic Development Advisory Committee, member of Huon Valley Council Rural Health Advisory Committee, member of Tasmanian Food Industry Council and member of Tasmanian Regional Reference Group – South.
Neil has significant leadership experience in major Australian and international food companies with prior senior roles at Goodman Fielder Limited and National Foods Limited. He is currently the Non-executive Chairman of Felton Grimwade Bosisto’s Pty Ltd, a Non-executive director of Craig Mostyn Holdings Pty Ltd and a Non-executive director of Simonds Group Limited.
Neil’s most recent executive role was Chief Strategy Officer of ASX-listed company Goodman Fielder Limited from 2011–2014 and before that he was Chief Executive Officer and Managing Director of Warrnambool Cheese & Butter Factory Co. Holdings Limited from 2007–2009.
Neil has previously been a Board member for Warrnambool Cheese & Butter Factory Co. Holdings Limited and Colorpak Limited as well as being a Director of National Foods Holdings Ltd 2005–2007 and Vitasoy Australia Products Pty Ltd 1999–2007 and Non-executive director of Brainwave Australia.
Special Responsibilities– Independent Non-executive
Director – Member of the Audit and Risk
Management Committee– Member of the Remuneration and
Nomination Committee
Huon Aquaculture Group Limited
Annual Report 2020
26

Simon Lester CA, BCom, MAppFinInv– Independent Non-executive Director– Director since August 2014
Tony Dynon CPA– Independent Non-executive Director– Director since August 2016
Simon had previously been an adviser to Huon and has extensive experience within the salmon industry.
He has over 30 years’ experience in corporate finance and corporate tax, having advised the Tasmanian Government and State owned business enterprises.
His former roles include Partner at Deloitte Touche Tohmatsu and PBS Partners as well as senior management roles at Price Waterhouse and KPMG and previously held the position of Board member of CatholicCare Tasmania.
Simon is currently the Chief Risk Officer of The Royal Automobile Club of Tasmania.
He is a member of the Financial Services Institute of Australasia, Chartered Accountants Australia and New Zealand, the Tax Institute and the Australian Risk Policy Institute.
Special Responsibilities– Chairman of the Remuneration
and Nomination Committee – Member of the Audit and Risk
Management Committee
Tony has extensive leadership and finance experience gained largely in food, beverage and stockfeed businesses with senior roles in international and ASX-listed companies.
The majority of Tony’s career was with international food company H J Heinz, covering a 20 year period, including roles for Heinz Australia as Joint Managing director from 1994 to 1997 and Chief Financial Officer from 1988 to 1994. He was also Managing Director of Farm Pride Foods Ltd and Executive Chairman of Palm Springs Ltd, both ASX listed companies.
More recently Tony has had leadership roles in privately owned stockfeed businesses based in Australia, New Zealand and the UK. Tony was also a Non-executive director for Colorpak Ltd from 2004 to 2010 and a Non-executive director of Murray River Organics Limited from 2019 to 2020.
Tony is a member of CPA Australia.
Special Responsibilities– Chairman of the Audit and Risk
Management Committee – Member of the Remuneration and
Nomination Committee
27

28
Annual Report 2020
Huon Aquaculture Group Limited

DirectorsThe Directors of the Company during the whole of the financial year and up to the date of this report are as follows:
– Neil Kearney, Chairman – Peter Bender, Managing Director and
Chief Executive Officer– Frances Bender– Simon Lester– Tony Dynon
The qualification, experiences and special responsibilities of the Directors are provided on pages 26 to 27.
Directors’ InterestsParticulars of Directors’ interests as at 30 June 2020 were:
ShareholdingsOrdinary
SharesPerformance
Rights
Peter Bender(i) 57,872,875 228,624Frances Bender(i) 57,872,875 –Neil Kearney 6,316 –Simon Lester 14,516 –Tony Dynon 6,080 –
(i) Includes direct and indirect interests.
Company SecretaryThomas Haselgrove B.Ec. CA
Thomas Haselgrove is the Chief Financial Officer and Company Secretary with 28 years’ experience in audit, statutory accounting and commerce across a number of organisations including Ernst & Young, and in the food, beverage and FMCG sectors, including Southcorp Wines and Chiquita Brands. Thomas was appointed Company Secretary in 2006.
Principal ActivitiesDuring the year the principal activities of the Consolidated Group were hatching, farming, processing, sales and marketing of Atlantic salmon and ocean trout.
There were no significant changes in the nature of the activities of the Consolidated Group during the year.
DividendsDividends paid to members during the financial year were as follows:
$’000
Final ordinary dividend for the year ended 30 June 2019 of 3.0 cents (2018 – 5.0 cents) per ordinary share paid on 17 October 2019 2,620Interim ordinary dividend for the year ended 30 June 2020 of nil cents (2019 – 3.0 cents) per ordinary share Nil
The Directors have not recommended the payment of a final ordinary dividend for the year ending 30 June 2020.
Review of OperationsInformation on the operations and financial position of the Consolidated Group, and the Business Strategy and outlook are set out in the Chairman’s and Managing Director’s Review on pages 2 to 3 and the Review of Operations on pages 4 to 8 of this Annual Report.
Changes in State of AffairsThere have been no significant changes in the state of affairs of the Consolidated Group during the financial year.
Matters Subsequent to the end of the Financial YearNo matter or circumstance has arisen since 30 June 2020 that has significantly affected the group’s operations, results or state of affairs, or may do so in future years.
Future DevelopmentsLikely developments for the Consolidated Group are addressed through the Company’s Business Strategy. Further information on these developments are included in the Chairman’s and Managing Director’s Review and the Review of Operations.
Directors’ Report
The Directors of Huon present the annual financial report of the consolidated entity consisting of the Company and the entities it controlled (Consolidated Group) for the financial year ended 30 June 2020.
29

Directors’ and Directors’ MeetingsThe following table sets out the number of Directors’ meetings (including meetings of Committees of Directors) held during the financial year and the number of meetings attended by each Director (while they were a Director or Committee Member).
Board of Directors meetings
Audit and Risk Management Committee
meetings
Remuneration and Nominations Committee
meetings
DirectorNumber
HeldNumber
AttendedNumber
HeldNumber
AttendedNumber
HeldNumber
Attended
Neil Kearney 11 11 5 5 3 3Peter Bender 11 11 * * * *Frances Bender 11 11 * * * *Simon Lester 11 11 5 5 3 3Tony Dynon 11 11 5 5 3 3
* Not a member of the Committee
Share Options and Performance RightsDuring or since the end of the financial year, 219,944 performance rights were granted to Directors and Key Management Personnel. Refer to the remuneration report for further details of the performance rights granted and outstanding.
Environmental RegulationThe Consolidated Group is subject to significant regulation at both State and Commonwealth levels in respect of its hatchery operations, marine operations, land and use tenure and environmental requirements. This includes specific environmental permits, licences and statutory authorisations, trade and export and workplace health and safety.
The Consolidated Group has well established management frameworks for routinely and regularly monitoring compliance with the relevant regulatory requirements and to monitor and manage environmental compliance in relation to new regulations as they come into effect. Compliance within the regulatory framework is routinely reported to the Board.
The Consolidated Group employs a cross-functional team to manage compliance within the regulatory framework and guide a strategy of continuous improvement in environmental management and sustainability.
Further details regarding the Consolidated Group’s sustainability and environmental management credentials and policies are outlined in the Chairman’s and Managing Director’s Review and the Review of Operations.
During the prior year the Company was issued with a complaint summons alleging a number of breaches of the requirements relating to the operation of an Environmental Protection Notice at the Port Huon net processing site during 2018. On 4 May 2020 Huon Aquaculture Company Pty Ltd was fined $40,000 in the Hobart Magistrates Court for one charge of depositing a pollutant in a place where it could reasonably be expected to cause material environmental harm and five charges of contravening conditions of its Environment Protection Notice at its Whale Point net wash facility in early 2018. Huon Aquaculture Company Pty Ltd had pled guilty to the charges which were laid under the Environmental Management and Pollution Control Act 1994.
The Court made no finding of environmental harm and commented that this was not a case where it was alleged that Huon Aquaculture Company Pty Ltd offended to actively avoid environmental regulations. The Court noted that Huon Aquaculture Company Pty Ltd had taken active steps to improve processes in order to avoid future breaches.
During the prior year the Company was issued with a complaint summons alleging a diesel spill at one of the Company’s marine lease sites during 2017. During the year that complaint was withdrawn.
The Directors are not aware of any other significant environmental incidents arising from the operations of the Consolidated Group during the financial year and believe that all regulations have otherwise been materially met during the period covered by the Annual Report.
Huon Aquaculture Group Limited
Annual Report 2020
30
Directors’ Report
continued

IntroductionThis Remuneration Report for the financial year ended 30 June 2020 outlines the Company’s remuneration structure in accordance with the requirements of the Corporations Act 2001 (Cth) (the Act), and the Corporations Regulations 2001 (Cth). This report provides remuneration information in relation to the Company’s Key Management Personnel (KMP) including for the Non-executive Directors (NEDs), Executive Directors (EDs), and Executive Management Group (EMG). KMP are those persons having authority and responsibility for planning, directing and controlling the activities of the Company, directly or indirectly, including any director (whether executive or otherwise) of the Company. This Remuneration Report has been audited as required by section 308(3C) of the Act.
Key Management Personnel (KMP)The table below outlines the KMP for the financial year ended 30 June 2020 unless otherwise indicated.
Executive Directors – Peter Bender (Managing Director and Chief Executive Officer)
– Frances Bender (Executive Director)
Non-executive Directors – Neil Kearney (Chairman and Non-executive Director) – Simon Lester (Non-executive Director)
– Tony Dynon (Non-executive Director)
Executive Management Group – Philip Wiese (Deputy Chief Executive Officer)
– Thomas Haselgrove (Chief Financial Officer and Company Secretary)
– David Morehead (General Manager Marine Operations)
– Charles Hughes (General Manager Commercial and Planning)
– David Mitchell (General Manager Freshwater Operations)
– Anthony Baker (General Manager People, Safety and Sustainability) (from March 2020)
Remuneration GovernanceHuon’s remuneration framework, policies and practices are designed to create value for shareholders by ensuring the Company attracts, rewards and retains employees responsibly and fairly, with a focus on business outcomes, individual performance, the organisation’s risk management framework, and applicable regulations. Remuneration Policy is reviewed annually. Further information on the Company’s Remuneration Policy can be viewed on the Company website.
Remuneration and Nomination Committee (RNC)The Remuneration and Nomination Committee (RNC) comprises of three independent NEDs (including the Chairman). As at 30 June 2020 the RNC comprised Simon Lester (Chairman), Neil Kearney and Tony Dynon.
The RNC has the responsibility for delivering remuneration recommendations to the Board to ensure that the Company is adopting appropriate and coherent remuneration policies that will attract, motivate and retain qualified and experienced KMP of the highest calibre.
The Board reviews and, where appropriate, approves the remuneration arrangements of the KMP after considering the recommendations of the RNC (including awards made under the short term incentive (STI) plans and long term incentive (LTI) plans). The Board also sets the combined remuneration pool for NEDs which is subject to shareholder approval. The RNC approves the level of the Consolidated Group’s STI plan pool, having regard to recommendations made by the CEO. The RNC meets throughout the year and the CEO and/or DCEO attends these meetings (by invitation only) when management input is required. The CEO is not present during discussions relating to his own remuneration.
The RNC reviews the performance of KMP and reviews the assessment processes to ensure alignment of assessments towards the execution of the Company’s strategy. The RNC’s Charter can be viewed on the Company website.
Use Remuneration ConsultantsFrom time to time the Board directly engage external advisers to provide input into the Company’s remuneration policies and into the process of reviewing KMP remuneration arrangements. During the current year the RNC engaged Godfrey Remuneration Group to provide market data, analysis, modelling and recommendations on executive and non-executive remuneration. Godfrey Remuneration Group was paid $39,425 for these services.
Securities Trading PolicyA Securities Trading Policy is in place to ensure that employees understand their obligation in relation to dealing in Huon shares. Huon Directors and all employees must comply with the insider trading prohibitions of the Corporations Act 2001. The policy imposes share trading blackouts on Directors and Restricted Employees prior to financial results announcements and other times as required. In addition, Directors and Restricted Employees with potential access to inside information are required to seek approval before dealing in Huon shares. The policy also restricts employees from entering into transactions which limit their economic risks, including in relation to the long term incentive (LTI) plans. The Securities Trading Policy can be viewed on the Company website.
Remuneration Report
31

KMP Remuneration Arrangements – Executive Directors and Executive Management GroupThe following information relates to the remuneration arrangements for the Executive Directors and Executive Management Group KMP. The NEDs remuneration structure is a separate and distinct framework in accordance with best practice corporate governance and is detailed in a separate section of this Remuneration Report.
Remuneration Principles and Strategy Huon’s Remuneration Strategy is designed to attract, motivate and retain qualified and experienced KMP and align the interests of KMP with Huon’s shareholders. Huon’s objective is to build long-term shareholder value by continuing to be a recognised leader in the aquaculture industry though sustained growth and continuous improvement as a Tasmanian producer of world class salmon. Huon sees the retention of KMP as crucial to achieving this objective.
Remuneration consists of Fixed Remuneration and performance based remuneration. Payments and awards of performance based remuneration under the STI Cash bonus plan and, in certain circumstances, under the LTI Performance Rights plan, are subject to Board discretion as well as being subject to performance targets being met.
In the event of serious misconduct or a material misstatement in the Company’s financial statements the Remuneration Committee can cancel or defer performance-based remuneration and may also claw back performance-based remuneration paid in previous financial years.
Components of RemunerationIn the financial year ended 30 June 2020, the KMP remuneration structure comprised of market competitive fixed and variable remuneration including STI and LTI plans as detailed in the following table:
Component Performance MeasuresWeighting as % of TFR Link to Performance
Fixed remuneration includes base salary, superannuation contributions, long service and annual leave and other benefits
Multiple sources of data used to determine annual changes in fixed remuneration including competitive market data and each individuals performance and contribution during the year
N/A Consolidated Group performance as well as individual performance are considered during the annual remuneration review of fixed remuneration
STI Cash bonus – Operating earnings (earnings excluding adjustments for biological assets) before interest, tax, depreciation and amortisation (80%)
– Lost time injury frequency rate (20%)
– DCEO Target = 40%
– EMG Target = 30%
To provide short term incentive for KMP to remain in the Company and to recognise and reward contribution to short-term Company outcomes
LTI Performance Rights – Operating earnings (earnings excluding adjustments for biological assets) per share growth (50%)
– Return on assets (50%)
– MD/CEO Target = 100%
– DCEO Target = 40%
– EMG Target = 30%
The LTI plan provides a reward to KMP for their contribution to the achievement of forecasted objectives and long term shareholder value. The LTI plan also rewards KMP for their continued service with the Company and seeks to retain KMP in the long-term
Huon Aquaculture Group Limited
Annual Report 2020
32
Directors’ Report
Remuneration Report continued

Remuneration Overview Huon aims to attract, motivate and retain qualified and experienced KMP by aligning KMP interests with those of shareholders and by providing reward through market competitive fixed and variable remuneration. The proportion of fixed and variable remuneration is established for KMP by Board approval following recommendations from the RNC.
The following summarises the target remuneration mix of KMP for the financial year ended 30 June 2019 and 2020:
Fixed Target STI Target LTI Total %
Chief Executive Officer 50% – 50% 100%Executive Director 100% – – 100%Deputy Chief Executive Officer 56% 22% 22% 100%Executive Management Group 62% 19% 19% 100%
The percentages in this table are based on a split of fixed remuneration and incentives for achieving STI and LTI plan targets as determined by the Board.
Fixed RemunerationTotal Fixed Remuneration (TFR) includes base salary, superannuation contributions, long service and annual leave and other benefits (such as termination benefits).
Remuneration levels are reviewed annually to ensure KMP are offered market competitive fixed remuneration that reflects the responsibility, qualifications and experience required of the KMP.
There are a range of fringe benefits which KMP can incorporate into the total cost of their remuneration package. These fringe benefits may include, but are not limited to, motor vehicles and car parking. Whatever the cash component and fringe benefit value, the total employment cost of any KMP remuneration package is taken into account when determining fixed annual remuneration for KMP.
Details of 2019 and 2020 fixed remuneration levels are provided below:
Fixed remuneration
KMP2020
$2019
$
Peter Bender 626,044 667,873Frances Bender 208,553 215,302Philip Wiese 569,096 547,173Thomas Haselgrove 355,662 310,894David Morehead 335,787 331,113Charles Hughes 300,787 288,857David Mitchell 323,479 295,816Anthony Baker(i) 99,266 –
(i) From March 2020.
33

Variable Remuneration – STI PlanKMP except for the CEO, Executive Director and Non-Executive Directors are eligible to participate in Huon’s STI plan. Huon’s annual STI plan is designed to recognise the contribution and achievement of financial and operational targets as determined by the Board and CEO.
The target annual STI that may be awarded to KMP is expressed as a percentage of their respective TFR.
Key Features of STI Plan
Who participates? KMP (Except for the CEO, Executive Director and Non-Executive Directors).How is STI plan delivered?
Payment of cash incentive.
Payment will be made subject to Board discretion and subject to performance targets being met.What is the STI plan opportunity?
An opportunity for KMP (except CEO, Executive Director and Non-Executive Directors) to earn an annual incentive payment calculated as a percentage of their annual fixed remuneration conditional on the achievement of financial and non-financial measures. Target STI maximum opportunity of 40% of fixed remuneration for the DCEO and maximum opportunity of 30% of fixed remuneration for the EMG.
What are the performance conditions for FY2020?
Actual STI plan payments awarded to each member of KMP depend on the extent to which specific targets set at the beginning of the financial year are met. The CEO, Executive Director and Non-Executive Directors do not participate in the STI Plan. The target consists of key performance indicators (KPIs) including financial objectives. For FY2020 the performance measures under the STI plan were as follows: – Operating earnings (earnings excluding adjustment for biological assets) before interest, tax, depreciation and amortisation
– Lost time injury frequency rate.Why the financial measures were chosen?
The financial and operational measures were chosen as they represent the key drivers for the short term success of Huon’s business and provide a framework for delivery of long term value to shareholders from Huon’s strategy.
How is performance assessed?
The RNC considers the performance against financial and operational targets at the end of the financial year (with the financial target calculations based on audited accounts) and makes recommendations to the Board for the amount, if any, to be paid to the KMP.
What happens if KMP leave?
Where cessation of employment occurs, the Board may determine the treatment of any award that has been granted to KMP in accordance with Plan Rules which may include forfeiture.
The Board has discretion to award an STI plan amount on a pro-rata basis taking into account time and current level of performance of the KMP against the performance hurdles.
The following table represents the target annual STI opportunity as a percentage of TFR for KMP in 2019 and 2020.
KMP
STI value as % of
TFR 2020
STI value as % of
TFR 2019
Philip Wiese 40% 40%Thomas Haselgrove 30% 30%David Morehead 30% 30%Charles Hughes 30% 30%David Mitchell 30% 30%Anthony Baker(i) 30% –
(i) From March 2020.
Huon Aquaculture Group Limited
Annual Report 2020
34
Directors’ Report
Remuneration Report continued

Variable Remuneration – LTI Plan Huon’s LTI plan applies to KMP (except for the Executive Director and Non-Executive Directors) and is designed to align remuneration with long term shareholder value and assist in the motivation, retention and reward of KMP. The RNC reviews all LTI plan offers made to KMP. Shareholder approval is obtained before any LTI plan grants are made to the CEO in accordance with ASX Listing Rules.
Key Features of the LTI Plan
Who participates? KMP (except for the Executive Director and Non-Executive Directors).How is the LTI plan delivered?
Granting of performance rights to KMP. These rights provide the KMP with the ability to convert the rights to ordinary shares of the Group upon meeting the performance conditions.
What are the performance hurdles under the FY2020 LTI performance rights grant?
Performance rights issued under the FY2020 LTI Plan are subject to two separate performance measures:
– 50% of the performance rights will be subject to a vesting condition based on earnings per share compound annual growth rate (EPS CAGR) over the performance period; and
– 50% of the performance rights will be subject to a vesting condition based on return on assets (ROA) over the performance period.
Both performance hurdles have threshold levels which need to be achieved before vesting commences. Details of these hurdles and thresholds are outlined in the following section.
When do the FY2020 LTI plan performance rights vest?
The performance period for the 2020 LTI plan is the period from 1 July 2019 to 30 June 2022. The performance rights granted will vest subject to the performance hurdles associated with the grant and to the extent that certain performance based conditions are achieved in the relevant performance period.
Performance rights that have vested may be exercised until the applicable expiry date. If any shares are issued following exercise of a vested performance right prior to the applicable expiry date then they may not be sold or transferred before 1 July 2022.
How are grants treated on termination?
Where cessation of a KMP’s employment occurs, any unvested LTI plan performance rights (or vested and unexercised performance rights) are forfeited, unless deemed otherwise by the Board.
For any other reason, the Board may at its discretion retain a pro-rated (based on time) portion of awards on-foot and subject to original performance hurdles.
How are grants treated if a change of control occurs?
In the event of a change of control, the performance rights may vest at the Board’s discretion. In determining whether to exercise its discretion, the Board will have regard to all relevant circumstances, including the level of satisfaction of the performance conditions over the performance period from the grant date to the date of the relevant change in control event.
If a company obtains control of the Company as a result of a takeover bid or another corporate action, the company acquiring control (Acquiring Company) and the KMPs may agree together that on the vesting of performance rights, the KMP receive shares in the Acquiring Company in lieu of shares in the Company, on substantially the same terms as before.
Do participants receive distributions or dividends on unvested LTI grants?
Participants do not receive distribution or dividends on unvested LTI plan grants.
35

The following table represents the annual LTI allocation as a percentage of TFR for KMP in 2019 and 2020:
KMP
LTI value as % of
2020
LTI value as % of
2019
Peter Bender 100% 100%Philip Wiese 40% 40%Thomas Haselgrove 30% 30%David Morehead 30% 30%Charles Hughes 30% 30%David Mitchell 30% 30%Anthony Baker(i) 30% –
(i) From March 2020.
2020 LTI Plan Hurdles explainedPerformance rights issued under the 2020 LTI Plan are subject to two separate performance measures: 50 percent of the performance rights will be subject to an EPS CAGR vesting condition; and 50 percent will be subject to a ROA vesting condition. These performance hurdles were chosen by the Board as they believe both EPS CAGR and ROA are transparent, well understood and appropriate mechanisms to measure performance and provide a strong link between KMP reward and shareholder wealth creation. Both hurdles are explained in more detail below:
EPS compound annual growth rate (‘CAGR’) Vesting outcome
Less than 7.5% CAGR Nil7.5% CAGR 50%Above 7.5% CAGR but below 10% CAGR Pro-rata from 50-99%10% CAGR or greater 100%
Earnings per share compound annual growth is calculated as the net profit after income tax (NPAT) (excluding adjustment for biological assets) divided by the weighted average number of ordinary shares on issue. Compared to an absolute profit measure, EPS takes into account changes in the equity base and for this reason it is preferred to other profit based metrics.
ROA (return for the reporting period) Vesting outcome
Less than 10% return Nil10% return 50%Above 10% return but below 15% return Pro-rata from 50-99%15% return or greater 100%
Return on assets (ROA) is calculated as statutory earnings before interest and tax (EBIT) (excluding adjustment for biological assets), divided by total assets excluding cash and fair value adjustment on biological assets (average of opening and closing balance). ROA is an appropriate measure for asset intensive industries which reinforces the need to invest capital on projects with a superior return.
Huon Aquaculture Group Limited
Annual Report 2020
36
Directors’ Report
Remuneration Report continued

KMP Remuneration Outcomes (Including Link to Performance)
Huon’s Financial and Operational Performance
Performance measure Unit 2020(i) 2019 2018 2017
Operating earnings before interest, tax, depreciation and amortisation (EBITDA) $m 40.8 47.3 71.8 62.8Cash flow from operations (CF) $m (5.0) 14.5 57.9 54.0Lost Time Injury Frequency Rate (LTIFR)(ii) hours/million 5 4 4 3Earnings per share (EPS) (Operating)(iii) Cents 6.26 18.13 40.53 32.90Return on Assets (ROA) (Operating)(iv) % 1.4% 4.1% 10.4% 10.2%Dividend $m 2.6 5.2 8.7 4.4Dividend payout ratio (Operating) % 47.9% 33.1% 24.7% 15.2%Share price (30 June) $ 2.92 4.50 4.46 4.93
(i) Performance measures before the adoption of AASB16 (Pre AASB16).
(ii) Long term injury frequency rate is the number of lost time injuries within a given year relative to the total number of hours worked in the same period multiplied by 1 million).
(iii) Earnings per share compound annual growth is calculated as the net profit after income tax (NPAT) (excluding adjustment for biological assets) divided by the weighted average number of ordinary shares on issue.
(iv) Return on assets (ROA) is calculated as statutory earnings before interest and tax (EBIT) (excluding adjustment for biological assets), divided by total assets excluding cash and fair value adjustment on biological assets (average of opening and closing balance).
Consolidated Group performance and its link to STI
Performance against STI plan targetsThe following table shows the Company’s 2020 STI performance scorecard measures, weightings and outcomes as applied to the KMP.
Performance Measures Description Weighting Outcome Comment
Operating earnings before interest, tax, depreciation and amortisation (Operating EBITDA)
Statutory EBITDA excluding adjustment for biological assets.
80% Target not achieved
Operating EBITDA is seen as a good guide of the current trading performance of the Company as it is the profitability adjusted for finance cost and reinvestment in assets
Lost time injury frequency rate (LTIFR)
Lost time injury frequency rates are the number of lost time injuries within a given year relative to the total number of hours worked in the same period multiplied by 1 million.
20% Target not achieved
Staff are a key asset to Huon and as such their safety is paramount. A reduction in LTIFR is a key part of the safety program.
STI Outcomes for KMP for 2020The following table provides a summary of STI outcomes and payments for the 2020 performance year.
KMPSTI target
$
Target STI as %
of TFR
Total STIForegone
$
Total STIforfeited
$
Total STIachieved
as % of STI target
Philip Wiese 182,409 40% – 182,409 0%Thomas Haselgrove 85,409 30% – 85,409 0%David Morehead 85,414 30% – 85,414 0%Charles Hughes 78,436 30% – 78,436 0%David Mitchell 78,436 30% – 78,436 0%Anthony Baker 68,058 30% – 68,058 0%
37

Consolidated Group performance and its link to LTI
Performance Against LTI Plan TargetsThe following table shows the performance periods and outcomes for the 2017 LTI Plan which covers the performance period 1 July 2017 to 30 June 2020 and is assessed in FY2020. The total vesting outcome for the three year period is 9.0% of performance rights issued. Any performance rights under the 2017 LTI Plan that do not vest as result of the vesting outcomes will lapse.
The 2018 and 2019 LTI Plans will be assessed against their performance periods and outcomes at the completion of FY2021 and FY2022 respectively:
LTI Plan Performance Period/Outcome Measure FY2018 FY2019 FY2020 Vesting %
2017 Measure
EPS (cents)EPS (CAGR)
ROA (%)
40.53c23.2%10.4%
18.13c(25.8%)
4.1%
6.26c(42.5%)
1.4%Outcome EPS N/A N/A 0% 0%1 July 2017 – 30 June 2020 ROA 54% 0% 0% 18%
LTI transactions for KMP for 2020The following table details the Performance Rights made to KMP during FY2020.
KMP – Performance rights granted Grant dateUnits
grantedFair value(i)
$
Total fair value of grant
2020$
Peter Bender 23 Oct 2019 111,337 4.30 478,640Philip Wiese 23 Oct 2019 38,837 4.30 166,961Thomas Haselgrove 23 Oct 2019 18,184 4.30 78,173David Morehead 23 Oct 2019 18,186 4.30 78,182Charles Hughes 23 Oct 2019 16,700 4.30 71,794David Mitchell 23 Oct 2019 16,700 4.30 71,794Anthony Baker 23 Oct 2019 14,490 4.30 62,293
(i) Fair value has been rounded to 2 decimal places.
KMP – Performance rights heldThe following table details the Performance Rights held and the movement during FY2020.
Name Grant Date
Held at Start of Year Other
GrantedDuring
Year Forfeited Vested
Unvested at End
of Year
Peter Bender – 30 November 2016 96,856 – – – (96,856) – – 30 November 2017 96,575 – – (87,883) – 8,692 – 31 October 2018 108,595 – – – – 108,595 – 23 October 2019 – – 111,337 – – 111,337
Philip Wiese – 30 November 2016 29,273 – – – (29,273) – – 30 November 2017 29,186 – – (26,559) – 2,627 – 31 October 2018 32,819 – – – – 32,819 – 23 October 2019 – – 38,837 – – 38,837
Thomas Haselgrove – 30 November 2016 15,820 – – – (15,820) – – 30 November 2017 15,773 – – (14,353) – 1,420 – 31 October 2018 17,737 – – – – 17,737 – 23 October 2019 – – 18,184 – – 18,184
Huon Aquaculture Group Limited
Annual Report 2020
38
Directors’ Report
Remuneration Report continued

KMP – Performance rights held (continued)
Name Grant Date
Held at Start of Year Other
GrantedDuring
Year Forfeited Vested
Unvested at End
of Year
David Morehead – 30 November 2016 15,821 – – – (15,821) – – 30 November 2017 15,774 – – (14,354) – 1,420 – 31 October 2018 17,738 – – – – 17,738 – 23 October 2019 – – 18,186 – – 18,186
Charles Hughes – 30 November 2016 14,528 – – – (14,528) – – 30 November 2017 14,486 – – (13,182) – 1,304 – 31 October 2018 16,289 – – – – 16,289 – 23 October 2019 – – 16,700 – – 16,700
David Mitchell – 30 November 2016 14,528 – – – (14,528) – – 30 November 2017 14,486 – – (13,182) – 1,304 – 31 October 2018 16,289 – – – – 16,289 – 23 October 2019 – – 16,700 – – 16,700
Anthony Baker – 30 November 2016 6,720 – – – (6,720) – – 30 November 2017 9,663 – – (8,793) – 870 – 31 October 2018 11,604 – – – – 11,604 – 23 October 2019 – – 14,490 – – 14,490
KMP Contracts Remuneration arrangements for KMP (excluding NEDs) are formalised in employment agreements. The following section of this Remuneration Report outlines key contractual details for Executives and KMP.
Contractual arrangementsThe following table shows the key contractual arrangements for KMP:
KMP Member Contract Type
Fixed Remuneration(i)
$Access to STI
Access to LTI
Peter Bender Ongoing contract 522,926 No YesFrances Bender Ongoing contract 169,915 No NoPhilip Wiese Ongoing contract 456,022 Yes YesThomas Haselgrove Ongoing contract 284,696 Yes YesDavid Morehead Ongoing contract 284,714 Yes YesCharles Hughes Ongoing contract 261,454 Yes YesDavid Mitchell Ongoing contract 261,454 Yes YesAnthony Baker Ongoing contract 261,454 Yes Yes
(i) Superannuation is paid in addition to fixed remuneration.
39
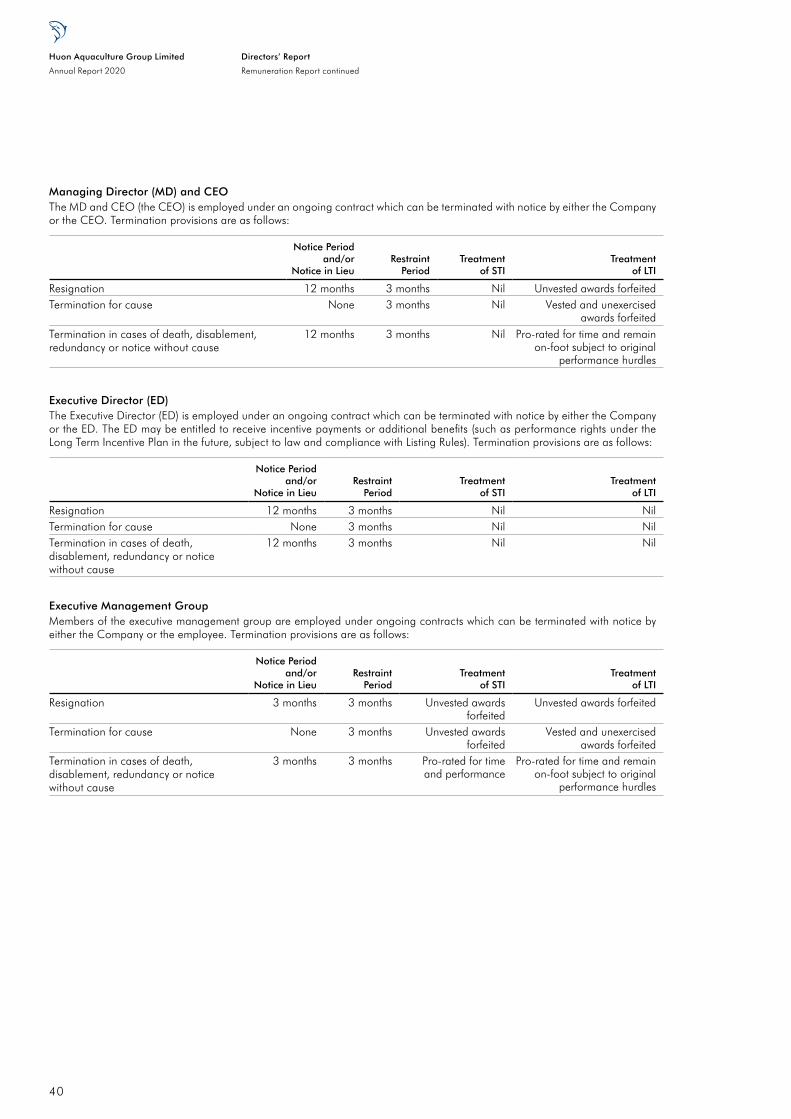
Managing Director (MD) and CEOThe MD and CEO (the CEO) is employed under an ongoing contract which can be terminated with notice by either the Company or the CEO. Termination provisions are as follows:
Notice Periodand/or
Notice in LieuRestraint
PeriodTreatment
of STITreatment
of LTI
Resignation 12 months 3 months Nil Unvested awards forfeitedTermination for cause None 3 months Nil Vested and unexercised
awards forfeitedTermination in cases of death, disablement, redundancy or notice without cause
12 months 3 months Nil Pro-rated for time and remain on-foot subject to original
performance hurdles
Executive Director (ED)The Executive Director (ED) is employed under an ongoing contract which can be terminated with notice by either the Company or the ED. The ED may be entitled to receive incentive payments or additional benefits (such as performance rights under the Long Term Incentive Plan in the future, subject to law and compliance with Listing Rules). Termination provisions are as follows:
Notice Periodand/or
Notice in LieuRestraint
PeriodTreatment
of STITreatment
of LTI
Resignation 12 months 3 months Nil NilTermination for cause None 3 months Nil NilTermination in cases of death, disablement, redundancy or notice without cause
12 months 3 months Nil Nil
Executive Management Group Members of the executive management group are employed under ongoing contracts which can be terminated with notice by either the Company or the employee. Termination provisions are as follows:
Notice Periodand/or
Notice in LieuRestraint
PeriodTreatment
of STITreatment
of LTI
Resignation 3 months 3 months Unvested awards forfeited
Unvested awards forfeited
Termination for cause None 3 months Unvested awards forfeited
Vested and unexercised awards forfeited
Termination in cases of death, disablement, redundancy or notice without cause
3 months 3 months Pro-rated for time and performance
Pro-rated for time and remain on-foot subject to original
performance hurdles
Huon Aquaculture Group Limited
Annual Report 2020
40
Directors’ Report
Remuneration Report continued

KMP Remuneration for the Financial Year ended 30 June 2020The following table of KMP remuneration has been prepared in accordance with accounting standards and the Corporations Act 2001 requirements. The amounts shown relating to share based remuneration are equal to the accounting expense recognised in the Company’s financial statements in respect of the LTI grants to KMP. The amounts disclosed do not reflect the actual cash amount received in this year or in future years:
Fixed Remuneration Variable Remuneration
Year
Salary and Fees
$
Non-Monetary
$Other
$
Long Service and
AnnualLeave
$
Super-annuation
$
Cash Bonus
$
PerformanceRights(i)
$Total
$
Performancerelated
%
Executive DirectorsPeter Bender2020 568,050 15,324 – 16,708 25,962 – 73,905 699,949 11%2019 532,042 15,218 – 97,301 23,312 – 253,470 921,343 28%Frances Bender2020 176,260 – – 6,340 25,953 – – 208,553 0%2019 164,797 – – 24,755 25,750 – – 215,302 0%
Key Management Personnel
Philip Wiese2020 516,693 28,937 – (573) 24,039 – 27,541 596,637 5%2019 476,303 16,194 – 30,481 24,195 – 76,600 623,773 12%Thomas Haselgrove2020 248,729 45,817 – 35,108 26,008 – 12,071 367,733 3%2019 224,745 51,374 – 9,747 25,028 – 41,398 352,292 12%David Morehead2020 295,345 – – 12,384 28,058 – 12,073 347,860 3%2019 276,137 – – 28,743 26,233 – 41,400 372,513 11%Charles Hughes2020 291,329 – – (14,397) 23,855 – 11,085 311,872 4%2019 253,578 – – 11,189 24,090 – 38,019 326,876 12%David Mitchell2020 271,217 – – 26,496 25,766 – 11,085 334,564 3%2019 253,578 – – 18,148 24,090 – 38,019 333,835 11%Anthony Baker (from March 2020)2020 78,085 4,572 – 8,757 7,852 – 3,830 103,096 4%2019 – – – – – – – – –
Total
2020 2,445,708 94,650 – 90,823 187,493 – 151,590 2,970,264 5%2019 2,181,180 82,786 – 220,364 172,698 – 488,906 3,145,934 16%
(i) Amounts recognised for Performance Rights relate to the expense recognised for the period.
41

Non-executive Director (NED) RemunerationThe RNC seeks to set a combined remuneration level that provides the Company with the capability to attract and retain NEDs of the highest calibre and meets acceptable costing levels for shareholders.
The combined remuneration level sought to be approved by shareholders and the NED fee structure will be reviewed annually against fees paid to NEDs from equivalent companies (S&P ASX 200 listed companies with market capitalisation of 50% to 200% of the Company as well as similar sized industry comparators). The RNC may also take advice from independent remuneration consultants when undertaking the annual review process.
The Company’s Constitution stipulates that the Board shall determine the total amount paid to each NED as remuneration for their services to the Company. Under the ASX Listing Rules, the total amount of fees paid to NEDs must not, in any financial year, exceed the amount determined by the Company in a general meeting or until so determined by the Board. This amount has been determined by the Board to be $800,000.
NEDs receive a Board fee and fees for chairing or participating on Board Committees (refer table below). NEDs do not receive remuneration that is calculated as a commission or a percentage of operating revenue or profits. Superannuation is included in all NED remuneration. NEDs do not participate in any incentive programs.
From 1 September
2017 $
From 1 August
2014 $
Base feeChair (no other fees receivable) 160,000 160,000Other non-executive directors 70,000 70,000Additional feesAudit and Risk Management Committee – Chair 20,000 20,000Audit and Risk Management Committee – member 10,000 –Remuneration and Nomination Committee – Chair 20,000 20,000Remuneration and Nomination Committee – member 10,000 –
Non-executive Directors– Neil Kearney (Chairman and Non-executive Director)– Simon Lester (Non-executive Director)– Tony Dynon (Non-executive Director)
The table below shows the actual NED remuneration for FY2019 and FY2020.
Base$
ARC$
RNC$
Super-annuation
$Total
$
Neil Kearney (Chairman)2020 146,119 – – 13,881 160,0002019 146,119 – – 13,881 160,000Simon Lester2020 61,324 10,000 20,000 8,676 100,0002019 61,324 10,000 20,000 8,676 100,000Tony Dynon2020 61,324 20,000 10,000 8,676 100,0002019 61,324 20,000 10,000 8,676 100,000Total Non-executive Director remuneration2020 268,767 30,000 30,000 31,233 360,0002019 268,767 30,000 30,000 31,233 360,000
Huon Aquaculture Group Limited
Annual Report 2020
42
Directors’ Report
Remuneration Report continued

Director and KMP ShareholdingsThe table below refers to shareholdings of Directors, KMP and their related parties.
Balance at start of
FY2020
Acquired during
FY2020
Received on vesting of rights
to deferred shares
Other changes
during FY2020
Balance at end of FY2020
Neil Kearney(i) 6,316 – – – 6,316Simon Lester(i) 14,516 – – – 14,516Tony Dynon(i) 6,080 – – – 6,080Peter Bender 13,160,973 – 96,856 – 13,257,829Frances Bender 5,794 – – – 5,794Peter and Frances Bender(i) 44,609,252 – – – 44,609,252Philip Wiese(i) 33,157 – 29,273 (28,343) 34,087Thomas Haselgrove 25,222 – 15,820 – 41,042David Morehead 22,809 – 15,821 – 38,630Charles Hughes(i) 15,973 – 14,528 (15,973) 14,528David Mitchell 16,218 – 14,528 – 30,746Anthony Baker – – 6,720 – 6,720
(i) Includes indirect holdings.
Transactions with KMP and their Related Parties
Loans to KMP and their Related Parties The Company has not issued any loans to its Directors or KMP or their related parties.
Other Transactions and Balances with KMP and their Related Parties
Related Entity Name Relevant KMP Nature of transaction
Amount transacted during the financial
year period $
James Bender Contracting Pty Ltd (JBC)* Peter, Frances Bender Lease of equipment to Huon 597,416PAB Contracting Pty Ltd (PAB)* Peter, Frances Bender Lease of equipment to Huon 96,000
* Based on commercial terms.
43

Indemnification of Directors, Officers and AuditorsThe Company indemnifies current and former Directors and officers for any loss arising from any claim by reason of any wrongful act committed by them in their capacity as a director or officer (subject to certain exclusions as required by law). During the 2020 financial year, Huon paid a total of $62,695 in premiums for Directors and Officers Liability insurance. The Company has not otherwise, during or since the end of the financial year, except to the extent permitted by law, indemnified or agreed to indemnify an officer or auditor of the Company or of any related body corporate against a liability incurred as such by an officer or auditor.
Auditor’s Independence DeclarationThere were no former partners or directors of PricewaterhouseCoopers, the Company’s auditor, who are or were at any time during the financial year an officer of the Company.
A copy of the auditor’s independence declaration as required under section 307C of the Corporations Act 2001 is set out on page 46 and forms part of this Directors’ Report.
Non-Audit ServicesThe Company may decide to employ the auditor for assignments additional to their statutory audit duties where the auditor’s expertise and experience with the Company and/or the Consolidated Group are important.
During the year the following fees were paid or payable for non-audit services provided by the auditor (PricewaterhouseCoopers Australia), its related practices and non-related audit firms are set out below:
Consolidated 2020
$
Consolidated 2019
$
PricewaterhouseCoopers AustraliaAudit and other assurance servicesAudit and review of financial statements 223,500 200,000Other assurance services – 6,000Total remuneration for audit services 223,500 206,000
Taxation & other advisory servicesTaxation & other advisory services 149,518 114,922Other advisory services 19,026 –Total remuneration for taxation & other advisory services 168,544 114,922
Total remuneration of PricewaterhouseCoopers Australia 392,044 320,922
The Board of Directors has considered the position and, in accordance with advice received from the Audit and Risk Management Committee, is satisfied that the provision of the non-audit services is compatible with the general standard of independence for auditors imposed by the Corporations Act 2001.
The Directors are satisfied that the provision of non-audit services by the auditor, as set out above, did not compromise the auditor independence requirements of the Corporations Act 2001 for the following reasons:
(i) All non-audit services have been reviewed by the Audit and Risk Management Committee to ensure they do not impact the impartiality and objectivity of the auditor.
(ii) None of the services undermine the general principles relating to auditor independence as set out in APES 110 Code of Ethics for Professional Accountants.
Huon Aquaculture Group Limited
Annual Report 2020
44
Directors’ Report
continued

Proceedings on Behalf of the CompanyThere were no proceedings brought, or intervened in, on behalf of the Company with leave under section 237 of the Corporations Act 2001.
Rounding of AmountsThe Company is of a kind referred to in ASIC Corporations Instrument 2016/191, issued by the Australian Securities and Investments Commission, relating to the ‘rounding off’ of amounts in the directors’ report and financial report. Amounts in the directors’ report and financial report have been rounded off to the nearest thousand dollars in accordance with that Class Order, or in certain cases, to the nearest dollar.
This report is made in accordance with a resolution of Directors.
Neil Kearney Chairman 27 August 2020
Peter Bender Managing Director and CEO 27 August 2020
45

PricewaterhouseCoopers, ABN 52 780 433 757 2 Riverside Quay, SOUTHBANK VIC 3006, GPO Box 1331, MELBOURNE VIC 3001 T: 61 3 8603 1000, F: 61 3 8603 1999, www.pwc.com.au
Liability limited by a scheme approved under Professional Standards Legislation.
Auditor’s Independence Declaration As lead auditor for the audit of Huon Aquaculture Group Limited for the year ended 30 June 2020, I declare that to the best of my knowledge and belief, there have been:
(a) no contraventions of the auditor independence requirements of the Corporations Act 2001 inrelation to the audit; and
(b) no contraventions of any applicable code of professional conduct in relation to the audit.
This declaration is in respect of Huon Aquaculture Group Limited and the entities it controlled during the period.
Alison Tait Melbourne Partner PricewaterhouseCoopers
27 August 2020
Huon Aquaculture Group Limited
Annual Report 2020
46
Auditor’s Independence Declaration

The Board of Directors (Board) of Huon Aquaculture Group Limited (Huon) is responsible for the corporate governance of the Company. The Board guides and monitors the business and affairs of the Company on behalf of the shareholders. Strong corporate governance is an important aspect in ensuring that Huon creates sustainable long-term value for its shareholders.
Huon is committed to ensuring high standards of corporate governance. This statement outlines the key aspects of Huon’s governance framework and its principal governance practices.
The Board believes that Huon’s policies and practices comply in all material respects with the ASX Corporate Governance Council’s Corporate Governance Principles (3rd Edition) (ASX Principles and Recommendations) with the exception of Recommendation 7.3 (Internal Audit function) as detailed in this Statement.
This Corporate Governance Statement was approved by the Board and is current as at 27 August 2020.
Further information about Huon’s corporate governance practices and policies can be found on the Company’s website.
Principle 1: Lay solid foundations for management and oversight
Role of Board and ManagementThe Board represents shareholders’ interests and is accountable for the overall operation and stewardship of the Company and, in particular, for its long-term growth and profitability. The Board is responsible for evaluating and setting the strategic direction of the Company, establishing goals for management and monitoring the achievement of these goals.
Huon’s Board Charter sets out the Board’s key responsibilities as follows:
Strategy – providing input to, and approval of, the Company’s
strategic direction and budgets as developed by management;
– directing, monitoring and assessing the Company’s performance against strategic and business plans;
– reviewing the adequacy of resources for management to properly carry out approved strategies and business plans; and
– approving and monitoring capital management and major capital expenditure, acquisitions and divestments.
Risk management and reporting– identifying the principal risks and overseeing appropriate
control and management systems for them;– reviewing and ratifying the Company’s system of risk
management and internal compliance and control; – determining that satisfactory arrangements are in place
for auditing the Company’s financial affairs; and– approving and monitoring material internal and external
financial and other reporting.
Relationship with management– appointment and removal of the Chief Executive Officer
(CEO) and Company Secretary;– approving the remuneration framework and overseeing
remuneration policies and Executive Management performance; and
– establishing and monitoring executive succession planning.
Monitoring of performance– approving criteria for assessing performance of
Executive Management and monitoring and evaluating their performance; and
– undertaking an annual evaluation of the performance of the Board.
Corporate governanceThe Board is responsible for ensuring that policies and compliance systems are in place consistent with the Company’s objectives and best practice and that the Company and its employees act legally, ethically and responsibly on all matters.
The Board has adopted a Delegated Authority Policy which outlines the reserved and delegated responsibilities of the Board and the responsibilities of the Executive Management when delegated authority. The CEO and Executive Management are responsible for matters primarily relating to the day-to-day operations and management of the Company and are accountable to the Board.
The Board’s role and the Company’s corporate governance practices and policies are being continually reviewed and improved as the business grows and develops.
Board appointmentsThe responsibility for the selection of potential Directors lies with the Board of the Company. Appropriate background and other checks are undertaken before candidates are considered and appointed by the Board. Directors are initially appointed by the Board subject to election by shareholders at the next Annual General Meeting. Shareholders are provided with all material information on whether or not to elect or re-elect a person as a Director including whether the person will qualify as an independent Director.
Under the Company’s Constitution the tenure of Directors is subject to reappointment by shareholders not later than the third anniversary following his/her appointment.
Written agreements with Directors and Executive ManagementDirectors have a formal letter of appointment that sets out the key terms and conditions of their appointment. All Directors also sign a Deed which covers issues including indemnity, directors’ and officers’ liability insurance, the right to obtain independent advice and requirements concerning confidential information. Executive Management are also engaged under a written agreement setting out the terms of their employment.
Corporate Governance Statement
47

Company SecretaryThe Company Secretary is accountable to the Board, through the Chairman of the Board, on all matters to do with the proper functioning of the Board and Board Committees. This includes:
– Board agendas– Board papers and minutes – advising the Board and its Committees on governance
matters – monitoring the implementation of Board and Committee
policies and procedures; and – statutory and other filings and communication with
regulatory bodies and the ASX.
Diversity policyIn 2014, Huon’s Board endorsed its Diversity Policy. The Diversity Policy reflects the Company’s approach to managing its greatest asset, its people.
Huon is recognised as an Employer of Choice by the Tasmanian Government in acknowledgement of the highly innovative working culture, opportunities for career growth and the family culture within the workforce.
Huon’s workforce is made up of many individuals with diverse skills, values, experiences and backgrounds. The Company is committed to supporting and further developing this diversity through attracting, recruiting, engaging and retaining diverse talent and aligning its culture and systems with this commitment.
The Company believes that commitment to diversity creates competitive advantage and enhances employee participation which is essential to the success of the business. The Board has set measurable objectives and the aim of these is to create an environment conducive to the appointment of well qualified and experienced Board members, Executive Management Group, Senior Management team and employees.
Diversity objectives– Foster an inclusive culture of workplace diversity– Apply and promote Flexible Work Practices Policy– Present diversity data on Huon’s Sustainability
Dashboard– Ensure appropriately qualified and relevantly
experienced women are considered at short list stage for Board appointments
– Progressively increase female representation where the business unit is at less than 20% with specific focus on operational areas
– Progressively increase female participation in Huon’s Leadership Education and Development Programs
– Align selection practices to deliver an equal mix of male and female students for school-based apprenticeships.
Progress with diversity objectivesThere has been steady progress towards achieving the diversity objectives with systems and structured programs in place to support employees from their early career stages to assist in developing the necessary skills and relevant experience for leadership roles.
Progress for this reporting period is as follows:
– Overall increase in female representation company wide – A continued increase in female representation in Senior
Management roles, in 2020 of 3% – Continued review of remuneration across the business
to ensure equity– Promotions of female employees into Management and
non-Management positions has increased by 13%
The Company continues to prioritise merit and competency base selection criteria at the same time recognising diversity in each application of its recruitment and promotion methods. The Company anticipates a long and steady increase in female workforce proportion particularly in relevant key roles and as such has not set a gender target.
Diversity outcomes– 20% (2019: 20%) female proportion on the Board– 0% (2019: 0%) female proportion in Executive
Management Group– 24% (2019: 21%) female proportion in Senior
Management– 15% (2019: 14%) female proportion Management– 22% (2019: 20%) female proportion Company wide
Workplace Gender Equality Agency WGEA ReportThe Company lodged its annual public report with the Workplace Gender Equality Agency (WGEA) including gender pay equity and achieved compliance status. A copy of the report can be viewed on the Company website.
Board performance evaluationThe Board adopted a self-evaluation process to review its own, its Committees’ and individual Directors performance during FY2020. The Board also reviews the composition and skills mix of the Directors on an ongoing basis to ensure that the Board has the necessary and desirable competencies to govern effectively.
Executive Management performance evaluation Arrangements are in place by the Board to monitor and assess the performance of the CEO and Executive Management each financial year. These include:
– a review of the Company’s financial and operating performance against targets; and
– performance appraisals incorporating an analysis of the key performance indicators with each individual.
The Board conducts the performance evaluation of the CEO and the CEO conducts the performance evaluations of the Executive Management.
Huon Aquaculture Group Limited
Annual Report 2020
48
Corporate Governance Statement
continued

Principle 2: Structure the Board to add value
Remuneration and Nominations CommitteeThe Board has a Remuneration and Nomination Committee (RNC) comprising three Non-executive Directors, with the Chairman being an independent Non-executive Director.
The RNC Charter outlines the Committee’s role in assisting the Board with decisions regarding the composition and structure of the Board. It does this by reviewing and making recommendations to the Board in relation to:
– the appointment and re-election of Directors;– the induction and continuing professional development
of Directors;– Board succession planning;– the recruitment process for a new Director; – Board, Committees and Director performance
evaluation; and– succession plans for the CEO and other Senior
Management.
Board composition, skills and experienceThe Constitution of the Company provides that the number of Directors must at any time be no more than ten and no less than three. The Huon Board is currently comprised of five Directors. A profile of each Director can be found in the on pages 26 to 27 of this Annual Report.
In order to govern effectively, Directors must have a clear understanding of the Company’s overall strategy, together with knowledge of the Company and the industry it operates in. Directors must collectively possess the appropriate skills and experience to enable the Board to effectively discharge its responsibilities.
The current skills matrix of the Directors of the Board brings together extensive expertise and experience in relation to all areas of the day-to-day and commercial elements of the Company including:
– industry knowledge – salmon, aquaculture and food;– international and domestic food markets;– senior corporate leadership;– strategy and business development;– governance and risk management;– corporate finance;– brand and marketing; and– sustainability practices.
The Company actively seeks a variety of skills, experience and expertise to ensure the Board can meet its current and future needs.
Board and Director independenceHuon has adopted a definition of independence which is consistent with the ASX Principles and Recommendations.
The Non-executive Chairman of the Board, Neil Kearney, and Non-executive Directors, Simon Lester and Tony Dynon, are considered to be independent, meaning that each is free from any management role or business interest or other relationship that could materially interfere with their ability to act in the best interests of Huon as a whole. The Board is confident that each of the Non-executive Directors brings objectivity and makes sound individual contributions to the Company through their deep understanding of Huon’s business.
The two Executive Directors, Peter Bender (CEO and Managing Director) and Frances Bender are not independent by virtue of being substantial shareholders in the Company and employed by the Company in an executive capacity.
The Directors are satisfied that there is no individual or group of individuals who dominate the Board’s decision-making, and that the current composition of the Board maximises the likelihood that the decisions of the Board will reflect the best interests of the Company and its shareholders.
Only those transactions permitted by Huon’s Constitution and the Corporations Act are conducted with Directors or their related parties. These are on the same terms and conditions applying to any other external party, supplier or customer. Directors are required to disclose in writing any related party transactions.
Directors are also required to identify any conflicts of interest they may have in dealing with Huon’s affairs and subsequently to refrain from participating in any discussion or voting on those matters. If a potential conflict of interest is likely to arise, the Director concerned does not receive copies of relevant Board papers and withdraws from the Board meeting while those matters are considered. The Director concerned therefore takes no part in the discussion and does not exercise any influence over other members of the Board.
The Board has determined that individual Directors have the right in connection with their duties and responsibilities as Directors to seek independent professional advice at the Company’s expense. The engagement of an outside adviser is subject to prior approval of the Chairman. If appropriate, any advice received will be made available to all Board members.
Director induction and ongoing professional developmentThe induction of Directors is the role of the Remuneration and Nomination Committee and includes ensuring an effective orientation program is in place. Directors are encouraged to engage in professional development activities and to develop and maintain the skills and knowledge needed to perform their role as a Director effectively.
Principle 3: Act ethically and responsiblyThe Company is committed to maintaining ethical standards in the conduct of its business activities. The Company strongly believes that its reputation as an ethical business organisation is important to its ongoing success.
Code of ConductThe Board has adopted a Code of Conduct which applies to all Directors and employees of the Company and where relevant and to the extent possible, consultants, secondees and contractors of the Company.
The Code addresses issues including; ethics, personal and business conduct, conflicts of interest, mutual respect and business agreements and contracts.
49

All suspected breaches of the Code will be thoroughly investigated by the Company. If these investigations reveal breaches of the Code appropriate disciplinary and remedial action will be taken depending on the nature of the breach.
If an employee suspects that a breach of the Code has occurred or will occur, he or she must report that breach to the appropriate person. No employee will be disadvantaged or prejudiced if he or she reports, in good faith, a suspected breach. All reports will be acted upon and kept confidential where appropriate.
The Huon Code of Conduct can be viewed on the Company website.
Principle 4: Safeguard integrity in corporate reporting
Audit and Risk Management Committee An Audit and Risk Management Committee is in place to assist the Board of the Company in fulfilling its corporate governance and oversight responsibilities in relation to the Company’s financial reports and financial reporting process and internal control structure, risk management systems (financial and non-financial), and the internal and external audit process. The Audit and Risk Management Committee Charter outlines its key responsibilities as follows:
– review and approve internal audit and external audit plans;
– update the internal and external audit plans;– review and approve financial reports; and– review the effectiveness of the Company’s compliance
and risk management functions.
The Committee consists of three Non-executive Directors and a majority of independent Directors. The Chairman of the Committee is an independent Director and is not the Chairman of the Board.
Integrity of Financial Reporting – CEO and CFO CertificationThe CEO, Deputy CEO and CFO respectively provide assurance to the Board that:
– Huon’s financial reports for each half year and full year present a true and fair view of the financial position and performance of the Company and are in accordance with the accounting standards;
– their opinion is based on a sound system of risk management and internal compliance and control; and
– the Company’s risk management and internal compliance and control system is operating effectively.
Role of the External Auditor at the AGM The Company’s external auditor attends the Company’s AGM and is available to answer questions about the conduct of the audit and the preparation and content of the auditor’s report.
Principle 5: Make timely and balanced disclosure
Continuous DisclosureThe Company is committed to effective communication with its customers, shareholders, market participants, employees, suppliers, financiers, creditors, other stakeholders and the wider community. The Company will ensure that all stakeholders, market participants and the wider community are informed of its activities and performance on a timely basis.
Subject to the ASX Listing Rules, the Company will make publicly available all information to ensure that trading in its shares takes place in an efficient, competitive and informed market.
The Board has adopted a Continuous Disclosure Policy to ensure the Company complies with all disclosure obligations. The Policy addresses all continuous disclosure requirements under the Listing Rules and Corporations Act and incorporates best practice guidelines recommended by ASX, ASIC and the Australasian Investor Relations Association (AIRA). The Company Secretary is responsible for the overall administration and monitoring of the Continuous Disclosure Policy.
Huon’s Continuous Disclosure Policy can be viewed on the Company website.
Principle 6: Respect the rights of security holders
Information about Huon and its Governance for InvestorsHuon places considerable importance on effective engagement and communications with shareholders.
It recognises the value of providing current and relevant information to its shareholders. The Board has adopted a Communications Policy which is designed to ensure that the Company:
– provides timely and accurate information equally to all shareholders and market participants regarding the Company including its financial situation, performance, ownership, strategies, activities and governance; and
– adopts channels for disseminating information that are fair, timely and cost efficient.
This information is made available through:
– the Company’s website;– the Huon Aquaculture Sustainability Dashboard;– briefings and the investor relations program;– the media; – continuous disclosure to the ASX; – Company meetings; and– the Annual Report.
The Annual Report (which includes Huon’s Corporate Governance Statement) can be viewed on the Company website.
Huon Aquaculture Group Limited
Annual Report 2020
50
Corporate Governance Statement
continued

Investor Relations ProgramHuon is committed to the promotion of investor confidence by ensuring trading in the Company’s shares takes place in an efficient, competitive and informed market. The Deputy CEO of the Company leads the investor relations program and is responsible for the Company’s relationship with major shareholders, institutional investors and analysts and is the primary point of contact for those parties. A key component of leading this program is ongoing availability. Huon’s Continuous Disclosure Policy and its Communications Policy are integral elements of the investor relations program.
Any written material containing new price-sensitive information to be used in briefing the media, institutional investors and analysts are lodged with ASX prior to the briefing commencing. On confirmation of receipt by ASX, the briefing material is posted to Huon’s website. Briefing materials may also include information that may not strictly be required under the continuous disclosure requirements.
Huon will not disclose price-sensitive information in any meeting with investors or analysts before formally disclosing it to the market. The Company considers that one-on-one discussions and meeting with investors and analysts are an important part of pro-active investor relations.
Policies and processes to facilitate and encourage participation at meetings of security holdersThe Company strongly encourages all shareholders to attend meetings and uses and relies on its Communications Policy to ensure awareness and accessibility of those meetings. The Board encourages full participation of shareholders at the Annual General Meeting to ensure a high level of accountability and understanding of the Company’s strategy and goals. Shareholders are able to submit questions prior to the Annual General Meeting if they are unable to attend.
Give security holders the option to receive communications from, and send communications to, the entity and its security registry electronicallyShareholders are able to receive and send communications to the Company and its share registry electronically via the Link Investor Centre. Shareholders are also able to sign up for regular email alerts which include notification of announcements, reports, presentations and summaries. Huon posts all reports, ASX and media releases and copies of significant business presentations on its website. Both email alerts and the Link Investor Centre can be accessed via the Investor section of the Company website.
Principle 7: Recognise and manage risk
Committee to oversee RiskThe Board is responsible for risk oversight and the management and internal control of the processes by which risk is considered for both ongoing operations and prospective actions. In specific areas the Board is assisted by the Audit and Risk Management Committee which is responsible for establishing procedures which provide assurance that major business risks are identified, consistently assessed and appropriately addressed. The Committee’s focus is on risk assessment, including the identification and management of risks as they relate to:
– operational and environmental risk;– workplace health and safety management; and– financial risk.
The Committee consists of three Non-executive Directors and a majority of independent Directors. The Chairman of the Committee is an independent Director and is not the Chairman of the Board.
Review Huon’s Risk Management FrameworkThe Risk Management Policy and Risk Management Framework are reviewed on an annual basis. Any amendments to the Policy and/or Risk Management Framework must be approved by the Board. In addition the Board reviews the Company’s risk management at Board meetings, and where required, makes improvements to its risk management and internal compliance control systems.
Internal Audit FunctionThe Company does not have an internal audit function due to the nature and size of the Company and the extent of its Risk Management Framework. The Company currently relies on oversight by management, the Audit and Risk Management Committee and the Board to ensure compliance with Huon’s Risk Management Policy. The Audit and Risk Management Committee has decided not to introduce an internal audit function, but has engaged the services of third parties to further support the internal audit function during FY2020.
Management of material exposure to economic, environmental and social sustainability risksA key pillar of the Company’s business strategy is to grow safely and sustainably. Sustainability and environmental measures continue to be a priority for Huon with significant time invested in community consultation and the refinement of systems and procedures directed at positive economic, environmental, animal welfare and social outcomes across the business operations. Risk recognition and management are viewed by the Company as integral to its objectives of creating and maintaining shareholder value and to the successful execution of the Company’s strategies.
51

There are a number of risks, both specific to Huon and of a general nature which may threaten the future operating and financial performance of the Company and its investment value including:
Risk Type Identified Risk
Agricultural Supply, growth and mortality of fishAbility for fresh water bathingFish feed formulationBiosecurity and farming practicesDisease management and vaccine availabilityBroodstock and smolt supply
Environmental Climate change Resource availabilityPredator threatsAGD, algae and jellyfishExtreme weather eventsHigh water temperature and environmental influencesFresh water supply
Social Social license to operateRegulatory or compliance breachesAnimal welfareAntibiotics useComposition of feed formulations
Economic Fish feed prices, supply and qualityMarket disruption and credit riskBrand reputation and food safetyFuel and energy pricesKey facility relianceLegal and contractualIT reliability and reliance
PSC Staff recruitment and retentionEquipment and work practicesStaff health, wellbeing and training
These risks may change over time as the external environment changes and as the Company expands its operations. The Company’s Risk Management Policy outlines processes Huon has adopted for the regular assessment and identification of risks as well as providing a management and response framework including the mitigation of risks where appropriate. Further information on Huon’s assessment of the principal risks which could have a material impact on the Company are set out on pages 18 to 21 in this Annual Report.
Principle 8: Remunerate fairly and responsibly
Remuneration and Nominations CommitteeThe Remuneration and Nomination Committee (RNC) assists the Board by reviewing and making recommendations on remuneration arrangements for Directors and Executives of the Company including:
– the Company’s remuneration framework;– the Company’s recruitment, retention and termination
policies;
– the Company’s remuneration policies including as they apply to Directors;
– equity based remuneration plans for Executive Management and other employees; and
– the remuneration packages for Directors, the CEO and Executive Management.
When needed, the Company has also sought advice from external advisers in relation to the development of appropriate incentive plans for Key Management Personnel (KMP).
Policies and practices regarding the remuneration of Non-executive Directors and the remuneration of executive Directors and other Executive ManagementThe Company is committed to attracting and retaining the best people to work in the organisation including Directors and Executive Management. The Board adopted a Remuneration Policy which aims to:
– ensure that coherent remuneration policies and practices are observed which enable the attraction and retention of Directors and management who will create value for shareholders;
– fairly and responsibly reward Directors and Executive Management having regard to the Company’s performance, the performance of the Executive Management and the general pay environment; and
– comply with all relevant legal and regulatory provisions.
Remuneration for Executive Directors and Executive Management incorporates fixed and variable pay performance elements with both a short and long term focus. Remuneration packages may contain any or all of the following:
– annual base salary; – performance based remuneration; – equity based remuneration;– other benefits such as holidays, sickness benefits,
superannuation payments and long service benefits;– expense reimbursement; and– termination payments.
The remuneration of Non-executive Directors is determined by the Board as a whole reflecting the value of the individual’s time commitment and responsibilities. Remuneration packages may contain any or all of annual fees, equity based remuneration and other benefits such as superannuation payments. The total remuneration of Non-executive Directors must not exceed the maximum annual amount approved by Company’s shareholders (currently $800,000). Detailed information on the Company’s remuneration policy and key principles and also the remuneration received by Directors and Key Management Personnel in FY2020 is set out in the Remuneration Report on pages 31 to 42 in this Annual Report.
Equity based remunerationBoth the Remuneration and Nomination Committee Charter and the Remuneration Policy contain oversight regarding equity-based remuneration. Huon’s long term incentive (LTI) plan is delivered through the granting of performance rights which convert to shares in the Company on achievement of specified performance conditions. Participants in the LTI plan are not permitted to enter into transactions which limit the economic risk of participating in the plan.
Huon Aquaculture Group Limited
Annual Report 2020
52
Corporate Governance Statement
continued

Consolidated financial statementsConsolidated income statement 54Consolidated statement of comprehensive income 55Consolidated balance sheet 56Consolidated statement of changes in equity 57 Consolidated statement of cashflows 58
Notes to the consolidated financial statementsAbout this report
Basis of preparation 59Principles of consolidation 59Application of new and revised Accounting Standards 60
Performance
1. Revenue 612. Other Income 613. Profit for the year before tax 624. Biological assets 635. Earnings per share (EPS) 646. Dividends 65
Investment in growth strategy
7. Property, plant and equipment 668. Other non-current assets 699. Leases 69
Net debt and working capital
10. Notes to the statement of cashflows 7211. Trade and other receivables 7312. Inventories 7413. Other assets 7414. Trade and other payables 7415. Borrowings 7516. Issued capital 7717. Other reserves 78
Other
18. Investments in financial assets 7919. Derivative assets 7920. Fair value measurements 7921. Financial risk management 8122. Parent information 8523. Deed of cross guarantee 8624. Income tax 8725. Key management personnel compensation 9026. Share-based payment 9027. Related party transactions 9328. Remuneration of auditors 9429. Goodwill 9530. Impairment 9631. Other intangible assets 9732. Interests in subsidiaries 9833. Derivative liabilities 9834. Provisions 9935. Other liabilities 10036. Contingent liabilities and contingent assets 10037. Segment information 10138. Subsequent events 10139 Company details 101
53
Signed reportsDirectors’ Declaration 102Independent Auditor’s Report to the Members 103
Shareholder information 110
Financial ReportFor the year ended 30 June 2020

Consolidated income statementFor the year ended 30 June 2020
Note
Consolidated2020$’000
Consolidated2019$’000
Revenue from operations 1 339,869 281,955
Other income 2 13,594 9,258
ExpensesFair value adjustment of biological assets 4 1,507 (9,118)Changes in inventories of finished goods and work in progress 59,896 49,299Raw materials and consumables used (218,997) (184,410)Employee benefits expense 3 (80,764) (69,363)Depreciation and amortisation expense 3 (52,089) (30,321)Finance costs 3 (8,370) (8,174)Freight & distribution expenses (31,764) (13,454)Other expenses (21,588) (21,374)Total expenses (352,169) (286,915)
Profit before income tax expense 1,294 4,298Income tax benefit/(expense) 24 3,621 5,154
Net profit for the period attributable to members of the Company 4,915 9,452
Note
Cents per share
2019
Cents per share
2019
Earnings per ordinary shareBasic (cents per share) 5 5.63 10.82Diluted (cents per share) 5 5.63 10.82
The number of shares used to determine earnings per ordinary share (EPS) is disclosed in note 5 to the accounts.
The above consolidated income statement should be read in conjunction with the accompanying notes.
Huon Aquaculture Group Limited
Annual Report 2020
54
Financial statements

Consolidated2020$’000
Consolidated2019$’000
Profit for the period 4,915 9,452Other comprehensive income – –
Total comprehensive income for the period (net of tax) 4,915 9,452
Total comprehensive income attributable to:Owners of Huon Aquaculture Group Limited 4,915 9,452
4,915 9,452
The above consolidated statement of comprehensive income should be read in conjunction with the accompanying notes.
Consolidated statement of comprehensive incomeFor the year ended 30 June 2020
55
Financial statements Huon Aquaculture Group Limited
Annual Report 2020
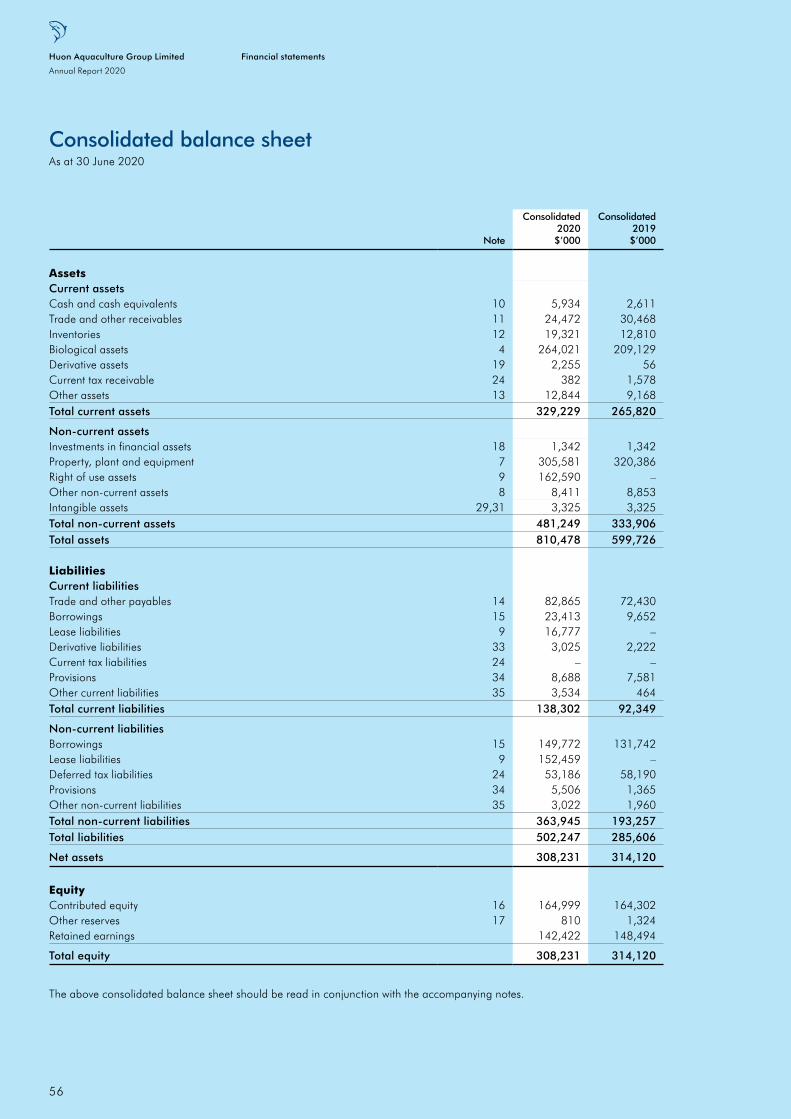
Note
Consolidated2020$’000
Consolidated2019$’000
AssetsCurrent assetsCash and cash equivalents 10 5,934 2,611Trade and other receivables 11 24,472 30,468Inventories 12 19,321 12,810Biological assets 4 264,021 209,129Derivative assets 19 2,255 56Current tax receivable 24 382 1,578Other assets 13 12,844 9,168Total current assets 329,229 265,820
Non-current assetsInvestments in financial assets 18 1,342 1,342Property, plant and equipment 7 305,581 320,386Right of use assets 9 162,590 –Other non-current assets 8 8,411 8,853Intangible assets 29,31 3,325 3,325Total non-current assets 481,249 333,906Total assets 810,478 599,726
LiabilitiesCurrent liabilitiesTrade and other payables 14 82,865 72,430Borrowings 15 23,413 9,652Lease liabilities 9 16,777 –Derivative liabilities 33 3,025 2,222Current tax liabilities 24 – –Provisions 34 8,688 7,581Other current liabilities 35 3,534 464Total current liabilities 138,302 92,349
Non-current liabilitiesBorrowings 15 149,772 131,742Lease liabilities 9 152,459 –Deferred tax liabilities 24 53,186 58,190Provisions 34 5,506 1,365Other non-current liabilities 35 3,022 1,960Total non-current liabilities 363,945 193,257Total liabilities 502,247 285,606
Net assets 308,231 314,120
EquityContributed equity 16 164,999 164,302Other reserves 17 810 1,324Retained earnings 142,422 148,494
Total equity 308,231 314,120
The above consolidated balance sheet should be read in conjunction with the accompanying notes.
Consolidated balance sheetAs at 30 June 2020
Huon Aquaculture Group Limited
Annual Report 2020
56
Financial statements

Note
ContributedEquity$’000
RetainedEarnings
$’000
Share-basedPayment Reserve
$’000
Total Equity$’000
Balance at 1 July 2018 164,302 146,029 1,374 311,705Profit for the period – 9,452 – 9,452
Total comprehensive income for the year, net of tax – 9,452 – 9,452Contributions of equity, net of transactions costs – – – –Issue of shares pursuant to executive long-term incentive plan 17 – – (601) (601)Share-based payment expense 3(b) – – 551 551Dividends paid or provided for 6 – (6,987) – (6,987)
Balance at 30 June 2019 164,302 148,494 1,324 314,120
Note
ContributedEquity$’000
RetainedEarnings
$’000
Share-basedPayment Reserve
$’000
Total Equity$’000
Balance at 1 July 2019 164,302 148,494 1,324 314,120Adjustment on adoption of AASB 16 (net of tax) – 8,367 – 8,367
Restated total equity at beginning of period 164,302 140,127 1,324 305,753Profit for the period – 4,915 – 4,915
Total comprehensive income for the year, net of tax – 4,915 – 4,915Contributions of equity, net of transactions costs – – – –Issue of shares pursuant to executive long-term incentive plan 17 697 (697) –Share-based payment expense 3(b) – – 183 183Dividends paid or provided for 6 – (2,620) – (2,620)
Balance at 30 June 2020 164,999 142,422 810 308,231
The above consolidated statement of changes in equity should be read in conjunction with the accompanying notes.
Consolidated statement of changes in equityFor the year ended 30 June 2020
57
Financial statements Huon Aquaculture Group Limited
Annual Report 2020

Consolidated statement of cashflowsFor the year ended 30 June 2020
Note
Consolidated2020$’000
Consolidated2019$’000
Cash flows from operating activitiesReceipts from customers 362,080 295,934Payments to suppliers and employees (344,709) (271,034)
17,371 24,900Interest received 115 7Interest and other costs of finance paid (6,626) (8,174)Interest on lease liabilities (5,883) –Income tax (paid)/refunded 3,399 (2,243)Net cash inflow/(outflow) from operating activities 10 8,376 14,490
Cash flows from investing activitiesProceeds from sale of property, plant and equipment – 190Payments for property, plant and equipment (21,554) (64,211)Payment for business – –Payments for other assets – (330)Net cash inflow/(outflow) from investing activities (21,554) (64,351)
Cash flows from financing activitiesProceeds from issues of shares – –Proceeds from borrowings 37,834 66,330Repayment of borrowings (6,043) (9,057)Payment of lease liabilities (12,670) –Dividends paid to company’s shareholders (2,620) (6,987)Payment of shares for employee share plan – (601)Net cash inflow/(outflow) from financing activities 16,501 49,685
Net increase/(decrease) in cash held 3,323 (176)Cash and cash equivalents at beginning of financial year 2,611 2,787
Cash and cash equivalents at end of financial year 10 5,934 2,611
The above consolidated statement of cash flows should be read in conjunction with the accompanying notes.
Huon Aquaculture Group Limited
Annual Report 2020
58
Financial statements

About this reportThese consolidated financial statements and notes represent those of Huon Aquaculture Group Limited and Controlled Entities (the ‘Consolidated Group’). Huon Aquaculture Group Limited is a company incorporated in Australia, and whose shares are publicly traded on the Australian Securities Exchange (ASX).
The separate financial statements and notes of Huon Aquaculture Group Limited have been presented within this financial report as an individual Parent Entity (‘Parent Entity’).
The financial statements were authorised for issue on 27 August 2020 by the Directors of the Company.
All press releases and other information are available on our website www.huonaqua.com.au.
Basis of preparationThese general purpose financial statements have been prepared in accordance with the Corporations Act 2001, Australian Accounting Standards and Interpretations of the Australian Accounting Standards Board and also comply with International Financial Reporting Standards as issued by the International Accounting Standards Board. The Consolidated Group is a for-profit entity for financial reporting purposes under Australian Accounting Standards. Material accounting policies adopted in the preparation of these financial statements are presented below and have been consistently applied unless stated otherwise.
The financial statements except for cash flow information, have been prepared on an accruals basis and are based on historical costs (unless otherwise stated).
The functional currency of each group entity is measured using the currency of the primary economic environment in which that entity operates. The consolidated financial statements are presented in Australian dollars which is the Parent Entity’s functional and presentation currency.
Critical estimates and judgementsThe preparation of financial statements requires the use of accounting estimates which, by definition, will seldom equal the actual results. Management also needs to exercise judgement in applying the group’s accounting policies.
This note provides an overview of the areas that involved a higher degree of judgement or complexity, and of items which are more likely to be materially adjusted due to estimates and assumptions turning out to be wrong. Detailed information about each of these estimates and judgements is included in other notes together with information about the basis of calculation for each affected line item in the financial statements.
Estimates and judgements are continually evaluated. They are based on historical experience and other factors, including expectations of future events that may have a financial impact on the entity and that are believed to be reasonable under the circumstances.
The areas involving significant estimates or judgements are:
– Recognition of deferred tax asset and carried-forward tax losses (note 24)
– Estimation uncertainties and judgements made in relation to lease accounting (note 9)
– Impairment of assets (note 30) – Fair value less costs to sell of biological assets (note 4) – Borrowings (forecast for compliance with covenants –
note 15)
Principles of consolidationThe consolidated financial statements incorporate the assets and liabilities of all subsidiaries of Huon Aquaculture Group Limited (Parent Entity) as at 30 June 2020 and the results of all subsidiaries for the year then ended. Huon Aquaculture Group Limited and its subsidiaries together are referred to in this financial report as the Consolidated Group.
Subsidiaries are all entities over which the group has control. The group controls an entity when the group is exposed to, or has rights to, variable returns from its involvement with the entity and has the ability to affect those returns through its power to direct the activities of the entity. Subsidiaries are fully consolidated from the date on which control is transferred to the group. They are deconsolidated from the date that control ceases.
The acquisition method of accounting is used to account for business combinations by the group.
Intercompany transactions, balances and unrealised gains on transactions between group companies are eliminated. Unrealised losses are also eliminated unless the transaction provides evidence of an impairment of the transferred asset. Accounting policies of subsidiaries have been changed where necessary to ensure consistency with the policies adopted by the group.
Notes to the Consolidated Financial StatementsFor the year ended 30 June 2020
59

Application of new and revised Accounting Standards
Amendments to AASBs and the new Interpretation that are mandatorily effective for the current year:In the current year, the Consolidated Group has applied a number of amendments to AASB’s and new Interpretations issued by the Australian Accounting Standards Board (AASB) that are mandatorily effective for an accounting period that begins on or after 1 July 2019, and therefore relevant for the current year end.
The Group adopted all of the following new and revised Standards and Interpretations issued by the AASB that are relevant to its operations and effective for the current annual reporting period.
New and revised Standards and Interpretations effective for the current half-year relevant to the Group include:
(i) AASB 16 LeasesAASB 16 Leases became effective for the Group on 1 July 2019, and as a result the Group changed its accounting policies and made adjustments to opening retained earnings at 1 July 2019. The impact of adopting AASB 16 Leases is disclosed in note 9 – Leases.
(ii) AASB 2018-1 Amendments to Australian Accounting Standards – Annual Improvements 2015-17 CycleThe adoption of this amending Standard did not have any impact on the disclosures or the amounts recognised in the Group’s annual financial report.
(iii) Interpretation 23 Uncertainty over Income Tax TreatmentsThe adoption of this amending Standard did not have any impact on the disclosures or the amounts recognised in the Group’s annual financial report.
The standards did not require any retrospective adjustments.
Standards and Interpretations in issue not yet adopted:Effective for annual
reporting periods beginning on or after
Expected to be initially applied in the financial year ending
AASB 2018-6 ‘Amendments to Australian Accounting Standards – Definition of a Business’ 1 January 2020 30 June 2021AASB 2018-7 ‘Amendments to Australian Accounting Standards – Definition of Material’
1 January 2020 30 June 2021
AASB 2019-1 ‘Amendments to Australian Accounting Standards – References to Conceptual Framework’
1 January 2020 30 June 2021
AASB 2019-3 ‘Amendments to Australian Accounting Standards – Interest Rate Benchmark Reform’
1 January 2020 30 June 2021
AASB 2019-5 ‘Amendments to Australian Accounting Standards – Disclosure of the Effect of New IFRS Standards Not Yet Issued in Australia’
1 January 2020 30 June 2021
AASB 2019-7 ‘Amendments to Australian Accounting Standards – Disclosure of GFS Measures of Key Fiscal Aggregates and GAAP/GFS Reconciliations’
1 January 2020 30 June 2021
There are no other standards or interpretations that are not yet effective and that would be expected to have a material impact on the entity in the current or future reporting periods and on foreseeable future transactions.
Huon Aquaculture Group Limited
Annual Report 2020
60
Notes to the financial statements
continued
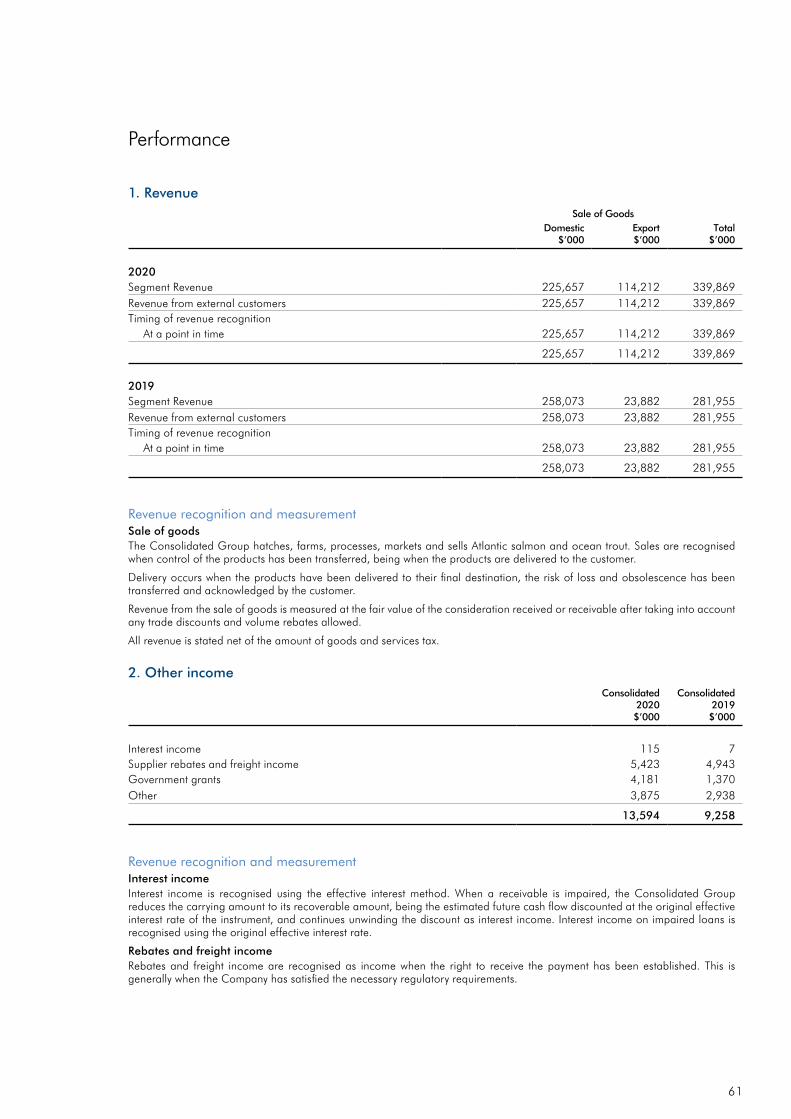
1. RevenueSale of Goods
Total$’000
Domestic$’000
Export$’000
2020Segment Revenue 225,657 114,212 339,869Revenue from external customers 225,657 114,212 339,869Timing of revenue recognition
At a point in time 225,657 114,212 339,869
225,657 114,212 339,869
2019Segment Revenue 258,073 23,882 281,955Revenue from external customers 258,073 23,882 281,955Timing of revenue recognition
At a point in time 258,073 23,882 281,955
258,073 23,882 281,955
Revenue recognition and measurementSale of goodsThe Consolidated Group hatches, farms, processes, markets and sells Atlantic salmon and ocean trout. Sales are recognised when control of the products has been transferred, being when the products are delivered to the customer.
Delivery occurs when the products have been delivered to their final destination, the risk of loss and obsolescence has been transferred and acknowledged by the customer.
Revenue from the sale of goods is measured at the fair value of the consideration received or receivable after taking into account any trade discounts and volume rebates allowed.
All revenue is stated net of the amount of goods and services tax.
2. Other incomeConsolidated
2020$’000
Consolidated2019$’000
Interest income 115 7Supplier rebates and freight income 5,423 4,943Government grants 4,181 1,370Other 3,875 2,938
13,594 9,258
Revenue recognition and measurementInterest incomeInterest income is recognised using the effective interest method. When a receivable is impaired, the Consolidated Group reduces the carrying amount to its recoverable amount, being the estimated future cash flow discounted at the original effective interest rate of the instrument, and continues unwinding the discount as interest income. Interest income on impaired loans is recognised using the original effective interest rate.
Rebates and freight incomeRebates and freight income are recognised as income when the right to receive the payment has been established. This is generally when the Company has satisfied the necessary regulatory requirements.
Performance
61

2. Other income (continued)
Government grantsGovernment grants are assistance by the government (including Job Keeper) in the form of transfers of resources to the Consolidated Group in return for past or future compliance with certain conditions relating to the operating activities of the Consolidated Group. Government grants include government assistance where there are no conditions specifically relating to the operating activities of the Consolidated Group other than the requirement to operate in certain regions or industry sectors.
Government grants relating to income are recognised as income over the periods necessary to match them with the related costs which they are intended to compensate. Government grants that are receivable as compensation for expenses or losses already incurred or for the purpose of giving immediate financial support to the Consolidated Group with no future related costs are recognised as income of the period in which it becomes receivable.
Government grants relating to assets are treated as deferred income and recognised in profit and loss over the expected useful lives of the assets concerned. Refer to note 35.
3. Profit for the year before taxProfit before income tax from continuing operations includes the following items of revenue and expense:
Consolidated2020$’000
Consolidated2019$’000
(a) Significant revenue and expensesThe following significant revenue and expense items are relevant in explaining the financial performance:Revenue: – supplier rebates and claims 543 426 – insurance and supplier claims 2,846 1,623
Expense: – accrued employee incentives – – – legal fees 396 1,249 – derivative contracts – (7)
(b) ExpensesGross Depreciation of non-current assets 36,359 29,879Gross Depreciation of right of use assets 15,288 –Gross Amortisation of non-current assets 442 441Total Gross depreciation and amortisation 52,089 30,320
Depreciation – net impact recognised in changes in inventories of finished goods and work in progress (12,938) (4,558)Net depreciation and amortisation 39,151 25,762
Interest & fees 6,840 6,001Interest rate swap 3,025 2,173Lease interest 5,883 –Total Gross finance costs 15,748 8,174
Lease interest – net impact recognised in changes in inventories of finished goods and work in progress (4,353) –Net finance costs 11,395 8,174
Employee benefits expense 80,581 68,812Share-based payment expense 183 551Total employee benefits costs 80,764 69,363
Net (gain)/loss on disposal of property, plant and equipment – 79
Huon Aquaculture Group Limited
Annual Report 2020
62
Notes to the financial statements
continued

4. Biological assetsConsolidated
2020$’000
Consolidated2019$’000
Biological assets at fair value(i)
Opening balance 209,129 169,361Increase due to production 350,407 273,557Decrease due to sales/harvest/mortality (297,022) (224,671)Movement in fair value of biological assets 1,507 (9,118)
264,021 209,129
Closing fair value adjustment on biological assets 28,065 26,558Total weight of live finfish at sea (kg 000’s) 26,429 16,886
(i) Members of the Consolidated Group, Huon Aquaculture Company Pty Ltd and Springfield Hatcheries Pty Ltd grow fish from juveniles through to harvest.
Fair value measurement30 June 2020
Level 1$’000
Level 2$’000
Level 3$’000
Total$’000
Recurring fair value measurementsBiological Assets – – 264,021 264,021
Total financial assets recognised at fair value – – 264,021 264,021
30 June 2019
Level 1$’000
Level 2$’000
Level 3$’000
Total$’000
Recurring fair value measurementsBiological Assets – – 209,129 209,129Total financial assets recognised at fair value – – 209,129 209,129
Fair value measurements using significant unobservable input The following table summarises the quantitative information about the significant unobservable inputs used in level 3 fair value measurements:
Description 30 June 2020 30 June 2019
Biological assets at fair value ($’000) 264,021 209,129
Unobservable Inputs Adjusted weight of live finfish for fair value measurement: 23,361 tonne
Price per HOG kg $12.57 to $13.07
Adjusted weight of live finfish for fair value measurement: 14,395 tonne
Price per HOG kg $14.53 to $15.03Relationship of Unobservable Inputs to Fair value
Increase in price would increase fair value
Increase in price would increase fair value
63

4. Biological assets (continued)
Recognition and measurementBiological assets include broodstock, eggs, juveniles, smolt and live finfish. Biological assets are measured at fair value less costs to sell in accordance with AASB 141. Where fair value cannot be reliably measured biological assets are measured at cost less impairment losses.
For broodstock, eggs, juveniles, smolt and live finfish below 1kg, these biological assets are measured at cost, as the fair value cannot be measured reliably. Live finfish between 1kg and 4kg are measured at fair value less cost to sell, including a proportionate expected net profit at harvest. Live finfish above 4kg are measured at fair value less cost to sell.
The valuation is completed for each year class of finfish, for each species and, each significant location and takes into consideration input based on biomass in sea, estimated growth rate and mortality. The market prices are derived from observable market prices (when available), achieved prices and estimated future prices for harvest finfish. The prices are reduced for harvesting costs and freight costs to market, to arrive at a net fair value at farm gate.
The change in estimated fair value is charged to the income statement on a separate line as fair value adjustment of biological assets.
Sensitivity analysis – Biological assetsBased on the market prices and weights utilised at 30 June 2020, with all other variables held constant, the consolidated group’s pre-tax profit for the period would have been impacted as follows:
– A pricing increase/decrease of $0.10 would have been a change of $1,993,164 higher/lower (2019: $1,244,457) – A weight increase/decrease of 5% would have been a change of $1,403,239 higher/lower (2019: $1,327,840)
Critical accounting estimatesBiological assets are measured at fair value less costs to sell in accordance with AASB 141. Broodstock, eggs, juveniles, smolt and live fish below 1kg are measured at cost, as the fair value cannot be measured reliably. Biomass beyond this is measured at fair value in accordance with AASB 141, and the measurement is categorised into Level 3 in the fair value hierarchy, as the input is an unobservable input. Live fish over 4kg are measured to fair value less cost to sell, while a proportionate expected net profit at harvest is incorporated for live fish between 1kg and 4kg. The valuation is completed for each year class of finfish, for each species and, each significant location.
The valuation is based on a market approach and takes into consideration inputs based on biomass in sea for each significant location, estimated growth rates, mortality and market price. There is no effective market for live finfish produced by the Consolidated Group so market price is determined on a model based on market prices for both salmon and trout, derived from observable market prices (when available), achieved prices and estimated future prices for harvest finfish.
5. Earnings per share (EPS)Consolidated
2020cents per share
Consolidated2019
cents per share
Earnings per ordinary shareBasic (cents per share)(i) 5.63 10.82Diluted (cents per share)(ii) 5.63 10.82
(i) Basic earnings per share is calculated by dividing the profit attributable to owners of the company by the weighted average number of ordinary shares of the company
(ii) Diluted earnings per share is calculated by dividing the profit attributable to owners of the company by the weighted average number of ordinary shares outstanding including dilutive potential ordinary shares.
Weighted average number of ordinary shares used as the denominator in the calculation of EPS2020 2019
Number for basic EPS 87,372,077 87,337,207Number for diluted EPS 87,372,077 87,337,207
Earnings used as the numerator in the calculation of EPS2020$’000
2019$’000
Earnings for basic EPS(i) 4,915 9,452Earnings for diluted EPS(i) 4,915 9,452
(i) Earnings used in the calculation of basic and diluted earnings per share is as per net profit in the consolidated income statement.
Huon Aquaculture Group Limited
Annual Report 2020
64
Notes to the financial statements
continued

6. DividendsConsolidated
2020$’000
Consolidated2019$’000
Fully paid ordinary sharesFinal dividend for the year ended 30 June 2019 of 3 cents (2018 – 5 cents) per fully paid share 2,620 4,367Interim dividend for the year ended 30 June 2020 of 0 cents (2019 – 3 cents) per fully paid share – 2,620Total dividends provided for or paid 2,620 6,987
The Directors have not recommended the payment of a final ordinary dividend for the year ending 30 June 2020.
Consolidated2020$’000
Consolidated2019$’000
Franking credits available for subsequent reporting periods based on a tax rate of 30% (2019: 30%) 5,989 8,794
5,989 8,794
The above amounts represent the balance of the franking account as at the end of the reporting period, adjusted for:
(a) franking credits that will arise from the payment of the amount of the provision for income tax or the receivable of income tax refund after the end of year,
(b) franking debits that will arise from the payment of dividends recognised as a liability at the reporting date, and
(c) franking credits that will arise from the receipt of dividends recognised as receivables at the reporting date.
The consolidated amounts include franking credits that would be available to the Parent Entity if distributable profits of subsidiaries were paid as dividends.
Recognition and measurementProvision is made for the amount of any dividend declared, being appropriately authorised and no longer at the discretion of the Consolidated Group, on or before the end of the reporting period but not distributed at the end of the reporting period.
65

7. Property, plant and equipmentConsolidated
2020$’000
Consolidated2019$’000
Land and buildingsFreehold landCost 5,294 5,294Total land 5,294 5,294
BuildingsCost 67,552 67,084Accumulated depreciation (12,346) (9,040)Total buildings 55,206 58,044Total land and buildings 60,500 63,338
Plant and equipmentPlant and equipmentCost 422,640 392,531Accumulated depreciation (188,272) (155,219)Total plant and equipment 234,368 237,312
Capital work in progressCost 10,713 19,736Total capital work in progress 10,713 19,736
Total plant and equipment 245,081 257,048
Total property, plant and equipment 305,581 320,386
Huon Aquaculture Group Limited
Annual Report 2020
66
Notes to the financial statements
continued
Investment in growth strategy

7. Property, plant and equipment (continued)Land and Buildings Plant and Equipment
ConsolidatedFreehold
$’000Buildings
$’000
Plant andequipment
$’000
Capitalwork in
progress$’000
Total$’000
Year ended 30 June 2020Cost 5,294 67,552 422,640 10,713 506,199Accumulated depreciation – (12,346) (188,272) – (200,618)Net carrying amount 5,294 55,206 234,368 10,713 305,581
MovementNet carrying amount at the beginning of the year 5,294 58,044 237,312 19,736 320,386Additions – – 598 – 598Disposals and write-offs – – – – –Work in Progress Additions – – – 20,956 20,956Depreciation and amortisation – (3,307) (33,052) – (36,359)Acquisition in business combination – – – – –Capitalisation to asset categories – 469 29,510 (29,979) –Transfers between classes – – – – –Net carrying amount at the end of the year 5,294 55,206 234,368 10,713 305,581
Land and Buildings Plant and Equipment
ConsolidatedFreehold
$’000Buildings
$’000
Plant andequipment
$’000
Capitalwork in
progress$’000
Total$’000
Year ended 30 June 2019Cost 5,294 67,084 392,531 19,736 484,645Accumulated depreciation – (9,040) (155,219) – (164,259)Net carrying amount 5,294 58,044 237,312 19,736 320,386
MovementNet carrying amount at the beginning of the year 5,256 36,234 177,686 67,147 286,323Additions – 76 809 – 885Disposals and write-offs – – (269) – (269)Work in Progress Additions – – – 63,326 63,326Depreciation and amortisation – (2,585) (27,294) – (29,879)Acquisition in business combination – – – – –Capitalisation to asset categories 38 24,319 86,380 (110,737) –Transfers between classes – – – – –Net carrying amount at the end of the year 5,294 58,044 237,312 19,736 320,386
67

7. Property, plant and equipment (continued)
Capital expenditure commitmentConsolidated
2020$’000
Consolidated2019$’000
Capital expenditure commitmentsPlant and equipment – 1,042Capital expenditure projects – –
– 1,042Payable:Not longer than 1 year – 1,042Longer than 1 year and not longer than 5 years – –Longer than 5 years – –
– 1,042
Recognition and measurementProperty, plant and equipment is stated at historical cost less depreciation. Historical cost includes expenditure that is directly attributable to the acquisition of the items. Subsequent costs are included in the asset’s carrying amount or recognised as a separate asset, as appropriate, only when it is probable that future economic benefits associated with the item will flow to the Consolidated Group and the cost of the item can be measured reliably.
Assets are derecognised when replaced. All other repairs and maintenance are charged to the profit and loss during the period in which they are incurred.
Assets are depreciated on a straight line basis.
Land is not depreciated. The following estimated useful lives are used in the calculation of depreciation:
Class of Fixed Asset Useful Life
Buildings 10 – 40 yearsLeasehold improvements 5 – 20 yearsPlant and equipment 2 – 30 years
The assets’ residual values and useful lives are reviewed, and adjusted if appropriate, at the end of each reporting period.
An asset’s carrying amount is written down immediately to its recoverable amount if the asset’s carrying amount is greater than its estimated recoverable amount.
Gains and losses on disposals are determined by comparing proceeds with the carrying amount. These gains or losses are recognised in consolidated income statement when the item is derecognised. When revalued assets are sold, amounts included in the revaluation surplus relating to that asset are transferred to retained earnings.
Huon Aquaculture Group Limited
Annual Report 2020
68
Notes to the financial statements
continued

8. Other non-current assetsConsolidated
2020$’000
Consolidated2019$’000
Marine farming sitesCost 16,244 16,244Accumulated amortisation (7,833) (7,391)
8,411 8,853
Recognition and measurementMarine farming sites are recorded at cost. Amortisation is based on the term of the lease and the expense is charged through the consolidated income statement. All marine sites are held for a term of 15–30 years.
9. LeasesThe Group has leases primarily in relation to buildings, marine leases and equipment including boats, motor vehicles and office equipment.
Set out below are the carrying amounts of the right-of-use assets and movements during the financial year.
Right-of-use assets
Buildings$’000
Plant and Equipment
$’000
Marine Leases$’000
Total$’000
Year ended 30 June 2020Cost 22,943 148,640 5,949 177,532Accumulated depreciation (1,356) (13,245) (341) 14,942Net carrying amount 21,587 135,395 5,608 162,590
MovementAt 1 July 2019 (restated) 20,738 62,348 5,720 88,806Additions 2,205 86,638 229 89,072Depreciation and amortisation (1,356) (13,591) (341) (15,288)
Net carrying amount at the end of the year 21,587 135,395 5,608 162,590
Set out below are the carrying amounts of the lease liabilities and the movements during the year.
2020$’000
ConsolidatedAt 1 July 2019 (restated) 99,429Additions 82,477Accretion of interest 5,883Lease payments (18,553)Carrying amount at 30 June 2020 169,236
Current 16,777Non-current 152,459
169,236
69

9. Leases (continued)
Change in accounting policiesThe Group has adopted AASB 16 using the modified retrospective approach from 1 July 2019 and as such has not restated comparatives for the 2019 reporting period, as permitted under the specific transitional provisions.
Adopting AASB 16 resulted in the Group recognising lease liabilities in relation to leases which had previously been classified as operating leases under AASB 117 Leases.
These liabilities were measured at the present value of the remaining lease payments, discounted using the Group’s incremental borrowing rate as at 1 July 2019. The Group’s incremental borrowing rate applied to the lease liabilities was between 2.38% and 5.38%, depending on the term of the lease. For the majority of the lease liabilities the incremental borrowing rate applied was 5.38%.
The Group previously had no finance leases recorded.
Impact on Financial StatementsLease liabilities recognised on adoption of the standard are reconciled as follows:
1 July2019$’000
Operating lease commitments disclosed at 30 June 2019 232,565Removal of assets not available for use(i) (129,838)Discounted using the lessee’s incremental borrowing rate (22,343)Add: Adjustments for reasonably certain options 19,045Lease liability recognised as at 1 July 2019 99,429Comprising: Current lease liabilities 12,268Non-current lease liabilities 87,161
99,429
(i) Removal of assets not available for use include a range of equipment, the most significant portion relating to the ‘Ronja Storm’.
The associated right of use assets for marine and other higher value leases were measured on a retrospective basis as if the new rules had always been applied. Other right of use assets were measured at the amount equal to the lease liability, adjusted by the amount of any prepaid or accrued lease payments relating to that lease recognised in the balance sheet as at 30 June 2019.
In addition to the adoption of AASB 16, the Group also reassessed its accounting estimate for the allowance for make good on leased plant & equipment, which is included as a provision in the balance sheet. The reassessment resulted in an increase in the make good provision with the corresponding increase recognised in the right of use asset which will be amortised over the term the asset is held for use.
The effect of these changes on the balance sheet at 1 July were as follows:
1 July2019$’000
Right-of-use assets – increase 88,806Deferred tax assets – increase 3,586Total impact on assets 92,392
Lease liabilities – increase 99,429Provisions – increase 1,330Total impact on liabilities 100,759
Net impact on retained earnings – decrease 8,367
Huon Aquaculture Group Limited
Annual Report 2020
70
Notes to the financial statements
continued

9. Leases (continued)
Recognition and MeasurementThe Group leases various assets. Rental contracts are typically made for fixed periods, but may have extension options as described below. Lease terms are negotiated on an individual basis and contain a wide range of different terms and conditions. The lease agreements do not impose any covenants, but leased assets may not be used as security for borrowing purposes.
Leases are recognised as a right of use asset and a corresponding liability at the date at which the leased asset is available for use by the Group. Each lease payment is allocated between the liability and finance cost. The finance cost is charged to profit or loss over the lease period so as to produce a constant periodic rate of interest on the remaining balance of the liability for each period. The right of use asset is depreciated over the shorter of the asset’s useful life and the lease term on a straight line basis.
Assets and liabilities arising from a lease are initially measured on a present value basis. Lease liabilities include the net present value of the following lease payments:
– Fixed payments (including in-substance fixed payments), less any lease incentives receivable – Variable lease payment that are based on an index or a rate – Amounts expected to the payable by the lessee under residual value guarantees.
The lease payments are discounted using the interest rate implicit in the lease, if that rate can be determined, or the Group’s incremental borrowing rate.
Right of use assets are measured at cost compromising the following:
– The amount of the initial measurement of lease liability – Any lease payments made at or before the commencement date, less any lease incentives received – Any initial direct costs, and – Restoration costs.
Payments associated with short-term leases and leases of low-value assets are recognised on a straight-line basis as an expense in profit or loss. Short-term leases are leases with a lease term of 12 months or less.
Practical Expedients AppliedIn applying AASB 16 for the first time, the Group has used the following practical expedients permitted by the standard:
– the exclusion of initial direct costs for the measurement of the right of use asset at the date of initial application; – the use of hindsight in determining the lease term where the contract contains options to extend or terminate the lease; and – accounting for operating leases with a remaining lease term of less than 12 months as at 1 January 2019 as short-term leases.
The Group has also elected not to apply AASB 16 to contracts that were not identified as containing a lease under AASB 17 and Interpretation 4 Determining whether an Arrangement contains a Lease.
Extension OptionsExtension and termination options are included in a number of property and equipment leases across the Group. These terms are used to maximise operational flexibility in terms of managing contracts. The majority of extension and termination options held are exercisable only by the Group and not by the respective lessor.
Critical EstimatesThe lease term is a significant component in the measurement of both the right-of-use asset and lease liability. Judgement is exercised in determining whether there is reasonable certainty that an option to extend the lease or purchase the underlying asset will be exercised, or an option to terminate the lease will not be exercised, when ascertaining the periods to be included in the lease term. In determining the lease term, all facts and circumstances that create an economical incentive to exercise an extension option, or not to exercise a termination option, are considered at the lease commencement date. Factors considered may include the importance of the asset to the consolidated entity’s operations; comparison of terms and conditions to prevailing market rates; incurrence of significant penalties; existence of significant leasehold improvements; and the costs and disruption to replace the asset. The Group reassesses whether it is reasonably certain to exercise an extension option, or not exercise a termination option, if there is a significant event or significant change in circumstances.
71

10. Notes to the statement of cashflowsConsolidated
2020$’000
Consolidated2019$’000
(a) Cash and cash equivalents as at the end of the financial year as shown in the consolidated statement of cashflows is reconciled to the related items in the consolidated balance sheet as follows:
Cash and cash equivalents 5,934 2,611
5,934 2,611(b) Reconciliation of profit for the period to net cash inflow
from operating activities:Profit for the period 4,915 9,452Non-cash items Depreciation and amortisation 52,089 30,321 Net (gain)/loss on disposal of non-current assets – 79 Share-based payment expense 183 551(Increase)/decrease in assets Trade and other receivables 3,797 2,970 Biological assets and inventories (61,403) (40,181) Current tax receivable 1,196 (1,578) Prepayments (3,676) (4,198)Increase/(decrease) in liabilities Trade and other payables 7,187 22,341 Current tax liabilities – (6,432) Deferred tax liabilities (1,418) 613 Provisions 1,374 1,016 Other liabilities 4,132 (464)
Net cash inflow from operations 8,376 14,490
Recognition and measurementFor the purpose of presentation in the statement of cash flows, cash and cash equivalents includes cash on hand, deposits held at call with financial institutions, other short-term, highly liquid investments with original maturities of three months or less that are readily convertible to known amounts of cash and which are subject to an insignificant risk of changes in value.
Huon Aquaculture Group Limited
Annual Report 2020
72
Notes to the financial statements
continued
Net debt and working capital

11. Trade and other receivablesConsolidated
2020$’000
Consolidated2019$’000
Trade receivables 22,168 29,228Loss allowance (237) (304)Other receivables 2,541 1,544
24,472 30,468
Recognition and measurementTrade receivables include amounts due from customers for goods sold and services performed in the ordinary course of business. Receivables expected to be collected within 12 months of the end of the reporting period are classified as current assets. All other receivables are classified as non-current assets. Trade and other receivables are initially recognised at fair value and subsequently measured at amortised cost using the effective interest method, less any loss allowance.
The Group holds the trade receivables with the objective of collecting the contractual cash flows and therefore measures them subsequently at amortised cost using the effective interest rate method. Details about the Group’s impairment policies and the calculation of the loss allowance are provided below.
Fair values of trade and other receivablesDue to the short-term nature of the current receivables, their carrying amount approximates to fair value.
Credit riskThe Consolidated Group has no significant concentration of credit risk with respect to any single counterparty or group of counterparties other than those receivables specifically provided for and mentioned above. The main source of credit risk to the Consolidated Group is considered to relate to the class of assets described as ‘trade and other receivables’.
The Consolidated Group applies the AASB 9 simplified approach to measuring expected credit losses which uses a lifetime expected loss allowance for all trade receivables.
To measure expected credit losses, trade receivables have been grouped based on shared credit risk characteristics and the days past due. The expected loss rates are based on historical loss rates, adjusted to reflect current information and credit quality of the customer.
Trade receivables are written off where there is no reasonable expectation of recovery. Indicators that there is no reasonable expectation of recovery include, amongst others, the failure of a debtor to engage in a repayment plan and a failure to make contractual payments in line with agreed terms.
Impairment losses on trade receivables are presented as net impairment losses within operating profit. Subsequent recoveries of amounts previously written off are credited against the same line item.
On this basis, the loss allowance as at 30 June 2020 was determined as follows for trade receivables:
Current
More than 30 days
past due
More than 60 days
past due Total
30 June 2020Expected loss rate 0.43% 6.58% 80%Gross carrying amount – Trade and other receivables 20,454 76 180 20,710Loss allowance 88 5 144 237
30 June 2019Expected loss rate 0.38% 6.22% 88.6%Gross carrying amount – Trade and other receivables 24,470 530 202 25,202Loss allowance 92 33 179 304
73

11. Trade and other receivables (continued)The closing loss allowances for trade receivables as at 30 June 2020 reconcile to the opening loss allowances as follows:
Consolidated2020$’000
Consolidated2019$’000
Loss allowance (304) (296)Increase in loss allowance recognised in profit or loss during the year (48) (48)Receivables written off as uncollectable 115 40Loss allowance at year end (237) (304)
12. InventoriesConsolidated
2020$’000
Consolidated2019$’000
Processed fish & finished goods 9,129 3,776Feed and packaging 10,499 9,341Inventory provisions (307) (307)
19,321 12,810
Recognition and measurementInventories are measured at the lower of cost and net realisable value. The cost of manufactured products includes direct materials, direct labour and an appropriate portion of variable and fixed overheads. Overheads are applied on the basis of normal operating capacity. Costs are assigned on the basis of weighted average costs.
13. Other assetsConsolidated
2020$’000
Consolidated2019$’000
Prepayments 8,984 7,622Rights to smolt(i) 3,860 1,546
12,844 9,168
(i) Includes rights to selective breeding program with Saltas.
14. Trade and other payablesConsolidated
2020$’000
Consolidated2019$’000
Trade payables 71,141 67,315Other payables 11,724 5,115Goods and services tax (GST) payable – –
82,865 72,430
Recognition and measurementTrade and other payables represent the liabilities for goods and services received by the Consolidated Group that remain unpaid at the end of the reporting period. The balance is recognised as a current liability with the amounts normally paid within 45 days of recognition of the liability.
Fair values of trade and other payablesDue to the short-term nature of trade and other payables, their carrying amount approximates to fair value.
Huon Aquaculture Group Limited
Annual Report 2020
74
Notes to the financial statements
continued

15. BorrowingsConsolidated
2020$’000
Consolidated2019$’000
CurrentSecured Bank Loans 19,404 6,157 Other Loans 4,009 3,495Unsecured Other loans – –
23,413 9,652
Non-currentSecured Bank Loans 149,726 131,696 Other Loans – –Unsecured Other loans 46 46
149,772 131,742
173,185 141,394
The weighted average effective interest rate on the bank loans is 2.45% per annum (2019: 3.35% per annum).
2020$’000
2019$’000
LimitUndrawnBalance Limit
UndrawnBalance
Amortising Term Loan 45,000 – 46,250 –Term Loan 110,000 – 110,000 18,000Term Loan 20,000 15,000 20,000 20,000Working Capital 15,000 5,500 10,000 10,000Bank Guarantee 2,500 2,500 2,500 200Uncommitted foreign exchange contracts – Discretionary – DiscretionaryUncommitted interest rate swaps – Discretionary – DiscretionaryAggregate Facility Limit 192,500 – 188,750Aggregate Undrawn Balance – 23,000 48,200
75

15. Borrowings (continued)The borrowings are secured by means of a charge over the Consolidated Group’s total assets. The carrying amounts of assets pledged as security are as recognised in the Consolidated Group’s balance sheet.
The Consolidated Group has facility agreements (“Facilities”) in place with its key banking partners to source debt and working capital funding. The Facilities, together with certain proceeds from the issue of shares under the Initial Public Offering, are being utilised to fund operations and Huon’s Controlled Growth Strategy. The Facilities are reviewed periodically to maintain an optimal capital structure consistent with the Consolidated Group’s Capital Management strategy.
The Facilities have a variable interest rate on amounts drawn calculated at a variable rate by reference to the Australian dollar BBSY and are subject to line fees on drawn and undrawn facilities.
Facility Renewal:The Consolidated Group entered into an agreement to refinance its debt facilities in October 2018. The total debt facility increased from $113,500,000 to $192,500,000 for a maximum of five years. In FY2020 there was an increase to the Working Capital limit by $5,000,000. Since commencement there has been amortisation without redraw of $5,000,000.
Loan covenants:Under the terms of the Facilities, the group is required to comply with certain financial covenants. During the financial year as part of the annual review of the Consolidated Group’s Facilities, the covenants were updated to the following:
– Equity Ratio (Tangible Net Worth/Total Tangible Assets) greater than 50% (measured annually on 30 June); – Leverage Ratio (Net Debt/Operating EBITDA) not greater than a maximum of 6.50 times at 30 June 2020, 5.50 times at
30 September 2020, 6.50 times at 31 December 2020 and 31 March 2021, 5.00 times at 30 June 2021 and 2.75 times for following periods (measured quarterly on a rolling 12 month basis);
– Interest Cover Ratio (Operating EBITDA/Total Finance Costs) greater than 3.5 times (measured quarterly on a rolling 12 month basis); and
– Actual capital expenditure not more than 110% of the annual capital expenditure budget approved by financiers.
The group complied with the financial covenants throughout the reporting period.
Recognition and measurement
Borrowings Borrowings are initially recognised at fair value, net of transaction costs incurred. Borrowings are subsequently measured at amortised cost. Any difference between the proceeds (net of transaction costs) and the redemption amount is recognised in consolidated income statement over the period of the borrowings using the effective interest method. Fees paid on the establishment of loan facilities are recognised as transaction costs of the loan to the extent that it is probable that some or all of the facility will be drawn down. In this case, the fee is deferred until the draw down occurs. To the extent there is no evidence that it is probable that some or all of the facility will be drawn down, the fee is capitalised as a prepayment for liquidity services and amortised over the period of the facility to which it relates.
Borrowings are removed from the balance sheet when the obligation specified in the contract is discharged, cancelled or expired. The difference between the carrying amount of a financial liability that has been extinguished or transferred to another party and the consideration paid, including any non-cash assets transferred or liabilities assumed, is recognised in consolidated income statement as other income or finance costs.
Borrowings are classified as current liabilities unless the Consolidated Group has an unconditional right to defer settlement of the liability for at least 12 months after the reporting period.
Borrowing CostsGeneral and specific borrowing costs that are directly attributable to the acquisition, construction or production of a qualifying asset are capitalised during the period of time that is required to complete and prepare the asset for its intended use or sale. Qualifying assets are assets that necessarily take a substantial period of time to get ready for their intended use or sale.
All other borrowing costs are recognised in consolidated income statement in the period in which they are incurred.
Critical accounting estimatesThe Consolidated Group has reviewed its ongoing compliance with financial covenants under the Facilities, in particular, compliance with the Leverage Ratio (Net debt/Operating EBITDA) for each quarter up to 30 June 2021. The review has been based on financial budgets approved by the Board, and the Directors and management have considered and assessed reasonably possible changes in key assumptions in considering Operating EBITDA and the net debt position.
The Directors believe the Group will continue to comply with its financial covenants.
Huon Aquaculture Group Limited
Annual Report 2020
76
Notes to the financial statements
continued

16. Issued capitalConsolidated
2020 Consolidated
2019
Number $’000 Number $’000
(a) Ordinary share capital (fully paid):Ordinary shares 87,545,281 164,999 87,337,207 164,302
The Company has authorised share capital amounting to 87,545,281 ordinary shares of no par value.
2020 2019
Note Number $’000 Number $’000
(b) Movements in ordinary share capitalAt the beginning of the reporting period (i) 87,337,207 164,302 87,337,207 164,302Issue of shares pursuant to executive long-term incentive plan 208,074 697 – –
At the end of the reporting period 87,545,281 164,999 87,337,207 164,302
(i) Ordinary shares have no par value and the Company does not have a limited amount of authorised capital.
Ordinary shares participate in dividends and the proceeds on winding up of the Parent Entity in proportion to the number of shares held.
The voting rights attaching to ordinary shares are, on a show of hands every member present at a meeting in person or by proxy shall have one vote, and upon a poll each share shall have one vote.
There are no unquoted equity securities on issue.
There is no current on-market buy-back in respect of the Company’s ordinary shares.
(c) Capital ManagementManagement controls the capital of the Consolidated Group in order to maintain a good debt to equity ratio, provide the shareholders with adequate returns and ensure that the Consolidated Group can fund its operations and continue as a going concern.
The Consolidated Group’s debt and capital include ordinary share capital and financial liabilities, supported by financial assets.
There are no externally imposed capital requirements.
Management effectively manages the Consolidated Group’s capital by assessing the Consolidated Group’s financial risks and adjusting its capital structure in response to changes in these risks and in the market. These responses include the management of debt levels, distributions to shareholders and share issues.
There have been no changes in the strategy adopted by management to control the capital of the Consolidated Group since the prior year.
77

16. Issued capital (continued)Consolidated
2020$’000
Consolidated2019$’000
Total borrowings 173,185 141,394Less cash and cash equivalents (5,934) (2,611)
Net debt 167,251 138,783
Total equity 308,231 314,120
Gearing ratio 54.3% 44.2%
Recognition and measurementOrdinary shares are classified as equity.
Incremental costs directly attributable to the issue of new shares or options are shown in equity as a deduction, net of tax, from the proceeds.
Where any group company purchases the Company’s equity instruments, for example as the result of a share buy-back or a share based payment plan, the consideration paid, including any directly attributable incremental costs (net of income taxes) is deducted from equity attributable to the owners of Huon Aquaculture Group Limited as ordinary share capital until the shares are cancelled or reissued. Where such ordinary shares are subsequently reissued, any consideration received, net of any directly attributable incremental transaction costs and the related income tax effects, is included in equity attributable to the owners of Huon Aquaculture Group Limited.
17. Other reservesShare-based payment reserve
Consolidated2020$’000
Consolidated2019$’000
Balance at the beginning of financial year 1,324 1,374Shares issued under employee share plan (697) (601)Share-based payment expense 183 551
Balance at the end of financial year 810 1,324
The share-based payment reserve is used to recognise the grant date fair value of performance rights issued to employees.
The performance rights are issued to the Chief Executive Officer and Management as part of the LTI plan. Refer to note 26 for further details.
Huon Aquaculture Group Limited
Annual Report 2020
78
Notes to the financial statements
continued

18. Investments in financial assetsConsolidated
2020$’000
Consolidated2019$’000
Investment in Salmon Enterprises of Tasmania Pty Ltd (“Saltas”)(i) 1,341 1,341Investment in Commercial Fishermans Co-operative 1 1
1,342 1,342
(i) The Consolidated Group holds ordinary share capital of Salmon Enterprises of Tasmania Pty Ltd (“Saltas”).
The Directors of Huon Aquaculture Group Limited do not believe that the Consolidated Group is able to exert significant influence over Saltas.
Recognition and Measurement Investments in financial assets are classified as financial assets at fair value through other comprehensive income (FVOCI).
The investments are not held for trading, and which the Consolidated Group has irrevocably elected at initial recognition to recognise in this category. These are strategic investments and the Consolidated Group considers this classification to be more relevant.
At initial recognition, the Consolidated Group measures a financial asset at its fair value plus, in the case of a financial asset not at fair value through profit or loss, transaction costs that are directly attributable to the acquisition of the financial asset.
On disposal of these investments, any related balance within the FVOCI reserve is reclassified to retained earnings.
19. Derivative assetsConsolidated
2020$’000
Consolidated2019$’000
Derivatives carried at fair value:Foreign currency forward contracts 2,255 –Commodity forward contract – 56
2,255 56
Refer to note 20 for fair value measurement and hierarchy.
20. Fair value measurementsThe Consolidated Group measures and recognises the following assets at fair value on a recurring basis after initial recognition:
– Biological assets (refer to note 4) – Derivative assets (refer to note 19) – Investments in financial assets (refer to note 18) – Derivative liabilities (refer to note 33)
The Consolidated Group does not subsequently measure any liabilities at fair value on a recurring basis, or any assets or liabilities at fair value on a non-recurring basis.
Fair value hierarchyAASB 13 requires the disclosure of fair value information by level of the fair value hierarchy, which categorises fair value measurements into one of three possible levels based on the lowest level that an input that is significant to the measurement can be categorised into as follows:
Level 1: Measurements based on quoted prices (unadjusted) in active markets for identical assets or liabilities that the entity can access at the measurement date.
Level 2: Measurements based on inputs other than quoted prices included in Level 1 that are observable for the asset or liability, either directly or indirectly.
Level 3: Measurements based on unobservable inputs for the asset or liability.
The fair values of assets and liabilities that are not traded in an active market are determined using one or more valuation techniques. These valuation techniques maximise, to the extent possible, the use of observable market data. If all significant inputs required to measure fair value are observable, the asset or liability is included in Level 2. If one or more significant inputs are not based on observable market data, the asset or liability is included in Level 3.
79
Other

20. Fair value measurements (continued)Valuation techniquesThe Consolidated Group selects a valuation technique that is appropriate in the circumstances and for which sufficient data is available to measure fair value. The availability of sufficient and relevant data primarily depends on the specific characteristics of the asset or liability being measured.
There has been no change in the valuation technique(s) used to calculate the fair values disclosed in the financial statements.
There has been no transfers between the fair value measurement levels during the financial year.
Recognition and measurementFinancial instrumentsThe Consolidated Group enters into a variety of derivative financial instruments to manage its exposure to foreign exchange rate risk, including forward foreign exchange contracts. The derivative financial instruments do not qualify for hedge accounting. Changes in the fair value of the derivative financial instruments are recognised immediately in consolidated income statement.
Derivatives are initially recognised at fair value on the date a derivative contract is entered into and are subsequently remeasured to their fair value at each reporting date. In accordance with Level 2 of the fair value hierarchy.
The Consolidated Group classifies its financial assets in the following measurement categories:
– those to be measured subsequently at fair value (either through OCI or through profit or loss), and – those to be measured at amortised cost.
The classification depends on the entity’s business model for managing the financial assets and the contractual terms of the cash flows.
For assets measured at fair value, gains and losses will either be recorded in profit or loss or OCI. For investments in equity instruments that are not held for trading, this will depend on whether the Consolidated Group has made an irrevocable election at the time of initial recognition to account for the equity investment at fair value through other comprehensive income (FVOCI).
The Consolidated Group reclassifies debt investments when and only when its business model for managing those assets changes.
Recognition and derecognition Regular way purchases and sales of financial assets are recognised on trade-date, the date on which the Consolidated Group commits to purchase or sell the asset. Financial assets are derecognised when the rights to receive cash flows from the financial assets have expired or have been transferred and the Consolidated Group has transferred substantially all the risks and rewards of ownership.
Measurement At initial recognition, the Consolidated Group measures a financial asset at its fair value plus, in the case of a financial asset not at fair value through profit or loss (FVPL), transaction costs that are directly attributable to the acquisition of the financial asset. Transaction costs of financial assets carried at FVPL are expensed in profit or loss.
Financial assets with embedded derivatives are considered in their entirety when determining whether their cash flows are solely payment of principal and interest.
Debt instrumentsSubsequent measurement of debt instruments depends on the Consolidated Group’s business model for managing the asset and the cash flow characteristics of the asset. There are three measurement categories into which the group classifies its debt instruments:
– Amortised cost: Assets that are held for collection of contractual cash flows where those cash flows represent solely payments of principal and interest are measured at amortised cost. Interest income from these financial assets is included in finance income using the effective interest rate method. Any gain or loss arising on derecognition is recognised directly in profit or loss and presented in other gains/(losses) together with foreign exchange gains and losses. Impairment losses are presented as separate line item in the statement of profit or loss.
– FVOCI: Assets that are held for collection of contractual cash flows and for selling the financial assets, where the assets’ cash flows represent solely payments of principal and interest, are measured at FVOCI. Movements in the carrying amount are taken through OCI, except for the recognition of impairment gains or losses, interest income and foreign exchange gains and losses which are recognised in profit or loss. When the financial asset is derecognised, the cumulative gain or loss previously recognised in OCI is reclassified from equity to profit or loss and recognised in other gains/(losses). Interest income from these financial assets is included in finance income using the effective interest rate method. Foreign exchange gains and losses are presented in other gains/(losses) and impairment expenses are presented as separate line item in the statement of profit or loss.
– FVPL: Assets that do not meet the criteria for amortised cost or FVOCI are measured at FVPL. A gain or loss on a debt investment that is subsequently measured at FVPL is recognised in profit or loss and presented net within other gains/(losses) in the period in which it arises.
ImpairmentThe Consolidated Group assesses on a forward looking basis the expected credit losses associated with its debt instruments carried at amortised cost and FVOCI. The impairment methodology applied depends on whether there has been a significant increase in credit risk.
For trade receivables, the Consolidated Group applies the simplified approach permitted by AASB 9, which requires expected lifetime losses to be recognised from initial recognition of the receivables, see note 11 for further details.
Huon Aquaculture Group Limited
Annual Report 2020
80
Notes to the financial statements
continued

21. Financial risk managementThe Consolidated Group’s activities expose it to a variety of financial risks: market risk (including currency risk, interest rate risk and price risk), credit risk and liquidity risk. The Consolidated Group’s overall risk management program focuses on the unpredictability of financial markets and seeks to minimise potential adverse effects on the financial performance of the Consolidated Group. The Consolidated Group uses derivative financial instruments such as foreign exchange contracts and interest rate swaps to manage certain risk exposures. i.e. not used as trading or other speculative instruments. The Consolidated Group uses different methods to measure different types of risk to which it is exposed. These methods include sensitivity analysis in the case of interest rate, foreign exchange and other price risks, aging analysis for credit risk and beta analysis in respect of investment portfolios to determine market risk.
Risk management is carried out under policies approved by the Board.
The Consolidated Group holds the following financial instruments:
Consolidated2020$’000
Consolidated2019$’000
Financial AssetsCash and cash equivalents 5,934 2,611Trade and other receivables 24,472 30,468Investments in financial assets 1,342 1,342Derivative assets 2,255 56
Total Financial Assets 34,003 34,477
Financial LiabilitiesTrade and other payables 82,865 72,430Borrowings 173,185 141,394Lease liabilities 169,236 –Derivative liabilities 3,025 2,222
Total Financial Liabilities 428,311 216,046
81
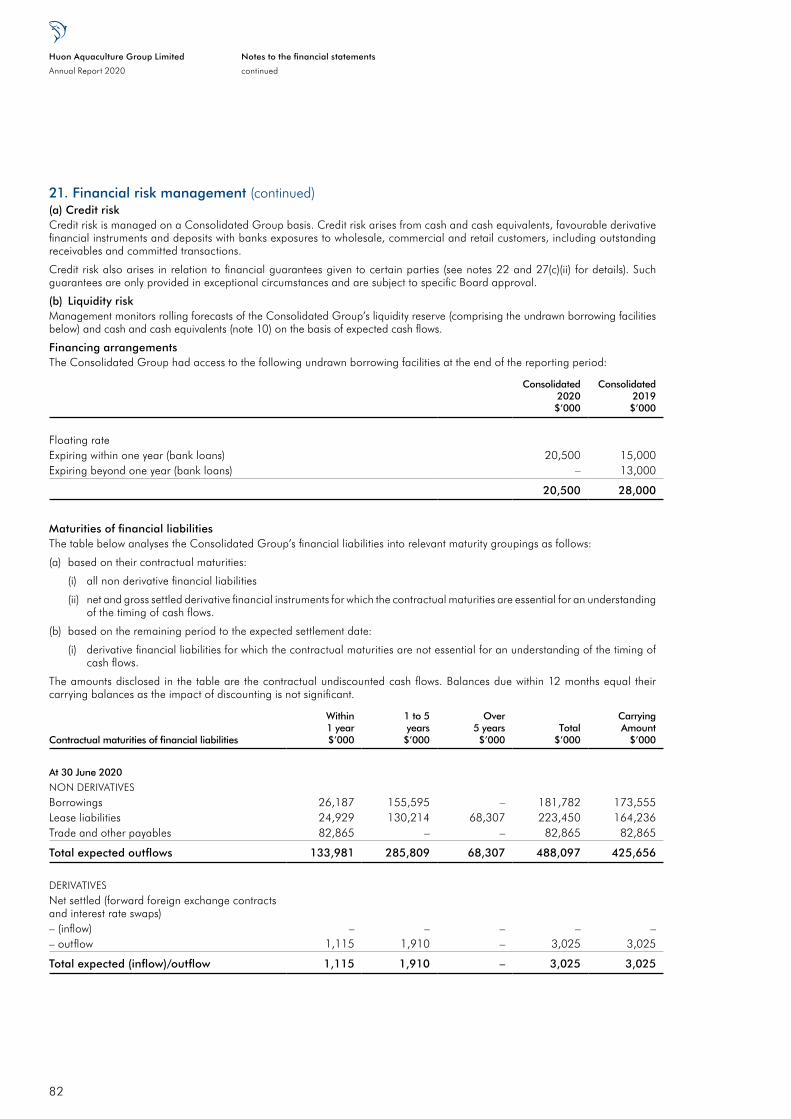
21. Financial risk management (continued)(a) Credit riskCredit risk is managed on a Consolidated Group basis. Credit risk arises from cash and cash equivalents, favourable derivative financial instruments and deposits with banks exposures to wholesale, commercial and retail customers, including outstanding receivables and committed transactions.
Credit risk also arises in relation to financial guarantees given to certain parties (see notes 22 and 27(c)(ii) for details). Such guarantees are only provided in exceptional circumstances and are subject to specific Board approval.
(b) Liquidity riskManagement monitors rolling forecasts of the Consolidated Group’s liquidity reserve (comprising the undrawn borrowing facilities below) and cash and cash equivalents (note 10) on the basis of expected cash flows.
Financing arrangementsThe Consolidated Group had access to the following undrawn borrowing facilities at the end of the reporting period:
Consolidated2020$’000
Consolidated2019$’000
Floating rateExpiring within one year (bank loans) 20,500 15,000Expiring beyond one year (bank loans) – 13,000
20,500 28,000
Maturities of financial liabilitiesThe table below analyses the Consolidated Group’s financial liabilities into relevant maturity groupings as follows:
(a) based on their contractual maturities:
(i) all non derivative financial liabilities
(ii) net and gross settled derivative financial instruments for which the contractual maturities are essential for an understanding of the timing of cash flows.
(b) based on the remaining period to the expected settlement date:
(i) derivative financial liabilities for which the contractual maturities are not essential for an understanding of the timing of cash flows.
The amounts disclosed in the table are the contractual undiscounted cash flows. Balances due within 12 months equal their carrying balances as the impact of discounting is not significant.
Contractual maturities of financial liabilities
Within 1 year $’000
1 to 5 years
$’000
Over 5 years $’000
Total$’000
Carrying Amount
$’000
At 30 June 2020
NON DERIVATIVESBorrowings 26,187 155,595 – 181,782 173,555Lease liabilities 24,929 130,214 68,307 223,450 164,236Trade and other payables 82,865 – – 82,865 82,865
Total expected outflows 133,981 285,809 68,307 488,097 425,656
DERIVATIVESNet settled (forward foreign exchange contracts and interest rate swaps)– (inflow) – – – – –– outflow 1,115 1,910 – 3,025 3,025
Total expected (inflow)/outflow 1,115 1,910 – 3,025 3,025
Huon Aquaculture Group Limited
Annual Report 2020
82
Notes to the financial statements
continued

21. Financial risk management (continued)
Contractual maturities of financial liabilities
Within 1 year $’000
1 to 5 years
$’000
Over 5 years $’000
Total$’000
Carrying Amount
$’000
At 30 June 2019
NON DERIVATIVESBorrowings 13,454 144,779 – 158,233 141,394Trade and other payables 72,430 – – 72,430 72,430
Total expected outflows 85,884 144,779 – 230,663 213,824
DERIVATIVESNet settled (forward foreign exchange contracts and interest rate swaps)– (inflow) (56) – – (56) (56)– outflow 772 1,450 – 2,222 2,222
Total expected (inflow)/outflow 716 1,450 – 2,166 2,166
(c) Market risk management(i) INTEREST RATE RISK MANAGEMENTThe Consolidated Group’s main interest rate risk arises from long-term borrowings with variable rates, which expose the Consolidated Group to cash flow interest rate risk. Group policy is to maintain up to 50% of its borrowings at fixed rate using floating-to-fixed interest rate swaps to achieve this when necessary. Generally, the Consolidated Group enters into long-term borrowings at floating rates and swaps them into fixed rates that are lower than those available if the Consolidated Group borrowed at fixed rates directly.
At 30 June 2020: 98% (2019: 98%) of Consolidated Group debt is floating. The Consolidated Group also manages interest rate risk by ensuring that, whenever possible, payables are paid within any pre-agreed credit terms.
The net effective variable interest rate borrowings (i.e. unhedged debt) expose the Consolidated Group to interest rate risk which will impact future cash flows and interest charges and is indicated by the following floating interest rate financial liabilities:
The following table details the notional principle amounts at the end of the reporting period.
Weighted average interest rate
Consolidated notional principal value
2020%
2019%
2020$’000
2019$’000
Floating rate instrumentsBank Loans 2.45% 3.35% 169,500 138,250
169,500 138,250
83

21. Financial risk management (continued)Interest rate sensitivity analysisProfit or loss is sensitive to higher/ lower interest income from cash and cash equivalents, and higher/ lower interest expense on variable rate borrowings as a result of changes in interest rates.
Impact on post-tax profit
2020$’000
2019$’000
Interest rates – increase by 50 basis points (638) 348Interest rates – decrease by 50 basis points (707) (348)
(ii) FOREIGN EXCHANGE RISKThe Consolidated Group operates internationally and is exposed to foreign exchange risk arising from various currency exposures, predominantly with respect to the US Dollar and Japanese Yen.
Foreign exchange risk arises when future commercial transactions and recognised financial assets and financial liabilities are denominated in a currency that is not the entity’s functional currency. The risk is measured using sensitivity analysis and cash flow forecasting.
The Consolidated Group hedges its foreign exchange risk exposure arising from future commercial transactions and recognised assets and liabilities using forward contracts. The Consolidated Group’s risk management policy is to hedge between 75% – 125% of cash flows arising from known inventory purchase commitments, mainly denominated in US dollars for the subsequent six months.
The Consolidated Group’s exposure to foreign currency risk at the end of the reporting period, expressed in Australian dollar, was as follows:
Consolidated2020$’000
Consolidated2019$’000
Trade payables (import creditors) 12,521 24,470Trade receivable (import debtors) 4,408 2,089Forward exchange contractsBuy foreign currency (cash flow hedges) 6,903 12,088Sell foreign currency (cash flow hedges) 30,017 11,742
Consolidated Group sensitivityBased on the financial instruments held at 30 June 2020, had the Australian dollar strengthened/weakened by 10% against the US dollar and the Japanese Yen with all other variables held constant, the Consolidated Group’s pre-tax profit for the period would have been $6,160,804 higher /$1,515,777 lower (2019: $167,204 lower/$38,052 lower), mainly as a result of foreign exchange gains/losses on translation of US dollar and JPY Yen denominated financial instruments as detailed in the above table.
Recognition and measurementForeign Currency Transactions and BalancesFUNCTIONAL AND PRESENTATION CURRENCYThe functional currency of each group entity is measured using the currency of the primary economic environment in which that entity operates. The consolidated financial statements are presented in Australian dollars which is the Parent Entity’s functional and presentation currency.
TRANSACTIONS AND BALANCESForeign currency transactions are translated into functional currency using the exchange rates prevailing at the date of the transaction. Foreign currency monetary items are translated at the year-end exchange rate. Non-monetary items measured at historical cost continue to be carried at the exchange rate at the date of the transaction. Non-monetary items measured at fair value are reported at the exchange rate at the date when fair values were determined.
Exchange differences arising on the translation of monetary items are recognised in consolidated income statement, except where deferred in equity as a qualifying cash flow or net investment hedge.
Exchange differences arising on the translation of non-monetary items are recognised directly in other comprehensive income to the extent that the underlying gain or loss is directly recognised in other comprehensive income, otherwise the exchange difference is recognised in consolidated income statement.
Huon Aquaculture Group Limited
Annual Report 2020
84
Notes to the financial statements
continued

22. Parent informationThe following information has been extracted from the books and records of the parent and has been prepared in accordance with Australian Accounting Standards.
Consolidated2020$’000
Consolidated2019$’000
Statement of financial positionAssetsCurrent assets 382 1,578Non-current assets 170,766 161,709Total assets 171,148 163,287
LiabilitiesCurrent liabilities – –Total liabilities – –
EquityIssued capital 164,999 164,302Share-based payment reserve 810 1,324Retained earnings 7,959 4,648Dividends provided for or paid (2,620) (6,987)Total equity 171,148 163,287
Financial performanceProfit/(loss) for the period 10,298 4,505
Total comprehensive income/(loss) 10,298 4,505
Parent Entity financial informationThe financial information for the Parent Entity, Huon Aquaculture Group Limited, disclosed above has been prepared on the same basis as the consolidated financial statements, except as set out below. Huon Aquaculture Group Limited is the ultimate parent entity.
Transactions with related entitiesThe profit of the Parent Entity shown above is due to the transfer of dividend payable within the Group.
Investments in subsidiaries, associates, and joint venture entities are accounted for at cost in the financial statements of Huon Aquaculture Group Limited. Dividends received from associates are recognised in the Parent Entity’s consolidated income statement when its right to receive the dividend is established.
85

22. Parent information (continued)
Tax consolidation legislationHuon Aquaculture Group Limited and its wholly-owned Australian controlled entities have implemented the tax consolidation legislation.
The head entity, Huon Aquaculture Group Limited, and the controlled entities in the tax Consolidated Group account for their own current and deferred tax amounts. These tax amounts are measured as if each entity in the tax Consolidated Group continues to be a stand alone taxpayer in its own right.
In addition to its own current and deferred tax amounts, Huon Aquaculture Group Limited also recognises the current tax liabilities (or assets) and the deferred tax assets arising from unused tax losses and unused tax credits assumed from controlled entities in the tax Consolidated Group. In the current year tax losses of $15,226,061 (tax effected at 30%) (2019: $10,482,819
(tax effected at 30%)) have been assumed from controlled entities in the tax Consolidated Group.
The entities have also entered a tax funding agreement under which the wholly-owned entities fully compensate Huon Aquaculture Group Limited for any current tax payable assumed and are compensated by Huon Aquaculture Group Limited for any current tax receivable and deferred tax assets relating to unused tax losses or unused tax credits that are transferred to Huon Aquaculture Group Limited under the tax consolidation legislation. The funding amounts are determined by reference to the amounts recognised in the wholly-owned entities’ financial statements.
The amounts receivable/payable under the tax funding agreement are due upon receipt of the funding advice from the head entity, which is issued as soon as practicable after the end of each financial year. The head entity may also require payment of interim funding amounts to assist with its obligations to pay tax instalments.
Assets or liabilities arising under tax funding agreements with the tax consolidated entities are recognised as current amounts receivable from or payable to other entities in the Consolidated Group.
Any difference between the amounts assumed and amounts receivable or payable under the tax funding agreement are recognised as a contribution to (or distribution from) wholly-owned tax consolidated entities.
23. Deed of cross guaranteeThe wholly-owned subsidiaries disclosed in note 32 are parties to a deed of cross guarantee under which each company guarantees the debts of the others. By entering into the deed, the wholly-owned entities have been relieved from the requirement to prepare a financial report and directors’ report under Instrument 2016/785 issued by the Australian Securities and Investments Commission.
The closed group financial information for 2019 and 2020 is identical to the financial information included in the consolidated financial statements. The wholly-owned subsidiaries became a party to the deed of cross guarantee dated 28 June 2016.
The companies disclosed in note 32 represent a ‘closed group’ for the purposes of the Instrument, and as there are no other parties to the deed of cross guarantee that are controlled by Huon Aquaculture Group Limited, they also represent the ‘extended closed group’.
Huon Aquaculture Group Limited
Annual Report 2020
86
Notes to the financial statements
continued

24. Income taxConsolidated
2020$’000
Consolidated2019$’000
(a) Income tax recognised in profit or loss:Tax (expense)/income comprises: Current tax (expense)/income 382 1,578 Adjustments for current tax of prior periods 3,543 4,871 Increase in deferred tax assets 17,164 11,161 Increase in deferred tax liabilities (17,468) (12,456)Total tax benefit/(expense) 3,621 5,154
The prima facie tax on profit from ordinary activities before income tax is reconciled to the income tax expense as follows:Profit from continuing operations before income tax expense 1,294 4,298Prima facie tax payable on profit from ordinary activities before income tax at 30% (2019: 30%) for the Consolidated Group. (389) (1,290)
Adjustment recognised in the current year in relation to prior years: Research and development tax credit 4,007 6,448 Other 7 –Non-tax deductible items (4) (4)Income tax benefit/(expense) 3,621 5,154
The applicable weighted average effective tax rates are as follows: (279.8%) (119.9%)
(b) Income tax recognised directly in equity:Deferred tax: Share issue costs – –
(c) Current tax balances:Current tax receivables comprise:Income tax receivable attributable to: Entities in the tax-Consolidated Group 382 1,578
Net current tax balance 382 1,578
Current tax liabilities comprise:Income tax payable attributable to: Entities in the tax-Consolidated Group – –Net current tax balance – –
87

24. Income tax (continued)(d) Deferred tax balances:
Taxable and deductible temporary differences, comprise of the following and arise from the following movements:
2020
Openingbalance
$’000
Chargedto income
$’000
Adjustmentsfor current tax
of prior periods$’000
Closingbalance
$’000
Gross deferred tax liabilities:Biological assets (56,746) (15,469) – (72,215)Property, plant and equipment (14,686) (23,253) (24,688) (62,627)Trade and other receivables (85) – – (85)Other non-current assets (1,804) 165 (1,716) (3,355)Other financial assets (254) 147 – (107)Lease liabilities – 20,942 29,829 50,771
(73,575) (17,468) 3,425 (87,618)Gross deferred tax assets:Provisions 2,684 412 – 3,096Other financial assets – – – –Trade and other receivables 92 (697) – (605)Property, plant and equipment 166 (14) – 152Other intangibles 3 – – 3Blackhole expenditure – 67 – 67Tax Losses 10,493 15,226 (320) 25,399Research and development – – 1,804 1,804Borrowing costs – – – –Share-based payments 397 (154) – 243Deferred Revenue 727 1,240 – 1,967Trade and other payables 823 1,084 399 2,306
15,385 17,164 1,883 34,432
Net deferred tax asset/(liability) (58,190) (304) 5,308 (53,186)
2019
Openingbalance
$’000
Chargedto income
$’000
Adjustmentsfor current tax
of prior periods$’000
Closingbalance
$’000
Gross deferred tax liabilities:Biological assets (46,597) (10,149) – (56,746)Property, plant and equipment (12,821) (2,547) 682 (14,686)Trade and other receivables (146) 61 – (85)Other non-current assets (1,937) 133 – (1,804)Other financial assets (300) 46 – (254)
(61,801) (12,456) 682 (73,575)Gross deferred tax assets:Provisions 2,379 305 – 2,684Other financial assets – – – –Trade and other receivables (82) 174 – 92Property, plant and equipment 185 (19) – 166Other intangibles 3 – – 3Share issue expenses 335 (335) – –Tax Losses – 10,483 10 10,493Research and development – – – –Borrowing costs 3 7 (10) –Share-based payments 412 (15) – 397Deferred Revenue 866 (139) – 727Trade and other payables 123 700 – 823
4,224 11,161 – 15,385
Net deferred tax asset/(liability) (57,577) (1,295) 682 (58,190)
Huon Aquaculture Group Limited
Annual Report 2020
88
Notes to the financial statements
continued

24. Income tax (continued)
Recognition and measurement(Refer to note 22 for Tax Consolidation legislation)
The income tax expense/income for the year comprises current income tax expense/income and deferred tax expense/income.
Current income tax expense charged to the consolidated income statement is the tax payable on taxable income. Current tax liabilities/assets are measured at the amounts expected to be paid to/recovered from the relevant taxation authority.
Deferred income tax expense reflects movements in deferred tax asset and deferred tax liability balances during the year as well as unused tax losses.
Huon Aquaculture Group Limited and its wholly-owned Australian controlled entities have implemented the tax consolidation legislation. As a consequence, these entities are taxed as a single entity and the deferred tax assets and liabilities of these entities are set off in the consolidated financial statements.
Current and deferred tax is recognised in consolidated income statement, except to the extent that it relates to items recognised in other comprehensive income or directly in equity. In this case, the tax is also recognised in other comprehensive income or directly in equity, respectively.
Except for business combinations, no deferred income tax is recognised from the initial recognition of an asset or liability, excluding a business combination, where there is no effect on accounting or taxable consolidated income statement.
Deferred tax assets and liabilities are calculated at the tax rates that are expected to apply to the period when the asset is realised or the liability is settled and their measurement also reflects the manner in which management expects to recover or settle the carrying amount of the related asset or liability. With respect to non-depreciable items of property, plant and equipment measured at fair value and marine leases, the related deferred tax liability or deferred tax asset is measured on the basis that the carrying amount of the asset will be recovered entirely through sale.
Deferred tax assets relating to temporary differences and unused tax losses are recognised only to the extent that it is probable that future taxable profit will be available against which the benefits of the deferred tax asset can be utilised.
Where temporary differences exist in relation to investments in subsidiaries, branches, associates, and joint ventures, deferred tax assets and liabilities are not recognised where the timing of the reversal of the temporary difference can be controlled and it is not probable that the reversal will occur in the foreseeable future.
Current tax assets and liabilities are offset where a legally enforceable right of set-off exists and it is intended that net settlement or simultaneous realisation and settlement of the respective asset and liability will occur. Deferred tax assets and liabilities are offset where: (a) a legally enforceable right of set-off exists; and (b) the deferred tax assets and liabilities relate to income taxes levied by the same taxation authority on either the same taxable entity or different taxable entities, where it is intended that net settlement or simultaneous realisation and settlement of the respective asset and liability will occur in future periods in which significant amounts of deferred tax assets or liabilities are expected to be recovered or settled.
The Group is subject to income taxes and is entitled to claims for certain tax deductions. Judgements and estimates are required in determining the provision for income taxes and claims for deductions. Where the final tax outcome of these matters is different from the carrying amounts, such differences will impact the current and deferred tax provisions in the period in which such determination is made.
Companies within the Consolidated Group may be entitled to claim special tax deductions for investments in qualifying assets or in relation to qualifying expenditure (e.g. the Research and Development Incentive regime in Australia). The Consolidated Group accounts for such allowances as tax credits, which means that the allowance reduces income tax payable and current tax expense. A deferred tax asset is recognised for unclaimed tax credits that are carried forward.
89

25. Key management personnel compensationThe totals of remuneration for key management personnel (KMP) of the Consolidated Group during the year are as follows:
Consolidated2020
$
Consolidated2019
$
Short-term employee benefits 2,959,948 2,813,097Post-employment benefits 218,726 203,931Long-term benefits – –Termination benefits – –Share-based payments 151,590 488,906
3,330,264 3,505,934
No remuneration was paid by the Parent Entity to the KMP.
26. Share-based payment(a) Share-based payment arrangementsThe Consolidated Group offers the Chief Executive Officer, Executive Management Group and senior management the opportunity to participate in the Long-Term Incentive Plan (“the Plan”), which involves performance rights to acquire shares in Huon Aquaculture Group Limited. The Plan is designed to:
– assist in the motivation, retention and reward of employees, including the Chief Executive Officer and members of management; and
– align the interests of employees participating in the Plan more closely with the interests of shareholders by providing an opportunity for those employees to receive an equity interest in the Huon Aquaculture Group through the granting of performance rights.
Performance periodUnder the Plan, performance rights were issued to the Chief Executive Officer and members of management as the LTI component of their remuneration. Performance rights granted under the LTI offer have the following vesting conditions:
– 50% of the performance rights will be subject to a vesting condition based on the Company’s earnings per share (EPS); and – 50% of the performance rights will be subject to a vesting condition based on the Company’s return on assets (ROA)
If the specific performance criteria are satisfied, the Board has resolved to issue, or procure the transfer of Shares, or alternatively pay the cash amount of equivalent value, to Mr Bender and management on the vesting of those performance rights.
In the event that a performance right holder ceases to be an employee prior to the completion of the performance period due to a qualifying reason (i.e. other than for dismissal for cause) and such cessation occurs within the first twelve months of the grant of the performance rights, then the performance rights will be forfeited on a pro-rata basis for the number of months employed in the full year.
Performance rights that have vested may be exercised until the applicable expiry date. If any shares are issued following exercise of a vested performance right prior to the applicable expiry date then they may not be sold or transferred before three years after the beginning of the performance period.
Huon Aquaculture Group Limited
Annual Report 2020
90
Notes to the financial statements
continued

Number of Shares to be AllocatedThe percentage of performance rights that vest at the end of each applicable performance period will be determined by reference to the following schedule:
Earnings Per Share (EPS) – 50% of LTI
EPS compound annual growth rate (‘CAGR’) Vesting outcome
Less than 7.5% CAGR Nil7.5% CAGR 50%Above 7.5% CAGR but below 10% CAGR Pro-rata from 50-99%10% CAGR or greater 100%
Return On Assets (ROA) – 50% of LTI
ROA (return for the reporting period) Vesting outcome
Less than 10% return Nil10% return 50%Above 10% return but below 15% return Pro-rata from 50-99%15% return or greater 100%
Earnings per share compound annual growth is calculated as the net profit after income tax (NPAT) (excluding adjustment for biological assets) divided by the weighted average number of ordinary shares on issue. Compared to an absolute profit measure, EPS takes into account changes in the equity base and for this reason it is preferred to other profit based metrics.
Return on Assets (ROA) is calculated as statutory earnings before interest and tax (EBIT) (excluding adjustment for biological assets), divided by total assets excluding cash and fair value adjustment on biological assets (average of opening and closing balance). ROA is an appropriate measure for asset intensive industries which reinforces the need to invest capital on projects with a superior return.
(b) Performance rights grantedSet out below is a summary of performance rights granted under the LTI plan.
2020 Performance Period Balance at Start of Year Other
Granted During
Year Forfeited Vested
Balance at End
of YearFV per ShareGrant Date From To
30 Nov 16 1 Jul 16 30 Jun 18 110,424 – – – (110,424) – $3.7130 Nov 16 1 Jul 16 30 Jun 19 97,650 – – – (97,650) – $3.7130 Nov 17 1 Jul 17 30 Jun 20 210,429 – – (191,488) – 18,941 $4.0131 Oct 18 1 Jul 18 30 Jun 21 237,360 – – – – 237,360 $4.2623 Oct 19 1 Jul 19 30 Jun 22 – – 263,502 – – 263,502 $4.30
2019 Performance Period Balance at Start of Year Other
Granted During
Year Forfeited Vested
Balance at End
of YearFV per ShareGrant Date From To
25 Nov 15 1 Jul 15 30 Jun 17 30,136 – – – (30,136) – $4.0425 Nov 15 1 Jul 15 30 Jun 18 32,360 – – – (32,360) – $4.0419 Oct 15 1 Jul 15 30 Jun 17 32,561 – – – (32,561) – $4.0119 Oct 15 1 Jul 15 30 Jun 18 34,964 – – – (34,964) – $4.0130 Nov 16 1 Jul 16 30 Jun 18 110,424 – – – – 110,424 $3.7130 Nov 16 1 Jul 16 30 Jun 19 144,340 – – (46,690) – 97,650 $3.7130 Nov 17 1 Jul 17 30 Jun 20 210,429 – – – – 210,429 $4.0131 Oct 18 1 Jul 18 30 Jun 21 – – 237,360 – – 237,360 $4.26
91
26. Share-based payment (continued)

(c) Fair value of performance rights grantedFor the performance rights granted during the current financial year, the fair values were measured at the grant date of 23 October 2019 for those granted to the Chief Executive Officer and to management.
The fair value of the performance rights granted under the Plan was calculated using the Black-Scholes option pricing methodology. The fair value of these performance rights do not take into account the EPS and ROA hurdles being met, as they are non-market related vesting conditions.
The following were the key assumptions used in determining the valuation:
Chief Executive
OfficerSenior
Management
Share price at grant date $4.47 $4.47Dividend yield (per annum effective) 1.3% 1.3%Risk free discount rate (per annum) 1.37% 1.37%Expected price volatility 13.80% 13.80%Term of performance right 1-3 years 1-3 years Fair value of performance right $4.30 $4.30
The expense recognised in relation to performance rights applicable to the Chief Executive Officer and management for the year ended 30 June 2020 is $182,742 (2019: $551,261).
Recognition and measurementThe Consolidated Group provides benefits to the Chief Executive Officer and certain management in the form of share-based payment, whereby services are rendered in exchange for rights over shares (performance rights). These benefits are provided as part of the Consolidated Group’s long-term incentive plan.
The fair value of the performance rights is recognised as an employee benefits expense, with a corresponding increase in equity. The total amount to be expensed is determined by reference to the fair value of the performance rights granted, which includes any market performance conditions and the impact of any non-vesting conditions, but excludes the impact of any service and non-market performance vesting conditions. Non-market vesting conditions are included in assumptions about the number of performance rights that are expected to vest.
The total expense is recognised over the period in which the performance and/or service conditions are fulfilled (the vesting period), ending on the date on which the relevant employees become fully entitled to the award (the vesting date).
At the end of each reporting period, the Consolidated Group revises its estimates of the number of awards that are expected to vest based on the non-market vesting conditions. The impact of the revision to original estimates, if any, is recognised in profit or loss, with a corresponding adjustment to equity.
Huon Aquaculture Group Limited
Annual Report 2020
92
Notes to the financial statements
continued
26. Share-based payment (continued)

27. Related party transactions
Identity of related partiesThe following persons and entities are regarded as related parties:
(a) Controlled entities:Refer to note 31 for details of equity interests in entities controlled by Huon Aquaculture Group Limited.
(b) Key Management Personnel:Directors and other Key Management Personnel (KMP) also include close members of the families of Directors and other KMP.In determining the disclosures noted below, the KMP have made appropriate enquiries to the best of their ability and the information presented reflects their knowledge.All transactions entered into during the year were on normal commercial terms and conditions no more favourable than those if the entity was dealing with an unrelated party at on an arm’s length basis.
Consolidated2020
$
Consolidated2019
$
(i) Compensation of KMPDetails of KMP compensation are disclosed in the Remuneration Report and in note 24 to the financial statements.
(ii) Compensation of close family membersOther transactions
Short-term employee benefits 331,433 289,172Superannuation Contributions
Contributions to superannuation funds on behalf of employees 28,995 24,182
(iii) Dividend revenueKey Management Personnel – –
(iv) Purchases from entities controlled by Key Management PersonnelThe group acquired the following goods and services from entities that are controlled by members of the group’s Key Management Personnel:
Land, Buildings and Property, Plant and Equipment – –Leases of assets 693,416 455,357
693,416 455,357
(v) Outstanding balances arising from sales/purchases of goods and servicesCurrent Payables:
Entities controlled by close family members 233,393 164,340Entities controlled by key management personnel – –
233,393 164,340
(c) Investments(i) Purchase (sales) of goods and services
The Consolidated Group entered into transactions with Salmon Enterprises of Tasmania Pty Ltd for the supply of smolt (juvenile salmon) and the sale of other goods and services. These transactions were conducted on normal commercial terms and conditions.
Consolidated2020
$
Consolidated2019
$
Salmon Enterprises of Tasmania Pty Ltd 3,394,611 2,237,632
(ii) Financial guarantee contract
During the 2012 financial year the Consolidated Group became party to a $7.02 million facility that Salmon Enterprises of Tasmania Pty Ltd entered into with BankWest through a financial guarantee contract. The facility was amended during the 2018 financial year. The Consolidated Group’s guarantee is for $0.98 million.
93

28. Remuneration of auditorsDuring the year the following fees were paid or payable for services provided by the auditor of the Parent Entity, its related practices and non-related audit firms:
Consolidated2020
$
Consolidated2019
$
(a) PricewaterhouseCoopers Australia(i) Audit and other assurance services
Audit and review of financial statements 223,500 200,000Other assurance services – 6,000Total remuneration for audit and other assurance services 223,500 206,000
(ii) Taxation & other advisory servicesTaxation advisory services 149,518 114,922Other advisory services 19,026 –Total remuneration for taxation and other advisory services 168,544 114,922
Total remuneration of PricewaterhouseCoopers Australia 392,044 320,922
(b) Non PricewaterhouseCoopers firms(i) Audit and other assurance services
Other – –Total remuneration for audit and other assurance services – –
(ii) Taxation and other advisory servicesTaxation advisory services 70,580 33,096Other advisory services 87,110 –Total remuneration for taxation services 157,690 33,096
(iii) Other servicesLegal services – –Total remuneration for other services – –
Total remuneration of non-PricewaterhouseCoopers firms 157,690 33,096
The Parent Entity’s audit fees were paid for by Huon Aquaculture Company Pty Ltd, a wholly owned subsidiary.
Huon Aquaculture Group Limited
Annual Report 2020
94
Notes to the financial statements
continued
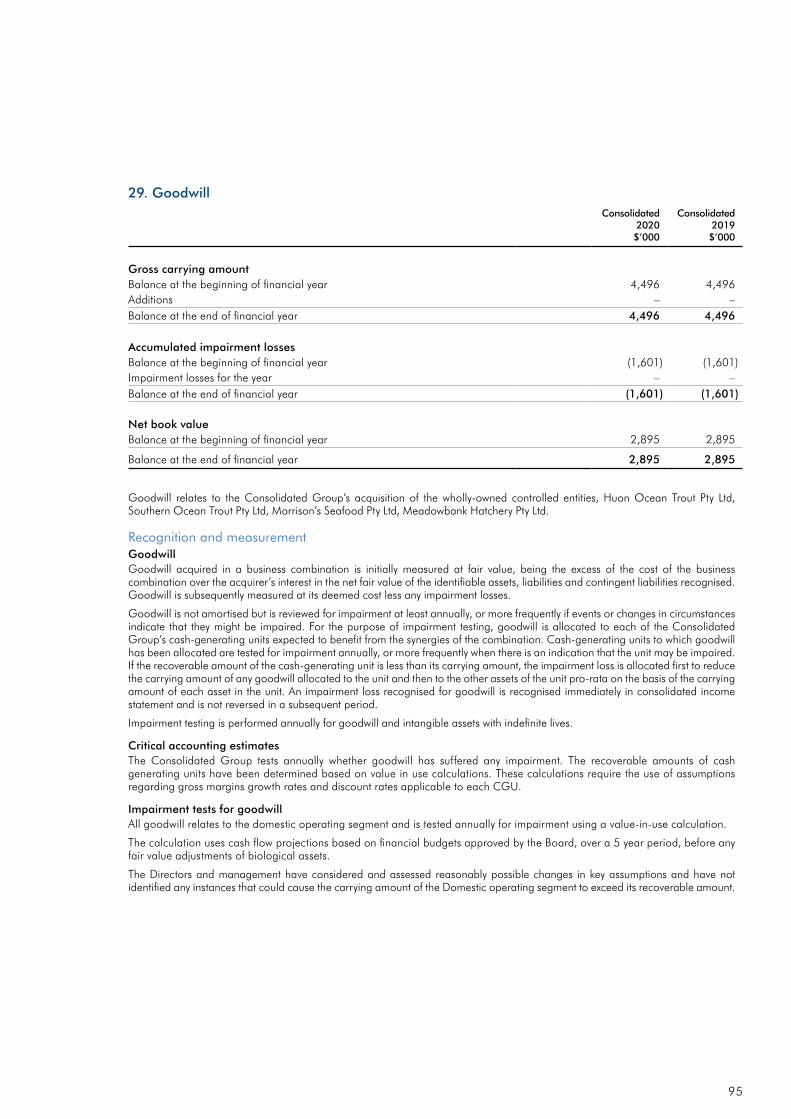
29. GoodwillConsolidated
2020$’000
Consolidated2019$’000
Gross carrying amountBalance at the beginning of financial year 4,496 4,496Additions – –Balance at the end of financial year 4,496 4,496
Accumulated impairment lossesBalance at the beginning of financial year (1,601) (1,601)Impairment losses for the year – –Balance at the end of financial year (1,601) (1,601)
Net book valueBalance at the beginning of financial year 2,895 2,895
Balance at the end of financial year 2,895 2,895
Goodwill relates to the Consolidated Group’s acquisition of the wholly-owned controlled entities, Huon Ocean Trout Pty Ltd, Southern Ocean Trout Pty Ltd, Morrison’s Seafood Pty Ltd, Meadowbank Hatchery Pty Ltd.
Recognition and measurementGoodwillGoodwill acquired in a business combination is initially measured at fair value, being the excess of the cost of the business combination over the acquirer’s interest in the net fair value of the identifiable assets, liabilities and contingent liabilities recognised. Goodwill is subsequently measured at its deemed cost less any impairment losses.
Goodwill is not amortised but is reviewed for impairment at least annually, or more frequently if events or changes in circumstances indicate that they might be impaired. For the purpose of impairment testing, goodwill is allocated to each of the Consolidated Group’s cash-generating units expected to benefit from the synergies of the combination. Cash-generating units to which goodwill has been allocated are tested for impairment annually, or more frequently when there is an indication that the unit may be impaired. If the recoverable amount of the cash-generating unit is less than its carrying amount, the impairment loss is allocated first to reduce the carrying amount of any goodwill allocated to the unit and then to the other assets of the unit pro-rata on the basis of the carrying amount of each asset in the unit. An impairment loss recognised for goodwill is recognised immediately in consolidated income statement and is not reversed in a subsequent period.
Impairment testing is performed annually for goodwill and intangible assets with indefinite lives.
Critical accounting estimatesThe Consolidated Group tests annually whether goodwill has suffered any impairment. The recoverable amounts of cash generating units have been determined based on value in use calculations. These calculations require the use of assumptions regarding gross margins growth rates and discount rates applicable to each CGU.
Impairment tests for goodwillAll goodwill relates to the domestic operating segment and is tested annually for impairment using a value-in-use calculation.
The calculation uses cash flow projections based on financial budgets approved by the Board, over a 5 year period, before any fair value adjustments of biological assets.
The Directors and management have considered and assessed reasonably possible changes in key assumptions and have not identified any instances that could cause the carrying amount of the Domestic operating segment to exceed its recoverable amount.
95

30. ImpairmentImpairment of assets
At the end of each reporting period, the Consolidated Group assesses whether there is any indication that an asset may be impaired. The assessment will include considering external sources of information and internal sources of information. If such an indication exists, an impairment test is carried out on the asset by comparing the recoverable amount of the asset, being the higher of the asset’s fair value less costs of disposal and value in use to the asset’s carrying amount. Any excess of the asset’s carrying amount over its recoverable amount is recognised immediately in consolidated income statement.
Where it is not possible to estimate the recoverable amount of an individual asset, the Consolidated Group estimates the recoverable amount of the cash-generating unit (CGU) to which the asset belongs. The Consolidated Group identified one CGU representing the activities of generating its revenue output of aquaculture (Atlantic salmon and ocean trout).
The recoverable amount of the CGU has been determined using a value-in-use calculation. The calculation uses cash flow projections based on financial budgets approved by the Board, over a 5 year period, before any fair value adjustments of biological assets.
The following table sets out the key assumptions used in the calculations:
Volume Volume growth over the five-year forecast period has been set at 11.0% average annual growth, consisting of industry recognised growth rates plus growth based on resources available to the Group to allow expansion of production at a rate greater than the industry average.
Price Pricing growth over the five-year forecast period has been set at 1.5% average annual growth, recognising a period of lower average prices in FY2021 and progressive increase as markets recover from COVID-19 restrictions and the underlying improvement driven by more favourable channel mix for the Group.
Production costs Production costs per hog kg are expected to decline at a moderate rate, following the completion of Huon’s two-year program of investing in infrastructure to drive the expansion of its production capacity, drive biological performance improvements and reduce production risk.
Annual Capital Expenditure Capital expenditure requirements estimated to maintain the current production assets which are in operation and able to meet forecast volume projections.
Long-term growth rate The weighted average growth rate used to extrapolate cash flows beyond the budget period. The rates are consistent with economic forecast growth rates published by the Reserve Bank of Australia.
Post-tax discount rates Discount rates represent the current market assessment of the risks relating to the CGU.
In performing the value-in-use calculations for the CGU, the Consolidated Group has applied post-tax discount rates to discount the forecast future attributable post-tax cash flows. The equivalent pre-tax discount rates are disclosed in the table below.
2020 2019
Long-term growth rate 1.75% 3.00%Post-tax discount rate 8.4% 7.9%Pre-tax discount rate 12.1% 11.3%
The market capitalisation of the Group at 30 June 2020 was $255 million, which represented a $53 million deficiency against the net assets of $308 million. The Group considered reasons for this difference, and concluded the recoverable amount resulting from the value in use methodology is appropriate in supporting the value of the CGU.
The recoverable amount of the CGU is estimated to exceed the carrying amount of the CGU at 30 June 2020 by $72 million.
The Directors and management have considered and assessed reasonably possible changes in key assumptions. The recoverable amount of the CGU would equal its carrying amount if the key assumptions were to change as follows:
Volume Reduction in growth rate by 15% from 11.0% to 9.5%Price Reduction in growth rate by 23% from 1.5% to 1.2%Post-tax discount rate Increase from 8.4% to 9.2%
Huon Aquaculture Group Limited
Annual Report 2020
96
Notes to the financial statements
continued

31. Other Intangible AssetsConsolidated
2020$’000
Consolidated2019$’000
Gross carrying amountBalance at the beginning of financial year 430 100Additions – 330Balance at the end of financial year 430 430
Accumulated impairment lossesBalance at the beginning of financial year – –Impairment losses for the year – –Balance at the end of financial year – –
Net book valueBalance at the beginning of financial year 430 100
Balance at the end of financial year 430 430
Other intangible assets relate to hatchery establishment costs and trademarks. Additions during the 2019 financial year relate to the acquisition of rights to feeding systems software.
Licences and trademarks recognised by the Consolidated Group have an indefinite useful life and are not amortised. They are recorded at cost less any impairment.
Refer to note 30 for impairment tests for other intangible assets.
97

32. Interests in subsidiariesThe subsidiaries listed below have share capital consisting solely of ordinary shares, which are held directly by the Consolidated Group. The proportion of ownership interests held equals the voting rights held by the Consolidated Group. Each subsidiary’s principal place of business is also its country of incorporation or registration.
Ownership interest held by the
Consolidated Group
Name of subsidiary Principal place of business Note2020
%2019
%
Huon Aquaculture Company Pty Ltd 961 Esperance Coast Road, Dover, TAS, 7117 100% 100%Springs Smoked Seafoods Pty Ltd 961 Esperance Coast Road, Dover, TAS, 7117 (i) 100% 100%Springfield Hatcheries Pty Ltd 32-36 Headquarters Road, South Springfield, TAS, 7260 (i) 100% 100%Huon Ocean Trout Pty Ltd 961 Esperance Coast Road, Dover, TAS, 7117 (i) 100% 100%Huon Shellfish Co Pty Ltd 961 Esperance Coast Road, Dover, TAS, 7117 (i) 100% 100%Huon Salmon Pty Ltd 961 Esperance Coast Road, Dover, TAS, 7117 (i) 100% 100%Huon Smoked Seafoods Pty Ltd 961 Esperance Coast Road, Dover, TAS, 7117 (i) 100% 100%Huon Smoked Salmon Pty Ltd 961 Esperance Coast Road, Dover, TAS, 7117 (i) 100% 100%Huon Seafoods Pty Ltd 961 Esperance Coast Road, Dover, TAS, 7117 (i) 100% 100%Huon Tasmanian Salmon Pty Ltd 961 Esperance Coast Road, Dover, TAS, 7117 (i) 100% 100%Springs Smoked Salmon Pty Ltd 961 Esperance Coast Road, Dover, TAS, 7117 (i) 100% 100%Southern Ocean Trout Pty Ltd 2 Esplanade, Strahan, TAS, 7468 (i) 100% 100%Morrison's Seafood Pty Ltd 2 Esplanade, Strahan, TAS, 7468 (i) 100% 100%Meadowbank Hatchery Pty Ltd 2 Esplanade, Strahan, TAS, 7468 (i) 100% 100%
Significant restrictionsThere are no significant restrictions over the Consolidated Group’s ability to access or use assets, and settle liabilities, of the Consolidated Group.
The wholly-owned subsidiaries above are relieved from the Corporations Act 2001 requirements for the preparation, audit and lodgement of financial reports. Refer to note 23 for further details.
(i) Subsidiary became a party to the deed of cross guarantee on 28 June 2016.
33. Derivative LiabilitiesConsolidated
2020$’000
Consolidated2019$’000
Derivatives carried at fair value:Foreign currency forward contracts – 49Interest rate swap 3,025 2,173
3,025 2,222
Refer to note 20 for fair value measurement and hierarchy.
Huon Aquaculture Group Limited
Annual Report 2020
98
Notes to the financial statements
continued

34. Provisions2020
Current$’000
2020Non-current
$’000
2020Total
$’000
2019Current
$’000
2019Non-current
$’000
2019Total
$’000
Annual Leave 6,257 – 6,257 5,444 – 5,444Long-Service Leave 2,431 1,633 4,064 2,137 1,365 3,502Make good provision(i) – 3,873 3,873 – – –
8,688 5,506 14,194 7,581 1,365 8,946
(i) At the conclusion of the leases of both the Ronja Huon and Ronja Storm, the Consolidated Group is required to return the vessels to their original location. A provision has been recognised for the present value of the estimated expenditure required.
These costs have been capitalised as part of the respective right of use assets, and are being amortised over the life of the related lease.
Makegood
$’000
Annualleave$’000
Long-serviceleave$’000
Total$’000
Carrying amount at start of year – 5,444 3,502 8,946Adjustment for Adoption of AASB 16 1,330 – – 1,330Additional provisions recognised 2,543 4,424 785 7,752Amounts used during the year – (3,611) (223) (3,834)
Carrying amount at end of year 3,873 6,257 4,064 14,194
Amounts not expected to be settled within the next 12 monthsThe current provision for employee benefits includes accrued annual leave and long service leave. For long service leave it covers all unconditional entitlements where employees have completed the required period of service and also those where employees are entitled to pro-rata payments in certain circumstances. The entire amount of the annual leave provision of $6,257 (2019: $5,444) is presented as current, since the Consolidated Group does not have an unconditional right to defer settlement for any of these obligations. However, based on past experience, the Consolidated Group does not expect all employees to take the full amount of accrued leave or require payment within the next 12 months. The following amounts reflect leave that is not to be expected to be taken or paid within the next 12 months.
Consolidated2020$’000
Consolidated2019$’000
Leave obligations expected to be settled after 12 months 7,116 6,302
Recognition and measurementProvisions are recognised when the Consolidated Group has a present obligation (legal or constructive) as a result of a past event, it is probable that the Consolidated Group will be required to settle the obligation, and a reliable estimate can be made of the amount of the obligation.
The amount recognised as a provision is the best estimate of the consideration required to settle the present obligation at reporting date, taking into account the risks and uncertainties surrounding the obligation. Where a provision is measured using the cash flows estimated to settle the present obligation, its carrying amount is the present value of those cash flows.
When some or all of the economic benefits required to settle a provision are expected to be recovered from a third party, the receivable is recognised as an asset if it is virtually certain that reimbursement will be received and the amount of the receivable can be measured reliably.
99

Employee BenefitsShort-term employee benefits
Provision is made for the Consolidated Group’s obligation for short-term employee benefits. Short-term employee benefits are benefits (other than termination benefits) that are expected to be settled wholly before 12 months after the end of the annual reporting period in which the employees render the related service, including wages, salaries and sick leave. Short-term employee benefits are measured at the (undiscounted) amounts expected to be paid when the obligation is settled.
The Consolidated Group’s obligations for short-term employee benefits such as wages, salaries and sick leave are recognised as a part of current trade and other payables in the statement of financial position.
Other long-term employee benefits
Provision is made for employees’ long service leave and annual leave entitlements not expected to be settled wholly within 12 months after the end of the annual reporting period in which the employees render the related service. Other long-term employee benefits are measured at the present value of the expected future payments to be made to employees. Expected future payments incorporate anticipated future wage and salary levels, durations of service and employee departures and are discounted at rates determined by reference to market yields at the end of the reporting period on corporate bond rates that have maturity dates that approximate the terms of the obligations. Upon the remeasurement of obligations for other long-term employee benefits, the net change in the obligation is recognised in consolidated income statement as a part of employee benefits expense.
The obligations are presented as current liabilities in the balance sheet if the entity does not have an unconditional right to defer settlement for at least twelve months after the reporting period, regardless of when the actual settlement is expected to occur.
The Consolidated Group’s obligations for long-term employee benefits are presented as non-current provisions in its statement of financial position, except where the Consolidated Group does not have an unconditional right to defer settlement for at least 12 months after the end of the reporting period, in which case the obligations are presented as current provisions.
35. Other liabilitiesConsolidated
2020$’000
Consolidated2019$’000
Deferred government grantsCurrent 3,534 464Non-Current 3,022 1,960
6,556 2,424
During the 2015 financial year government grants of $5,000,000 were received relating to the Parramatta Creek Smokehouse and Product Innovation Centre. The nature of the grants related to both income and to assets. During the financial year $464,000 (2018: $464,000) was recognised in the income statement. Future compliance with certain conditions relating to jobs creation could impact $1,237,000 of the deferred government grants amount. Included in the current portion are amounts relating to Jobkeeper grant income.
36. Contingent liabilities and contingent assetsThere are no contingent liabilities or contingent assets at the date of this Annual Financial Report.
Huon Aquaculture Group Limited
Annual Report 2020
100
Notes to the financial statements
continued
34. Provisions (continued)

37. Segment informationThe chief operating decision maker for the Consolidated Group is the Chief Executive Officer of the Parent Entity. The Parent Entity determines operating segments based on information provided to the Chief Executive Officer in assessing performance and determining the allocation of resources within the Consolidated Group. Consideration is given to the Consolidated Group’s products, the manner in which they are sold, the organisational structure of the Consolidated Group and the nature of customers.
The Consolidated Group hatches, farms, processes, markets and sells Atlantic salmon and ocean trout. Revenue associated with exports meets the quantitative thresholds and management concludes that this segment is reportable.
The chief operating decision maker only reviews export market sales. The total of the reportable segments’ results, profit, assets and liabilities is the same as that of the Consolidated Group as a whole and as disclosed in the consolidated income statement, the consolidated statement of comprehensive income and the consolidated balance sheet.
All of the non-current assets are located in Australia being the domicile country of the Consolidated Group.
Note
Consolidated2020$’000
Consolidated2019$’000
Revenue from the sale of goodsDomestic market 225,657 258,073Export market 114,212 23,882
Total revenue from the sale of goods 1 339,869 281,955
38. Subsequent eventsOn 27 August 2020 Huon announced its intention to raise equity, through an institutional placement and share purchase plan, to reduce net debt levels to a more sustainable level of gearing, given the continuing uncertainties associated with the pandemic.
39. Company detailsThe registered office of the company is: The principal place of business is:Huon Aquaculture Group Limited Level 13, 188 Collins Street Hobart Tasmania 7000
Huon Aquaculture Group Limited 961 Esperance Coast Road Dover Tasmania 7109
101

In the directors’ opinion; (a) The financial statements and notes set out on pages 53 to 101 are in accordance with
the Corporations Act 2001 including:
a. Complying with Accounting Standards, the Corporations Regulations 2001 and other mandatory professional reporting requirements; and
b. Giving a true and fair view of the Consolidated Group’s financial position as at 30 June 2020 and of its performance for the financial year ended on that date; and
(b) There are reasonable grounds to believe that the company will be able to pay its debts as and when they become due and payable; and
(c) At the date of this declaration, there are reasonable grounds to believe that the members of the extended closed group identified in note 32 will be able to meet any obligations or liabilities to which they are, or may become subject by virtue of the deed to cross guarantee described in note 23.
The Basis of Preparation note in the notes to the financial statements confirms that the financial statements also comply with International Financial Reporting Standards as issued by the International Accounting Standards Board.
The directors have been given the declarations by the chief executive officer, deputy chief executive officer and the chief financial officer required by section 295A of the Corporations Act 2001.
Signed in accordance with a resolution of the Directors made pursuant to section 298(2) of the Corporations Act 2001.
On behalf of the Directors
Neil Kearney Chairman 27 August 2020
Peter Bender Managing Director and CEO 27 August 2020
Huon Aquaculture Group Limited
Annual Report 2020
102
Directors’ Declaration

Independent auditor’s report
PricewaterhouseCoopers, ABN 52 780 433 757 2 Riverside Quay, SOUTHBANK VIC 3006, GPO Box 1331, MELBOURNE VIC 3001 T: 61 3 8603 1000, F: 61 3 8603 1999, www.pwc.com.au
Liability limited by a scheme approved under Professional Standards Legislation.
Independent auditor’s report To the members of Huon Aquaculture Group Limited
Report on the audit of the financial report
Our opinion In our opinion:
The accompanying financial report of Huon Aquaculture Group Limited (the Company) and its controlled entities (together the Consolidated Group) is in accordance with the Corporations Act 2001, including:
(a) giving a true and fair view of the Consolidated Group's financial position as at 30 June 2020 andof its financial performance for the year then ended
(b) complying with Australian Accounting Standards and the Corporations Regulations 2001.
What we have audited The Consolidated Group financial report comprises:
• the consolidated balance sheet as at 30 June 2020• the consolidated statement of comprehensive income for the year then ended• the consolidated statement of changes in equity for the year then ended• the consolidated statement of cash flows for the year then ended• the consolidated income statement for the year then ended• the notes to the consolidated financial statements, which include a summary of significant
accounting policies• the directors’ declaration.
Basis for opinion We conducted our audit in accordance with Australian Auditing Standards. Our responsibilities under those standards are further described in the Auditor’s responsibilities for the audit of the financial report section of our report.
We believe that the audit evidence we have obtained is sufficient and appropriate to provide a basis for our opinion.
Independence We are independent of the Consolidated Group in accordance with the auditor independence requirements of the Corporations Act 2001 and the ethical requirements of the Accounting Professional and Ethical Standards Board’s APES 110 Code of Ethics for Professional Accountants (including Independence Standards) (the Code) that are relevant to our audit of the financial report in Australia. We have also fulfilled our other ethical responsibilities in accordance with the Code.
103
103

Independent auditor’s report
continued
Our audit approach An audit is designed to provide reasonable assurance about whether the financial report is free from material misstatement. Misstatements may arise due to fraud or error. They are considered material if individually or in aggregate, they could reasonably be expected to influence the economic decisions of users taken on the basis of the financial report.
We tailored the scope of our audit to ensure that we performed enough work to be able to give an opinion on the financial report as a whole, taking into account the geographic and management structure of the Consolidated Group, its accounting processes and controls and the industry in which it operates.
Materiality Audit scope
• For the purpose of our audit we used overallConsolidated Group materiality of $1,281,000,which represents approximately 2.5% of theearnings before interest, tax, depreciation andamortisation (EBITDA) adjusted for the fair valueadjustment for biological assets and averaged forthe current and two previous financial years. Thedepreciation and amortisation used in ourmateriality calculation is as outlined in note 3(b) tothe financial report.
• We applied this threshold, together withqualitative considerations, to determine the scopeof our audit and the nature, timing and extent ofour audit procedures and to evaluate the effect ofmisstatements on the financial report as a whole.
• We chose EBITDA prior to any fair valueadjustment for biological assets because, in ourview, it is the metric against which theperformance of the Consolidated Group is mostcommonly measured. An average was used due tofluctuations in EBITDA from year to year causedby a number of factors, which include (but are notlimited to) environmental conditions and domesticand export pricing and demand.
• We utilised a 2.5% threshold based on ourprofessional judgement, noting it is within therange of commonly acceptable thresholds.
• Our audit focused on where the ConsolidatedGroup made subjective judgements; for example,significant accounting estimates involvingassumptions and inherently uncertain futureevents.
• The Consolidated Group’s accounting processesare performed by a central finance function at thecorporate head office in Hobart.
104
Huon Aquaculture Group Limited
Annual Report 2020
104

Key audit matters Key audit matters are those matters that, in our professional judgement, were of most significance in our audit of the financial report for the current period. The key audit matters were addressed in the context of our audit of the financial report as a whole, and in forming our opinion thereon, and we do not provide a separate opinion on these matters. Further, any commentary on the outcomes of a particular audit procedure is made in that context. We communicated the key audit matters to the Audit and Risk Management Committee.
Key audit matter How our audit addressed the key audit matter
Carrying value of goodwill, plant and equipment, and right of use assets (Refer to note 30)
The Consolidated Group has $2.9 million of goodwill, $305.6 million of plant and equipment and $162.6 million of right of use assets as at 30 June 2020. Australian Accounting Standards require the Consolidated Group to assess goodwill and indefinite life intangibles annually for impairment and to assess the carrying value of other assets if impairment indicators exist.
In order to assess the recoverability of these assets, the Consolidated Group prepared a financial model to determine if the carrying values were supported by forecast future cash flows, discounted to present value (the "model").
This was a key audit matter due to the financial significance of the goodwill, plant and equipment and the right of use asset balances and the significant judgements and assumptions applied in estimating future cash flows and the discount rate.
We performed the following procedures amongst others:
• Assessed whether the Consolidated Group’sdetermination of Cash Generating Units (CGUs)was consistent with our knowledge of the natureof the Consolidated Group’s operations andinternal Group reporting.
• Tested the mathematical accuracy of thecalculations in the model.
• Compared the forecast future cash flows used inthe model with the forecasts formally approved bythe Board.
• Evaluated the Consolidated Group's ability toforecast future cash flows by comparing historicalbudgets with reported actual results for the past 3years.
• Assessed whether the forecast growth rateassumptions used in the model were reasonablewith reference to our understanding of the keydrivers, such as forecast harvest volumes andpricing.
• Compared the terminal growth rate used in themodels to historical growth rates achieved andexternal economic forecasts.
• With the assistance of PwC valuation experts,assessed whether the discount rates used in themodel were reasonable by comparing them tomarket data, comparable companies and industryresearch.
• Considered the Consolidated Group’s sensitivityanalysis on the key assumptions used in theimpairment model to assess under whichassumptions an impairment would occur andwhether this was reasonably possible.
• Evaluated the adequacy of the disclosures made innote 30, including key assumptions andsensitivities to changes in such assumptions, inlight of the requirements of Australian AccountingStandards
105
105

Independent auditor’s report
continued
Key audit matter How our audit addressed the key audit matter
Borrowings (Refer to note 15)
At 30 June 2020, the Consolidated Group held interest bearing debt of $23.4 million in current liabilities with $149.8 million classified as non-current liabilities. The accounting for the Consolidated Group’s borrowings was considered a key audit matter due to:
• Borrowings being represent the largestliability in the consolidated balance sheet andan important funding mechanism; and
• Judgement is required by the ConsolidatedGroup in the assessment of compliance withfinancial covenants.
Our procedures included, but were not limited to the following procedures:
• Obtained confirmations directly from theConsolidated Group’s financiers to confirm theborrowing’s balance, tenure and conditions.
• Read the borrowing agreements between theConsolidated Group and its financiers to developan understanding of the terms associated with thefacilities.
• Evaluated selected data and assumptions used inthe Consolidated Group’s cash flow forecasts forat least 12 months from the date of signing theauditor’s report.
• Where debt was regarded as non-current, weevaluated the Consolidated Group's assessmentthat they had the unconditional right to deferpayment such that there were no repaymentsrequired within 12 months from the balance date.
• Evaluated whether the disclosures were consistentwith the requirements of Australian AccountingStandards.
Lease accounting and adoption of new accounting standard AASB 16 - Leases (Refer to note 9)
The Consolidated Group has adopted Australian Accounting Standard AASB 16 Leases (AASB 16). The new policy and its transition impact are disclosed in note 9.
This was a key audit matter due to the:
• Significance of the impact on transition to thefinancial report; and
• The judgement involved in applying the newAASB 16 requirements to determine anincremental borrowing rate to discount leasepayments.
We performed the following procedures, amongst others:
• Assessed whether the Consolidated Group’s newaccounting policies are in accordance with therequirements of AASB 16
• Evaluated the methodology adopted by theConsolidated Group to identify leasearrangements
• Evaluated the adequacy of the disclosures in note9 in light of the requirements of AustralianAccounting Standards.
For a sample of lease agreements, we:
• Evaluated the lease calculation against the termsof the lease agreement and the requirements ofAustralian Accounting Standards
• Tested the mathematical accuracy of the leasecalculations
• Assessed the incremental borrowing rates appliedto the lease calculations
• Assessed the reasonableness of judgementsincluding likelihood of renewal options
106
Huon Aquaculture Group Limited
Annual Report 2020
106

Key audit matter How our audit addressed the key audit matter
Fair value of biological assets (Refer to note 4)
The Consolidated Group held biological assets of $264 million at 30 June 2020. The biological assets include broodstock, eggs, juveniles, smolt and live finfish.
Australian Accounting Standards require biological assets to be measured at fair value less costs to sell or, in the absence of a fair value, at cost less impairment.
The Consolidated Group has valued each of the biological assets. We considered the valuation of live finfish above 1kg to be a key audit matter due to the significant judgement involved in estimating:
• The total weight of live finfish at sea (based onnumber of fish and weight);
• expected mortalities of finfish prior to harvesting
• selling price per HOG/kg
Our procedures in relation to the Consolidated Group’s fair value calculation of live finfish above 1kg, included, but were not limited to the following procedures:
• Considering the valuation methodology againstthe requirements of the relevant AustralianAccounting Standard.
• Testing the mathematical accuracy of thecalculations.
• Assessing the historical accuracy of forecastingand estimation by comparing the prior yearestimate to actual performance.
We performed the following procedures over specific valuation inputs, amongst others:
Number and weight of live finfish at sea
• We performed a reconciliation of the number oflive finfish by obtaining the opening balance andcomparing the known movements (fish intakes,harvest and mortalities for the year) to underlyingdocumentation on a sample basis in order toassess the reasonableness of the number of livefinfish at year end.
• We assessed year end fish loss adjustments madeto either the count or weight by comparing themto actual data recorded on bathing or close out ofpens.
• We assessed the weight assumption at 30 June2020 based on actual weights of finfish harvestedsubsequent to the year end and bath weight datarecorded during the year (independently of thefinance function).
• We assessed the sensitivity of the calculations tochanges in the Consolidated Group’s estimate ofweight by applying other values within areasonably possible range.
Expected mortalities of finfish
• We assessed the expected mortality rates appliedat year-end by comparing them to actual mortalityrates recorded by the Consolidated Group over theyear and subsequent to year end.
Selling price per HOG/kg
• We checked the selling price per HOG/kgachieved over a 12 month period for domestic andexport sales to customer invoices on a samplebasis
107
• We compared the 12 month average selling priceper HOG/kg for domestic and export sales to theprice per HOG included in the calculation of fairvalue of finfish.
107

Independent auditor’s report
continued
Other information The directors are responsible for the other information. The other information comprises the information included in the annual report for the year ended 30 June 2020, but does not include the financial report and our auditor’s report thereon.
Our opinion on the financial report does not cover the other information and accordingly we do not express any form of assurance conclusion thereon.
In connection with our audit of the financial report, our responsibility is to read the other information and, in doing so, consider whether the other information is materially inconsistent with the financial report or our knowledge obtained in the audit, or otherwise appears to be materially misstated.
If, based on the work we have performed on the other information that we obtained prior to the date of this auditor’s report, we conclude that there is a material misstatement of this other information, we are required to report that fact. We have nothing to report in this regard.
Responsibilities of the directors for the financial report The directors of the Company are responsible for the preparation of the financial report that gives a true and fair view in accordance with Australian Accounting Standards and the Corporations Act 2001 and for such internal control as the directors determine is necessary to enable the preparation of the financial report that gives a true and fair view and is free from material misstatement, whether due to fraud or error.
In preparing the financial report, the directors are responsible for assessing the ability of the Consolidated Group to continue as a going concern, disclosing, as applicable, matters related to going concern and using the going concern basis of accounting unless the directors either intend to liquidate the Consolidated Group or to cease operations, or have no realistic alternative but to do so.
108
Huon Aquaculture Group Limited
Annual Report 2020
108
Auditor’s responsibilities for the audit of the financial report Our objectives are to obtain reasonable assurance about whether the financial report as a whole is free from material misstatement, whether due to fraud or error, and to issue an auditor’s report that includes our opinion. Reasonable assurance is a high level of assurance, but is not a guarantee that an audit conducted in accordance with the Australian Auditing Standards will always detect a material misstatement when it exists. Misstatements can arise from fraud or error and are considered material if, individually or in the aggregate, they could reasonably be expected to influence the economic decisions of users taken on the basis of the financial report.
A further description of our responsibilities for the audit of the financial report is located at the Auditing and Assurance Standards Board website at: https://www.auasb.gov.au/admin/file/content102/c3/ar1_2020.pdf. This description forms part of our auditor's report.
Report on the remuneration report
Our opinion on the remuneration report We have audited the remuneration report included in pages 31 to 43 of the directors’ report for the year ended 30 June 2020.
In our opinion, the remuneration report of Huon Aquaculture Group Limited for the year ended 30 June 2020 complies with section 300A of the Corporations Act 2001.
Responsibilities The directors of the Company are responsible for the preparation and presentation of the remuneration report in accordance with section 300A of the Corporations Act 2001. Our responsibility is to express an opinion on the remuneration report, based on our audit conducted in accordance with Australian Auditing Standards.
PricewaterhouseCoopers
Alison Tait Melbourne Partner 27 August 2020
109
109
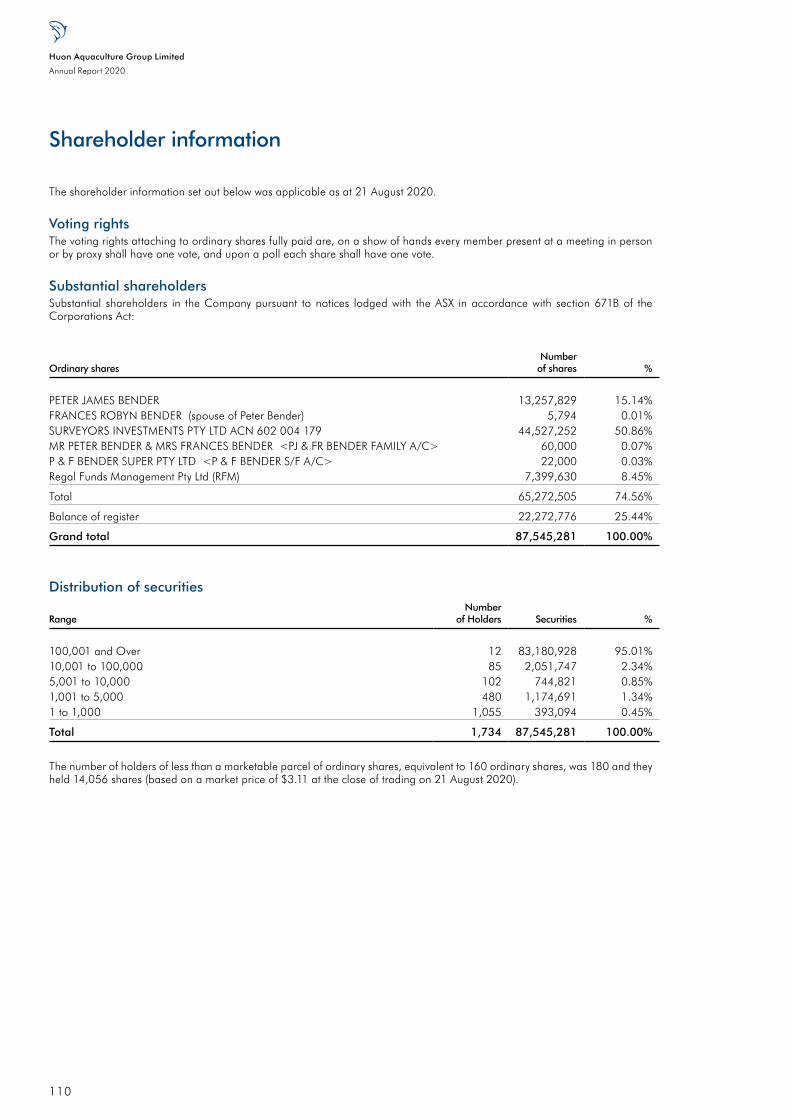
Shareholder information
The shareholder information set out below was applicable as at 21 August 2020.
Voting rightsThe voting rights attaching to ordinary shares fully paid are, on a show of hands every member present at a meeting in person or by proxy shall have one vote, and upon a poll each share shall have one vote.
Substantial shareholdersSubstantial shareholders in the Company pursuant to notices lodged with the ASX in accordance with section 671B of the Corporations Act:
Ordinary sharesNumber
of shares %
PETER JAMES BENDER 13,257,829 15.14%FRANCES ROBYN BENDER (spouse of Peter Bender) 5,794 0.01%SURVEYORS INVESTMENTS PTY LTD ACN 602 004 179 44,527,252 50.86%MR PETER BENDER & MRS FRANCES BENDER <PJ & FR BENDER FAMILY A/C> 60,000 0.07%P & F BENDER SUPER PTY LTD <P & F BENDER S/F A/C> 22,000 0.03%Regal Funds Management Pty Ltd (RFM) 7,399,630 8.45%
Total 65,272,505 74.56%
Balance of register 22,272,776 25.44%
Grand total 87,545,281 100.00%
Distribution of securities
RangeNumber
of Holders Securities %
100,001 and Over 12 83,180,928 95.01%10,001 to 100,000 85 2,051,747 2.34%5,001 to 10,000 102 744,821 0.85%1,001 to 5,000 480 1,174,691 1.34%1 to 1,000 1,055 393,094 0.45%
Total 1,734 87,545,281 100.00%
The number of holders of less than a marketable parcel of ordinary shares, equivalent to 160 ordinary shares, was 180 and they held 14,056 shares (based on a market price of $3.11 at the close of trading on 21 August 2020).
Huon Aquaculture Group Limited
Annual Report 2020
110

Top 20 largest shareholdersRank Name 21 August 2020 %
1 SURVEYORS INVESTMENTS PTY LTD ACN 602 004 179 44,527,252 50.86%2 PETER JAMES BENDER 13,257,829 15.14%3 CITICORP NOMINEES PTY LIMITED 7,767,628 8.87%4 HSBC CUSTODY NOMINEES (AUSTRALIA) LIMITED 4,163,009 4.76%5 UBS NOMINEES PTY LTD 3,712,270 4.24%6 WARBONT NOMINEES PTY LTD <UNPAID ENTREPOT A/C> 2,903,311 3.32%7 J P MORGAN NOMINEES AUSTRALIA PTY LIMITED 2,536,887 2.90%8 CS THIRD NOMINEES PTY LIMITED <HSBC CUST NOM AU LTD 13 A/C> 1,587,120 1.81%9 CS FOURTH NOMINEES PTY LIMITED <HSBC CUST NOM AU LTD 11 A/C> 1,346,908 1.54%10 NATIONAL NOMINEES LIMITED 887,799 1.01%11 NEWECONOMY COM AU NOMINEES PTY LIMITED <900 ACCOUNT> 341,290 0.39%12 WARBONT NOMINEES PTY LTD <ACCUMULATION ENTREPOT A/C> 149,625 0.17%13 BNP PARIBAS NOMS PTY LTD <DRP> 98,042 0.11%14 NETWEALTH INVESTMENTS LIMITED <WRAP SERVICES A/C> 86,842 0.10%15 HSBC CUSTODY NOMINEES (AUSTRALIA) LIMITED - A/C 5 76,650 0.09%16 MATRAVILLE INVESTMENT CO PTY LIMITED 70,000 0.08%17 MR MICHAEL GREGORY PETERSON & MS SAMANTHA ANNE WAKE <HAMMER
FUND A/C> 69,200 0.08%18 MR PETER BENDER & MRS FRANCES BENDER <PJ & FR BENDER FAMILY A/C> 60,000 0.07%19 BOSKENNA PTY LTD 59,000 0.07%20 WALLBAY PTY LTD <ABELL UNIT ACCOUNT> 55,000 0.06%
Total 83,755,662 95.67%
Balance of register 3,789,619 4.33%
Grand total 87,545,281 100.00%
Restricted equity securitiesThere are no equity securities subject to restriction.
Unquoted equity securitiesThere are no unquoted equity securities on issue.
On market buy-backThere is no current on-market buy-back in respect of the Company’s ordinary shares.
Managing shareholding onlineShareholders are able to manage their shareholdings online through the Link Investor Centre which is available on the Investor section of the Huon website, http://investors.huonaqua.com.au/investors/?page=My-Shareholding.
The Link Investor Centre can be contacted on 1300 554 474 or [email protected].
111

Glossary of Terms
$ Australian dollars
AASB Australian Accounting Standards Board
AASBs or Australian Accounting Standards or Accounting Standards
Australian Accounting Standards
AASB141 Relates to the fair value adjustment of biological assets required by AASB 141
ABS Australian Bureau of Statistics
AGD Amoebic Gill Disease, a fish disease that compromises gill function
ASIC Australian Securities and Investments Commission
ASX ASX Limited (ABN 98 008 624 691) and, where the context requires, the Australian Securities Exchange operated by ASX Limited
Atlantic salmon or salmon A fish in the family Salmonidae, which is typically found in the northern Atlantic Ocean and in rivers that flow into the north Atlantic
Bender Family Peter Bender and Frances Bender, the founders of Huon and (as applicable) Surveyors Investments Pty Ltd (an entity controlled by Peter and Frances Bender)
Biological assets Farm animals that are classified as assets which, according to International Accounting Standards, must be recorded on balance sheets at their market value. Once the assets have either been slaughtered or harvested, then the assets will become agricultural produce
Bonus Plan A component of the LTI plan whereby the Board may determine to offer KMP LTI plan performance rights in lieu of a bonus where the Employee agrees to contractually forgo part of their future pre-tax bonus.
British Retail Consortium (BRC) BRC Global Standard A leading safety and quality certification program
Broodstock A group of mature fish used in aquaculture for breeding purposes
CAGR Compound annual growth rate
CBA Commonwealth Bank of Australia
Constitution The constitution of the Company
Control event refers to: (a) A Court orders a meeting to be convened in relation to a proposed compromise or arrangement for the purposes of, or in connection with:
a. a scheme which would, if it becomes effective, result in any person (either alone or together with its related bodies corporate) owning all of the shares in the Company; or
b. a scheme for the reconstruction of the Company or its amalgamation with any other company or companies;
(b) members of the Company approve any compromise or arrangement referred to in paragraph (a);
(c) any person becomes bound or entitled to acquire shares in the Company under: a. any compromise or arrangement referred to in paragraph (a) which has
been approved by the Court; b. section 414 of the Corporations Act; or c. Part 6A.1 or Part 6A.2 of the Corporations Act;
(d) a resolution is proposed to be put to shareholders proposing a voluntary winding up; or
(e) an order is sought for the compulsory winding up of the Company.
Controlled Growth Strategy The strategy under which Huon planned to roll out a number of strategic capital projects across its operations which are intended to expand production, increase efficiency and maintain the consistency and high quality of fish produced
Corporations Act Corporations Act 2001 (Cth)
DPIPWE Tasmanian Department of Primary Industries, Parks, Water and Environment
EBIT Earnings before interest and tax. This is a non-IFRS measure
EBITDA Earnings before interest, tax, depreciation and amortisation. This is a non-IFRS measure
FAO Food and Agriculture Organization is specialised agency of the United Nations
Huon Aquaculture Group Limited
Annual Report 2020
112

Fortress Pens Fish pens which have been designed by Huon in order to be predator resistant and incorporate a patented stanchion design
GLOBAL G.A.P. Non-governmental organisation that sets voluntary standards for the certification of agricultural products around the globe
GSI Global Salmon Initiative, a leadership initiative by global farmed salmon producers focused on making significant progress towards a shared goal of providing a highly sustainable source of healthy protein to feed a growing global population, whilst minimising the environmental footprint and continuing to improve our social contribution
GST Goods and services tax
Hatchery A facility where eggs are hatched under artificial conditions
HOG Head-on gutted fish
Huon or the Company or the Consolidated Group
Huon Aquaculture Group Limited (ACN 114 456 781) and its subsidiaries as the context requires
Huon Method Huon’s unique method of farming salmon which places the welfare of fish at the centre of operations and ensures salmon are provided an environment which mimics their natural habitat and are raised i) stress free; ii) well nourished; iii) clean and healthy; and iv) responsibly
Husbandry The care, cultivation and breeding of crops and animals
IASB International Accounting Standards Board
IFRSs International Financial Reporting Standards
Listing Admission to the official list of the ASX, 23 October 2014
NPAT Net profit after tax
OECD Organisation for Economic Co-operation and Development
Operating EBITDA Operating EBITDA refers to Earnings Before Interest, Tax, Depreciation and Amortisation exclusive of the fair value adjustment of biological assets.
Performance Right Performance Right means a right to acquire one Share in the capital of the Company in accordance with Plan Rules and an Invitation
Plan Plan refers to the Huon Aquaculture Group Ltd Long Term Incentive Plan and Bonus Plan as set out in the Plan Rules
POMV Pilchard Orthomyxovirus
PwC PricewaterhouseCoopers
R&D Research and development
Rabobank Cooperatieve Centrale Raiffeisen-Boerenleenbank B.A.
Related Body Corporate Has the meaning given by section 50 of the Corporations Act
Rules Rules refer to the terms and conditions of the Plan
Salmonids Collective name for all salmon fish species, including trout
Smolt A young salmon
Sustainability Dashboard A dashboard on Huon’s website which provides information concerning Huon’s salmon farming practices, management of the welfare of its fish and the impact on the environment
TPD Total permanent disability
TPDNO Total Permissible Dissolved Nitrogen Output
TSGA Tasmanian Salmonid Growers’ Association, Tasmania’s peak body representing salmon growers throughout Tasmania
Value added products Raw fish which undergo processing in order to be turned into other products such as skin-on or skin-off fillets, portions, cutlets, smoked products, pate or caviar
WFE Whole fish equivalent
Year Class The calendar year in which the smolt (salmon) or fingerling (trout) enters the sea for on-growing
113

Corporate Directory
Directors – Neil Kearney, Chairman – Peter Bender, Managing Director and CEO – Frances Bender, Executive Director – Tony Dynon, Non-executive Director – Simon Lester, Non-executive Director
Senior Executives – Peter Bender, Managing Director and CEO – Frances Bender, Executive Director – Philip Wiese, Deputy CEO – Thomas Haselgrove, CFO – David Morehead, General Manager
Marine Operations – Charles Hughes, General Manager
Commercial and Planning – David Mitchell, General Manager
Freshwater Operations – Anthony Baker, General Manager
People, Safety and Sustainability
Company Secretary – Thomas Haselgrove
Registered OfficeHuon Aquaculture Group Limited Level 13, 188 Collins Street Hobart TAS 7000
+61 3 6295 4200 [email protected] www.huonaqua.com.au
Principal Place of BusinessHuon Aquaculture Group Limited 961 Esperance Coast Road Dover TAS 7109
AuditorPricewaterhouseCoopers 2 Riverside Quay Southbank VIC 3006
BankersCommonwealth Bank of Australia Level 20, Tower One Collins Square, 727 Collins Street Melbourne VIC 3008
Rabobank Darling Park Tower 3 Level 13, 201 Sussex Street Sydney NSW 2000
Stock Exchange ListingHuon Aquaculture Group Limited is listed on the Australian Securities Exchange (ASX)
The Home Exchange is Melbourne, Victoria
ASX Code: HUO
Share RegistryLink Market Services Level 12, 680 George Street Sydney NSW 2000
Huon Aquaculture Group Limited
Annual Report 2020
114
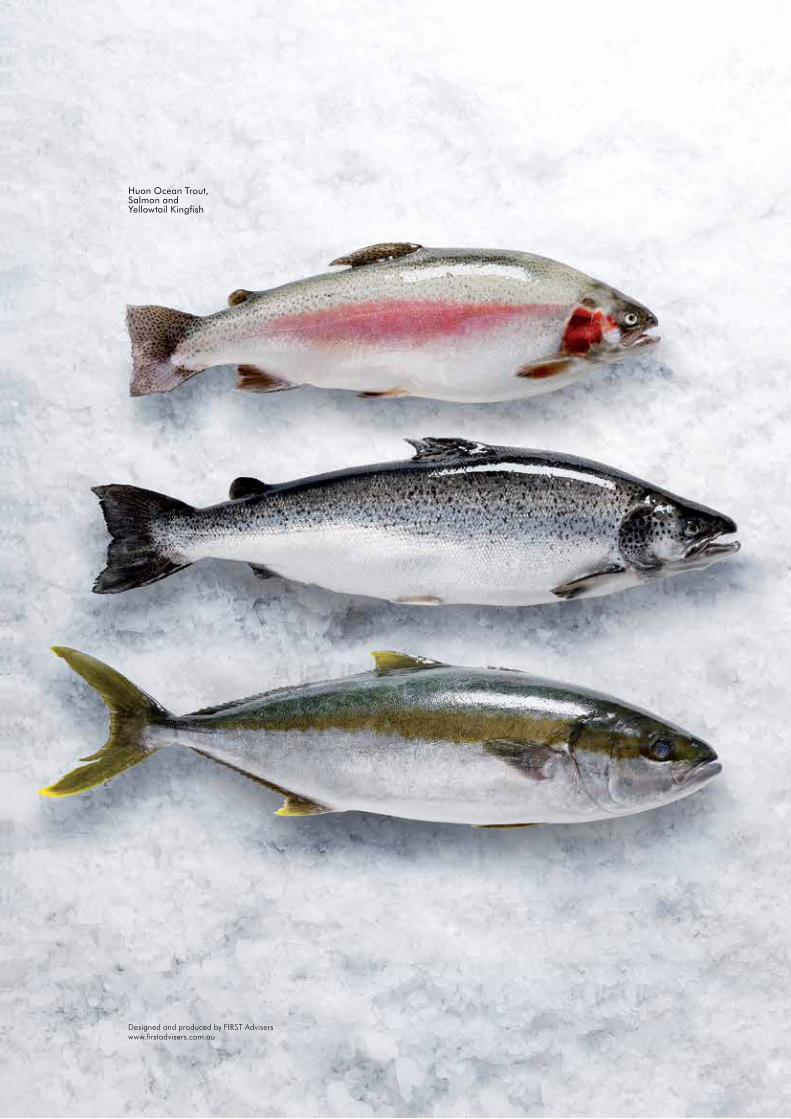
Huon Ocean Trout, Salmon and Yellowtail Kingfish
Designed and produced by FIRST Advisers www.firstadvisers.com.au

www.huonaqua.com.auHuon Aquaculture Group Limited