david r. vallee - unbstormwater.orgunbstormwater.org/pdf/futureimpactsfromclimatechange.pdfdavid r....
TRANSCRIPT
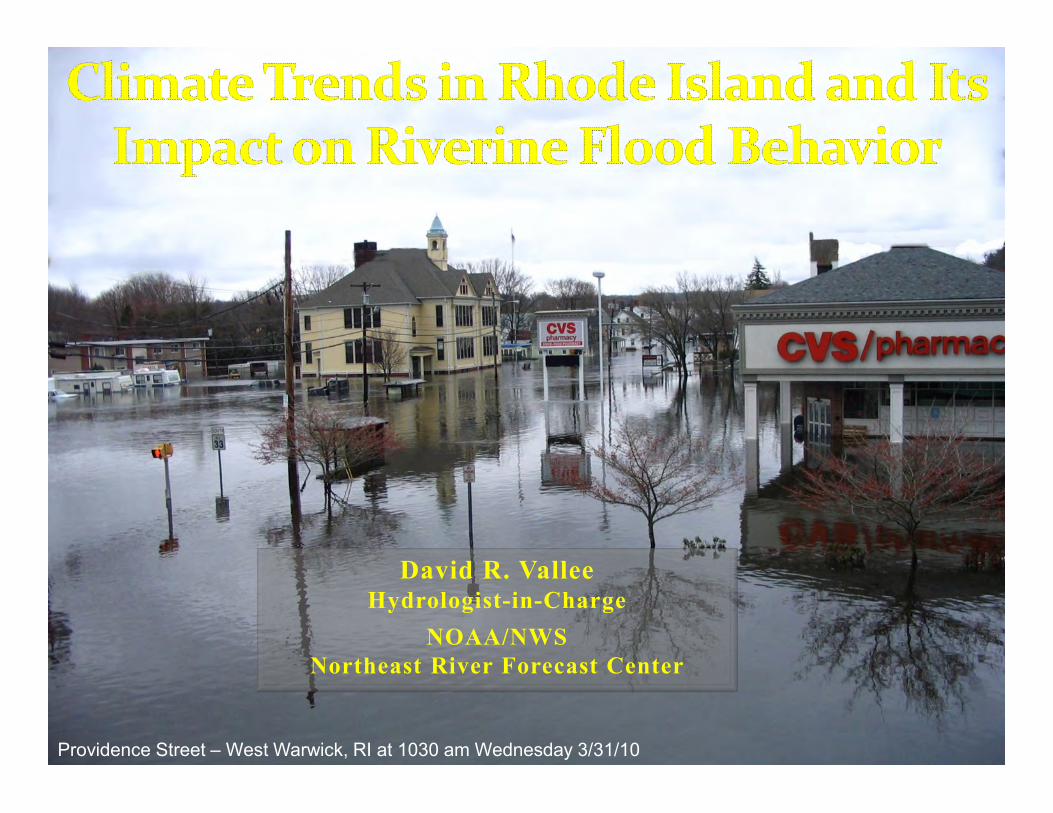
Providence Street – West Warwick, RI at 1030 am Wednesday 3/31/10
David R. ValleeHydrologist-in-Charge
NOAA/NWS
Northeast River Forecast Center
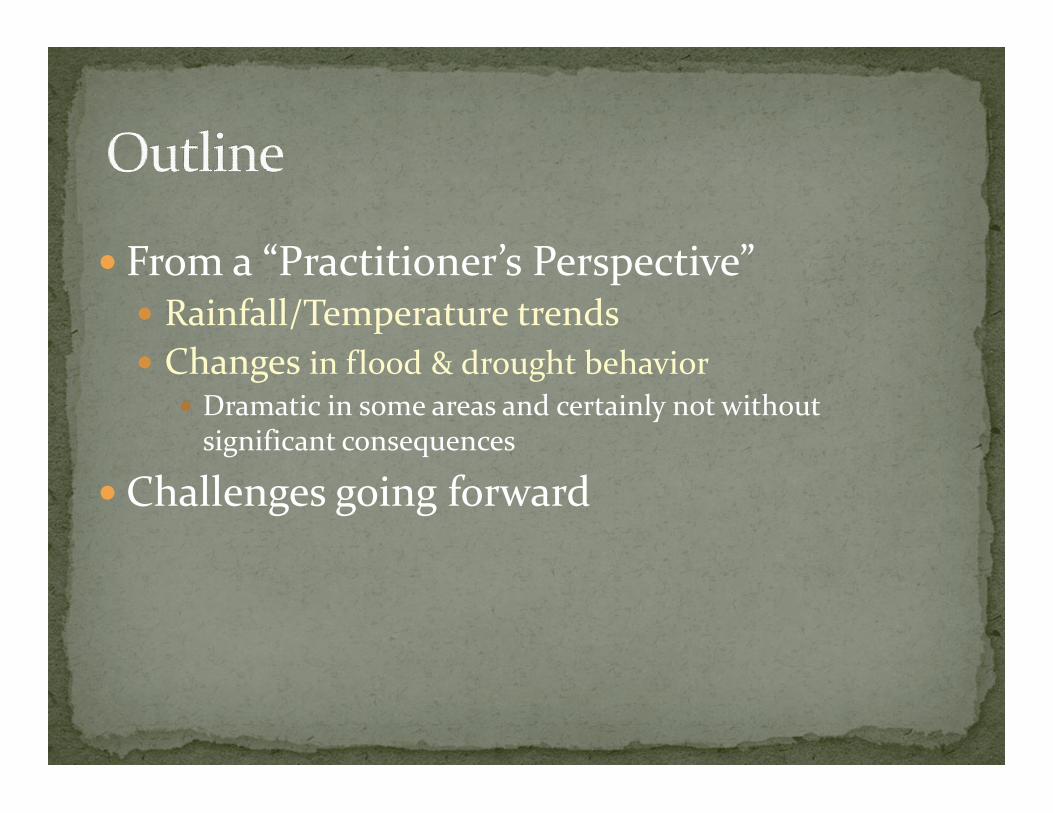
� From a “Practitioner’s Perspective”� Rainfall/Temperature trends
� Changes in flood & drought behavior� Dramatic in some areas and certainly not without
significant consequences
� Challenges going forward

� Calibrate and implement a variety of hydrologic and hydraulic models to provide:� River flow and stage forecasts at 180
locations� Guidance on the rainfall needed to
produce Flash Flooding� Ensemble streamflow predictions� Ice Jam and Dam Break support � Water Supply forecasts� Partner with NOAA Line Offices to
address issues relating to Hazard Resiliency, Water Resource Services, Ecosystem Health and Management, and Climate Change
Moderate flooding - Connecticut River at Portland, CT.
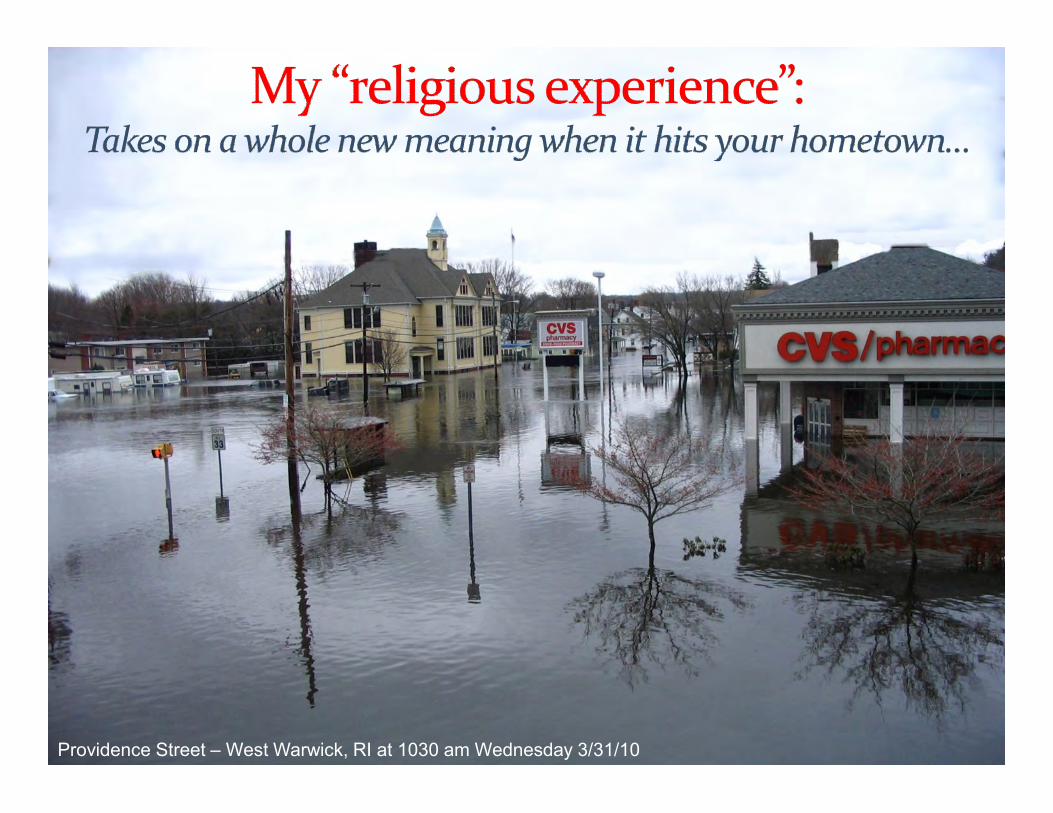
Providence Street – West Warwick, RI at 1030 am Wednesday 3/31/10

Providence Street – Warwick, RI at 1030 am Wednesday 3/31/10
St-Jean-sur-Richelieu, Quebec, Canada, 5/6/11Photo: AP//Canadian Press, R. Remoirz
Record flooding along the Fish and Saint John Rivers – northeast Maine, 4/30/2008
Home washed off its foundation along the Schoharie Creek, Prattsville, NY – Tropical Storm Irene

� Several:� Slow moving weather systems – a blocked up atmosphere
� Multiple events in close succession or 1 or 2 slow movers
� Resulted in saturated antecedent conditions
� Each fed by a “tropical connection” � Plumes of deep moisture
Atmospheric Water Vapor

� Modest changes in air & sea temperatures = atmosphere can hold more moisture� New England is in close proximity to
the ocean and the Gulf & Atlantic moisture streams
� Affected by dual storm tracks and blocking high pressure over Greenland
� These ingredients offer us more “opportunities” to latch onto these plumes
� Reduction of sea ice changes upper level wind flow� Blocked up pattern induces slower
moving storms or back-to-back-to back events
L
LL
H

� Sequence of 4 big rain events
� Orientation of rainfall in each event hit the Pawtuxet and Pawcatuck Basins
Pawtuxet River at Cranston

� Common themes across New England:� Increasing annual precipitation
� Increasing frequency of heavy rains
� Warming annual temperatures
� Wildly varying seasonal snowfall
� Shift in precipitation frequency (50, 100 yr – 24 hr rain)
� For smaller (<800 sq mi) basins –trend toward increased flood magnitude and/or frequency� Most pronounced where significant
land use change and/or urbanization has occurred
Ashton Mills, Cumberland RI, March 31, 2010(Photo: D. Vallee/NWS)
I-95 in Warwick with submerged Warwick Waste Water Treatment Facility in the upper rightMarch 31, 2010 – photo from RI ANG)

10
Trends in U.S. Temperatures and Precipitation: Decadal trends and 1991-2011 relative to 1901-1960
Temperatures Precipitation


Source: http://www.globalchange.gov/publications/reports/scientific-assessments/us-impacts
Change in frequency of Heavy Precipitation• Intense precipitation events (the heaviest 1%) • RI used to average 8 days a year of >1” of rain or more• Today we are averaging nearly 15 days!

Since the late 60s, similar signature of much shorter, less intense dry
periods and longer higher amplitude wet periods
http://www.ncdc.noaa.gov/cag

� Short/intense drought episodes:� 2014 and 2015
� Record daily flows� Exceeding minimums during
the 1960s drought!� But…very short duration with
long periods of significant recharge if not flood volumes
� Droughts of yesteryear:� 1964-66
� Prolonged record lows� Not as “record” as today’s low
minimum flows� But far longer in duration with
little significant recharge

7”
8”
7”
Thick yellow lines represent 24 hr 100 yr values from TP-40, 1961
Much of southern NE experienced a 1 to 2 inch
upward shift!
NOAA ATLAS 1424 Hour – 100 year return period rainfall
7”
6”
6”
5”
5”
http://hdsc.nws.noaa.gov/hdsc/pfds/index.html

� Small watersheds feeling the effects� Changes in frequency/magnitude
� Part land use/urbanization
� Compounded by encroachment in the floodplain
� Part changing climate
� Larger basins with flood control haven’t seen as noticeable a shift� Most USACE reservoirs are built for 6-8
inch runoff events
� Greater capacity to handle more rain
� Urban “flash floods” increasing� Storm water systems cannot handle the
volume of intense rainfall
Kenyon Industries, Pawcatuck RiverPhoto: C. Fox
Scituate Reservoir at it’s peak dischargeMarch 31, 2010

0
0.4
0.8
1.2
1.6
2
2.4
Nu
mb
er
of
Flo
od
s P
er
Yea
r
Location
Southern New England River Basin Normalized Number
of Minor, Moderate, and Major Floods Prior to 1970
Major Floods
Moderate Floods
Minor Floods
Data provided by

0
0.4
0.8
1.2
1.6
2
2.4
Nu
mb
er
of
Flo
od
s P
er
Yea
r
Location
Southern New England River Basin Normalized Number
of Minor, Moderate, and Major Floods from 1970-2013
Major Floods
Moderate Floods
Minor Floods
Data provided by

Post Shopping Malls I-95 & I-295
construction
Post Shopping Malls I-95 & I-295
construction

Royal Mill Dam
Natic Dam
Arctic Dam
Bradford Soapworks
Providence St., West Warwick, March 31, 2010(Photo: examiner.com)
Warwick WWTF
West Warwick WWTF
The Malls

0
0.05
0.1
0.15
0.2
0.25
0.3
0.35
0.4
0.45
JANUARY FEBRUARY MARCH APRIL MAY JUNE JULY AUGUST SEPTEMBER OCTOBER NOVEMBER DECEMBER
Nu
mb
er
of
Flo
od
s
Month
Southern New England River Basin Normalized
Number of Minor, Moderate, and Major Floods
Per Month Prior to 1970 (18 forecast locations)
Major Floods
Moderate Floods
Minor Floods
Data provided by

0
0.05
0.1
0.15
0.2
0.25
0.3
0.35
0.4
0.45
JANUARY FEBRUARY MARCH APRIL MAY JUNE JULY AUGUST SEPTEMBER OCTOBER NOVEMBER DECEMBER
Nu
mb
er
of
Flo
od
s
Month
Southern New England River Basin Normalized
Number of Minor, Moderate, and Major Floods
Per Month from 1970 - 2013 (18 forecast locations)
Major Floods
Moderate Floods
Minor Floods
Data provided by

� The Northeast has become a “hot spot” for record floods & heavy rainfall in the past 10 years
� Noticeable trends include increased yearly rainfall and increased annual temperatures� Southeast New England has experienced a 1 to 2 inch
shift upwards in the 100 yr – 24 hour rainfall
� Smaller watersheds & those with significant urbanization are most vulnerable to increased river & stream flooding

� Floodplain, land use, infrastructure, dam spillway requirements, drainage requirements, non-point source runoff, bridge clearances, “hardening” of critical facilities in the floodplain, property values etc…
� Flood Insurance – work to increase participation
� How much risk are we willing to insure and accept?
Graphic courtesy of Cameron Wake
University of New Hampshire

Providence Street – West Warwick, RI at 1030 am Wednesday 3/31/10
David R. ValleeHydrologist-in-Charge
NOAA/NWS
Northeast River Forecast Center