david c. miller, ph.d. - netl.doe.gov library/events/2015... · guide testing & reach larger...
TRANSCRIPT
David C. Miller, Ph.D.Technical Director, CCSINational Energy Technology LaboratoryU.S. Department of Energy
23 June 2015
2
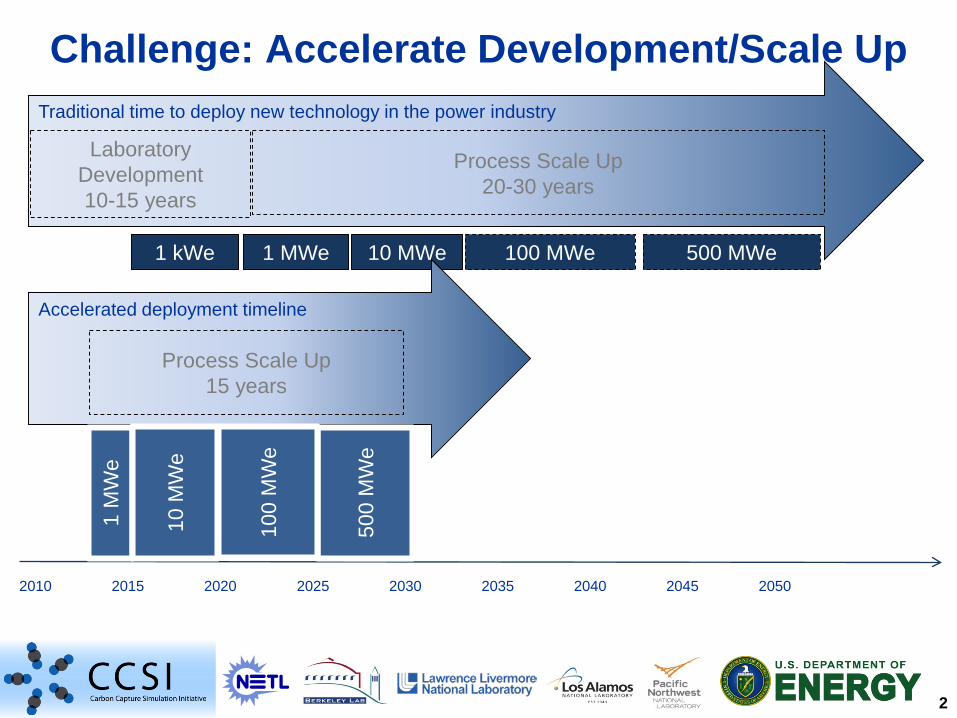
Challenge: Accelerate Development/Scale Up
2010 2015 2020 2025 2030 2035 2040 2045 2050
1 MWe1 kWe 10 MWe 100 MWe 500 MWe
Traditional time to deploy new technology in the power industry
Laboratory Development10-15 years
Process Scale Up20-30 years
Accelerated deployment timeline
Process Scale Up15 years
1 M
We
10 M
We
500
MW
e
100
MW
e
3
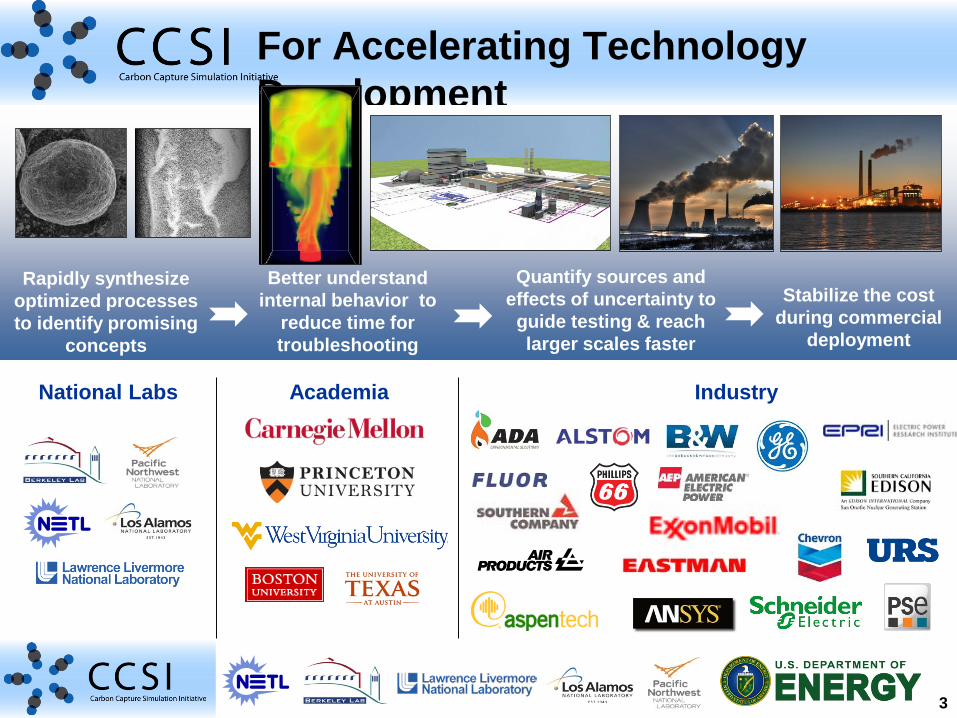
For Accelerating Technology Development
National Labs Academia Industry
Rapidly synthesize optimized processes to identify promising
concepts
Better understand internal behavior to
reduce time for troubleshooting
Quantify sources and effects of uncertainty to
guide testing & reach larger scales faster
Stabilize the cost during commercial
deployment
3
4
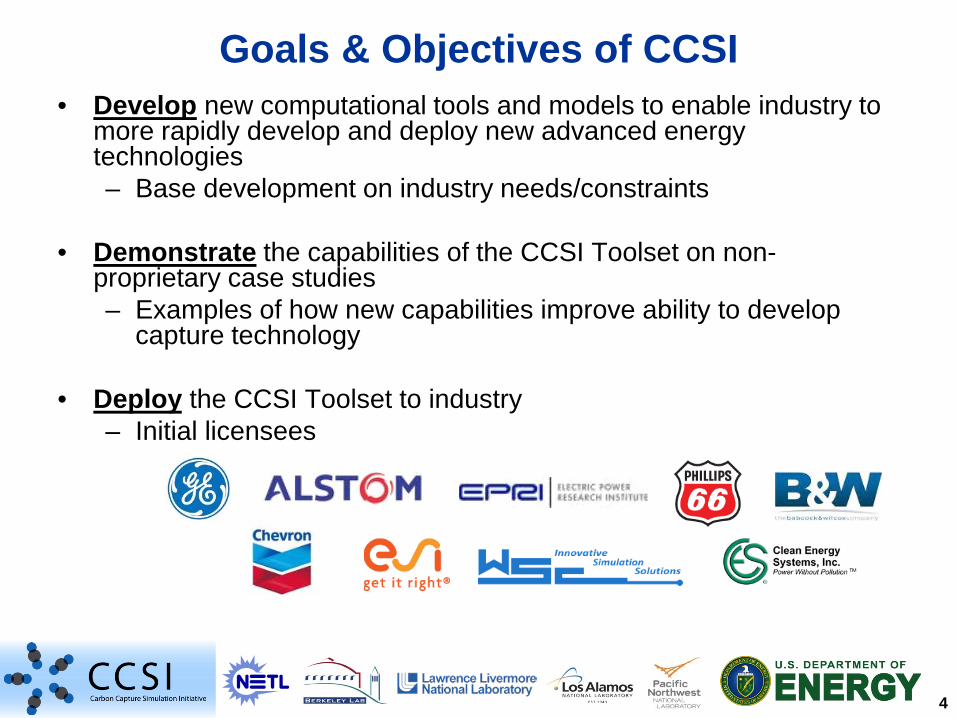
• Develop new computational tools and models to enable industry to more rapidly develop and deploy new advanced energy technologies– Base development on industry needs/constraints
• Demonstrate the capabilities of the CCSI Toolset on non-proprietary case studies– Examples of how new capabilities improve ability to develop
capture technology
• Deploy the CCSI Toolset to industry– Initial licensees
Goals & Objectives of CCSI

5
• Organizational Meetings: March 2010 - October 2010• Technical work initiated: Feb. 1, 2011• Preliminary Release of CCSI Toolset: September 2012
– Initial licenses signed• CCSI Year 3 starts Feb. 1, 2013
– Began solvent modeling/demonstration component• 2013 Toolset Release: October 31, 2013
– Multiple tools and models released and being used by industry
• 2014 Toolset Release: October 31, 2014 • Future
– Final IAB meeting: Sept. 23-24, 2015 (Reston, VA) – Final major release October/November 2015– Commercial licensing late 2015 or early 2016
CCSI Timeline
5
6
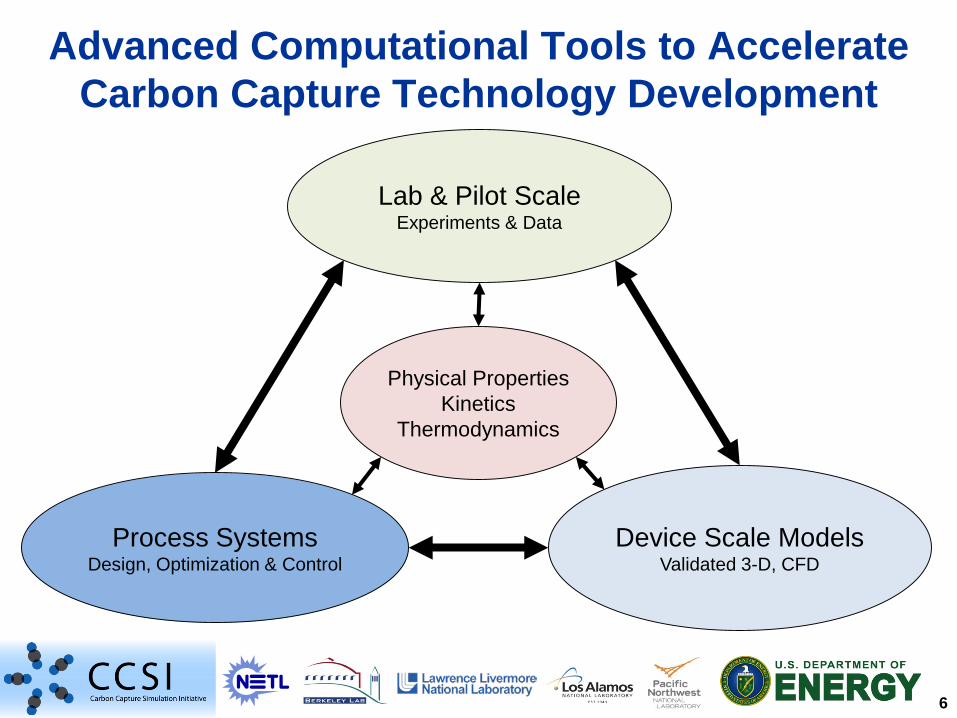
Advanced Computational Tools to Accelerate Carbon Capture Technology Development
Lab & Pilot ScaleExperiments & Data
Device Scale Models Validated 3-D, CFD
Process SystemsDesign, Optimization & Control
Physical PropertiesKinetics
Thermodynamics
7

8

9
• Process Systems Engineering & Crosscutting Tools– FOQUS– Optimization under uncertainty
• Solid Sorbents Models & Demonstration– Process Systems Example– Validated CFD Model Example
• Solvent System Model Example & Validation– MEA example
• Supporting Pilot & Demonstration Scale Capture
Outline
10
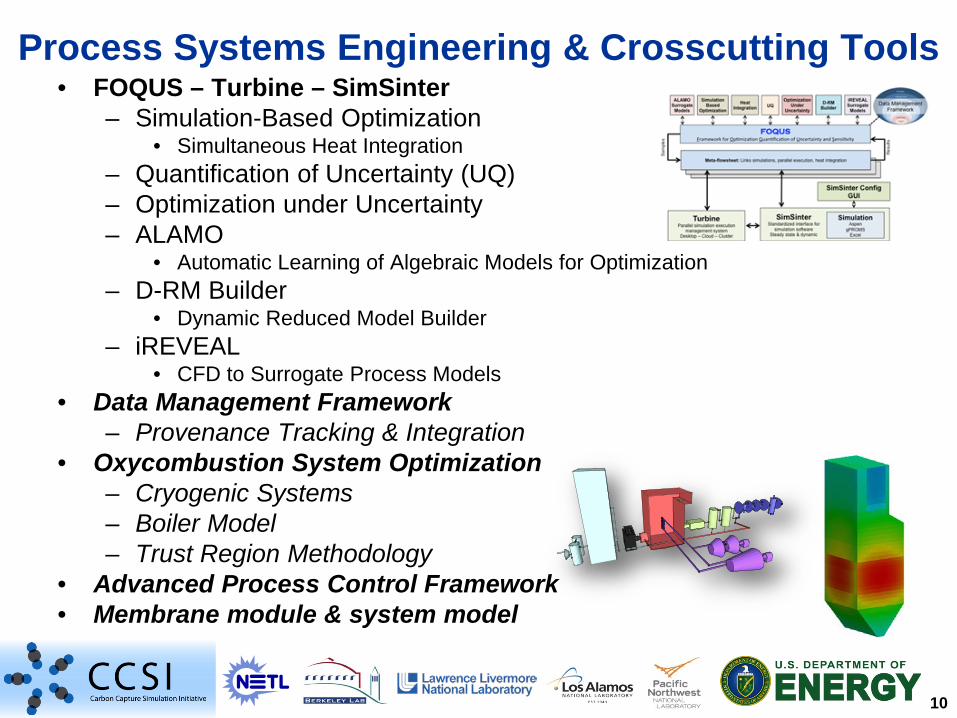
• FOQUS – Turbine – SimSinter– Simulation-Based Optimization
• Simultaneous Heat Integration– Quantification of Uncertainty (UQ)– Optimization under Uncertainty– ALAMO
• Automatic Learning of Algebraic Models for Optimization– D-RM Builder
• Dynamic Reduced Model Builder– iREVEAL
• CFD to Surrogate Process Models• Data Management Framework
– Provenance Tracking & Integration• Oxycombustion System Optimization
– Cryogenic Systems– Boiler Model– Trust Region Methodology
• Advanced Process Control Framework• Membrane module & system model
Process Systems Engineering & Crosscutting Tools
11
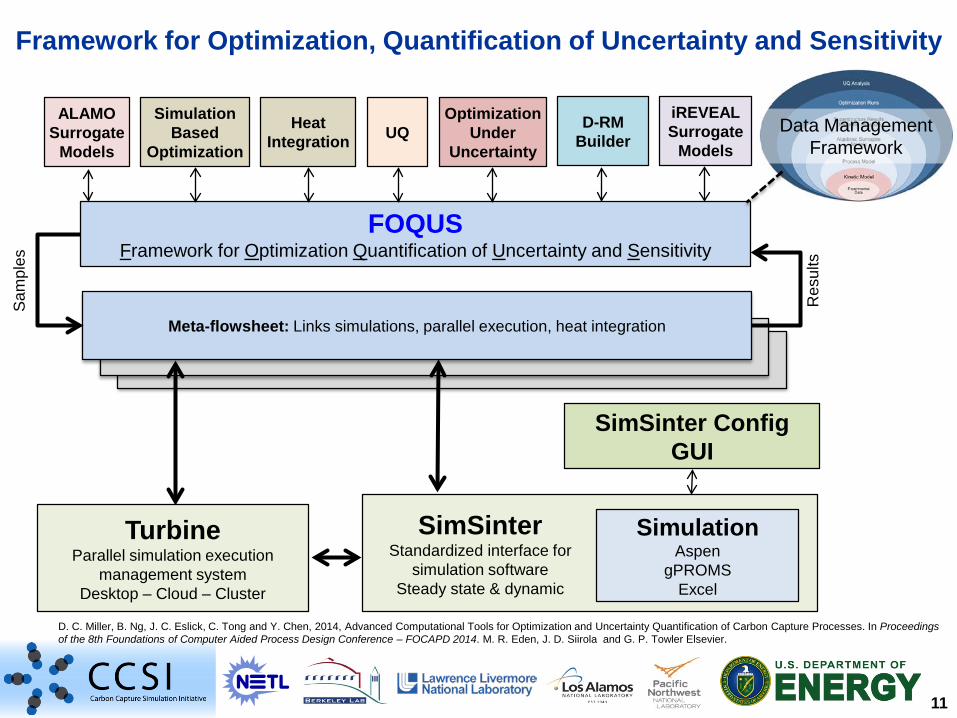
Framework for Optimization, Quantification of Uncertainty and Sensitivity
D. C. Miller, B. Ng, J. C. Eslick, C. Tong and Y. Chen, 2014, Advanced Computational Tools for Optimization and Uncertainty Quantification of Carbon Capture Processes. In Proceedings of the 8th Foundations of Computer Aided Process Design Conference – FOCAPD 2014. M. R. Eden, J. D. Siirola and G. P. Towler Elsevier.
SimSinterStandardized interface for
simulation softwareSteady state & dynamic
SimulationAspen
gPROMSExcel
SimSinter ConfigGUI
Res
ults
FOQUSFramework for Optimization Quantification of Uncertainty and Sensitivity
Meta-flowsheet: Links simulations, parallel execution, heat integration
Sam
ples
SimulationBased
OptimizationUQ
ALAMO Surrogate
ModelsData Management
Framework
TurbineParallel simulation execution
management systemDesktop – Cloud – Cluster
iREVEALSurrogate
Models
Optimization Under
Uncertainty
D-RMBuilder
Heat Integration
12
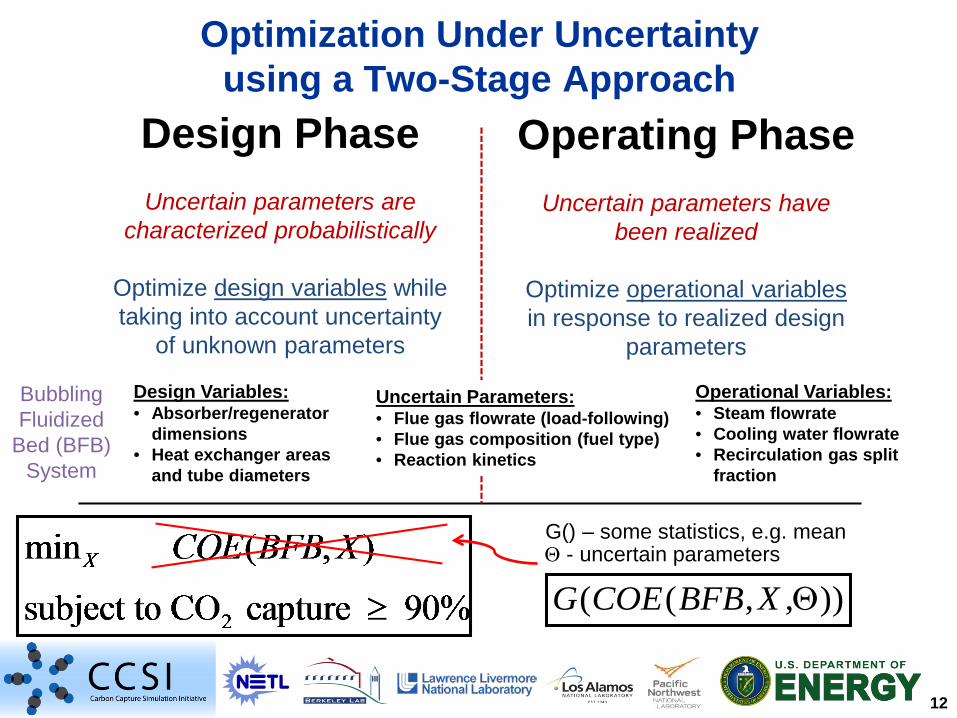
Optimization Under Uncertaintyusing a Two-Stage Approach
Design PhaseUncertain parameters are
characterized probabilistically
Optimize design variables while taking into account uncertainty
of unknown parameters
Operating PhaseUncertain parameters have
been realized
Optimize operational variablesin response to realized design
parameters
Bubbling Fluidized
Bed (BFB) System
Design Variables:• Absorber/regenerator
dimensions• Heat exchanger areas
and tube diameters
Uncertain Parameters:• Flue gas flowrate (load-following)• Flue gas composition (fuel type)• Reaction kinetics
Operational Variables:• Steam flowrate• Cooling water flowrate• Recirculation gas split
fraction
)),,(( ΘXBFBCOEG
G() – some statistics, e.g. meanΘ - uncertain parameters
13
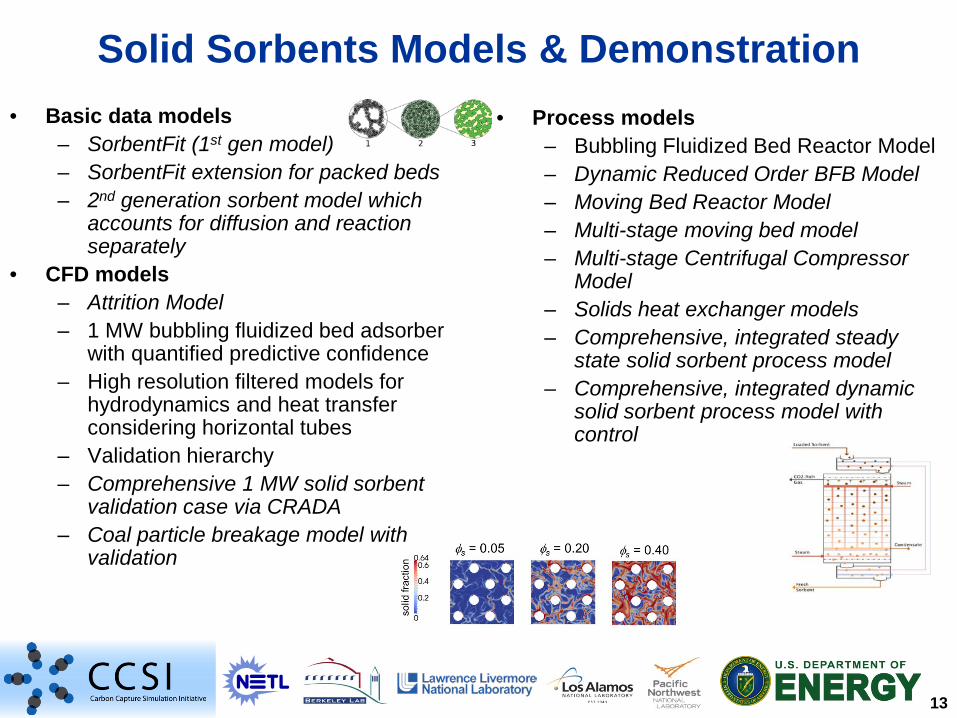
Solid Sorbents Models & Demonstration• Basic data models
– SorbentFit (1st gen model)– SorbentFit extension for packed beds– 2nd generation sorbent model which
accounts for diffusion and reaction separately
• CFD models– Attrition Model– 1 MW bubbling fluidized bed adsorber
with quantified predictive confidence– High resolution filtered models for
hydrodynamics and heat transfer considering horizontal tubes
– Validation hierarchy– Comprehensive 1 MW solid sorbent
validation case via CRADA– Coal particle breakage model with
validation
• Process models– Bubbling Fluidized Bed Reactor Model– Dynamic Reduced Order BFB Model– Moving Bed Reactor Model– Multi-stage moving bed model– Multi-stage Centrifugal Compressor
Model– Solids heat exchanger models– Comprehensive, integrated steady
state solid sorbent process model– Comprehensive, integrated dynamic
solid sorbent process model with control

14
Solid Sorbent: Process Systems Example
Lab & Pilot ScaleExperiments & Data
Device Scale Models Validated 3-D, CFD
Process SystemsDesign, Optimization & Control
Physical PropertiesKinetics
Thermodynamics
15
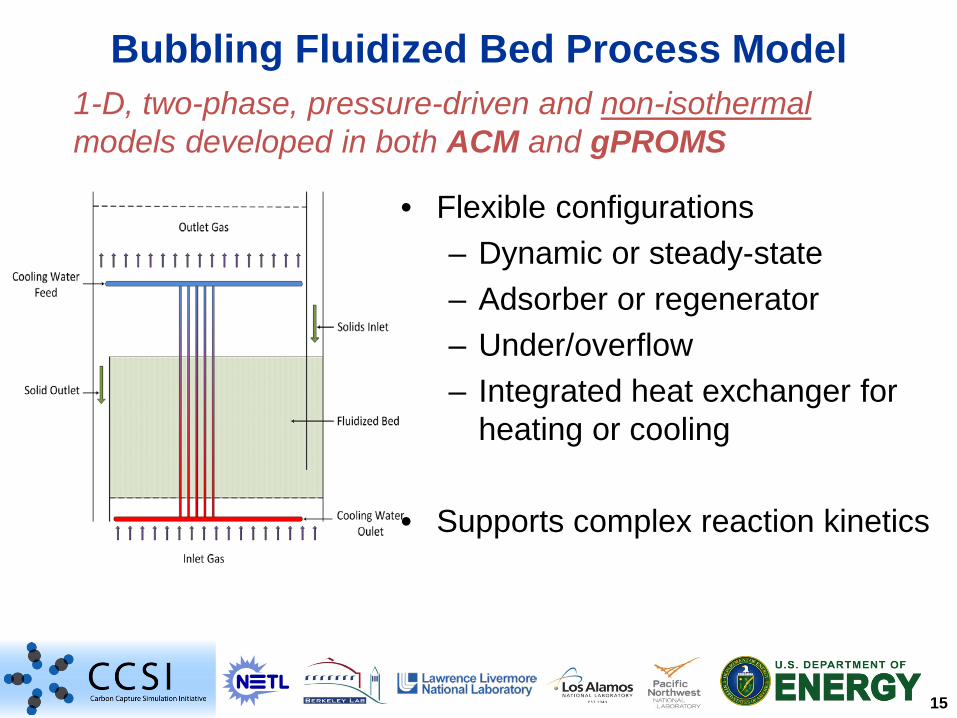
Bubbling Fluidized Bed Process Model1-D, two-phase, pressure-driven and non-isothermalmodels developed in both ACM and gPROMS
• Flexible configurations– Dynamic or steady-state– Adsorber or regenerator– Under/overflow– Integrated heat exchanger for
heating or cooling
• Supports complex reaction kinetics
16
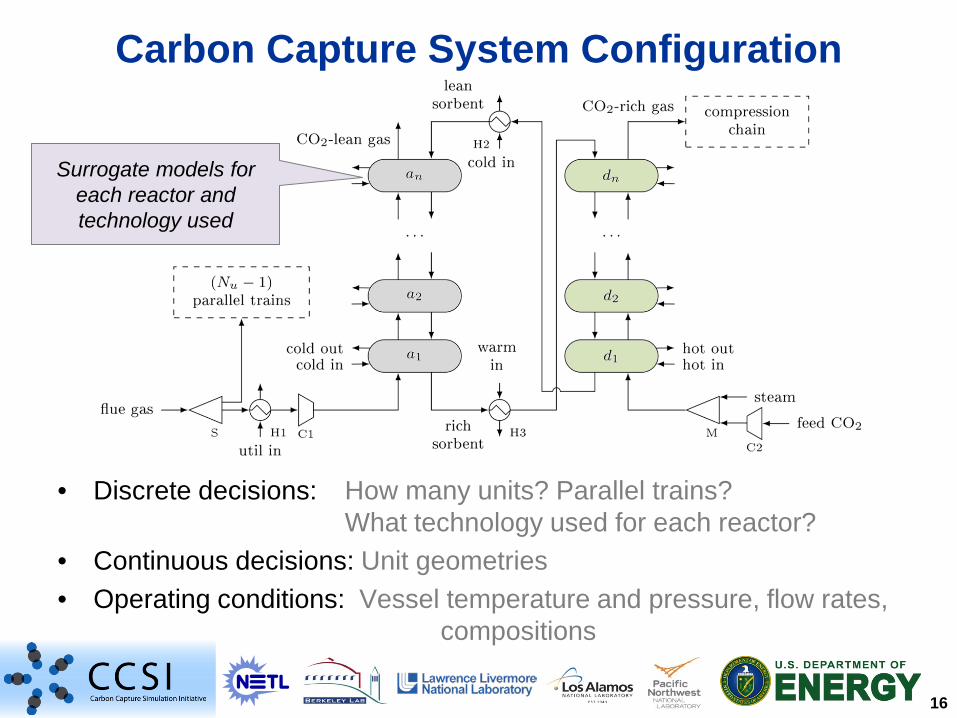
• Discrete decisions: How many units? Parallel trains? What technology used for each reactor?
• Continuous decisions: Unit geometries• Operating conditions: Vessel temperature and pressure, flow rates,
compositions
Carbon Capture System Configuration
Surrogate models for each reactor and technology used

17
• Step 1: Define a large set of potential basis functions
• Step 2: Model reduction
ALAMO: Model Development & Overfitting
True errorEmpirical error
Complexity
Err
or
Ideal Model
OverfittingUnderfitting
18
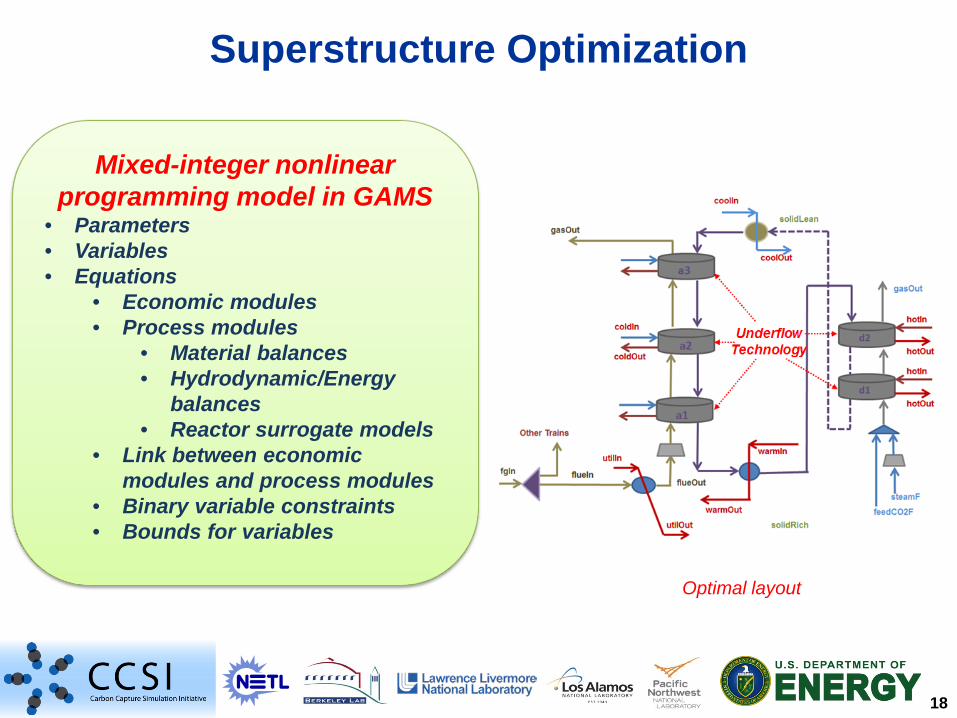
Superstructure Optimization
Optimal layout
Mixed-integer nonlinear programming model in GAMS
• Parameters• Variables• Equations
• Economic modules• Process modules
• Material balances• Hydrodynamic/Energy
balances• Reactor surrogate models
• Link between economic modules and process modules
• Binary variable constraints• Bounds for variables
19
Opt
imiz
atio
n &
Hea
t Int
egra
tion
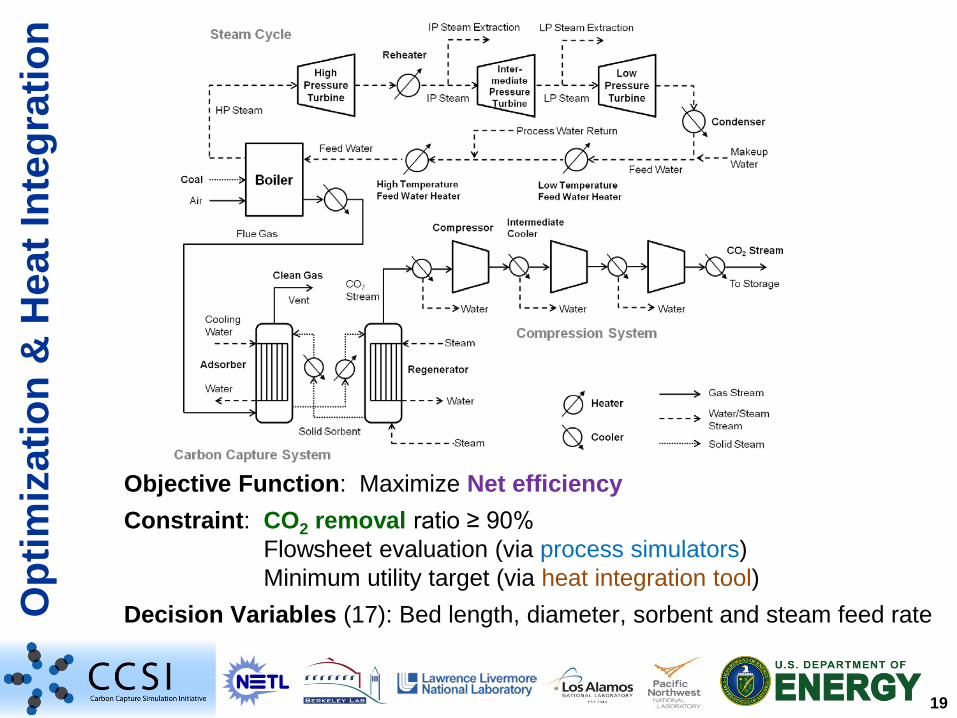
Objective Function: Maximize Net efficiencyConstraint: CO2 removal ratio ≥ 90%
Flowsheet evaluation (via process simulators)Minimum utility target (via heat integration tool)
Decision Variables (17): Bed length, diameter, sorbent and steam feed rate
20
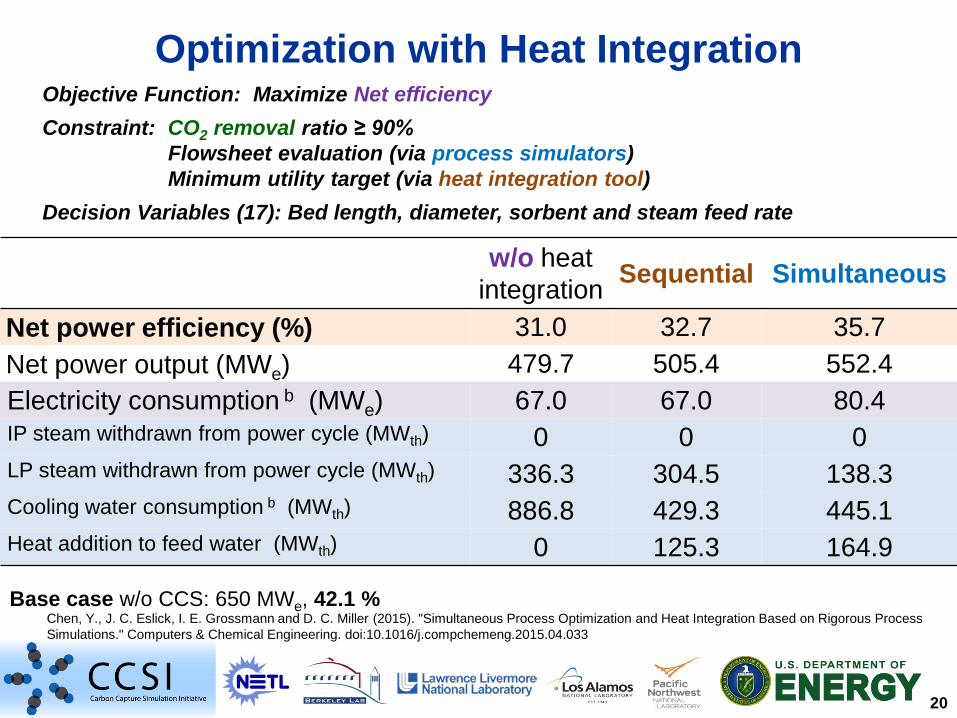
Optimization with Heat Integration
w/o heat integration Sequential Simultaneous
Net power efficiency (%) 31.0 32.7 35.7Net power output (MWe) 479.7 505.4 552.4Electricity consumption b (MWe) 67.0 67.0 80.4IP steam withdrawn from power cycle (MWth) 0 0 0LP steam withdrawn from power cycle (MWth) 336.3 304.5 138.3Cooling water consumption b (MWth) 886.8 429.3 445.1Heat addition to feed water (MWth) 0 125.3 164.9
Base case w/o CCS: 650 MWe, 42.1 %Chen, Y., J. C. Eslick, I. E. Grossmann and D. C. Miller (2015). "Simultaneous Process Optimization and Heat Integration Based on Rigorous Process Simulations." Computers & Chemical Engineering. doi:10.1016/j.compchemeng.2015.04.033
Objective Function: Maximize Net efficiencyConstraint: CO2 removal ratio ≥ 90%
Flowsheet evaluation (via process simulators)Minimum utility target (via heat integration tool)
Decision Variables (17): Bed length, diameter, sorbent and steam feed rate
21
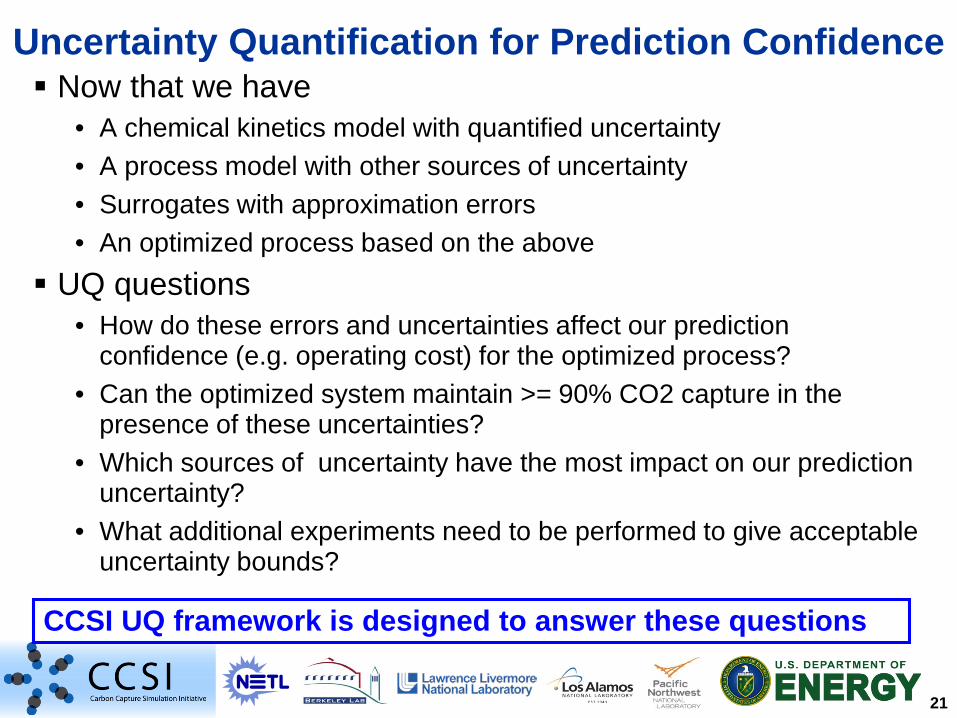
Uncertainty Quantification for Prediction Confidence Now that we have
• A chemical kinetics model with quantified uncertainty• A process model with other sources of uncertainty• Surrogates with approximation errors• An optimized process based on the above
UQ questions• How do these errors and uncertainties affect our prediction
confidence (e.g. operating cost) for the optimized process?• Can the optimized system maintain >= 90% CO2 capture in the
presence of these uncertainties?• Which sources of uncertainty have the most impact on our prediction
uncertainty?• What additional experiments need to be performed to give acceptable
uncertainty bounds?
CCSI UQ framework is designed to answer these questions
22
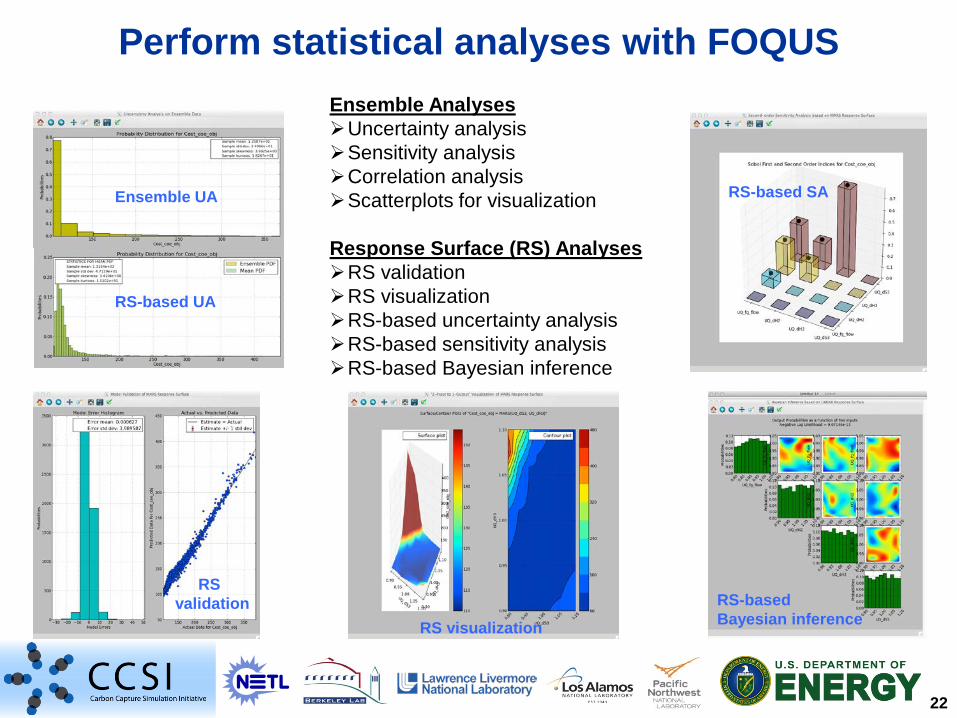
Perform statistical analyses with FOQUSEnsemble AnalysesUncertainty analysisSensitivity analysisCorrelation analysisScatterplots for visualization
Response Surface (RS) AnalysesRS validationRS visualizationRS-based uncertainty analysisRS-based sensitivity analysisRS-based Bayesian inference
Ensemble UA
RS-based UA
RS-based SA
RSvalidation
RS visualization
RS-based Bayesian inference
23
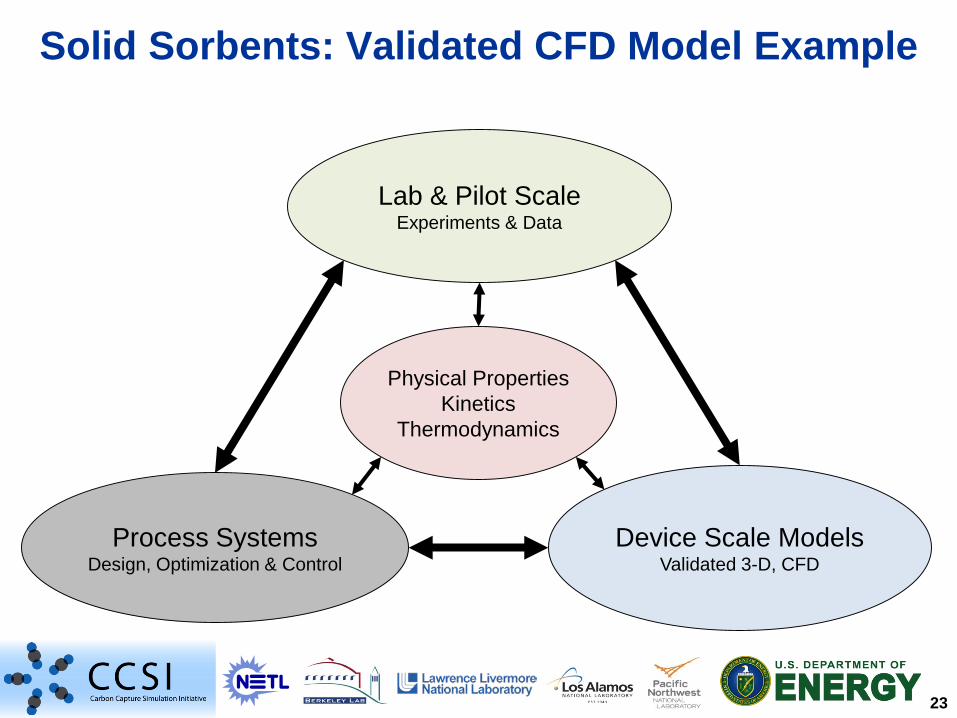
Solid Sorbents: Validated CFD Model Example
Lab & Pilot ScaleExperiments & Data
Device Scale Models Validated 3-D, CFD
Process SystemsDesign, Optimization & Control
Physical PropertiesKinetics
Thermodynamics
24
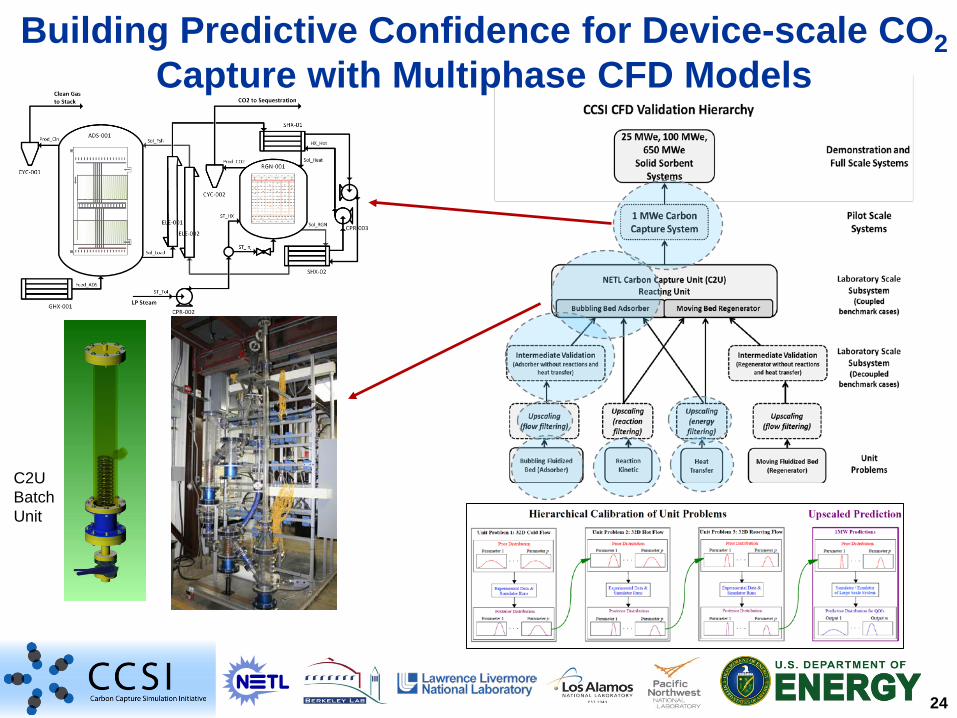
C2U BatchUnit
Building Predictive Confidence for Device-scale CO2 Capture with Multiphase CFD Models

25
Intermediate Validation with Unit Problem 3Predicted Breakthrough Curves for Held-out Runs

26
Filtered Models with Heat Exchanger Tubes
Model-on-model verification

27
Quantitatively predicting scale up performance
28
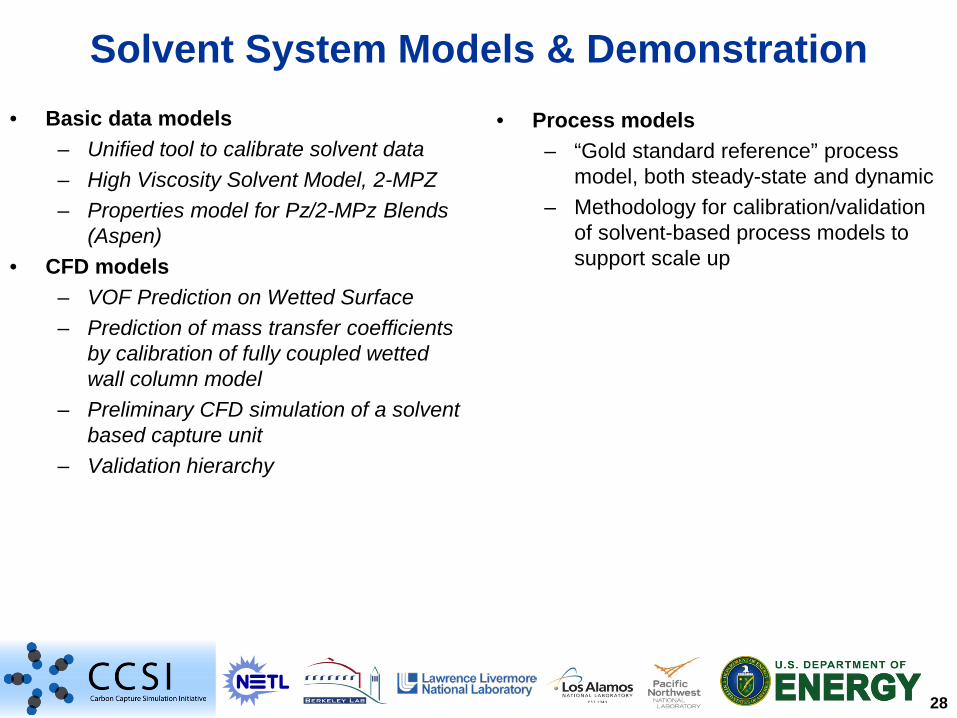
Solvent System Models & Demonstration• Basic data models
– Unified tool to calibrate solvent data– High Viscosity Solvent Model, 2-MPZ– Properties model for Pz/2-MPz Blends
(Aspen)• CFD models
– VOF Prediction on Wetted Surface– Prediction of mass transfer coefficients
by calibration of fully coupled wetted wall column model
– Preliminary CFD simulation of a solvent based capture unit
– Validation hierarchy
• Process models– “Gold standard reference” process
model, both steady-state and dynamic– Methodology for calibration/validation
of solvent-based process models to support scale up

29
Solvents: System Model Example & Validation
Lab & Pilot ScaleExperiments & Data
Device Scale Models Validated 3-D, CFD
Process SystemsDesign, Optimization & Control
Physical PropertiesKinetics
Thermodynamics
30
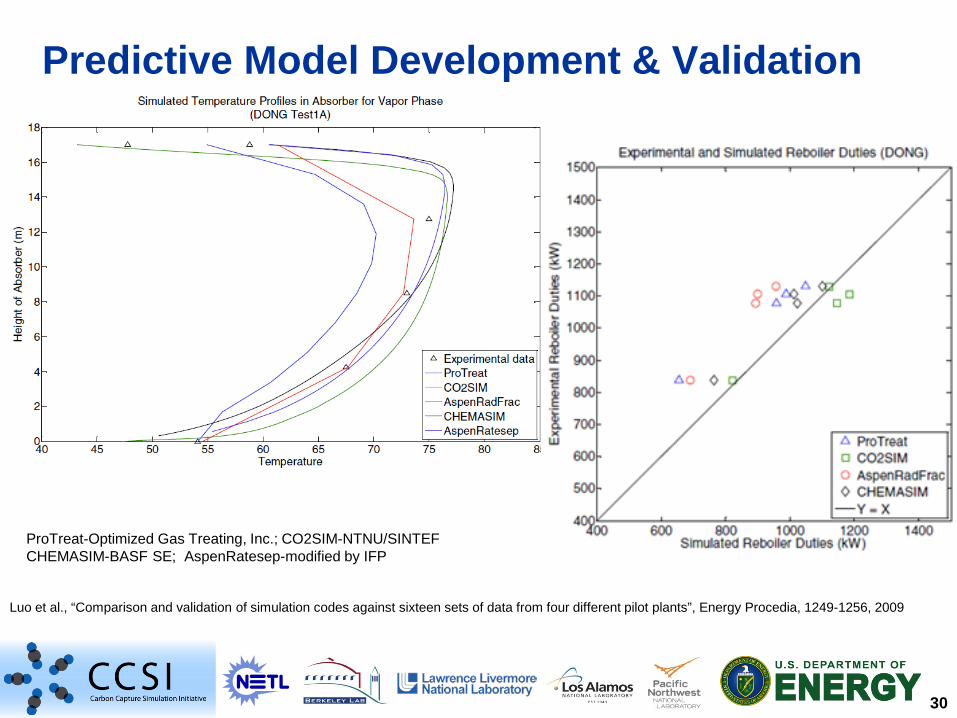
Predictive Model Development & Validation
Luo et al., “Comparison and validation of simulation codes against sixteen sets of data from four different pilot plants”, Energy Procedia, 1249-1256, 2009
ProTreat-Optimized Gas Treating, Inc.; CO2SIM-NTNU/SINTEFCHEMASIM-BASF SE; AspenRatesep-modified by IFP
31
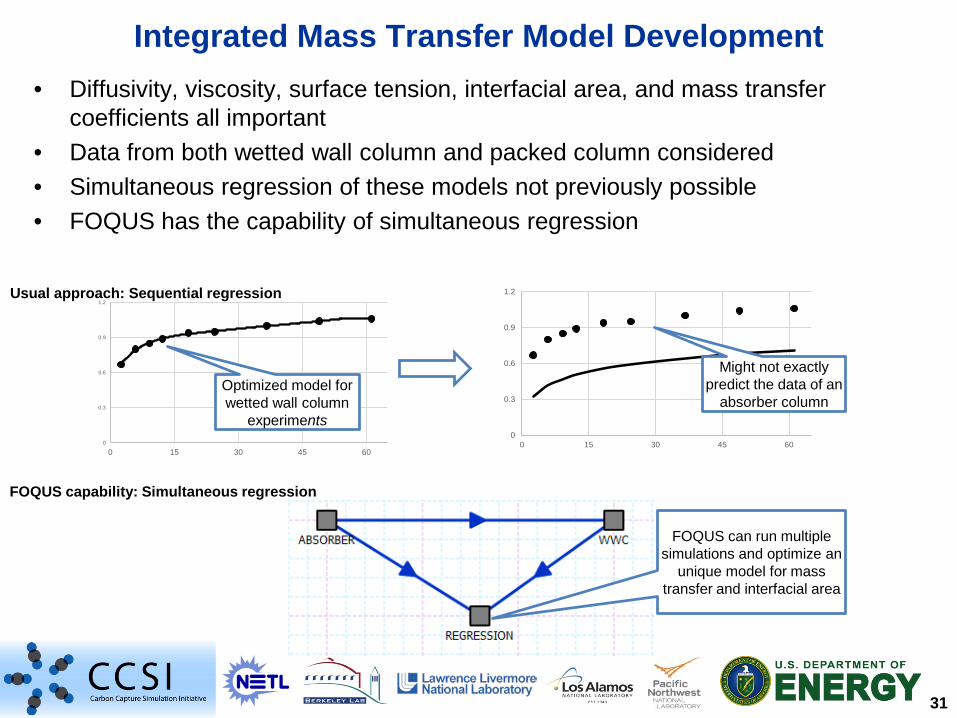
• Diffusivity, viscosity, surface tension, interfacial area, and mass transfer coefficients all important
• Data from both wetted wall column and packed column considered• Simultaneous regression of these models not previously possible• FOQUS has the capability of simultaneous regression
Integrated Mass Transfer Model Development
0
0.3
0.6
0.9
1.2
0 15 30 45 60
0
0.3
0.6
0.9
1.2
0 15 30 45 60
Optimized model for wetted wall column
experiments
Might not exactly predict the data of an
absorber column
Usual approach: Sequential regression
FOQUS capability: Simultaneous regression
FOQUS can run multiple simulations and optimize an
unique model for mass transfer and interfacial area
32
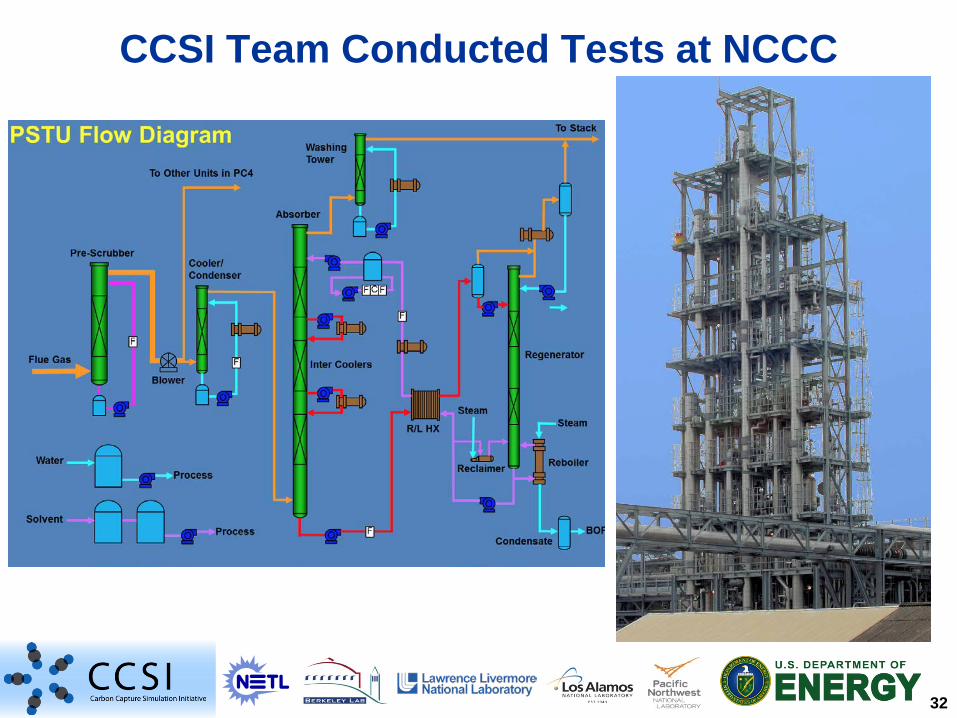
CCSI Team Conducted Tests at NCCC

33
Steady State Absorber ValidationNo parameters tuned
Case 1: L/G=3.81 3 bed absorber with two intercoolers
30
40
50
60
70
80
0 0.2 0.4 0.6 0.8 1
Tem
pera
ture
(°C
)
Relative Column Position*
* Relative positions of 0 and 1 represent top and bottom of column, respectively
Temperature Profiles
Case 5:6.43 L/G ratioIntercooling present17.18% CO2 in flue gas
30
40
50
60
70
80
0 0.2 0.4 0.6 0.8 1
Tem
pera
ture
(°C
)
Relative Column Position
34
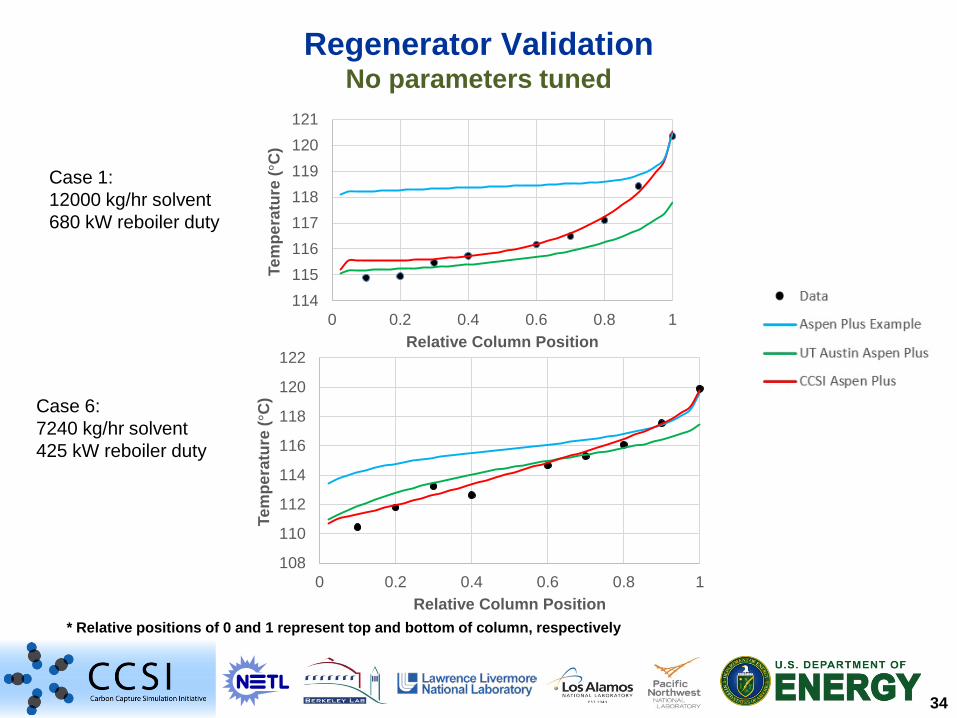
Regenerator ValidationNo parameters tuned
Case 6:7240 kg/hr solvent425 kW reboiler duty
108
110
112
114
116
118
120
122
0 0.2 0.4 0.6 0.8 1
Tem
pera
ture
(°C
)
Relative Column Position* Relative positions of 0 and 1 represent top and bottom of column, respectively
Case 1: 12000 kg/hr solvent680 kW reboiler duty
114115116117118119120121
0 0.2 0.4 0.6 0.8 1
Tem
pera
ture
(°C
)
Relative Column Position

35
Advanced Computational Tools to Accelerate Carbon Capture Technology Development
Lab & Pilot ScaleExperiments & Data
Device Scale Models Validated 3-D, CFD
Process SystemsDesign, Optimization & Control
Physical PropertiesKinetics
Thermodynamics
36
• CCSI Toolset– Suite of rigorous, validated, predictive models– Computational tools– Methodologies for UQ, validation, model development– Broadly applicable to many carbon capture concepts
• How to maximize the benefit of CCSI investment and accomplishments?– Deploy the tools– Utilize the tools– Train industry
CCSI status as of January 2016

37
Carbon Capture Simulation for Industry Impact
• Work closely with industry partners to help scale up– Large scale pilots
• Help ensure success at this scale– Employ simulation to predict performance, potential issue– Help resolve issues using simulation tools
• Maximize learning at this scale– Data collection & experimental design– Develop & Validate models– UQ to identify critical data
• Help develop demonstration plant design– Utilize optimization tools (OUU, Heat Integration)– Quantitative confidence on predicted performance– Predict dynamic performance
– Partnership via CRADA
38
Acknowledgements– SorbentFit
• David Mebane (NETL/ORISE, West Virginia University)• Joel Kress (LANL)
– Process Models• Solid sorbents: Debangsu Bhattacharyya, Srinivasarao Modekurti, Ben Omell (West Virginia University), Andrew Lee,
Hosoo Kim, Juan Morinelly, Yang Chen (NETL)• Solvents: Joshua Morgan, Anderson Soares Chinen, Benjamin Omell, Debangsu Bhattacharyya (WVU), Gary Rochelle
and Brent Sherman (UT, Austin)• MEA validation data: NCCC staff (John Wheeldon and his team)
– FOQUS• ALAMO: Nick Sahinidis, Alison Cozad, Zach Wilson (CMU), David Miller (NETL)• Superstructure: Nick Sahinidis, Zhihong Yuan (CMU), David Miller (NETL)• DFO: John Eslick (CMU), David Miller (NETL)• Heat Integration: Yang Chen, Ignacio Grossmann (CMU), David Miller (NETL)• UQ: Charles Tong, Brenda Ng, Jeremey Ou (LLNL)• OUU: DFO Team, UQ Team, Alex Dowling (CMU)• D-RM Builder: Jinliang Ma (NETL)• Turbine: Josh Boverhof, Deb Agarwal (LBNL)• SimSinter: Jim Leek (LLNL), John Eslick (CMU)
– Data Management• Tom Epperly (LLNL), Deb Agarwal, You-Wei Cheah (LBNL)
– CFD Models and Validation• Xin Sun, Jay Xu, Kevin Lai, Wenxiao Pan, Wesley Xu, Greg Whyatt, Charlie Freeman (PNNL), Curt Storlie, Peter
Marcey, Brett Okhuysen (LANL), S. Sundaresan, Ali Ozel (Princeton), Janine Carney, Rajesh Singh, Jeff Dietiker, Tingwen Li (NETL) Emily Ryan, William Lane (Boston University)
Disclaimer This presentation was prepared as an account of work sponsored by an agency of the United States Government. Neither the United States Government nor any agency thereof, nor any of their employees, makes any warranty, express or implied, or assumes any legal liability or responsibility for the accuracy, completeness, or usefulness of any information, apparatus, product, or process disclosed, or represents that its use would not infringe privately owned rights. Reference herein to any specific commercial product, process, or service by trade name, trademark, manufacturer, or otherwise does not necessarily constitute or imply its endorsement, recommendation, or favoring by the United States Government or any agency thereof. The views and opinions of authors expressed herein do not necessarily state or reflect those of the United States Government or any agency thereof.