datalogic star conference milan 2017 star conference... · idware mobile computing&comm. ......
TRANSCRIPT

STAR Conference
Milan
27 March 2018

Disclaimer
This document has been prepared by Datalogic S.p.A. (the "Company") for use during meetings with investors and
financial analysts and is solely for information purposes. The information set out herein has not been verified by
an independent audit company.
Neither the Company nor any of its subsidiaries, affiliates, branches, representative offices (the “Group”), as well
as any of their directors, officers, employees, advisers or agents (the “Group Representatives”) accepts any
responsibility for/or makes any representation or warranty, express or implied, as to the accuracy, timeliness or
completeness of the information set out herein or any other related information regarding the Group, whether
written, oral or in visual or electronic form, transmitted or made available.
This document may contain forward-looking statements about the Company and/or the Group based on current
expectations and opinions developed by the Company, as well as based on current plans, estimates, projections
and projects of the Group. These forward-looking statements are subject to significant risks and uncertainties
(many of which are outside the control of the Company and/or the Group) which could cause a material difference
between forward-looking information and actual future results.
The information set out in this document is provided as of the date indicated herein. Except as required by
applicable laws and regulations, the Company assumes no obligation to provide updates of any of the aforesaid
forward-looking statements.
Under no circumstances shall the Group and/or any of the Group Representatives be held liable (for negligence or
otherwise) for any loss or damage howsoever arising from any use of this document or its contents or otherwise
in connection with the document or the aforesaid forward-looking statements.
This document does not constitute an offer to sell or a solicitation to buy or subscribe to Company shares and
neither this entire document or a portion of it may constitute a recommendation to effect any transaction or to
conclude any legal act of any kind whatsoever.
This document may not be reproduced or distributed, in whole or in part, by any person other than the Company.
By viewing and/or accepting a copy of this document, you agree to be bound by the foregoing limitations.
2

Group Overview
3

Datalogic at a glance
4
Global technology leader in the automatic data capture and process automation markets, in the Retail, Manufacturing, Transportation & Logistics, and Healthcare industries.
Founded in 1972, listed on the Italian Stock Exchange since 2001.

Over 40 years of Technological Innovation
5
2017 EXPANSION
2012
2015
2001
1988
1997
1972
2002
2011
FOUNDATION Established in Bologna
EXPANSION
Escort Memory Systems Inc.
IDWare Mobile Computing&Comm.
LISTINGListed on the STAR segment of
Italian Stock Exchange
INNOVATION
Acquisition of
Multiwave Photonics SA
Partnership with CAEN RFID Srl
Minec AB
Laservall SpA
Informatics Inc.
PSC Inc.
Datasensor SpA
Evolution Robotics Retail Inc.
Accu-Sort Systems Inc.
PPT Vision Inc.
EXPANSION
Set up new One Datalogic
Acquisition of
Soredi Touch Systems GmbH

EMEA 54%
NORTH AMERICA
28%APAC 13%
6
A Wide Geographical Footprint
6
Note: Breakdown by area based on FY 2017 revenues
Direct presence in 30 countries
8 Manufacturing Sites 11 R&D Centers
3 DL LABS
LATIN AMERICA
5%

Stock and Governance
7
Market Segment: STAR MTA
Reuters Code: DAL.MI
Bloomberg Code: DAL IM
Outstanding Shares: 58,446,491
Share Par-Value: 0.52 Euro each
SHAREHOLDERS’ STRUCTURE
Ticker: DAL
Price (March 22, 2018): 28.95 Euro
Market Cap (March 22, 2018): 1.70 B Euro
Auditing Company: EY
DATALOGIC PRICE PERFORMANCE
64.65%
35.35%
Hydra SpA Free Float
60
80
100
120
140
160
180
200
220
04/01/2016 04/06/2016 04/11/2016 04/04/2017 04/09/2017 04/02/2018
DAL.MI FTSEMIB.MI ITSTAR.MI

Strategy and Outlook
8

Unique Player across IA and ADC Markets
9
DATALOGIC is the only player across the Global competitive landscape who can boast
a wide and consolidated experience in both the two fields of:
▪ Industrial Automation (dating back to the foundation of the company)
▪ Automatic Data Capture (leadership deriving from the acquisition of PSC USA )
AUTOMATIC DATA CAPTUREINDUSTRIAL AUTOMATION

A New Organisation by Verticals…
10
10
11w w w . d a t a l o g i c . c o mCopyright Datalogic 2017 – Confidential & Proprietary Information
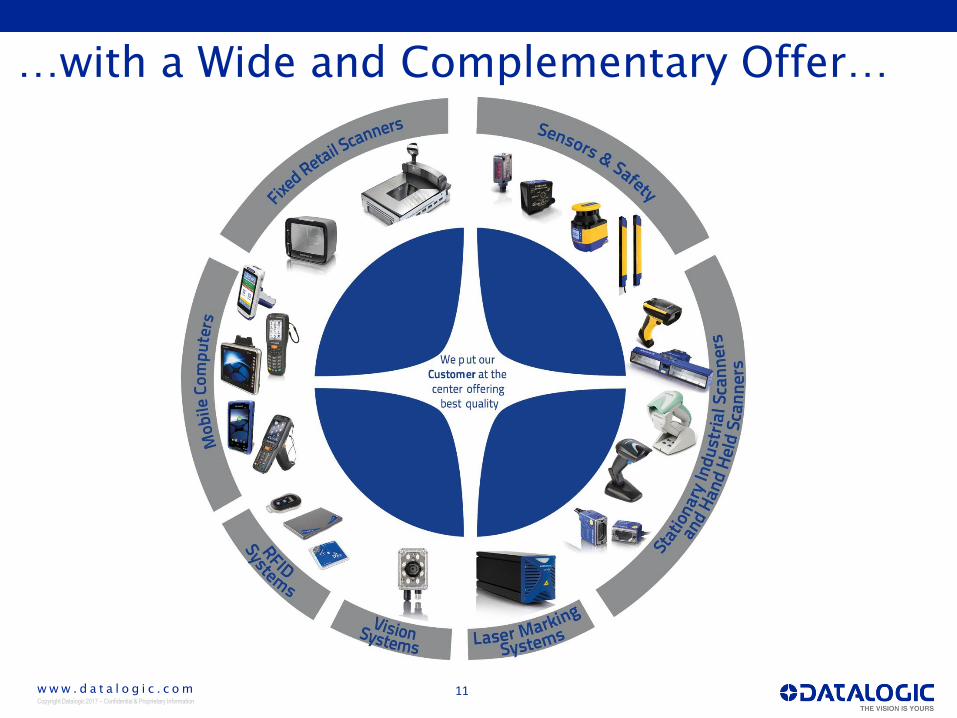
…with a Wide and Complementary Offer…

12w w w . d a t a l o g i c . c o mCopyright Datalogic 2017 – Confidential & Proprietary Information
…Innovative Solutions…

13w w w . d a t a l o g i c . c o mCopyright Datalogic 2017 – Confidential & Proprietary Information
…and a state of the art Customer Service

Total Addressable Market
Source: VDC 2017 and Management estimates
14
2017
Total Addressable Market @ $11 BN
CAGR 2017-2021 +5.4%
Healthcare
T&L
Retail
Manufacturing
Manufacturing
64%
Retail
21%
T&L
11%
Healthcare
4%

RETAIL E-COMMERCE WAREHOUNSING
AND LOGISTICS ROBOTICS
IoT
2016: 1.86 trillion USD
2021: 4.48 trillion USD
2016: 1.9 billion USD
2021: 22.4 billion USD
2016: 3.9 trillion USD
2025: 11.1 trillion USD
Datalogic products and solutions are essential for the e-commerce, the
robotics and the IoT revolution
There has never been a more exciting time as this to operate in
the market we play in
We play in a growing market
15

MARKET OUTLOOK DATALOGIC RESULTS
16
DATALOGIC PROPOSITION
Retail
Connecting People, Processes and Technology
▪ Market Leader along the Retail supply chain from 1974 with the first scanner
in Troy, Ohio to 2018 with the NRF exhibition in New York with the innovative
frictionless shopping
▪ Datalogic was the first company to introduce the full imaging bi-optic POS
scanner and to conceive a fully automated portal scanner
▪ New Data capture products for E-commerce and multichannel
▪ Data analytics for location based services, indoor navigation, customer
tracking either for path and time spent in front of shelves
▪ 90% of transactions are still completed in-
store
▪ E-commerce drives change towards an
omnichannel experience (brick and mortar
– online shopping)
▪ RFID, video analytics, digital and interactive
signage…are emerging technologies
▪ 2017 Revenues €278.6 mln (-1.6%
YoY), 49% of Revenues
▪ Double digit steady growth in
EMEA, whilst NA heavily affected by
forex effect
▪ Significant growth in APAC led by
China
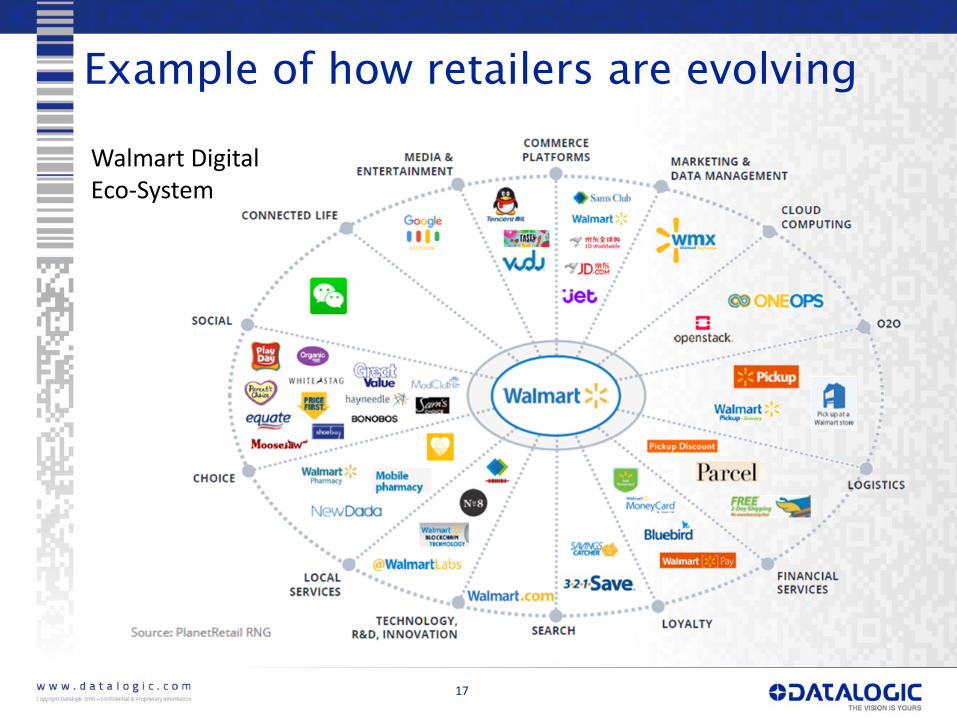
Example of how retailers are evolving
Walmart Digital Eco-System
17

MARKET OUTLOOK DATALOGIC RESULTS
18
Manufacturing
The factory of the future
▪ Industry 4.0 is pushing for multi-
technology adoption, product
interoperability and enhancement self
diagnostic capabilities
▪ The adoption of key digital technologies
shows a strong growth over the next 5
years
DATALOGIC PROPOSITION
▪ With more than 45 years of experience, Datalogic is a world-class product & solutions
provider for track & trace processes and quality control systems
▪ Datalogic is providing multi-product portfolio to serve all the major manufacturing
clients: Automotive, Food and Beverage, Automated Machinery and Electronics, and
Intralogistics.
▪ Wide-range offer adapting to every customer
▪ Safety Laser Sentinel
▪ Traceability Identification products and Laser marking
▪ Quality Control Machine Vision
▪ Expanding into Intralogistic solutions and Robotic/AGV guidance
▪ Unique portfolio provider of smart,
interconnected devices able to protect,
identify, sense, check and mark
▪ 2017 Revenues €150.5 mln (+10.1%
YoY), 27% of Revenues
▪ Performance driven by China (+ 64%
YoY)
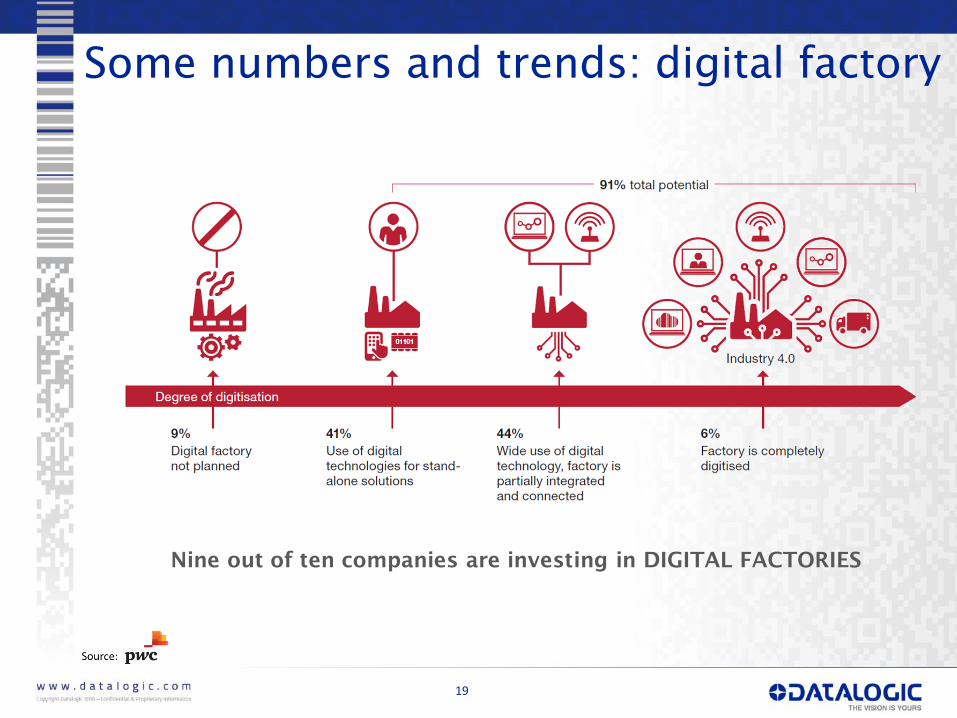
Some numbers and trends: digital factory
Nine out of ten companies are investing in DIGITAL FACTORIES
19

MARKET OUTLOOK DATALOGIC RESULTS
20
DATALOGIC PROPOSITION
▪ Growth is driven by E-commerce: high
speed sorting, ability to manage any size of
parcel, and high flexibility
▪ Stationary Industrial, Vision Systems and
Sensor&Safety are the fastest growing
Transportation & Logistics
Visibility and interaction with the customer
▪ Datalogic sensors and vision systems guarantee the optimal traceability of
packages and shipments
▪ The first generations of self-driving vehicles (autonomous shuttles and forklifts),
used in controlled areas of the warehouse are being developed
▪ Datalogic is at the forefront of the development of airport systems, since 1984
with the first automatic reading station in Milan, to the recent contract with a
main European hub in compliance with new IATA requirements.
▪ Datalogic’s proven capabilities are reflected by the recent “Platinum” supplier
qualification granted by a world leader in the shipping and logistics sector.
▪ 2017 Revenues €65.8 mln
(+12.9% YoY), 12% of Revenues
▪ North America and APAC
leading growth
▪ Double digit growth in the
second half of the year

21w w w . d a t a l o g i c . c o mCopyright Datalogic 2017 – Confidential & Proprietary Information
Transportation & Logistics
Baggage& Cargo Reconciliation
Out Of Gauge
Check-in and BaggageDrop-off Handling
Access Control
BaggageHandling Systems
STATIONARY INDUSTRIAL
SCANNERS
STATIONARY INDUSTRIAL SCANNERS
HAND HELD SCANNERS
HAND HELD SCANNERS
MOBILE COMPUTERS
AIRPORT

MARKET OUTLOOK DATALOGIC RESULTS
22
DATALOGIC PROPOSITION
▪ Growing global population above the age of
65 are driving demand for personalized
care and services
▪ Counterfeit is a global problem, placing
Datalogic’s precision at a high advantage
Healthcare
Meet regulations and Higher Patient Safety
▪ Datalogic is the only company able to empower the entire Healthcare ecosystem
from drug production to patient care or point of sale.
▪ Datalogic is the sole company providing unique product features for the HC
industry such as:
▪ Anti-microbial enclosures to enhance protection against germs and bacteria
▪ Inductive charging technology for battery recharge avoiding maintenance
cost related to contact damaging/wearing
▪ Green spot good match to ensure positive medicine-patient identification
▪ LAB Analysis is also working to ensure the reliability of data based on the patient
▪ 2017 Revenues €27.5 mln
(+38.8% YoY), 5% of Revenues
▪ The fastest growing sector in
2017
▪ Double digit growth in North
America

A clear strategy
Moving from a product to
a Customer-centric
Company, leveraging on
our wide range of
products that is able to
fulfill our customers’
needs for both data
collection and process
automation and providing
end-to-end solutions
across the entire flow of
operations
Remain a product
company with new
emphasis on solutions to
satisfy the needs of End
Users in the following
Industries: Retail,
Healthcare, T&L and
Manufacturing
Become a significant
player in North America
and further establish in
APAC with a growing
presence in China
Consolidate our position
in EMEA
Keep on constantly
growing, above
market average, while
significantly
improving
profitability
THE SCOPE THE ADVANTAGETHE OBJECTIVE
23

▪ Good response of customers on new products launched in
2017; a solid pipeline of new products launches expected in
2018
24
2018 Outlook
▪ Grow in revenues at mid to high single digit rates
▪ Maintain a sound profitability through strong focus on gross operating margin
improvements
▪ Further increase R&D investments & Distribution costs to improve our coverage
and boost leadership in key areas (North America, APAC, Manufacturing)
▪ Maintain a Cash Generation profile
▪ T&L: keep growing in main Geo Areas, capturing ecommerce & CEP
trends
▪ Retail: growth recovery in the Americas through new products and
expanding sales organization
▪ HC: keep on substantially growing, both in North America & EMEA
▪ Manufacturing: keep on steady growing in China and other main Geo
Areas, backed by strong demand for automation and further
investments in sales organization in key Geo areas

Technologies and Products
25

Product Innovation and Development
26
* Are considered new products the products announced in the last 24 months
▪ New product development process driven
by customer needs
▪ A portfolio of more than 1.200 patents
▪ 9.1% of Revenues invested in R&D on a
yearly basis, equal to over €55 million in
2017
▪ 13% of sales come from new products*
▪ 11 Research & Development Centers
▪ 470 R&D resources, more than 450
Engineers, engaged in new product
development and emerging technologies

Datalogic Technology Roadmap
Goal:
Identification – selection – protection -
development, of technologies needed to
maintain the business performance in
accordance with the company’s
objectives for the next 5 years
Methodology:
Define the technology stack, divided by:
• Core technologies: Not available on the
market
• Product driven technologies: Used
heavily in our products
• Solution driven technologies:
Contribute to the consumer’s
experience
27

Technology Stack
Core
technologies
Product
driven
technologies
Solution
driven
technologies
28

Market split by Technology
29
Datalogic can offer all the technologies available for products identification
2017 (base year 2016)
Data Capture Technology
includes only Hand Held Scanners, Industrial
Stationary Scanners and Point of Sale Check OutMarket Value: $4.3 Bn
Laser
Scanner
28%
Linear
Imager
16%
2D Imager
57%
OPTICAL
95%
RFID
5%

2017 New Products Introduction
30
HAND HELD
AUTOMATION
RFID
Q1
HAND HELD
MOBILE
FRS / T&L
AUTOMATION/LABS
POWERSCAN
9500 RT
IMPACT 11.10
RELEASE
MATRIX 300N
POLARIZED
DLR-TL001
DLR-BT001
DLR-DK001
Q3
RIDA BC6020
POWERSCAN™
9100
JOYA TOUCH A6 & A6 HC
MAGELLAN
3550HSi
DSE04x1
DS5100
11.11 IMPACT
SW RELEASE
HERBO
DE1011-SR
QW2400
RHINO II
MAGELLAN
3450VSi
MOBILE
AUTOMATION
LABS
Q2
MEMOR™ X3 HC
MATRIX 120
WA and POLARIZED
HALOGEN
DE2012-WA-DL
Q4
MOBILE
AUTOMATION
RFID
New trigger
handle for
DL-AXIST
LIGHTER
6.4
DL.CODE 1.5
DLR-PR001 UHF
LONG RANGE
PORTAL READER
SLS-B5
LASER
SENTINEL
SKORPIO X4
SG4
FIELDBUS

Financials
31

32
Best ever results in Datalogic history
Q4 RESULTS
€25.4
EBITDA
(+7%)
16.4%
EBITDA
MARGIN
(+1.1 p.p.)
REVENUES
€155.3
+0.4%
(+3.7% at constant FX)
€15.0
NET
INCOME
(+202%)
FY2017 RESULTS
€103.3
EBITDA
(+14.3%)
17.0%
EBITDA
MARGIN
(+1.3 p.p.)
REVENUES
€606.0
+5.1%
(+6.0% at constant FX)
€60.1
NET
INCOME
(+31%)
Net Cash position at €30.1
€ m

Improvements across the whole P&L
33
Revenues 606.0 576.5 5.1%
Gross Operating Margin 288.4 265.1 8.8%
%on Revenues 47.6% 46.0%
Operating expenses (202.7) (192.3) 5.4%
%on Revenues (33.5%) (33.4%)
EBITDA 103.3 90.4 14.3%
Ebitda margin 17% 15.7%
EBIT 82.9 70.2 18.0%
Ebit margin 13.7% 12.2%
EBT 75.5 66.9 12.8%
Taxes (15.4) (21.0) -27.0%
Net Income 60.1 45.8 31.0%
% on Revenues 9.9% 8%
Exchange Rate 1.1297 1.1069
FY2017 FY2016 Var%€ m
▪ Revenues up 5.1% to €606.0 m
(+6.0% at constant exchange rate)
▪ GOM showing steady improving
trend at 47.6% (around +160 bps
vs 2016)
▪ R&D on revenues from 8.7% to
9.1% (from 9% to 9,5% for
Datalogic Business)
▪ Timing effects & efficiencies on
distribution costs (+2.3% YoY)
▪ EBITDA margin at 17% mainly
thanks to improvement in the
GOM
▪ Unfavorable forex and higher
gross debt on financial costs
▪ Tax rate at ~ 20%
▪ Impressive growth of net income
+31% to €60.1 m

Group Revenues by country
34
REVENUES BY GEOGRAPHIC AREA
FY 2017 FY 2016€ m
EMEA 327.5 304.5 7.5%
North America 171.4 178.3 (3.8%)
Latin America 27.5 30.0 (8.5%)
Asia Pacific 79.6 63.6 25.1%
Total Revenues 606.0 576.5 5.1%
Var%
EMEA
54%
North
America
28%
Latin
America
5%
APAC
13%
▪ Strong growth in APAC driven by
China (+55%) in Manufacturing mainly
▪ Confirming leadership in EMEA led
by Retail (+11%)
▪ NA growth driven by T&L (+11%) and
Healthcare (+97%); strong
performance of Solution Net Systems.
Retail and Informatics negatively
offsetting performance
▪ LA heavily impacted by FX and 2016
large deals

Group Revenues & EBITDA by division
35
REVENUES BY DIVISION
FY2017 FY2016€ m
EBITDA BY DIVISION
Datalogic 100.2 93.1
Solution Net Systems 2.9 (1.0)
Informatics 0.1 (1.5)
Total Group 103.3 90.4
FY2017 FY2016
Var%
Datalogic 564.0 534.2 5.6%
Solution Net
Systems24.7 20.2 22.5%
Informatics 20.6 24.4 (15.5%)
Adjustments (3.3) (2.3) 42.2%
Total Revenues 606.0 576.5 5.1%Datalogic
93%
Solution Net
Systems
4%
Informatics
3%
▪ Datalogic driven by growth of Fixed
Retail Scanners, Identification and Hand
Held products.
Strong growth through Channel towards
SMEs (+14.2%)
▪ Solution Net Systems strong top line
growth (+22.5%) and sound turnaround
in profitability
▪ Informatics top line still on downward
trend but profitability turned positive
€ m

90.4
(11.5)
12.3
11.90.9
9.8 0.2
(12.2)
1.6 103.3
FY 2016 Price Volume Mix Service COGS FX Structure SNS/INF FY 2017
EBITDA: actual vs last year
36
Positive Items Negative Items
€ m
-2.3% on DL
Business 2017
revenues
15.7 % on
Group
Revenues
17.0 % on
Group
Revenues

37
Consolidated Balance Sheet
Dec 2016 Dec 2017 Dec 2016 Dec 2017
Total Fixed Assets 347.9Net Financial
Position(3.5) (30.1)371.7
Trade receivables 75.5 83.2
Net Equity 336.4 353.0
% on 12m rolling sales 13.1% 13.7%
Inventories 82.3 85.9
% on 12m rolling sales 14.3% 14.2%
Trade payables (104.6) (107.7)
% on 12m rolling sales -18.1% -17.8%
Trade Working
Capital 53.2 61.5
% on 12m rolling sales 9.2% 10.1%
Other
assets/liabilities(92.1) (86.5)
Net Invested Capital 332.9 322.9 Total Sources 332.9 322.9
€ m

3.5
103.3
(6.6)
(13.9)
(17.3)
(5.8)
(17.4)
(8.0)
(7.6)
30.1
Net Debt
Dec 16
EBITDA Ch TWC Capex Taxes Net Financial
Charges
Dividend
Paymemt
Soredi
Acquisition
Other Net Debt
Dec 17
Net Debt Analysis: Dec’16 – Dec’17
38
Of which:
Machinery, equipment and moulds (6.6)
Electronics machineris / Software (4.9)
Offices refurbishment (0.4)
Acc. Receivable (6.8)
Inventory (2.1)
Acc. Payable 2.3
-2.4% on
Revenues
€ m
Positive Items
Negative Items

39
IR CONTACTS
IR Manager
Vincenza Colucci
CDR Communication Srl
Tel. +39 335 6909547
IR Assistant
Daniela Giglioli
Tel. +39 051 3147109
Fax +39 051 3147205
E-mail [email protected]
Via Candini, 2
40012 Lippo di Calderara di Reno
Bologna – Italy
NEXT EVENTS
Contact
www.datalogic.com
DATALOGIC ON LINE
May 9th
, 2018
1Q results
May 23rd
, 2018
Shareholders’ meeting
August 9th
, 2018
6M results
November 13th
, 2018
9M results