database searching blast and fasta. database homology searching use algorithms to increase...
TRANSCRIPT

Database Searching
BLAST and FastA
Database Homology Searching
• Use algorithms to increase efficiency and provide a mathematical basis for searching which can be translated into statistical significance
• Assumes that sequence, structure and function are interrelated.
• BLAST (Basic Local Alignment Tool) and FastA (Fast Alignment)
• These are heuristic methods approximating Smith Waterman
What is a Heuristic Method?
• Many problems in Artificial Intelligence are optimization problems.
• An approximation (or heuristic) search method does not mean that the search algorithm will find a wrong solution.
• If a solution is found, that solution is guaranteed to be valid, but it may not be optimal.

BLAST
• The BLAST algorithm was written balancing speed and increased sensitivity for distant sequence relationships.
• Instead of relying on global alignments (commonly seen in multiple sequence alignment programs) BLAST emphasizes regions of local alignment to detect relationships among sequences which share only isolated regions of similarity.

BLAST
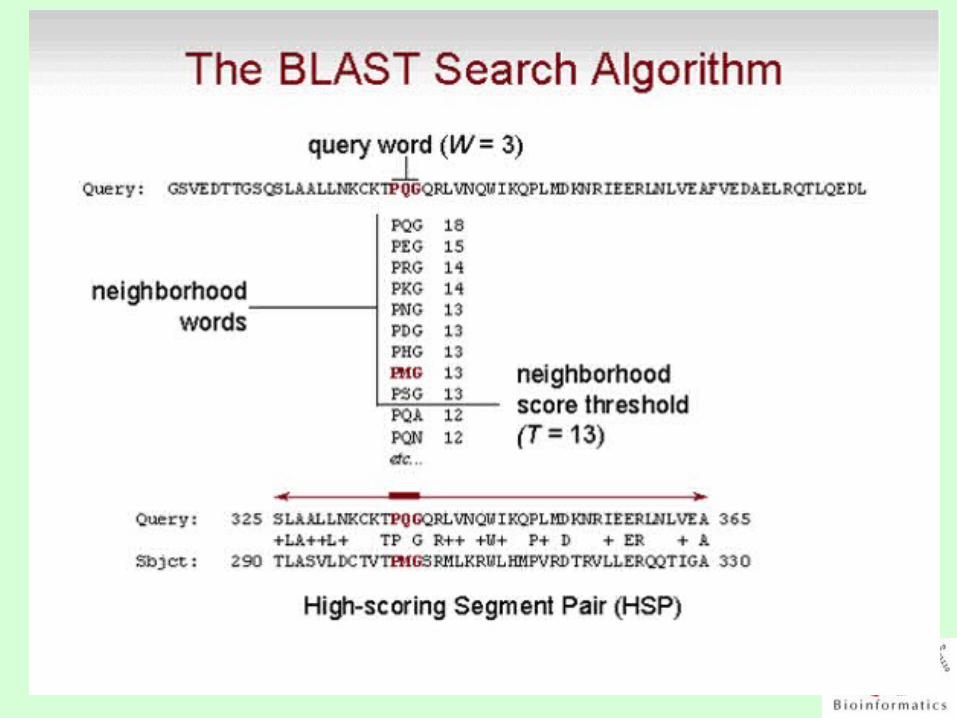
• Blast creates a list of all short sequences (words) that have a certain “threshold” score when compared with the query sequence.
• These are 16-256 nucleotides or 3 amino acids in a row.
• Then the database is searched for occurrences of these words.
• Find this in BLAST algorithm Parameters

BLAST
Speed is achieved by:– Pre-indexing the database before the
search– Parallel processing
• Uses a hash table that contains neighborhood words rather than just random words.

Neighborhood words
• The program declares a hit if the word taken from the query sequence has a score >= T when a scoring matrix is used.
• This allows the word size (W (this is similar to ktup value)) to be kept high (for speed) without sacrificing sensitivity.
• If T is increased by the user the number of background hits is reduced and the program will run faster

Comparison Matrices
In general, the BLOSUM series is thought to be superior to the PAM series for detecting evolutionarily distant sequences to the because they are derived from areas of conserved sequences.
It is important to vary the parameters when performing a sequence comparison. Similarity scores for truly related sequences are usually not sensitive to changes in scoring matrix and gap penalty.
Thus, if your “hits list” holds up after changing these parameters you can be more sure that you are detecting similar sequences.

High Scoring Pairs

BLAST
• Matching words are extended into ungapped local alignments between query sequence and the database sequence.
• Extensions are scored until the alignment score drops below a threshold.
• The maximal-scoring segment pairs (MSPs) are combined where possible into local alignments.

Statistical Significance of Sequence Comparisons
• Assess the statistical significance of a particular global alignment by generating many random sequence pairs of the appropriate length and composition, and calculating the optimal alignment score for each.

BLAST Statistics
• A local alignment without gaps consists simply of a pair of equal length segments, one from each of the two sequences being compared.
• A modification of the Smith-Waterman or Sellers algorithms finds segment pairs whose scores can not be improved by extension or trimming.
• These are called high-scoring segment pairs or HSPs.

Local Alignment Statistics
• Fortunately statistics for the scores of local alignments, unlike those of global alignments, are well understood.
• This is particularly true for local alignments lacking gaps, which we will consider first.
• Such alignments were precisely those sought by the original BLAST database search programs.

Two BLASTs
• WU-Blast and NCBI Blast.• Both have some versions in the public
domain, but there are private versions of WU Blast.
• TIGR, Berkeley Drosophila Genome and Stanford’s yeast genome use WU-Blast
• WU-Blast may be better for searching genomic sequences- different gap scoring and repeat policies.
Scoring Matrix• The most critical parameter in sequence
comparison is definitely the choice of a scoring matrix.
• Scoring matrices reflect the knowledge about the objects which constitute the sequences.
• The algorithm regard sequences merely as a list of symbols.
• The meaning of the symbols for the application and their properties with regard to mutual similarity is merely represented by the content of the scoring matrices.

A Good Scoring Matrix Site
• http://www.techfak.uni-bielefeld.de/bcd/Curric/PrwAli/nodeD.html#wm2

Log-Odds-Matrix
• Frequently scores are calculated as log-odds-ratios which are based on the comparison of frequencies in sequences having the property to be studied and random frequencies.

BLOSUM 62 is the default matrix in BLAST 2.0.
• You can select a different matrix for your Blast search.
• Though it is tailored for comparisons of moderately distant proteins, it performs well in detecting closer relationships.
• A search for distant relatives may be more sensitive with a different matrix.

BLOSUM 62
• The BLOSUM 62 matrix shown here is a 20 x 20 matrix of which a section is shown here in which every possible identity and substitution is assigned a score based on the observed frequencies of such occurrences in alignments of related proteins.
• Identities are assigned the most positive scores.
• Frequently observed substitutions also receive positive scores and seldom observed substitutions are given negative scores.


BLAST
• BLAST is more than a tool to view sequences aligned with each other or to calculate percent homology, but a program to locate regions of sequence similarity with a view to comparing structure and function.
BLASTP
• Compares an amino acid query sequence against a protein sequence database.

BLASTN
• Compares a nucleotide query sequence against a nucleotide sequence database.

BLASTX
• Compares a nucleotide query sequence translated in all reading frames against a protein sequence database.
• You could use this option to find potential translation products of an unknown nucleotide sequence.
TBLASTX
• Compares the six-frame translations of a nucleotide query sequence against the six-frame translations of a nucleotide sequence database.
• The tblastx program cannot be used with the nr database on the BLAST Web page because it is computationally intensive.
TBLASTN
• Compares a protein query sequence against a nucleotide sequence database dynamically translated in all reading frames.
• We can try this search with this sequence: Hadrurin GILDTIKSIASKVWNSKTVQDLKRKGINWVANKLGVSPQAA

PHI-BLAST
• Pattern Hit Initiated Blast• PHI-Blast uses protein motifs to
increase the chance of finding biologically significant matches.

PSI-BLAST
• Position Specific Iterative Blast• PSI-Blast uses an iterative
alignment procedure to develop position specific scoring matrices which increases its capability to detect weak pattern matches.
FastA Format
• A sequence in FASTA format begins with a single-line description, followed by lines of sequence data.
• The description line is distinguished from the sequence data by a greater-than (">") symbol in the first column.
• It is recommended that all lines of text be shorter than 80 characters in length.

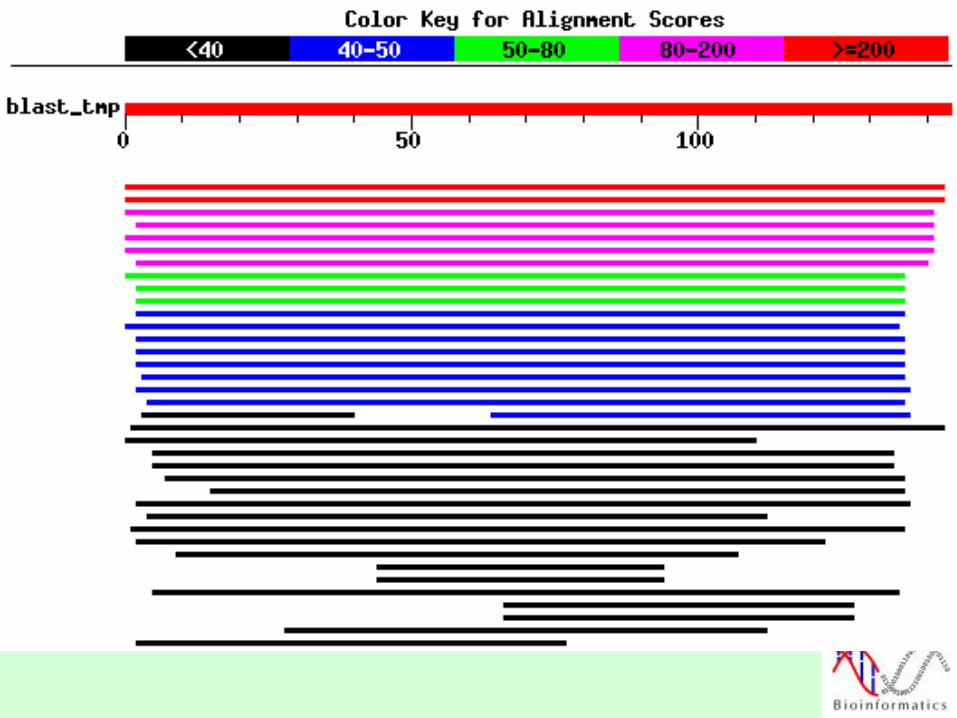
Evaluating Blast Results
• A Blast search can produce dozens or hundreds of candidate alignments.
• Out of these alignments, which are really specific?
• Raw Scores, Bit Scores and E-values are used as statistics.

Raw Scores• Raw scores are the sum of scores of the MSPs
that make up the alignment.• Because of differences between scoring
matrices, they are not always directly comparable.
• The raw score S for an alignment is calculated by summing the scores for each aligned position and the scores for gaps.
• In this figure, a DNA alignment is shown. In amino acid alignments, the score for an identity or a substitution is given by the specified substitution matrix


Bit Scores
• Bit scores are raw scores converted from the log base of the scoring matrix that creates the alignment to log base 2.
• This rescaling allows scores to be compared between the alignments.

E-values
• E-values (Expect values) provide information about the likelihood that a given sequence alignment is significant.
• The smaller the E-value, the less likely the alignment was by chance.
• At some point, you are just generating random junky data- unless you have other information like a structural comparison.

FASTA
• Another method for local sequence alignment.
• Maintained by Dr. William Pearson at the University of Virginia.
• http://www.infobiogen.fr/doc/Fasta/docfasta.html

FASTA (Pearson and Lipman 1988)
• This is a combination of word search and Smith-Waterman algorithm
• The query sequence is divided into small words of certain size.
• The initial comparison of the query sequence to the database is performed using these “words”.
• If these “words” are located on the same diagonal in an array the region surrounding the diagonals are analyzed further.
• Search time is only proportional to size of database not (database*query sequence)

FASTA Algorithm
• FASTA ktups are shorter than BLAST words.
• 1-2 for proteins and 4-6 for nucleic acids.
• Lower ktups give a more slower, more sensitive search.
• Higher ktups give a faster search with fewer false positives.

The FASTA program is the uses Hash tables. These tables speed the process of word search.
Query Sequence = TCTCTC 123456 (position number)Database Sequence = TTCTCTC 1234567 (position number)You choose to use word size = 4 for yourtable (total number of words in your table is44 = 256)
Sequence (totalof 256)
Position w/in query Position w/in DB Offset (Q minus DB)
TCTC 1,3 2,4 -1 or -3 or 1CTCT 2 3 -1TTCT 1
?

FASTA Steps
1
Local regions ofidentity are found
Different offset values
Identical offsetvalues in acontiguous sequence
2
Rescore the local regions using PAM or Blos. matrix
Diagonals are extended
3
Eliminate short diagonalsbelow a cutoff score
4
Create a gapped alignment ina narrow segment and thenperform S-W alignment

Summary of FASTA steps1. Analyzes database for identical matches that are
contiguous (between 5 and 10 amino acids in length (same offset values)).
2. Longest diagonals are scored again using the PAM matrix (or other matrix). The best scores are saved as “init1” scores.
3. Short diagonals are removed.4. Long diagonals that are neighbors are joined. The score
for this joined region is “initn”. This score may be lower due to a penalty for a gap.
5. A S-W dynamic programming alignment is performed around the joined sequences to give an “opt” score.
Thus, the time-consuming S-W step is performed only on top scoring sequences

The ktup value•The ktup (for k-tuples) value stands for the length of the word used to search for identity.•For proteins a ktup value of 3 would give a hash table of 203
elements (8000 entries).•The higher the ktup value the less likely you will get a match unless it is identical (remember the dot plots).•The lower the ktup value the more background you will have•The higher the ktup value the faster analysis (fewer diagonals).
The following rules typically apply when using FASTA:

Gap Penalties
• If too high a gap penalty is used relative to the range of scores in the substitution matrix, then gaps will never appear in the alignment.
• Conversely, if the gap penalty is too low compared to the matrix scores, then gaps will appear everywhere in the alignment in order to align as many of the same characters as possible.

ktup analysis____________________ 1 proteins- distantly related 2 proteins- somewhat related (default) 3 DNA-default

FASTA Versions
FASTA-nucleotide or protein sequence searching
FASTx/-compares a translated DNA query sequenceFASTy to a protein sequence database (forward or backward translation of the query)
tFASTx/-compares protein query sequence to tFASTy DNA sequence database that has been translated into three forward and three reverse reading frames

FASTA Statistical Significance
A way of measuring the significance of a score considers the mean of the random score distribution.
The difference between the similarity score for your single alignment and the mean of the random score distribution is normalized by the standard deviation of that random score distribution.
This is the Z-score.
Higher Z-scores are better because the further the real score is from this mean (in standard deviation units) the more significant it is.

FASTA Statistical Significance
Z score for a single alignment=
(similarity score - mean score from database)standard deviation from database
Stand. Dev. = scores2 - ( scores)2
Total#ofSequencesTotal#ofSequences
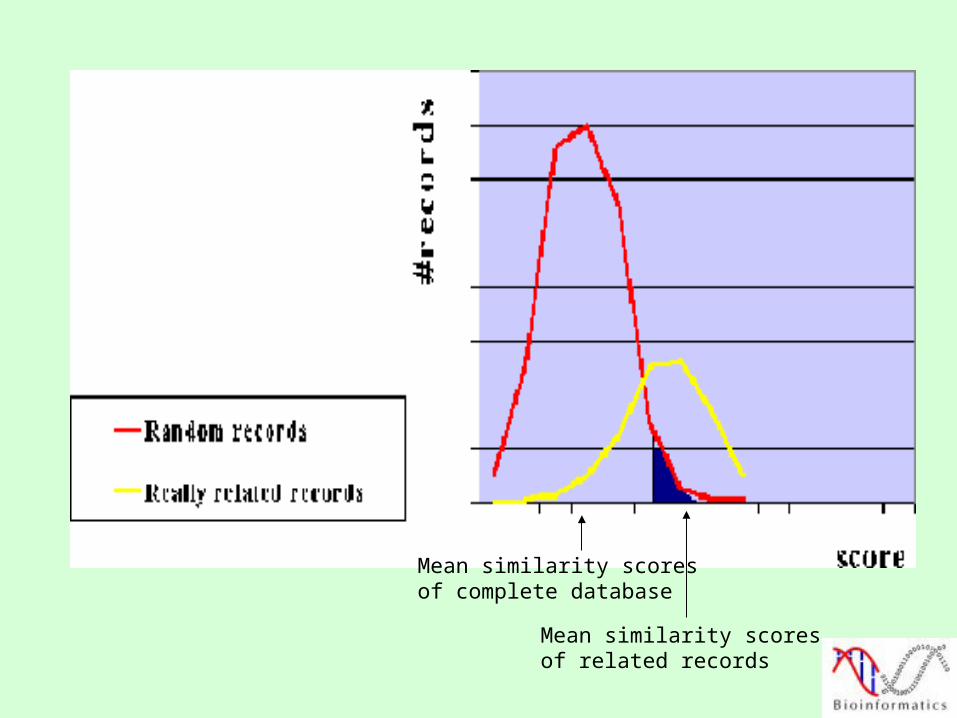
Mean similarity scoresof complete database
Mean similarity scoresof related records

FASTA Statistics (cont.) Using the distribution of the z-scores in the database, the FastA program can estimate the number of sequences that would be expected to produce, purely by chance, a z-score greater than or equal to the z-score obtained in the search.
This is reported as the E() or expect value.
This value is the number of sequences you would expect to find with this score by searching a database of random sequences.
Thus, when z the E()

Evaluating the Results of FASTA
BestSCORES Init1: 2847 Initn: 2847 Opt: 2847z-score: 2609.2 E(): 1.4e-138Smith-Waterman score: 2847; 100.0% identity in 413 overlap
GoodSCORES Init1: 719 Initn: 748 Opt: 793z-score: 734.0 E(): 3.8e-34Smith-Waterman score: 796; 41.3% identity in 378 overlap
MediocreSCORES Init1: 249 Initn: 304 Opt: 260z-score: 243.2 E(): 8.3e-07Smith-Waterman score: 270; 35.0% identity in 183 overlap
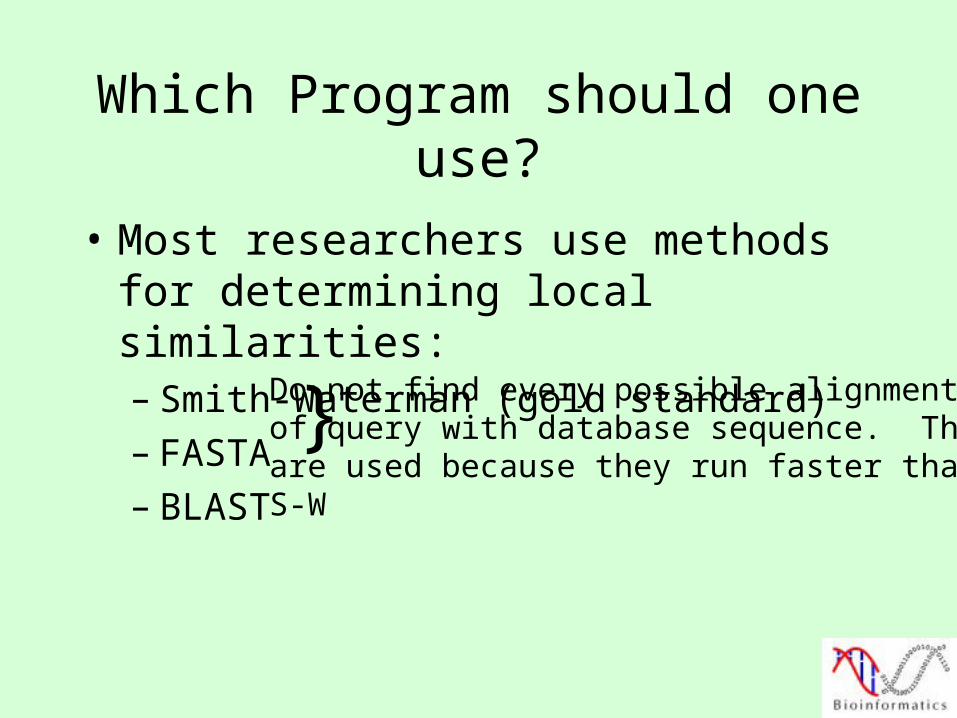
Which Program should one use?
• Most researchers use methods for determining local similarities:– Smith-Waterman (gold standard)– FASTA– BLAST
}Do not find every possible alignmentof query with database sequence. Theseare used because they run faster than S-W

When to use the correct program
Problem Program Explanation
IdentifyUnknownProtein
BLASTP;FASTA3
General protein comparison. Use ktup=2 for speed; ktup=1 for sensitive search.
Smith-Waterman Slower than FASTA3 and BLAST but provides maximum sensitivity
TFASTX3;TFASTY3;TBLASTN
Use if homolog cannot be found in protein databases; Approx. 33% slower
Psi-BLAST Finds distantly related sequences. It replaces the query sequence with a position-specific score matrix after an initial BLASTP search. Then it uses this matrix to find distantly related sequences

When to use the correct program (cont. 1)
Problem Program Explanation
Identify new orthologs in closely related species
TFASTX3;TFASTY3TBLASTN:TBLASTX
Use PAM matrix <=20 or BLOSUM90 to avoid detecting distant relationships. Search EST sequences w/in the same species.
IdentifyESTSequence
FASTX3;FASTY3;BLASTX;TBLASTX
Always attempt to translate your sequence into protein prior to searching.
IdentifyDNASequence
FASTA;BLASTN Nucleotide sequence comparision
TBLASTX-nucleotide query-translated nucleotide DB
BLASTX-nucleotide query-protein DB

Choosing the database
• Remember that the E value increases linearly with database size.
• When searching for distant relationships always use the smallest database likely to contain the homolog of interest.
• Thought problem: If the E-value one obtains for a search is 12 in Swiss-PROT and the E-value one obtains for same search is 74 in PIR how large is PIR compared to Swiss-PROT?
74/12 = ~6

Filtering Repetitive Sequences
• Over 50% of genomic DNA is repetitive• This is due to:
– retrotransposons– ALU region– microsatellites– centromeric sequences, telomeric sequences– 5’ Untranslated Region of ESTs
Example of ESTs with simple low complexity regions:
T27311GGGTGCAGGAATTCGGCACGAGTCTCTCTCTCTCTCTCTCTCTCTCTCTCTCTCTCTCTCTCTCTCTCTCTCTCTCTCTCTCTCTCTCTCTCTCTC

Filtering Repetitive Sequences (cont. 1)
Programs like BLAST have the option of filtering out low complex regions.
• Repetitive sequences increase the chance of a match during a database search