database management system projects - jerry …jerrypost.com/dbms/projects4e.pdfproject descriptions...
TRANSCRIPT

Database Management Systems Projects
Gerald V. Post
Copyright © 2007 Gerald Post

�
Introduction to Database Projects, 2RMN Auto Sales (2005), 3
Purchases, 3Sales, 3Warranties and Payments, 4Exercises, 5
Monster Video (2005), 7Initial Appraisal, 7Proposal Options, 8Installation, 8Exercises, 11
Big Chemical, Inc. (2005), 12Employee Information, 12Sensors, 12Employee Access, 13Exercises, 15
Big Teeth Reality TV (2005), 16Applications, 16Episodes and Events, 17Exercises, 18
Cerulean Bee (2005), 20Artwork, 20Orders, 22Exercises, 23
Orange Blossom Nursery (2007), 24Plant Orders, 24Payments and Billing, 26Delivery, 26Purchases, 27Exercises, 28
Round Avon Theater Troupe (2007), 29Shows, 30Bills and Salaries, 31Traveling Shows, 32Sales Analysis, 32Exercises, 33
Joe’s Chops (2007), 34Choosing Options, 34Web Site Communications, 35Itemized Billing, 36Exercises, 37
Chapter Outline
Projects

�Project Descriptions
Introduction to Database ProjectsTo learn how to build business applications, you need to work on a database proj-ect. The projects described in this appendix are simpler than real-life projects but complex enough to illustrate common problems that you will encounter.
The projects are designed to be built throughout the term. Students should dem-onstrate a completed database application at the end. Preliminary assignments are given for each project to get you started. However, the most important aspect of the case is to build the final, complete application. To provide additional feedback, the instructor should also evaluate the projects at two intermediate stages: (1) the list of normalized tables and (2) some initial forms and reports.
The most important advice to students is that you must begin work on the proj-ect as soon as possible. Do not put the project off until the end of the term. To have any chance at completing the project, most students will have to put in 20 to 40 hours of time. The project will reinforce the concepts discussed in the chap-ters—particularly data normalization and application design. If you work on the project throughout the semester, you will gain a better understanding of the topics, and you will finish most of the project before the end-of-term crunch.
Class projects are slightly different from real-world applications, but have many features in common. One of the most challenging aspects is that any project con-tains a level of uncertainty and ambiguity. When you start a real-life project, you never know exactly what the project is going to involve. As you talk with users, you encounter contradictions, uncertainty, and confusion over terms and goals. In real-life, you resolve these problems through experience and discussions with managers. With class projects, you do not have direct access to the managers and users. The instructor can answer some questions, but you will need to make your own decisions and interpretations.
When you first read the case, try to focus on the big picture. Identify the envi-ronment, goals, and objectives of the proposed system. Take notes on the com-pany and jot down additional questions. Research the industry and similar firms to help identify terms, goals, and potential problems. When you begin to analyze the individual forms and reports, identify the overall purpose of each form. You should be able to describe the purpose of each form in one sentence. For any of the cases, you should make this list and keep it handy so you always remember the overall purpose of the application.
Remember that you will probably have to rework the normalization several times before the project is complete. Remember that every time you change the primary keys, you have to delete relationships. Try to develop a good normalized list before you begin creating forms and reports, but leave yourself enough time to go back and change the tables if you find problems.
In many cases it pays to start small and add tables and features slowly. Start with an initial set of tables and keys that you are certain are correct. Then begin building forms. Add columns and tables as you need them. If your initial tables are correct, you should be able to add new columns and tables without altering the existing design. For the final project, it is usually better to complete half a project where everything works, instead of a large mess where nothing works.
One final word of advice: Back up your work. Always keep a backup copy of your project on a different disk. Two or three copies are even better. Disks are cheap.
�Project Descriptions
RMN Auto Sales (2005)
RMN, a local used-car dealer needs a database to track the cars purchased and sold. Most cars are bought at auction, but a few are picked up from other dealers. The company pays cash at the auctions and brings the cars back to clean them up. When the cars are sold, the company generally finances the sale. Customers rarely have good credit, so the company prices the cars so that buyers cover the original purchase cost of the car with a down payment. The rest of the purchase price is financed, but even if the customer stops paying on the loan, the company has not lost any money. Consequently, a key aspect of the company’s profitability is find-ing cars at low prices.
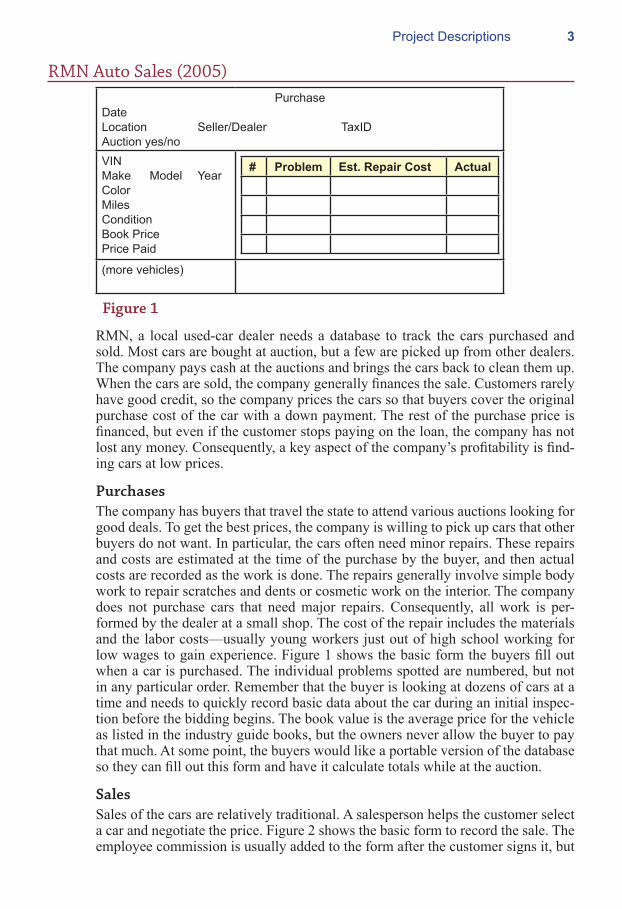
PurchasesThe company has buyers that travel the state to attend various auctions looking for good deals. To get the best prices, the company is willing to pick up cars that other buyers do not want. In particular, the cars often need minor repairs. These repairs and costs are estimated at the time of the purchase by the buyer, and then actual costs are recorded as the work is done. The repairs generally involve simple body work to repair scratches and dents or cosmetic work on the interior. The company does not purchase cars that need major repairs. Consequently, all work is per-formed by the dealer at a small shop. The cost of the repair includes the materials and the labor costs—usually young workers just out of high school working for low wages to gain experience. Figure 1 shows the basic form the buyers fill out when a car is purchased. The individual problems spotted are numbered, but not in any particular order. Remember that the buyer is looking at dozens of cars at a time and needs to quickly record basic data about the car during an initial inspec-tion before the bidding begins. The book value is the average price for the vehicle as listed in the industry guide books, but the owners never allow the buyer to pay that much. At some point, the buyers would like a portable version of the database so they can fill out this form and have it calculate totals while at the auction.
SalesSales of the cars are relatively traditional. A salesperson helps the customer select a car and negotiate the price. Figure 2 shows the basic form to record the sale. The employee commission is usually added to the form after the customer signs it, but
PurchaseDateLocation Seller/Dealer TaxIDAuction yes/noVIN Make Model YearColor Miles Condition Book PricePrice Paid
# Problem Est. Repair Cost Actual
(more vehicles)
Figure 1

�Project Descriptions
sometimes employees list a lower-than-normal commission to help sell the car. Because RMN finances part of the price, customers are asked to list their current and last few employers—in case the company needs to repossess the vehicle.
Warranties and PaymentsRMN also offers a variety of warranties as a major selling strategy. The warranties help to sell cars because people believe a warranty lowers the risk. Yet, because the cars are relatively sound to begin with, few warranty claims arise, so the company makes a solid profit on the warranties. Consequently, salespeople are encouraged to sell the warranties and receive a relatively high 25 percent commission on them. As shown in Figure 3, separate warranties are offered for various components. For instance, an exterior warranty covers the paint, while a drive-train warranty covers various engine and transmission elements. Note that each warranty only covers the listed items. Customers are given several options, including the length
SaleDateTotal DueDown PaymentFinanced Amount
EmployeeLast Name, First NameCommission
CustomerPhoneLast Name, First NameAddressCity, State ZIP
Employment
Employer Title Super. Phone Address Start
VINMilesConditionList PriceSale PriceStyle (sedan, SUV, …) Interior Color
Figure 2
VINCustomer Co-signerWarranty Sale DateTotal CostMonthly Cost
SalespersonPhone
Warranty1 StartDate Length Cost Deductible
Items Covered
Warranty2 StartDate Length Cost Deductible
Items Covered
Figure 3

�Project Descriptions
of the warranty and the level of the deductible. Of course, longer warranties and lower deductibles cost more. These values are specified in the warranty policies, but the salesperson needs to enter them on this form so everyone knows exactly which warranty was purchased. The customer also has the option of paying the warranty fees upfront as a lump sum, but most decide to finance them over time in the form of monthly payments. These values are entered by the salesperson using a chart—essentially the company charges a one percent per month interest rate for financing the warranty costs.
To provide documentation for situations when complaints arise, or when RMN has to repossess a car, the company records all of the payments made by the cus-tomer. Figure 4 shows the basic form. To provide faster lookups (on the paper forms), the clerk also updates the number of late payments and the average num-ber of days late whenever a payment is late. The company uses date of birth, gen-der, and taxpayer number to obtain credit reports on the customer. Really bad cus-tomers are also reported to the credit bureaus.
On average, the company sells 5-10 cars a week, and generally tries to keep no more than 50 cars on the lot at one time. However, if good deals pop up at auc-tions, the buyers are encouraged to purchase them, but then they hold off on buy-ing the marginal cars.
Exercises1. Create the feasibility study (initial proposal).2. Create a list of all of the forms and reports that the company might use.3. Create a normalized list of tables for each form and report.4. Create an integrated list of normalized tables for the entire application. Draw
the corresponding class diagram.5. Create the basic tables in a DBMS along with all necessary relationships and
integrity constraints. Enter sample data into the tables to test your design. 6. Evaluate the normalized tables and estimate the size of the database—both
current size and estimated size in 3 years.7. List the initial security conditions for the data tables. Create a list of user
groups and identify their basic access needs.
Payment HistoryCustomer Gender Date of Birth Taxpayer IDNumber of late paymentsAverage number of days late
Pmt Date Due Paid Date Amount Bank Acct
Figure 4

�Project Descriptions
8. Design the overall structure of the application. Outline the overall structure and the primary forms. Select a design scheme, including layouts, effects, and colors.
9. Build three initial input forms.10. Build three initial reports.11. Improve the forms and reports to make them easier to use.12. Test your forms and reports with sample users.13. Build additional forms and reports. Improve all of them. Test all of them.14. Connect all of the forms and reports into an application. Add help files. Test
all the links. Test the forms and reports. Check for consistency.15. Add security, backup and recovery, and other management features to the
application.16. Move the data tables to a centralized server, leaving the application to run on
a client. Build the necessary links and retest the application.17. Move the entire application to a Web server. Build the forms so that they run
on a Web browser.18. Create an OLAP evaluation query and graphs. Build in a way to create the
links so new annual data can be generated automatically. Link the data so that the spreadsheet is updated automatically.

�Project Descriptions
Monster Video (2005)
Monster Video is a company that specializes in designing and installing home theater systems. Most of the time, these are complex systems costing thousands of dollars. Some vendors (notably Sony) are offering customized equipment that can be tailored for the specific environment—for the truly discerning consumer. With multiple speakers, large video screens, and high-power amplifiers, these sys-tems require careful design to match the room characteristics. It often takes sev-eral days to install the systems—mostly because of upgrades to the electrical and lighting systems. Installing cable for the speakers also takes time—particularly in older houses. The company needs a database to track the customers, estimates, sales, and installations.
Initial AppraisalA key element in the success of the firm is the initial evaluation of the location by a trained salesperson. Figure 1 shows the basic elements collected during this ap-praisal. The salesperson records the dimensions of the room, the most likely loca-tion of the seating arrangements, and creates a small drawing to show the overall layout of the room. Later, engineers will select the best locations for the speakers. Usually, the customer already has an opinion about where to put the video screen. The salesperson records existing lighting, and adds notes about possible improve-ments. The number of windows plays an important role—in terms of positioning the screen and in the need for supplementary lighting. The floor and ceiling af-fect the acoustics, as well as limit the potential locations for speakers. Additional acoustic comments (such as “too much echo”) are given to the engineers. Some-times, the engineers need to add acoustical tiles or even acoustical blocks to re-duce or change the reflected sound.
The salesperson also identifies possible locations for speakers—modern sys-tems require six speakers at a minimum: subwoofer, center channel, front-left, front-right, rear-left, and rear-right. The placement of the front and rear channel speakers can sometimes be difficult—particularly in modern-style houses with non-uniform walls and high ceilings. Ultimately, an engineer will narrow down
AppraisalCustomer
Location AddressCity, State ZIP CodeRoomDimensionsDrawingPrimary seating distance
LightingWindowsFloorCeiling heightAcoustic comments
Item Location Distance Type Max Size Cable Run Comments
Figure 1
�Project Descriptions
the final location, but due to the training, the salespeople are usually close. The distance from the speakers to the main seating position are critical, as is the maxi-mum size allowed. For example, some people object to having large speakers at the front of the room, and in other cases, the walls may not be wide enough to hold large hidden speakers. Additional comments are used to warn the engineer about potential problems.
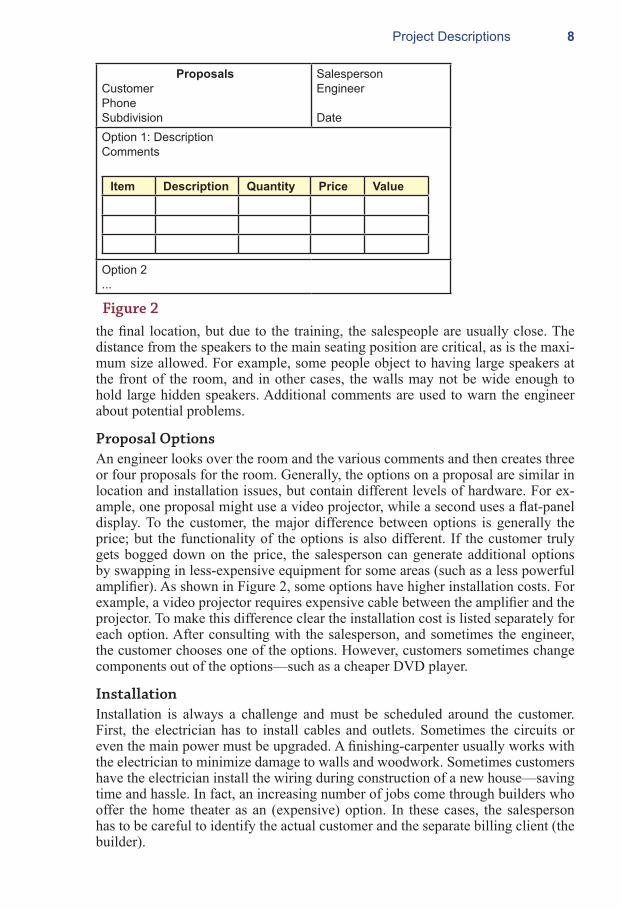
Proposal OptionsAn engineer looks over the room and the various comments and then creates three or four proposals for the room. Generally, the options on a proposal are similar in location and installation issues, but contain different levels of hardware. For ex-ample, one proposal might use a video projector, while a second uses a flat-panel display. To the customer, the major difference between options is generally the price; but the functionality of the options is also different. If the customer truly gets bogged down on the price, the salesperson can generate additional options by swapping in less-expensive equipment for some areas (such as a less powerful amplifier). As shown in Figure 2, some options have higher installation costs. For example, a video projector requires expensive cable between the amplifier and the projector. To make this difference clear the installation cost is listed separately for each option. After consulting with the salesperson, and sometimes the engineer, the customer chooses one of the options. However, customers sometimes change components out of the options—such as a cheaper DVD player.
InstallationInstallation is always a challenge and must be scheduled around the customer. First, the electrician has to install cables and outlets. Sometimes the circuits or even the main power must be upgraded. A finishing-carpenter usually works with the electrician to minimize damage to walls and woodwork. Sometimes customers have the electrician install the wiring during construction of a new house—saving time and hassle. In fact, an increasing number of jobs come through builders who offer the home theater as an (expensive) option. In these cases, the salesperson has to be careful to identify the actual customer and the separate billing client (the builder).
ProposalsCustomerPhoneSubdivision
SalespersonEngineer
DateOption 1: DescriptionComments
Item Description Quantity Price Value
Option 2...
Figure 2

�Project Descriptions
Figure 3 shows the basic worksheet filled out by the installers. Many of the installers work for Monster Video, but when the company is busy, it hires external contractors—particularly electricians. In these cases, the electricians staple their business cards to the sheet to ensure the checks get sent to the correct address.
The main worksheet itemizes the audio cables, in terms of the type of cable, the length, and which speaker it connects. Additional electrical work includes power and cables needed for the video (particularly for projectors), the amplifier, lights, and any additional circuit, main line, or breaker work needed.
Speakers are also listed on the installation sheet because they are often installed at the same time as the cables. For large-scale systems, the speakers can be ex-pensive, so each one is listed separately. Sometimes the installation is tricky and requires additional finish work to hide the speakers. In all cases, Monster Video tracks the name of the actual installer in case there are problems, and to identify the good contractors for use on later jobs.
The amplifiers, DVD players, tuners, satellite dishes, and video screens can all be expensive in these large systems. Also, they often need additional components, such as cables and signal boosters. These items are installed and fine-tuned by technicians working for Monster Video. One employee is always in charge of this final installation and tuning to minimize problems. Figure 4 shows the selection of the final components and their total costs. Although it is not shown here, custom-ers are given a final bill that summarizes all of the individual subtotals. Monster
InstallationCustomerLocation Directions
RoomNumber of seats
Date StartDate FinishCleanupTotal MaterialTotal LaborTotal Costs
Cables
Cable Length Type Cost Installer Labor Total
Electrical
Description Materials Time Installer Labor TotalVideoAmplifierCircuitLights
Speakers
Speaker Location Item Cost Installer Labor Total
Figure 3

�0Project Descriptions
Video does not finance the purchases, but it does accept credit cards. It also has contacts with various finance agencies for people who want to borrow the money. In most cases, Monster Video asks for a 30 percent deposit before installation starts. But, then it is willing to wait a month after the final installation to collect the total payment. This feature is appealing to some customers in case they have problems in the first few days.
As shown in Figure 5, Monster Video also offers extended warranties or service contracts on most of the equipment. For example, bulbs for video projects gener-ally last only a year, so customers like to buy a contract where a technician comes out once a year and replaces the bulb and cleans the projector. The form is also useful in reminding the customer and the company when each warranty expires and when the overall system is no longer under any warranty. Generally, the sales-person writes down the serial numbers and other information needed to obtain warranty service from the manufacturer. If anything does go wrong, the customer simply calls the salesperson who looks up the appropriate numbers and obtains a replacement part from the vendor. This high level of service has made Monster Video popular among the wealthier clients and has led to many referrals.
Audio Video ComponentsCustomer
Billing AddressCity, State ZIPCode
Date InstalledEmployee Cell Phone
Item Description Category Size Sale Price Quantity Subtotal
SubtotalTaxTotalDate Due
Figure 4
WarrantiesCustomerLocation
Start Date
EmployeeTitle
Item Mfg Warranty Add. Warranty Coverage Cost
Total Date all warranties end
Figure 5

��Project Descriptions
Currently, the company has been in business for a little over three years, and has installed almost 500 systems. Although the firm has 10 full-time employees, the margins on the equipment and the service charges have enabled the firm to be profitable for the last two years. The owners are hoping to double the business in the next couple of years. Based on the number of appraisals under way, this level of sales might be possible. Depending on the economy, salespeople often generate 5-10 appraisals before a sale is made.
Exercises1. Create the feasibility study (initial proposal).2. Create a list of all of the forms and reports that the company might use.3. Create a normalized list of tables for each form and report.4. Create an integrated list of normalized tables for the entire application. Draw
the corresponding class diagram.5. Create the basic tables in a DBMS along with all necessary relationships and
integrity constraints. Enter sample data into the tables to test your design. 6. Evaluate the normalized tables and estimate the size of the database—both
current size and estimated size in 3 years.7. List the initial security conditions for the data tables. Create a list of user
groups and identify their basic access needs.8. Design the overall structure of the application. Outline the overall structure
and the primary forms. Select a design scheme, including layouts, effects, and colors.
9. Build three initial input forms.10. Build three initial reports.11. Improve the forms and reports to make them easier to use.12. Test your forms and reports with sample users.13. Build additional forms and reports. Improve all of them. Test all of them.14. Connect all of the forms and reports into an application. Add help files. Test
all the links. Test the forms and reports. Check for consistency.15. Add security, backup and recovery, and other management features to the
application.16. Move the data tables to a centralized server, leaving the application to run on
a client. Build the necessary links and retest the application.17. Move the entire application to a Web server. Build the forms so that they run
on a Web browser.18. Create an OLAP evaluation query and graphs. Build in a way to create the
links so new annual data can be generated automatically. Link the data so that the spreadsheet is updated automatically.
��Project Descriptions
Big Chemical, Inc. (2005) Big Chemical, Inc is a large company specializing in custom chemistry research and production. Its researchers often work on highly-sensitive projects for vari-ous government agencies. Even the work it does for other companies tends to be secretive because client firms do not want others learning about their new product ideas. Consequently, the company is extremely sensitive about security issues. Al-though they are cautious about hiring and use background checks, they still want to keep closer track of their employees. They are in the process of installing sen-sors on every door and gate in building on the main campus. Employees will be issued badges that are automatically read at each point. The system will be able to track each person crossing through a door. But, the company also wants the ability to check data for the last week or month, so it needs a database to hold the data and produce reports on employee activity.
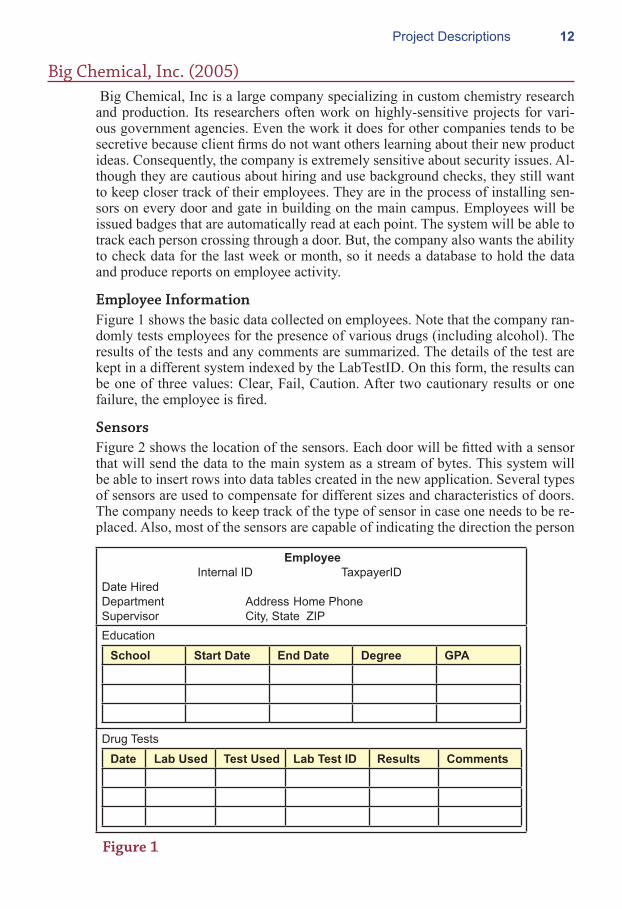
Employee InformationFigure 1 shows the basic data collected on employees. Note that the company ran-domly tests employees for the presence of various drugs (including alcohol). The results of the tests and any comments are summarized. The details of the test are kept in a different system indexed by the LabTestID. On this form, the results can be one of three values: Clear, Fail, Caution. After two cautionary results or one failure, the employee is fired.
SensorsFigure 2 shows the location of the sensors. Each door will be fitted with a sensor that will send the data to the main system as a stream of bytes. This system will be able to insert rows into data tables created in the new application. Several types of sensors are used to compensate for different sizes and characteristics of doors. The company needs to keep track of the type of sensor in case one needs to be re-placed. Also, most of the sensors are capable of indicating the direction the person
Employee Internal ID TaxpayerIDDate HiredDepartment Address Home PhoneSupervisor City, State ZIPEducation
School Start Date End Date Degree GPA
Drug Tests
Date Lab Used Test Used Lab Test ID Results Comments
Figure 1

��Project Descriptions
traveled through the door—which is labeled “in” or “out” by the installer. Ulti-mately, all of the sensors will be displayed on an electronic map of the building.
Figure 3 is a basic sensor repair log. Although the sensors are fairly reliable, the company needs to track any downtime. If a sensor is not working, some queries will give misleading results. For example, it might appear that a person never leaves a room if the room has two doors and one of the sensors is broken. While this log does not completely solve the problem, at least it will make it possible for users to realize that a problem might exist.
Employee AccessAs shown in Figure 4, employees have to be graded access to specific buildings and rooms. Data from this from is transferred to the entry control system for the building. Some rooms are not locked, but still have sensors. Other rooms are locked, and the sensors open the door only for employees who have been granted access. Access is granted by project directors who have control over certain rooms and the employees who report to them. Directors are responsible for keeping the lists up to date. To provide stronger security, directors are required to enter a start-ing and ending date for the access right. Beyond the ending date, employees will be denied access. In general, employees are also restricted to specific times. For example, an employee could be allowed into a research lab during normal work-ing hours, and then locked out at night. The main gate sensor is similar to the door sensors, but it is monitor differently. Some employees are required to be off the premises after a certain time of day.
Figure 5 would never be printed in real life, because there would be too much data. It represents the sensor activation data collected by every sensor in the com-pany. The sensors record the date and time as well as the person going through the door. The direction of travel is also noted. The sensors are relatively accurate and can even handle two people entering a door at approximately the same time. If one person enters a room and immediately turns around, it would be recorded
Sensor ListSensorID Building Floor Room Door Sensor Type Date Installed
Figure 2
Sensor Repair LogSensorID Date Down Date Restored Technician Cause Repair
Figure 3

��Project Descriptions
as an entrance followed by an exit—adding two rows of data. With almost 20,000 employees on the main campus, a dozen buildings with several floors of offices and labs, the sensors collect a large amount of data every day.
In general, security personnel want the ability to track the movements of em-ployees throughout the day. In most cases, the report shown in Figure 6 is dis-played only when security personnel become suspicious of an employee. The re-port is slightly tricky to create when rooms have several doors. Also, remember that sometimes sensors fail, so the system might not record a person entering or leaving a room. Ultimately, managers would like to see a graphical display of this data—based on an electronic map of the campus. But, for now, they will be happy with this report that shows all of the activities of a suspicious employee.
Employee Access RightsEmployeeSecurity Clearance LevelTitle BadgeID
Main Gate TimesEarliest EntryLatest Departure
Building1
Floor Room Start Time End Time Director Start Date End Date
Building2
Floor Room Start Time End Time Director Start Date End Date
Figure 4
Sensor ActivationSensor Date Time BadgeID Direction
Figure 5
Tracking LogEmployee Start - EndOffice Phone Cell Phone
Time-InLocation (Building/Room) Time-Out Door
Figure 6

��Project Descriptions
Exercises1. Create the feasibility study (initial proposal).2. Create a list of all of the forms and reports that the company might use.3. Create a normalized list of tables for each form and report.4. Create an integrated list of normalized tables for the entire application. Draw
the corresponding class diagram.5. Create the basic tables in a DBMS along with all necessary relationships and
integrity constraints. Enter sample data into the tables to test your design. 6. Evaluate the normalized tables and estimate the size of the database—both
current size and estimated size in 3 years.7. List the initial security conditions for the data tables. Create a list of user
groups and identify their basic access needs.8. Design the overall structure of the application. Outline the overall structure
and the primary forms. Select a design scheme, including layouts, effects, and colors.
9. Build three initial input forms.10. Build three initial reports.11. Improve the forms and reports to make them easier to use.12. Test your forms and reports with sample users.13. Build additional forms and reports. Improve all of them. Test all of them.14. Connect all of the forms and reports into an application. Add help files. Test
all the links. Test the forms and reports. Check for consistency.15. Add security, backup and recovery, and other management features to the
application.16. Move the data tables to a centralized server, leaving the application to run on
a client. Build the necessary links and retest the application.17. Move the entire application to a Web server. Build the forms so that they run
on a Web browser.18. Create an OLAP evaluation query and graphs. Build in a way to create the
links so new annual data can be generated automatically. Link the data so that the spreadsheet is updated automatically.
��Project Descriptions
Big Teeth Reality TV (2005)
A new reality show is entering production. A cross between Animal Planet and Fear Factor, it focuses on conflicts between humans and animals with big teeth (crocodiles, tigers, lions, and so on). Contestants never know if they will be chased by the animals or if they will be eating them. The insurance costs will be huge, but the producers think there is a big audience. Producers always think that, but at least they are willing to pay money to find out. The next step is to find people crazy enough to sign the waivers and participate in the show.
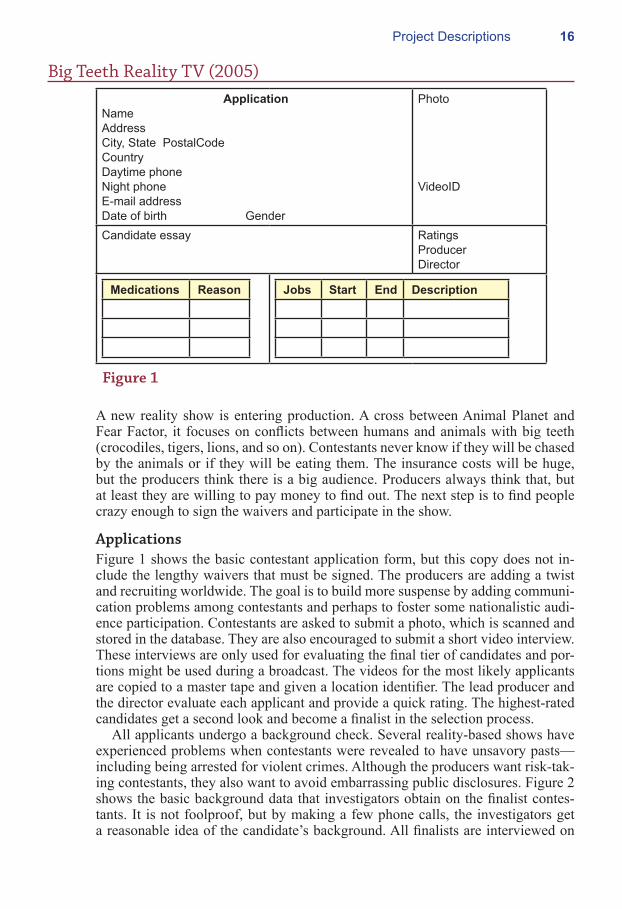
ApplicationsFigure 1 shows the basic contestant application form, but this copy does not in-clude the lengthy waivers that must be signed. The producers are adding a twist and recruiting worldwide. The goal is to build more suspense by adding communi-cation problems among contestants and perhaps to foster some nationalistic audi-ence participation. Contestants are asked to submit a photo, which is scanned and stored in the database. They are also encouraged to submit a short video interview. These interviews are only used for evaluating the final tier of candidates and por-tions might be used during a broadcast. The videos for the most likely applicants are copied to a master tape and given a location identifier. The lead producer and the director evaluate each applicant and provide a quick rating. The highest-rated candidates get a second look and become a finalist in the selection process.
All applicants undergo a background check. Several reality-based shows have experienced problems when contestants were revealed to have unsavory pasts—including being arrested for violent crimes. Although the producers want risk-tak-ing contestants, they also want to avoid embarrassing public disclosures. Figure 2 shows the basic background data that investigators obtain on the finalist contes-tants. It is not foolproof, but by making a few phone calls, the investigators get a reasonable idea of the candidate’s background. All finalists are interviewed on
ApplicationNameAddressCity, State PostalCodeCountryDaytime phoneNight phoneE-mail addressDate of birth Gender
Photo
VideoID
Candidate essay RatingsProducerDirector
Medications Reason Jobs Start End Description
Figure 1

��Project Descriptions
camera and evaluated in terms of appearance and physical strength. The producers and directors then select the contestants for an episode.
Episodes and EventsActual episodes consist of one or more events. Generally, there is only time for one or two events per episode, but the producers are thinking about the possibil-ity of an hour-long special. Figure 3 shows the two main aspects of the event: the setup from the perspective of the director, and the results from the perspective of the contestants. The director focuses on the sequence of actions, where the cam-eras will be located, and the estimated time of each section. For each event a con-testant is given one primary task. Sometimes they work in teams, so two or three people might be given the same task. The task result might just be a completion,
Background CheckApplicantNational ID Appearance RatingReligion Strength Rating
Employer Phone Comments
Education Contact Degree Comments
Police and Judicial Records
Date Category Description Outcome
Figure 2
EventTitleDescriptionEstimated timeEstimated danger
ProducerDirectorEpisode
ContestantsName Task Result Points Prize
ActionsSeq. Description Cameras Est. Time
Figure 3
��Project Descriptions
or it might include a time for races. Either way, contestants are awarded points (sometimes negative points) for their role in the task. Occasionally, small prizes are awarded for completing a task, but contestants are really competing for the overall prizes in the event.
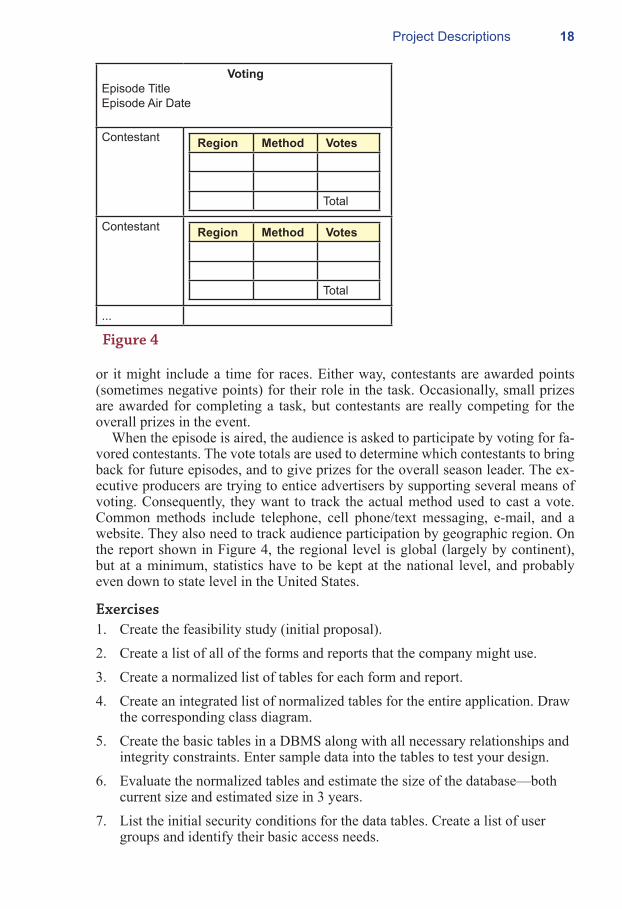
When the episode is aired, the audience is asked to participate by voting for fa-vored contestants. The vote totals are used to determine which contestants to bring back for future episodes, and to give prizes for the overall season leader. The ex-ecutive producers are trying to entice advertisers by supporting several means of voting. Consequently, they want to track the actual method used to cast a vote. Common methods include telephone, cell phone/text messaging, e-mail, and a website. They also need to track audience participation by geographic region. On the report shown in Figure 4, the regional level is global (largely by continent), but at a minimum, statistics have to be kept at the national level, and probably even down to state level in the United States.
Exercises1. Create the feasibility study (initial proposal).2. Create a list of all of the forms and reports that the company might use.3. Create a normalized list of tables for each form and report.4. Create an integrated list of normalized tables for the entire application. Draw
the corresponding class diagram.5. Create the basic tables in a DBMS along with all necessary relationships and
integrity constraints. Enter sample data into the tables to test your design. 6. Evaluate the normalized tables and estimate the size of the database—both
current size and estimated size in 3 years.7. List the initial security conditions for the data tables. Create a list of user
groups and identify their basic access needs.
VotingEpisode TitleEpisode Air Date
Contestant Region Method Votes
Total
Contestant Region Method Votes
Total
...
Figure 4

��Project Descriptions
8. Design the overall structure of the application. Outline the overall structure and the primary forms. Select a design scheme, including layouts, effects, and colors.
9. Build three initial input forms.10. Build three initial reports.11. Improve the forms and reports to make them easier to use.12. Test your forms and reports with sample users.13. Build additional forms and reports. Improve all of them. Test all of them.14. Connect all of the forms and reports into an application. Add help files. Test
all the links. Test the forms and reports. Check for consistency.15. Add security, backup and recovery, and other management features to the
application.16. Move the data tables to a centralized server, leaving the application to run on
a client. Build the necessary links and retest the application.17. Move the entire application to a Web server. Build the forms so that they run
on a Web browser.18. Create an OLAP evaluation query and graphs. Build in a way to create the
links so new annual data can be generated automatically. Link the data so that the spreadsheet is updated automatically.
�0Project Descriptions
Cerulean Bee (2005)
Bob Bee is an artist who has chosen to make his living designing and printing shirts and jerseys for various clubs and events. He named the company after him-self and his favorite color. Although he has been in business only a couple of years, it has been successful. Several local clubs sponsor several events each year and want commemorative apparel that they either give to everyone who registers for the event or sell as a separate item. Either way, Bob makes money because he is paid for the work regardless of the number of items that actually sell.
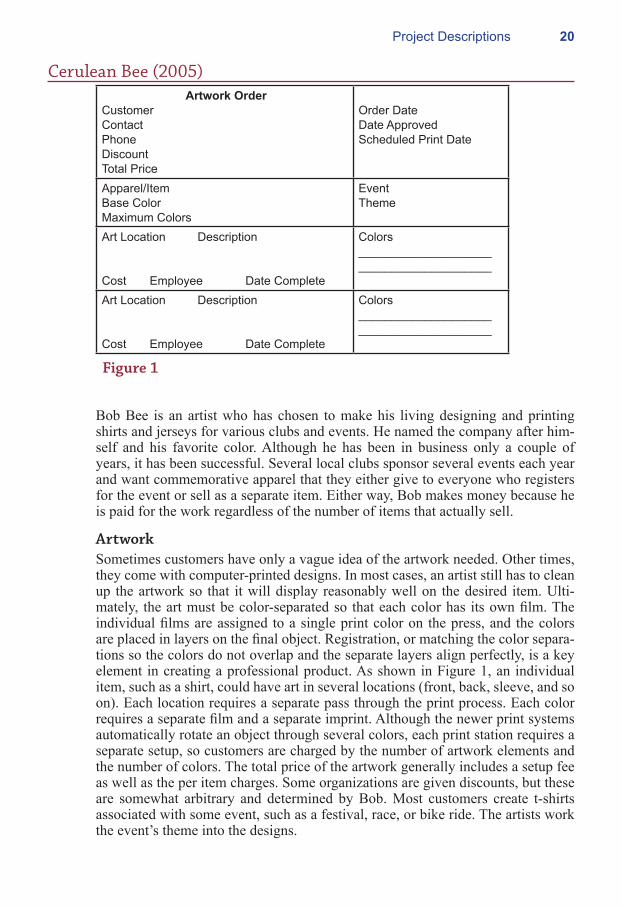
ArtworkSometimes customers have only a vague idea of the artwork needed. Other times, they come with computer-printed designs. In most cases, an artist still has to clean up the artwork so that it will display reasonably well on the desired item. Ulti-mately, the art must be color-separated so that each color has its own film. The individual films are assigned to a single print color on the press, and the colors are placed in layers on the final object. Registration, or matching the color separa-tions so the colors do not overlap and the separate layers align perfectly, is a key element in creating a professional product. As shown in Figure 1, an individual item, such as a shirt, could have art in several locations (front, back, sleeve, and so on). Each location requires a separate pass through the print process. Each color requires a separate film and a separate imprint. Although the newer print systems automatically rotate an object through several colors, each print station requires a separate setup, so customers are charged by the number of artwork elements and the number of colors. The total price of the artwork generally includes a setup fee as well as the per item charges. Some organizations are given discounts, but these are somewhat arbitrary and determined by Bob. Most customers create t-shirts associated with some event, such as a festival, race, or bike ride. The artists work the event’s theme into the designs.
Artwork OrderCustomerContactPhoneDiscountTotal Price
Order DateDate ApprovedScheduled Print Date
Apparel/ItemBase ColorMaximum Colors
EventTheme
Art Location Description
Cost Employee Date Complete
Colors________________________________________
Art Location Description
Cost Employee Date Complete
Colors________________________________________
Figure 1
��Project Descriptions
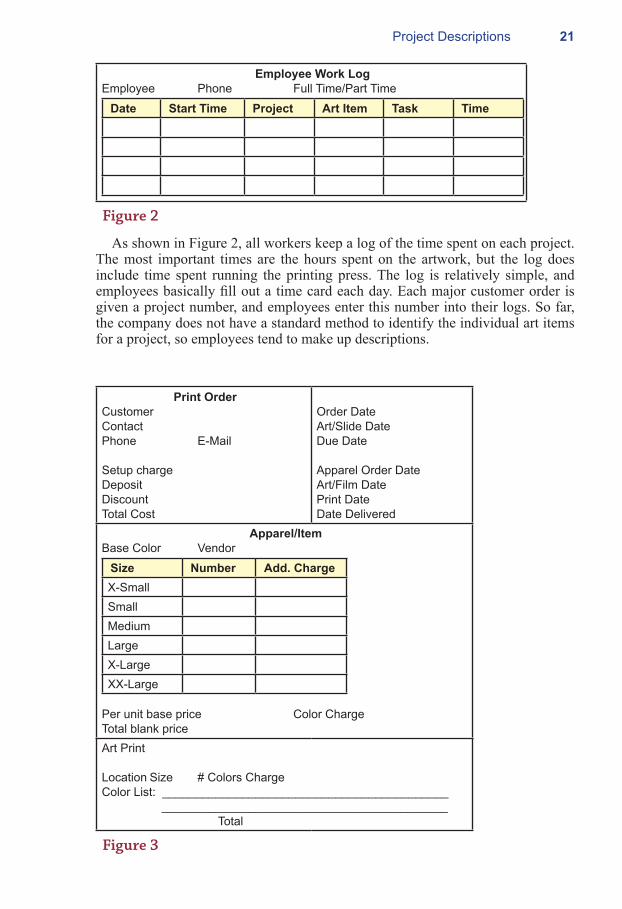
As shown in Figure 2, all workers keep a log of the time spent on each project. The most important times are the hours spent on the artwork, but the log does include time spent running the printing press. The log is relatively simple, and employees basically fill out a time card each day. Each major customer order is given a project number, and employees enter this number into their logs. So far, the company does not have a standard method to identify the individual art items for a project, so employees tend to make up descriptions.
Employee Work LogEmployee Phone Full Time/Part Time
Date Start Time Project Art Item Task Time
Figure 2
Print OrderCustomerContactPhone E-Mail
Setup chargeDeposit DiscountTotal Cost
Order DateArt/Slide Date Due Date
Apparel Order DateArt/Film DatePrint DateDate Delivered
Apparel/ItemBase Color Vendor
Size Number Add. ChargeX-SmallSmallMediumLargeX-LargeXX-Large
Per unit base price Color ChargeTotal blank priceArt Print
Location Size # Colors ChargeColor List: ___________________________________________ ___________________________________________ Total
Figure 3

��Project Descriptions
OrdersOnce in a while customers just place orders for the artwork, but generally, they really want the art imprinted onto some item—usually a t-shirt. Figure 3 shows the main print order form. This form is also used to guide the overall project time-frame, so several dates are added to it as the order progresses through the system. The first major step is to select the apparel item. The company keeps samples of common items and colors on hand to help the customer visualize the final prod-uct. Many other items can colors can be ordered from a selection of vendors. The price of the item is an important consideration in the selection, and vendors have different prices based on fabric and size. Basic sizes are listed at a standard price, but the larger sizes carry an additional charge. The customer has to estimate the number of items desired at each size. Per unit prices also depend on the quantity ordered—with typical breakpoints of 100, 500, and 1000 unit orders. The other in-teresting twist is that most vendors charge higher prices for darker-colored items. The actual costs and the price Bob charges fluctuate, so they are determined by the clerks at the time of the sale. This form also contains the pricing breakdown for printing the individual artwork. The price is determined by the number of imprints and the number of colors. It is critical for clerks to enter all of the exact colors on the form.
At the end of the month, Bob develops a report that displays a cost analysis for each recent project. He uses the information to help set prices and to iden-tify which jobs are the most profitable. Figure 4 shows the basic arrangement of
Project Cost Analysis
Project Event ItemCustomerOrder Date Delivery Date
Material Costs
Item Per-unit Cost Price Charged Units Cost Revenue
Total Total
Labor Costs
Employee Task Time Wage Rate Cost
Total
Total Money Received Material Charge Artwork Fees Fixed ChargesTotal Material CostsTotal Labor CostsShipping Costs/OtherDiscounts Net Profit
Figure 4
��Project Descriptions
the report. Bob usually looks at the net profit data first followed by the subtotal breakdown. He only looks through the detail material and labor costs in cases that seem unusual. Note that all items used in the production of a particular item are listed—including the apparel, film sets, and ink. The labor costs are summarized by task. Even though an employee might have worked on the artwork three differ-ent times over four days, there will be one entry for the artwork development. One of the important steps in this case is identifying a standard list of tasks—because employees tend to invent strange names every month, and it is difficult to put the data together to create this report.
Exercises1. Create the feasibility study (initial proposal).2. Create a list of all of the forms and reports that the company might use.3. Create a normalized list of tables for each form and report.4. Create an integrated list of normalized tables for the entire application. Draw
the corresponding class diagram.5. Create the basic tables in a DBMS along with all necessary relationships and
integrity constraints. Enter sample data into the tables to test your design. 6. Evaluate the normalized tables and estimate the size of the database—both
current size and estimated size in 3 years.7. List the initial security conditions for the data tables. Create a list of user
groups and identify their basic access needs.8. Design the overall structure of the application. Outline the overall structure
and the primary forms. Select a design scheme, including layouts, effects, and colors.
9. Build three initial input forms.10. Build three initial reports.11. Improve the forms and reports to make them easier to use.12. Test your forms and reports with sample users.13. Build additional forms and reports. Improve all of them. Test all of them.14. Connect all of the forms and reports into an application. Add help files. Test
all the links. Test the forms and reports. Check for consistency.15. Add security, backup and recovery, and other management features to the
application.16. Move the data tables to a centralized server, leaving the application to run on
a client. Build the necessary links and retest the application.17. Move the entire application to a Web server. Build the forms so that they run
on a Web browser.18. Create an OLAP evaluation query and graphs. Build in a way to create the
links so new annual data can be generated automatically. Link the data so that the spreadsheet is updated automatically.
��Project Descriptions
Orange Blossom Nursery (2007)The Orange Blossom is a local plant nursery that specializes in providing hard-to-find plants to contractors and homeowners. The company also carries most of the common plants and trees, but the owners take pride in their ability to grow more unusual varieties and colors. Contractors and landscape design firms within a couple hundred miles come to the Orange Blossom for unique specimens, often used as highlights in their designs. Prices reflect the uniqueness and high quality of items offered by the firm.
Despite the company’s reputation, Orange Blossom faces the same pressures of any nursery. Weather can be a problem—particularly dry spells or hail. But, bad weather can also boost sales. Homeowners and businesses lose plants during dif-ficult times and they come to Orange Blossom to replace them. The biggest chal-lenge is trying to forecast the demand for new housing and landscaping. It takes time to grow many of the plants to the size requested by contractors and landscap-ers, so Orange Blossom managers have to plan ahead and estimate the number of plants that will be needed. If the local economy slumps, building rates fall, and the company is left with unsold plants. Fortunately, most of them can be protected and sold in future years, but the costs of growing the plants cuts into current-year profits.
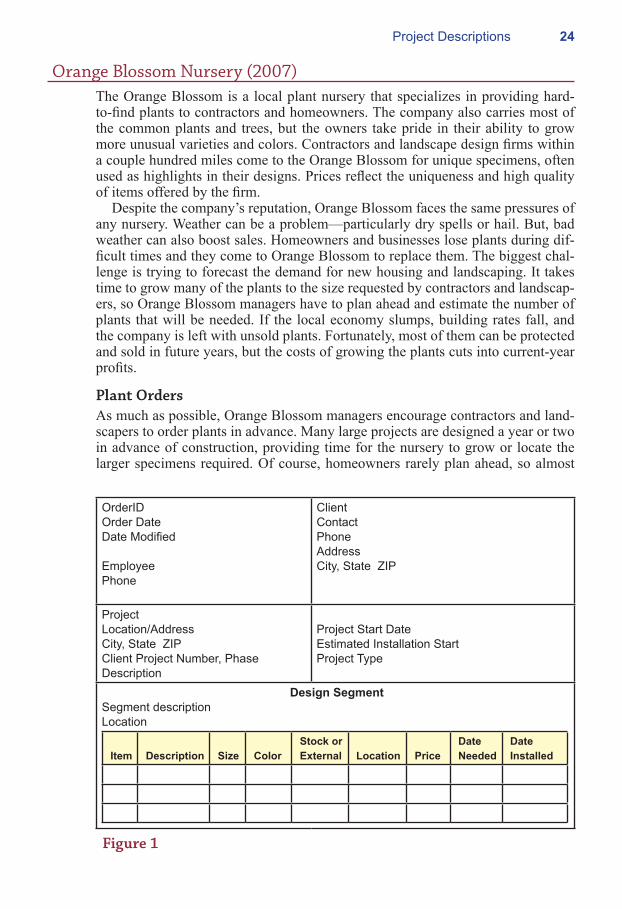
Plant OrdersAs much as possible, Orange Blossom managers encourage contractors and land-scapers to order plants in advance. Many large projects are designed a year or two in advance of construction, providing time for the nursery to grow or locate the larger specimens required. Of course, homeowners rarely plan ahead, so almost
OrderIDOrder DateDate Modified
EmployeePhone
ClientContactPhoneAddressCity, State ZIP
ProjectLocation/AddressCity, State ZIPClient Project Number, PhaseDescription
Project Start DateEstimated Installation StartProject Type
Design SegmentSegment descriptionLocation
Item Description Size ColorStock or External Location Price
Date Needed
Date Installed
Figure 1
��Project Descriptions
all of the advance orders are placed by established clients. To assist the clients, Orange Blossom wants to keep many of the plan details in the computer system. Clients will be able to select a project and find the list of plants, along with the planned locations of each plant. Locations of flowers and small plants are sim-ply specified in terms of a growing area. Trees and highlight specimens are giv-en more detailed locations. Traditionally, landscape designers use a grid system. Each section of the landscape design will be drawn on a scale grid that matches the property. Each major tree will be displayed as a circle centered on a grid point that corresponds to a location in the ground. A few designers of large projects have started listing GPS coordinates (latitude and longitude).
Figure 1 shows the basic information collected on the order form. Large proj-ects are often completed in stages or phases, so the form has a place for clients to record that information. Plants are ultimately identified by their species and vari-ety using specific Latin names. However, general descriptions are provided using common names. Plants and trees have different types of measurements. Trees are generally measured by their caliper or diameter, usually in inches. Small shrubs or flowers can be measured by the container size (such as 1 or 5 gallon). Larger shrubs or even smaller trees might be measured by height, in feet.
Orange Blossom Nursery Statement
Billing DateTime Period
Starting Balance
ClientAccount ManagerFaxE-MailBilling AddressCity, State ZIP
New Orders
ProjectSpecial Orders Pick Up Custom Regular Deposit Net Due
Amount IncreasedPayments Received
Date Project Project Total Amount Paid Balance
Total Received
Outstanding BalanceInterest Charges
Ending Balance
Figure 2

��Project Descriptions
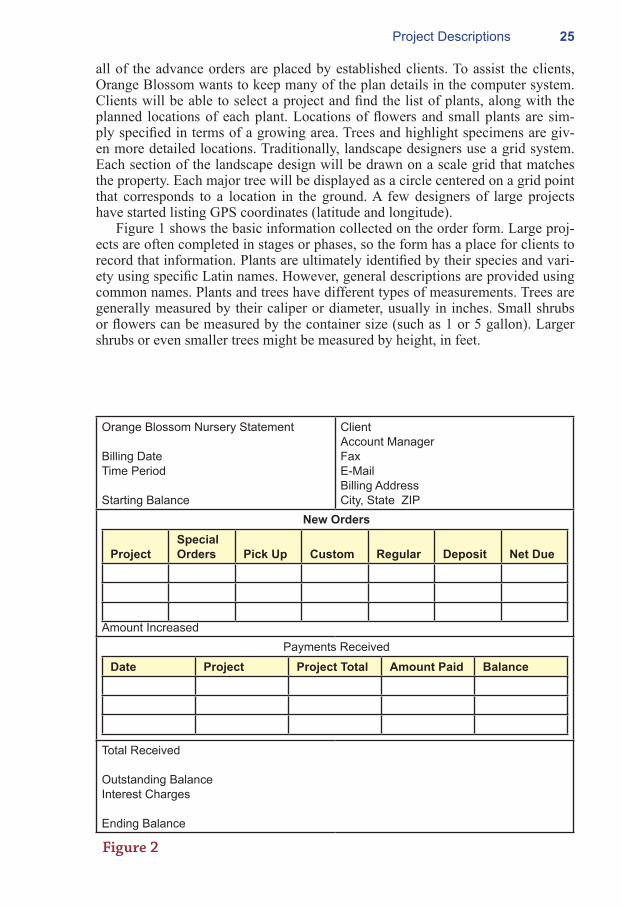
Payments and BillingLandscape designers and contractors purchase items for other customers. As a result, Orange Blossom maintains accounts for its major clients. Ultimately, the contractors and designers are responsible for payment, but it takes time to install a project and collect money from the end customers. Orange Blossom allows cli-ents to identify a project when making a payment, and tracks their spending for them. Consequently, Orange Blossom allows its clients to pick up items and pay for them later. If “later” turns into months, it can be a problem. So, the accounting manager wants to track payments based on projects and be able to send billing notices to the contractors. After more than two months, the bills should include an interest charge. Additionally, expensive plants, special orders, and large orders re-quire down payments. Designers almost always collect some money upfront from customers, so Orange Blossom wants some of the money to avoid problems with nonpayment. Some clients make payments over time—particularly as a project progresses. As shown in Figure 2, Orange Blossom sends a monthly billing state-ment that lists the balance at the start of the period, new purchases, and any pay-ments received.
DeliveryOrange Blossom also delivers items and will plant larger trees. Few contractors have the equipment to move or plant the big trees, so it is a popular service. To schedule deliveries efficiently, the planting manager requires clients to schedule
Orange Blossom Delivery
Delivery DateDelivery TimeContact PersonCell Phone
ClientBilling Account NumberAddressCity, State ZIP
Project CustomerDelivery LocationAddressCity, State ZIPDirectionsPlanting
Item Size TruckPlanting Time
Delivery Charge
Planting Charge Total
TaxTotal Charges
Driver Distance (miles)Cell Phone
Comments
Figure 3

��Project Descriptions
deliveries in advance. The delivery charge depends on the distance traveled. Or-ange Blossom drivers have the equipment to dig holes to plant the trees, but the company requires that the buyer contact the utility companies to have the location inspected and marked for underground utility lines. The installation or planting charge depends on the size of the tree and the time and labor required. Figure 3 shows the basic form that is used for scheduling deliveries. It is also completed by the driver after an item has been delivered. The Delivery Date is initially filled out by the clerk to match the requested date. It is either accepted or changed by the driver when the items are delivered. Similarly, the Delivery Charge and Planting Charge are estimated by the clerk when the request is made, and the final planting charge is computed later based on the actual planting time.
PurchasesOrange Blossom Nursery purchases several items from manufacturers and large growers. The company goes through thousands of pots every year, along with tons of fertilizer and other chemicals. Most of the products are used to grow and sell the plants. A few are sold directly to clients. Additionally, some plants are grown or started at large wholesale nurseries and purchased in bulk. Some of the vendors have multiple locations, so the purchase order generally specifies which location was contacted to provide the products. Item numbers are tricky. Each vendor uses a different numbering system, and Orange Blossom employees are careful to list both the vendor’s number and the Item ID assigned by Orange Blossom.
Figure 4 shows the details of the purchase order form. Some of the key fea-tures are shown in the detail section for the items ordered. Orange Blossom em-ployees inspect all of the items as they are received. If the quality is too low, the items are rejected and Orange Blossom will not pay for them. Also, special orders for clients are recorded on the form to help the accounting manager track unique
Orange Blossom Purchase OrderPurchase Order Number Order DateEmployeeContact PhoneVendorLocationAddressCity, State ZIP
Accounting Manager (for payments)PhoneAddressCity, State ZIPItems
Mfg Item
OB Item
Description Quantity Price Delivery Date
Quantity Delivered
Quantity Rejected
OrderID
Total Due
Amount PaidDate Paid
Figure 4

��Project Descriptions
items. The Orange Blossom OrderID is entered onto the appropriate line as a cross reference.
Exercises1. Create the feasibility study (initial proposal).2. Create a list of all of the forms and reports that the company might use.3. Create a normalized list of tables for each form and report.4. Create an integrated list of normalized tables for the entire application. Draw
the corresponding class diagram.5. Create the basic tables in a DBMS along with all necessary relationships and
integrity constraints. Enter sample data into the tables to test your design. 6. Evaluate the normalized tables and estimate the size of the database—both
current size and estimated size in 3 years.7. List the initial security conditions for the data tables. Create a list of user
groups and identify their basic access needs.8. Design the overall structure of the application. Outline the overall structure
and the primary forms. Select a design scheme, including layouts, effects, and colors.
9. Build three initial input forms.10. Build three initial reports.11. Improve the forms and reports to make them easier to use.12. Test your forms and reports with sample users.13. Build additional forms and reports. Improve all of them. Test all of them.14. Connect all of the forms and reports into an application. Add help files. Test
all the links. Test the forms and reports. Check for consistency.15. Add security, backup and recovery, and other management features to the
application.16. Move the data tables to a centralized server, leaving the application to run on
a client. Build the necessary links and retest the application.17. Move the entire application to a Web server. Build the forms so that they run
on a Web browser.18. Create an OLAP evaluation query and graphs. Build in a way to create the
links so new annual data can be generated automatically. Link the data so that the spreadsheet is updated automatically.
��Project Descriptions
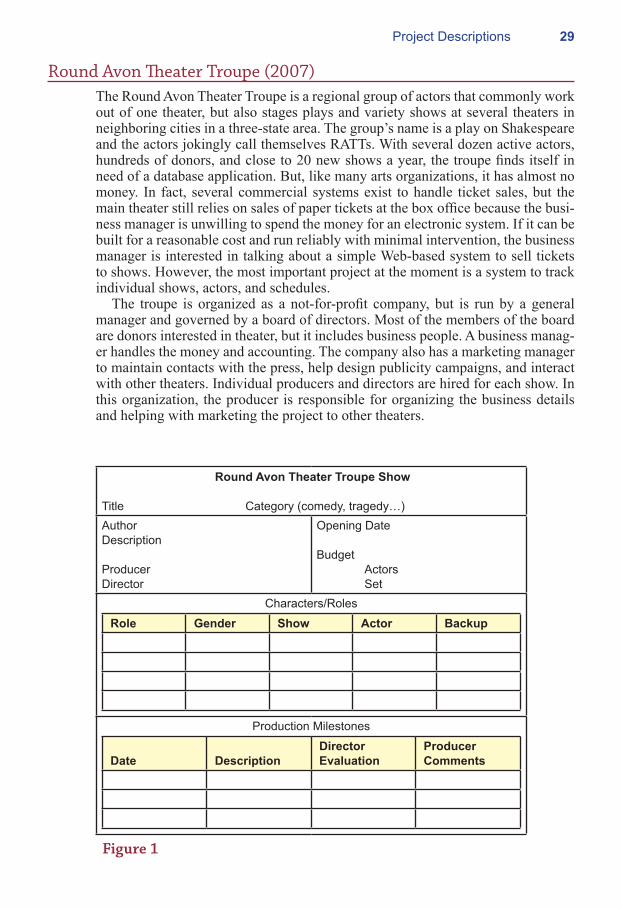
Round Avon Theater Troupe (2007)The Round Avon Theater Troupe is a regional group of actors that commonly work out of one theater, but also stages plays and variety shows at several theaters in neighboring cities in a three-state area. The group’s name is a play on Shakespeare and the actors jokingly call themselves RATTs. With several dozen active actors, hundreds of donors, and close to 20 new shows a year, the troupe finds itself in need of a database application. But, like many arts organizations, it has almost no money. In fact, several commercial systems exist to handle ticket sales, but the main theater still relies on sales of paper tickets at the box office because the busi-ness manager is unwilling to spend the money for an electronic system. If it can be built for a reasonable cost and run reliably with minimal intervention, the business manager is interested in talking about a simple Web-based system to sell tickets to shows. However, the most important project at the moment is a system to track individual shows, actors, and schedules.
The troupe is organized as a not-for-profit company, but is run by a general manager and governed by a board of directors. Most of the members of the board are donors interested in theater, but it includes business people. A business manag-er handles the money and accounting. The company also has a marketing manager to maintain contacts with the press, help design publicity campaigns, and interact with other theaters. Individual producers and directors are hired for each show. In this organization, the producer is responsible for organizing the business details and helping with marketing the project to other theaters.
Round Avon Theater Troupe Show
Title Category (comedy, tragedy…)AuthorDescription
ProducerDirector
Opening Date
Budget Actors Set
Characters/Roles
Role Gender Show Actor Backup
Production Milestones
Date DescriptionDirector Evaluation
Producer Comments
Figure 1

�0Project Descriptions
ShowsA show is a play (or similar event) that runs for several weeks. It generally pre-mieres at the troupe’s home theater where it runs for a couple of weeks. Then the group takes the show on the road to other regional theaters. Sometimes they do classic Broadway shows; other times they do experimental or first-run plays. In many ways, a show is an exercise in project management. There is a scheduled opening date, actors to hire and train, sets to construct, lighting to create, and doz-ens of employees to coordinate. The issue of actors (and employees) is important. For long-running plays, it is critical to have backup actors for all of the characters. The Troupe often schedules multiple versions of a show using different combina-tions of the cast. For example, every year they do a special show near the first of July that takes place at several of the regional theaters. Different cast members are in each version of the play to reduce travel costs. For these shows, the backup for the lead characters is usually handled by actors with minor roles. If an actor falls ill, the backup fills the spot and the minor character is usually deleted for that performance.
Figure 1 shows a version of the form that producers use to track progress on a show. The actors/backups list is relatively flexible in the early days. Some direc-tors will experiment with several different actors at the early stages. The produc-tion milestones have evolved over the years into a relatively solid list of steps followed in every production. They include casting actors, getting the sets built, establishing the lighting, producing the marketing materials, getting costumes fit-ted, and the major rehearsals. Although the steps remain the same, the sequence can vary depending on the complexity of the production. For instance, sometimes the set construction is finished early, but for detailed sets, it might not be finished
Weekly Expenses
Start Date – End DateProduction
Name Role SSN Amount Date PaidActors
Actor Total
Item Vendor Description Amount CategoryFixed
Fixed Total Production Total Budget Percent of Budget SpentOperating Expenses
Item Amount Category Person/Vendor Tax ID
Operating Total Weekly Total
Figure 2
��Project Descriptions
until just before the opening day. At each milestone, the director and producer evaluate the overall status, adjust timing of other events, and make suggestions for improving the process in the future.
Bills and SalariesActors are paid by the week when they are performing. Typically each actor re-ceives $200, but a few of the experienced actors negotiate slightly higher salaries. Many of the other jobs are staffed by unpaid volunteers who get free tickets for themselves and a couple of friends. Expenses for sets and utilities (it costs a lot to heat and cool a theater), are largely paid from donations. The general manager, office manager, and marketing manager are paid a salary that also comes from the general budget. Budgets are relatively simple and are estimated before a show is selected.
As shown in Figure 2, actual expenses are tracked weekly by the business man-ager. Fixed costs are assigned to productions whenever possible and include ma-terials for sets (e.g., wood and paint), as well as estimates of utilities for a show’s rehearsal and performance. Vendor information includes the standard name, ad-dress, city, state, and ZIP Code data. Items are given categories such as utilities, costumes, music, lighting, and paint, so the manager can print summary reports. There can be several productions in progress during any week, but rarely more than five. Operating expenses are costs that are not assigned to specific produc-tions. Manager salaries, rent, some utilities, and some contractor fees fall into this category. The decision of which costs to include in a production versus operating
Travel ExpensesShow
Theater Fax CityManager PhoneStart Date End DateHotel # NightsTransportation Cost
Actors’ Expenses
Name Cell Phone Lodging Meals Total
Total
Box Office Receipts
Date Receipts Percent Amount
Total
Figure 3
��Project Descriptions
expenses is generally left to the business manager, but sometimes directors argue and costs are reorganized.
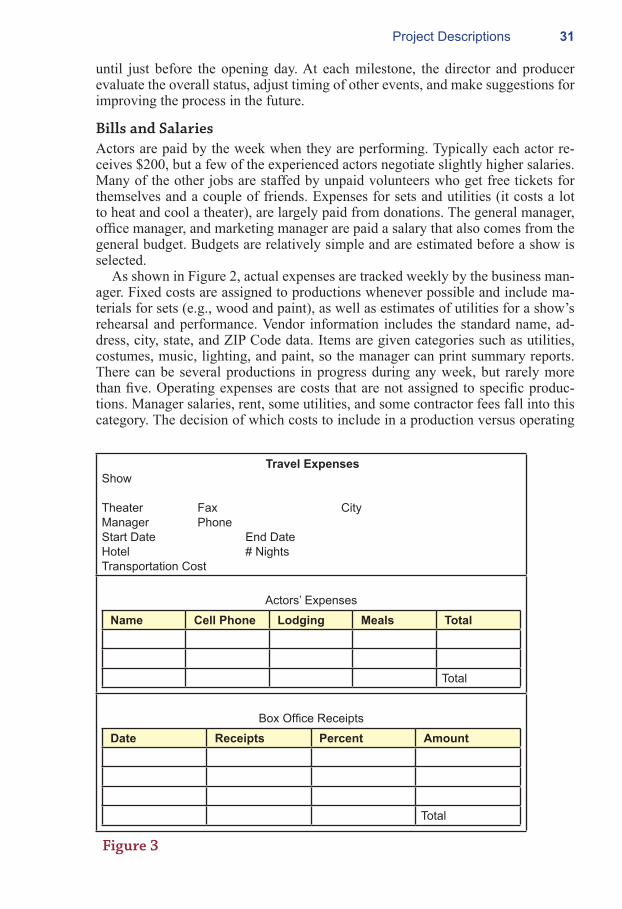
Traveling ShowsThe Troupe handles travel arrangements and pays for lodging and a basic stipend for meals for actors when the group is traveling. Depending on the distance, the Troupe might rent a bus to carry everyone. Otherwise, individual actors simply drive to the destination. Many of them car pool, but they are not reimbursed for travel costs for these shorter trips. The Troupe itself gets a percentage of the box office receipts from other theaters. This percentage is usually a fixed number that is negotiated with individual managers. However, sometimes the percentage de-pends on the day of the week or is tied to the attendance levels. Taking the shows on the road requires selling the theater managers on the value of the play and convincing them that enough customers will show up. Often, the statistics from the initial runs at the home theater are used to demonstrate demand for a specific play. Towards that end, the marketing manager would like to find some way to track sales, even if the list is only totals for each day. Figure 3 shows the summary report that producers use to analyze expenses and receipts for the road shows.
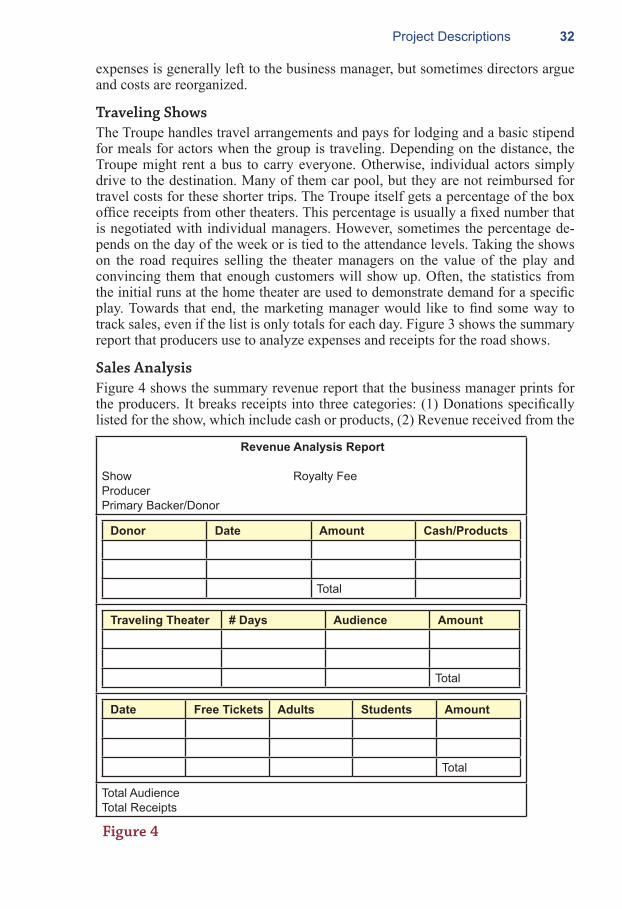
Sales AnalysisFigure 4 shows the summary revenue report that the business manager prints for the producers. It breaks receipts into three categories: (1) Donations specifically listed for the show, which include cash or products, (2) Revenue received from the
Revenue Analysis Report
Show Royalty FeeProducerPrimary Backer/Donor
Donor Date Amount Cash/Products
Total
Traveling Theater # Days Audience Amount
Total
Date Free Tickets Adults Students Amount
Total
Total AudienceTotal Receipts
Figure 4

��Project Descriptions
partner theaters for traveling shows; and (3) Daily receipts from the home theater. The daily receipts include estimates of the audience size based on the number of adults, students, and free tickets. These detail numbers are often provided to other theaters to help them set ticket prices and estimate comparative demand for planning purposes. Many shows also require performance royalty payments to the copyright holders based on the revenue. The fee could be a fixed number or it could be a percentage of the revenue. The details are set by the copyright holders. This report simply lists the current royalty total that needs to be paid for the listed show.
Exercises1. Create the feasibility study (initial proposal).2. Create a list of all of the forms and reports that the company might use.3. Create a normalized list of tables for each form and report.4. Create an integrated list of normalized tables for the entire application. Draw
the corresponding class diagram.5. Create the basic tables in a DBMS along with all necessary relationships and
integrity constraints. Enter sample data into the tables to test your design. 6. Evaluate the normalized tables and estimate the size of the database—both
current size and estimated size in 3 years.7. List the initial security conditions for the data tables. Create a list of user
groups and identify their basic access needs.8. Design the overall structure of the application. Outline the overall structure
and the primary forms. Select a design scheme, including layouts, effects, and colors.
9. Build three initial input forms.10. Build three initial reports.11. Improve the forms and reports to make them easier to use.12. Test your forms and reports with sample users.13. Build additional forms and reports. Improve all of them. Test all of them.14. Connect all of the forms and reports into an application. Add help files. Test
all the links. Test the forms and reports. Check for consistency.15. Add security, backup and recovery, and other management features to the
application.16. Move the data tables to a centralized server, leaving the application to run on
a client. Build the necessary links and retest the application.17. Move the entire application to a Web server. Build the forms so that they run
on a Web browser.18. Create an OLAP evaluation query and graphs. Build in a way to create the
links so new annual data can be generated automatically. Link the data so that the spreadsheet is updated automatically.

��Project Descriptions
Joe’s Chops (2007)Customizing cars is popular. Several TV shows even evolved to show how small firms can take a car and customize it with a larger engine, new suspension, fancy paint jobs, and plush interiors. In most cases, the car is stripped down to its frame, sanded, repainted, and rebuilt with new components from the ground up. Joe’s Chops is one of those small garages, led by Joe, who has a vision of creating unique rides for people with the money (and sometimes courage) who want to drive something different from everyone else. Joe’s has done well over the past few years, garnering several first-place awards at some of the regional and na-tional competitions. The shop has built cars for several celebrities and gets con-siderable business through word-of-mouth. Even with only simple advertising, the company receives enough work to keep the shop busy through the year. A few cus-tomers have suggested that Joe expand or even open a second shop, but he feels it would be hard to manage and difficult to find the quality workers he needs, so he is content to stick with the single location. However, Joe routinely encounters two basic problems: (1) As his customer base move upscale, he finds they have almost no time to spend discussing options or making decisions; and (2) He hates doing paperwork, so his accountant keeps yelling at him about documenting expenses and the need to do a better job at pricing the jobs to make enough profit.
Choosing OptionsJoe needs a better way to communicate with customers. In some cases, the cus-tomer drops off the vehicle and lets Joe and his team work their magic any way they want. Other customers want more control over options (and costs). Some-
Joe’s ChopsCustomization Plan
CustomerAddressCity, State ZIPCodePhoneEmail
EmployeeTitlePhone EMail
VehicleMake Model Year Engine Trim Interior ExteriorBody conditionFrame conditionEngine conditionInterior conditionBasic Customization Plan
Item Days Description Parts Labor Employee
Estimated Price DepositStart DateEstimated Delivery Date
Figure 1

��Project Descriptions
times Joe encounters problems getting parts or comes up with a new idea in the middle of a renovation. In these situations, he wants to be able to show the choices to the customer and let them make a decision. But, he cannot afford to wait for several days or weeks for the customer to make the trip to the shop. Also, he wants to post daily photos on a Web site so the customer can check on the progress.
Figure 1 shows the basic information that is collected when a customer wants a vehicle customized. The initial plan can be relatively general, but sometimes the employee (or customer) lists very specific engines. For example, it is relatively common to list a particular engine—in part because some cars can handle only one or two engine types. Pricing is somewhat subjective. The employee writing up the initial order writes estimates for the cost of parts and labor when they are known. All orders are eventually examined by the business manager and by Joe. Highly specialized items or hard-to-find parts are often not priced until they are located and purchased from a vendor. With considerable experience, Joe is pretty good at estimating the overall time and arriving at an estimated price. However, he has suggested that it would be helpful to have a simple report that shows the actual costs incurred for similar vehicles.
Web Site CommunicationsAfter a little persuasion, Joe has agreed that a Web site would be a convenient way for customers to check on the progress of a conversion and to answer questions or provide feedback. He is willing to get a digital camera and upload photos. Most of the employees take pride in their work and he figures this is also a good way to motivate the employees who work on the earlier stages, such as sanding and paint-ing. For the basic site structure, each customer will have a separate page. Once the customer logs in, the page will display the most recent photo for the day. As shown in Figure 2, critical questions will also be listed on the main page. When the customer clicks the question, the details will be provided along with a simple form for the customer to answer the question or provide additional details. E-mail addresses and phone numbers of the employees will also be provided in case the customer wants to call and discuss more of the details before making a decision. To make it easy to search the questions and answers, they should be stored in the database. Depending on the final DBMS chosen, the photos will probably be stored as digital files on the server, with the link stored as a filename in the data-base. Observe that one of the options is a slide show that lets the customer scroll
Customized Customer Web Site
Current PhotoLinks to Other PhotosOriginalFrame BodyEngine InteriorPhotos by Day
Critical Questions
Q# Date Question Answer
Figure 2

��Project Descriptions
through the photos sequentially. This slideshow should be handled by assigning a date and sequence to the photos when they are uploaded. Similarly, be sure to include dates for any answers or questions added by employees or customers.
Itemized BillingWhen the vehicle rebuild is completed, the customer is given a detailed bill that
itemizes the various parts. For total overhauls, this list could be lengthy. However, major subsystems are often contracted to outside partners and the bill will show only the total cost charged by the contractor. For instance, Joe rarely rebuilds en-gines. Instead, he prefers to buy them from a custom engine shop across town. They make most of the components and will customize them to fit specific ve-hicles and then bill a single price for the work. Items are usually purchased from manufacturers. Ultimately, the accountant records the cost as well as the price charged to the customer, but the cost is not listed on the billing form. Joe usually bills the labor costs at the prices that he pays the workers. He then covers his fixed costs (utilities and so on) and profit by adding an overhead charge to the bill. He figures this method is fairer and more accurate than pretending that his employ-ees receive $150 an hour and pocketing the difference. Figure 3 shows the basic billing form. It lists parts and labor separately. This approach results in some du-plication. It would be possible to display the labor needed to install a part on the same line as the part itself. However, Joe likes to keep the parts and labor values
Joe’s ChopsItemized Billing
Finish DateVehicleVINOverhaul description
CustomerDelivery addressCity, State ZIP
Items
Stage Part ID Manuf Price Quantity Total
Parts TotalLabor
Stage Task Employee Time Cost
Labor TotalOverhead
Total Price TaxAmount Due (Price + Tax minus deposit)
Payment Method Payment Date
Figure 3

��Project Descriptions
separate. Partly because it highlights the importance of the labor that is a critical factor in his shop, and partly because he likes to see the separate totals when he looks back over old projects when estimating costs of new jobs. Notice that both the parts and labor are identified by phases of the project. For complete overhauls, these phases are relatively standard, including dismantling, work on the frame, body work, painting, interior, engine, exhaust, and electrical. The phases are used as categories that he uses to compare time and cost values across projects. For in-stance, he wants to be able to run a query that tells him the average time spent on building interiors.
Exercises1. Create the feasibility study (initial proposal).2. Create a list of all of the forms and reports that the company might use.3. Create a normalized list of tables for each form and report.4. Create an integrated list of normalized tables for the entire application. Draw
the corresponding class diagram.5. Create the basic tables in a DBMS along with all necessary relationships and
integrity constraints. Enter sample data into the tables to test your design. 6. Evaluate the normalized tables and estimate the size of the database—both
current size and estimated size in 3 years.7. List the initial security conditions for the data tables. Create a list of user
groups and identify their basic access needs.8. Design the overall structure of the application. Outline the overall structure
and the primary forms. Select a design scheme, including layouts, effects, and colors.
9. Build three initial input forms.10. Build three initial reports.11. Improve the forms and reports to make them easier to use.12. Test your forms and reports with sample users.13. Build additional forms and reports. Improve all of them. Test all of them.14. Connect all of the forms and reports into an application. Add help files. Test
all the links. Test the forms and reports. Check for consistency.15. Add security, backup and recovery, and other management features to the
application.16. Move the data tables to a centralized server, leaving the application to run on
a client. Build the necessary links and retest the application.17. Move the entire application to a Web server. Build the forms so that they run
on a Web browser.18. Create an OLAP evaluation query and graphs. Build in a way to create the
links so new annual data can be generated automatically. Link the data so that the spreadsheet is updated automatically.