data warehouse - course grade distribution user · pdf filerevision control document title:...
TRANSCRIPT

Data Warehouse User Guide Course Grade Distribution Reports
Last Revised: 7/1/16

Data Warehouse: Course Grade Distribution User Guide DRAFT
Last Revised: 07/01/16 Page ii
REVISION CONTROL
Document Title: Data Warehouse Course Grade Distribution Reports User Guide Author: IT Training & Support File Reference: UG-Data_Warehouse_Course_Grade_Distribution.docx
Revision History
Revision Date Revised By Summary of Revisions Section(s) Revised 07/01/16 Lori Arthur-
Carmichael Guide created. Click here to enter
Revision Date
Review / Approval History
Review Date Reviewed By Action (Reviewed, Recommended or Approved) 07/01/16 Joe Luzzi, Susan
Kachner, Divya Raghu, Ramesh Purohit
Approved
Data Warehouse: Course Grade Distribution User Guide DRAFT
Last Revised: 07/01/16 Page iii
Table of Contents Page
1.0 Course Grade Distribution Overview ............................................................................................................ 4
Important Information About These Reports .................................................................................................... 4
Available Reports .............................................................................................................................................. 4
2.0 Course Grade Distribution ............................................................................................................................. 5
Running the Report ........................................................................................................................................... 5
Filter Descriptions ................................................................................................................................... 5
Reading the Tables ........................................................................................................................................... 6
Course Grade Distribution Summary ...................................................................................................... 6
Course Grade Distribution Report ........................................................................................................... 7
3.0 Faculty Grade Distribution ............................................................................................................................. 8
Running the Report ........................................................................................................................................... 8
Filter Descriptions ................................................................................................................................... 8
Reading the Table ............................................................................................................................................ 9
Faculty Grade Distribution Report ........................................................................................................... 9
4.0 Faculty Grade Distribution Multi Term ....................................................................................................... 10
Running the Report ......................................................................................................................................... 10
Filter Descriptions ................................................................................................................................. 10
Reading the Table .......................................................................................................................................... 11
Faculty Grade Distribution Report (Multi Term) .................................................................................... 11
5.0 Sections with GPA < = 2.0 ............................................................................................................................ 12
Running the Report ......................................................................................................................................... 12
Filter Descriptions ................................................................................................................................. 12
Reading the Table .......................................................................................................................................... 13
Sections With GPA < = 2.0 ................................................................................................................... 13
6.0 Appendix: Grading Symbol Chart ............................................................................................................... 14

Data Warehouse: Course Grade Distribution User Guide DRAFT
Last Revised: 07/01/16 Page 4 of 14
1.0 Course Grade Distribution Overview
This user guide assumes basic knowledge of Data Warehouse. User guides and tutorials on the basic features of Data Warehouse are available at the IT Training website: http://www.fullerton.edu/ittraining/peoplesoft/dw.
Data in the Data Warehouse is refreshed nightly; therefore all Data Warehouse reports reflect numbers/information as of the previous night.
Important Information About These Reports The Course Grade Distribution reports allow users to view the grade distribution and Student Opinion Questionnaire (SOQ) data for all courses that the user has permission to view. This may include only courses taught by the user, all courses in a department, all courses in a college, or all courses on campus.
These reports exclude Open University courses and self-support (e.g. UEE) courses.
Available Reports The following reports are currently available for the Course Grade Distribution dashboard:
• Course Grade Distribution: The Course Grade Distribution report shows a summary of the course grade distribution for the college and then a breakdown of the course grade distribution and SOQ data by course and section. Users can view data for a single term.
• Faculty Grade Distribution: The Faculty Grade Distribution report shows a breakdown of the course grade distribution and SOQ data by instructor and then course/section for a single term.
• Faculty Grade Distribution Multi Term: The Faculty Grade Distribution Multi Term report shows a breakdown of the course grade distribution and SOQ data by instructor and then course/section for multiple terms.
• Sections with GPA < = 2.0: The Sections with GPA < = 2.0 report is similar to the Course Grade Distribution report but only includes sections where the average GPA for the section was less than or equal to 2.0.

Data Warehouse: Course Grade Distribution User Guide DRAFT
Last Revised: 07/01/16 Page 5 of 14
2.0 Course Grade Distribution
The Course Grade Distribution report shows a summary of the course grade distribution for the college and then a breakdown of the course grade distribution and SOQ data by course and section. Users can view data for a single term.
Processing Steps Screen Shots
Running the Report Step 1: On the Course Grade Distribution dashboard, click on the Course Grade Distribution tab.
Step 2: The report will automatically run with your personal settings if you have set them up. If you have not set up your personal settings, the report will run for the previous term and all of the college(s), department(s) and/or courses you have permission to view.
Filter Descriptions To narrow down your report results or to find a specific value, utilize the filters available on the Page. Once you have entered all of the filter criteria that you wish to use, click Apply.
For more information on how to use filters in Data Warehouse, view the Data Warehouse Filtering user guide or web tutorial.
Filter Description College The CSUF academic college; users will only see colleges that
they have permission to view.
Academic Organization
The CSUF academic organization; users will only see academic organizations that they have permission to view.
Course The title of the course (e.g. Child Development)
Term Desc The semester (e.g. Fall 2015)
Subject The course subject (e.g. HUSR)
Catalog Number
The course catalog number (e.g. 101A)
Class Number
The ID number assigned to a specific section of a course (i.e. 13741)

Data Warehouse: Course Grade Distribution User Guide DRAFT
Last Revised: 07/01/16 Page 6 of 14
Reading the Tables
Course Grade Distribution Summary
To switch between the Percentage and Count options, use the drop-down menu just above the table.
The Course Grade Distribution Report – College Summary table shows the overall grade distribution for the college(s) selected by the percentage or count of enrolled students who earned each grade.
Field Description GPA The average GPA for all students enrolled in courses in the specified college for the
term selected
Enroll Count The total number of students enrolled in courses in the specified college for the term selected
Academic Group The academic college or course grouping
Grading Symbol Columns (e.g. A+ through OTHR)
The percentage or count of students enrolled in the selected college who received the grade listed in the column header for the term selected (e.g. the percentage of enrolled students who received an A+ in an ARTS course in Fall 2015 or the number of enrolled students who received a C+ in an HHD course in Fall 2015)

Data Warehouse: Course Grade Distribution User Guide DRAFT
Last Revised: 07/01/16 Page 7 of 14
Course Grade Distribution Report
To switch between the Percentage and Count options, use the drop-down menu just above the table.
The Course Grade Distribution Report table shows the grade distribution for each section of each course and the Student Opinion Questionnaire (SOQ) results for each section of each course.
You may click on the Faculty name to view the course grade distribution information for all sections of all courses that faculty member taught for the selected term.
Field Description Subject The course subject (e.g. HUSR)
Catalog Number The course catalog number (e.g. 101A)
Course The title of the course (e.g. Child Development)
Max Units The maximum number of units a student can earn for the course
Section The course section number (e.g. 01)
Class Number The ID number assigned to a specific section of a course (e.g. 13741)
Faculty The primary instructor granted the ability to assign and approve grades for the course
GPA The average GPA for all students enrolled in the course section for the term selected
Enroll Count The total number of students enrolled in the course section for the term selected. Grade
Grading Symbol Columns (e.g. A+ through OTHR)
The percentage or count of students enrolled in the selected course section who received the grade listed in the column header for the term selected (e.g. the percentage or number of enrolled students who received an A+ in CAS 101 in Fall 2015).
SOQ
Mean The mean of the responses on the SOQ
Type The type of SOQ that the students completed: paper or online
Deviation The standard deviation of the responses on the SOQ
Total Reps The total number of responses received for all questions from all students who completed an SOQ for this course
A through E The percentage of students who rated the instructor at each data point on the Likert scale on the SOQ. Typically A reflects a higher/positive rating and E is a low/negative rating.

Data Warehouse: Course Grade Distribution User Guide DRAFT
Last Revised: 07/01/16 Page 8 of 14
3.0 Faculty Grade Distribution
The Faculty Grade Distribution report shows a breakdown of the course grade distribution and SOQ data by instructor and then course/section for a single term.
Processing Steps Screen Shots
Running the Report Step 1: On the Course Grade Distribution dashboard, click on the Faculty Grade Distribution tab.
Step 2: The report will automatically run with your personal settings if you have set them up. If you have not set up your personal settings, the report will run for the previous term and all of the college(s), department(s) and/or courses you have permission to view.
Filter Descriptions To narrow down your report results or to find a specific value, utilize the filters available on the Page. Once you have entered all of the filter criteria that you wish to use, click Apply.
For more information on how to use filters in Data Warehouse, view the Data Warehouse Filtering user guide or web tutorial.
Filter Description College The CSUF academic college; users will only see colleges that
they have permission to view.
Academic Organization Description
The CSUF academic organization; users will only see academic organizations that they have permission to view.
Course The title of the course (e.g. Child Development)
Term Desc The semester (e.g. Fall 2015)
Subject The course subject (e.g. HUSR)
Catalog Number
The course catalog number (e.g. 101A)
Class Number
The ID number assigned to a specific section of a course (i.e. 13741)
Instructor The primary instructor granted the ability to assign and approve grades for the course

Data Warehouse: Course Grade Distribution User Guide DRAFT
Last Revised: 07/01/16 Page 9 of 14
Reading the Table
Faculty Grade Distribution Report
To switch between the Percentage and Count options, use the drop-down menu just above the table.
The Faculty Grade Distribution Report table shows each faculty member and the grade distribution and the Student Opinion Questionnaire (SOQ) results for each course section that they taught during the term selected.
Field Description Faculty The name of the faculty member who was the instructor of record for the course
section for the selected term
Class Number The ID number assigned to a specific section of a course (e.g. 13741)
Subject The course subject (e.g. HUSR)
Catalog Number The course catalog number (e.g. 101A)
Section The course section number (e.g. 01)
Max Units The maximum number of units a student can earn for the course
GPA The average GPA for the course section for the term selected.
Enroll Count The total number of students enrolled in the course section for the term selected.
Grade Grading Symbol Columns (e.g. A+ through OTHR)
The percentage or count of students enrolled in the selected course section who received the grade listed in the column header for the term selected (e.g. the percentage or number of enrolled students who received an A+ in CAS 101 in Fall 2015).
SOQ
Mean The mean of the responses on the SOQ
Type The type of SOQ that the students completed: paper or online
Deviation The standard deviation of the responses on the SOQ
Total Reps The total number of responses received for all questions from all students who completed an SOQ for this course
A through E The percentage of students who rated the instructor at each data point on the Likert scale on the SOQ. Typically A reflects a higher/positive rating and E is a low/negative rating.

Data Warehouse: Course Grade Distribution User Guide DRAFT
Last Revised: 07/01/16 Page 10 of 14
4.0 Faculty Grade Distribution Multi Term
The Faculty Grade Distribution Multi Term report shows a breakdown of the course grade distribution and SOQ data by instructor and then course/section for multiple terms.
Processing Steps Screen Shots
Running the Report Step 1: On the Course Grade Distribution dashboard, click on the Faculty Grade Distribution Multi Term tab.
Step 2: The report will automatically run with your personal settings if you have set them up. If you have not set up your personal settings, the report will run for the previous two similar terms (e.g. Fall 2015 and Fall 2014 or Spring 2015 and Spring 2014) and all of the college(s), department(s) and/or courses you have permission to view.
Filter Descriptions To narrow down your report results or to find a specific value, utilize the filters available on the Page. Once you have entered all of the filter criteria that you wish to use, click Apply.
For more information on how to use filters in Data Warehouse, view the Data Warehouse Filtering user guide or web tutorial.
Filter Description College The CSUF academic college; users will only see colleges that
they have permission to view.
Academic Organization Description
The CSUF academic organization; users will only see academic organizations that they have permission to view.
Course The title of the course (e.g. Child Development)
Term Desc The semesters (e.g. Fall 2015; Fall 2014). Use this filter to check those terms you want to compare (unchecking any terms you do not want to compare). You may check as many terms as you like to include in the comparison.
Subject The course subject (e.g. HUSR)
Catalog Number
The course catalog number (e.g. 101A)
Class Number
The ID number assigned to a specific section of a course (i.e. 13741)
Instructor The primary instructor granted the ability to assign and approve grades for the course

Data Warehouse: Course Grade Distribution User Guide DRAFT
Last Revised: 07/01/16 Page 11 of 14
Reading the Table
Faculty Grade Distribution Report (Multi Term)
To switch between the Percentage and Count options, use the drop-down menu just above the table.
The Faculty Grade Distribution Report Multi Term table shows each faculty member and the grade distribution and the Student Opinion Questionnaire (SOQ) results for each course section that they taught during the terms selected.
Field Description Faculty The primary instructor granted the ability to assign and approve grades for the course
Term Desc The terms selected for the report
Class Number The ID number assigned to a specific section of a course (e.g. 13741)
Subject The course subject (e.g. HUSR)
Catalog Number The course catalog number (e.g. 101A)
Section The course section number (e.g. 01)
Max Units The maximum number of units a student can earn for the course
GPA The average GPA for the course section for the term selected.
Enroll Count The total number of students enrolled in the course section for the term selected.
Grade Grading Symbol Columns (e.g. A+ through OTHR)
The percentage or count of students enrolled in the selected course section who received the grade listed in the column header for the term selected (e.g. the percentage or number of enrolled students who received an A+ in CAS 101 in Fall 2015).
SOQ
Mean The mean of the responses on the SOQ
Type The type of SOQ that the students completed: paper or online
Deviation The standard deviation of the responses on the SOQ
Total Reps The total number of responses received for all questions from all students who completed an SOQ for this course
A through E The percentage of students who rated the instructor at each data point on the Likert scale on the SOQ. Typically A reflects a higher/positive rating and E is a low/negative rating.
Data Warehouse: Course Grade Distribution User Guide DRAFT
Last Revised: 07/01/16 Page 12 of 14
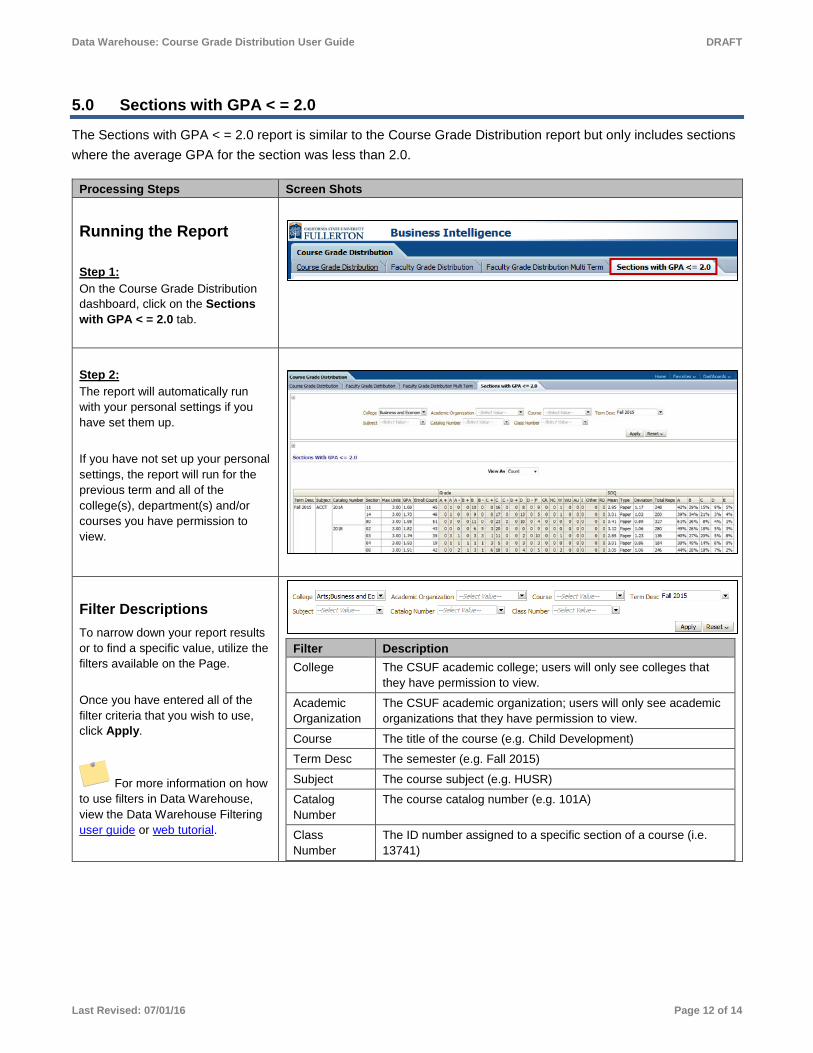
5.0 Sections with GPA < = 2.0
The Sections with GPA < = 2.0 report is similar to the Course Grade Distribution report but only includes sections where the average GPA for the section was less than 2.0.
Processing Steps Screen Shots
Running the Report Step 1: On the Course Grade Distribution dashboard, click on the Sections with GPA < = 2.0 tab.
Step 2: The report will automatically run with your personal settings if you have set them up. If you have not set up your personal settings, the report will run for the previous term and all of the college(s), department(s) and/or courses you have permission to view.
Filter Descriptions To narrow down your report results or to find a specific value, utilize the filters available on the Page. Once you have entered all of the filter criteria that you wish to use, click Apply.
For more information on how to use filters in Data Warehouse, view the Data Warehouse Filtering user guide or web tutorial.
Filter Description College The CSUF academic college; users will only see colleges that
they have permission to view.
Academic Organization
The CSUF academic organization; users will only see academic organizations that they have permission to view.
Course The title of the course (e.g. Child Development)
Term Desc The semester (e.g. Fall 2015)
Subject The course subject (e.g. HUSR)
Catalog Number
The course catalog number (e.g. 101A)
Class Number
The ID number assigned to a specific section of a course (i.e. 13741)

Data Warehouse: Course Grade Distribution User Guide DRAFT
Last Revised: 07/01/16 Page 13 of 14
Reading the Table
Sections With GPA < = 2.0
To switch between the Percentage and Count options, use the drop-down menu just above the table.
The Sections with GPA < = 2.0 table shows the course grade distribution and the Student Opinion Questionnaire (SOQ) results for each course section with an average GPA of less than or equal to 2.0 for the term selected.
Field Description Term Desc The term selected for the report
Subject The course subject (e.g. HUSR)
Catalog Number The course catalog number (e.g. 101A)
Max Units The maximum number of units a student can earn for the course
Section The course section number (e.g. 01)
GPA The average GPA for the course section for the term selected.
Enroll Count The total number of students enrolled in the course section for the term selected. Grade
Grading Symbol Columns (e.g. A+ through OTHR)
The percentage or count of students enrolled in the selected course section who received the grade listed in the column header for the term selected (e.g. the percentage or number of enrolled students who received an A+ in CAS 101 in Fall 2015).
SOQ
Mean The mean of the responses on the SOQ
Type The type of SOQ that the students completed: paper or online
Deviation The standard deviation of the responses on the SOQ
Total Reps The total number of responses received for all questions from all students who completed an SOQ for this course
A through E The percentage of students who rated the instructor at each data point on the Likert scale on the SOQ. Typically A reflects a higher/positive rating and E is a low/negative rating.

Data Warehouse: Course Grade Distribution User Guide DRAFT
Last Revised: 07/01/16 Page 14 of 14
6.0 Appendix: Grading Symbol Chart
This grading symbol chart details all of the grading symbols that may appear on the Course Grade Distribution Reports, including historical grading symbols that are now obsolete and when particular grading symbols (such as plus/minus grades) began to appear.
Grade Obsolete? Description (if other than A-F) A+ No Plus/minus grading began Spring 2005
A No
A- No Plus/minus grading began Spring 2005
AU No Audit
B+ No Plus/minus grading began Spring 2005
B No
B- No Plus/minus grading began Spring 2005
C+ No Plus/minus grading began Spring 2005
C No
C- No Plus/minus grading began Spring 2005
CR No Credit (includes credit-by-exam; need to also look at student’s grading basis of CBE to know it is credit-by-exam)
D+ No Plus/minus grading began Spring 2005
D No
D- No Plus/minus grading began Spring 2005
E Yes, as of Fall 1973 Incomplete (we now use I)
F No
F* Yes, as of Fall 1977 Unofficial Withdrawal (we now use WU)
I No Incomplete
IC No Incomplete Charged (used when an incomplete grade expires and becomes the equivalent of an F)
IP No In Progress
NC No No Credit
NC* No No Credit – Unofficial Withdrawal (like WU but used for credit/no credit classes)
NG No No Grade
NP Yes, as of Fall 1973 No Pass (we now use NC)
NR Yes, as of Spring 1974 No Report (we now use WU)
P Yes, as of Fall 1973 Pass (we now use CR)
RD No Report Delayed (enrollment is still considered in progress)
RP No For all classes other than Early Start: Report in Progress; For Early Start Classes: work satisfactory to date.
SP Yes, as of Fall 2002 Satisfactory Progress (we now use RP)
U Yes, as of Summer 2003 Unauthorized Incomplete (we now use WU)
W No Withdrawn
WF Yes, as of Fall 1991 Withdraw Failing (we now use W)
WU No Withdrawn Unauthorized (student did not withdraw from the course and failed to complete the course)