data visualization: a quick tour for data science enthusiasts
TRANSCRIPT

Krist Wongsuphasawat /@kristw
visualizationdataA quick tour for data science enthusiasts

visualizationdataWhat is it about?
What is it good for?
How is it related to data science?
Example projects
…

1. What is it about?

“A picture is worth more than a thousand words.”
— ใครสักคนได้กล่าวไว้


Data Picture
Data Visual display
Help audience consume a lot of information rapidlyData Visual display

2. What is it good for?

Example / History

data


location (lat,lon => x,y), quantity of troops (width), direction (color) time (x), temperature (y)

Example / Cholera epidemic

List of deceased patients !
Mr. Smith, who lived at 11 Sunny St. Miss White, who lived at 23 Cloudy Rd.
Mr. Jones, who lived at 30 Rainy St. Mrs. Robinson, who lived at 34 Windy Rd.
…
data

John Snow


What is it good for?
Storytelling Communicate known information
Exploratory data analysis Explore data to reveal insights

More powerfulVisualization = Visual display + Interaction

3. How is it related to data science?

Turn data into
valuable insightsdata product
interesting stories

data wrangling
output insights, products, stories
exploratory data analysis
report results
raw data
in-depth analysis

data wrangling
output insights, products, stories
exploratory data analysis
report results
in-depth analysis
communication, storytelling
raw data

4. Example projects

4.1 Ballon d’Or


FIFA released voting data

• 3 voters / country
• National team captain
• National team coach
• Journalist (media)
• Each voter select 3 players for 1st, 2nd and 3rd place
Rules


data wrangling
output insights, products, stories
exploratory data analysis
report results
in-depth analysis
communication, storytelling
raw data

• Given data are tables in PDF.
• Extract to csv
• Format data to desired format.
Data Wrangling

Demo / Ballon d’Orhttps://medium.com/@kristw/who-voted-for-who-diving-into-ballon-dor-voting-data-e09138ba9712

4.2 Public-facing vis & New year 2013


GeoHeatmap
Low density
High density
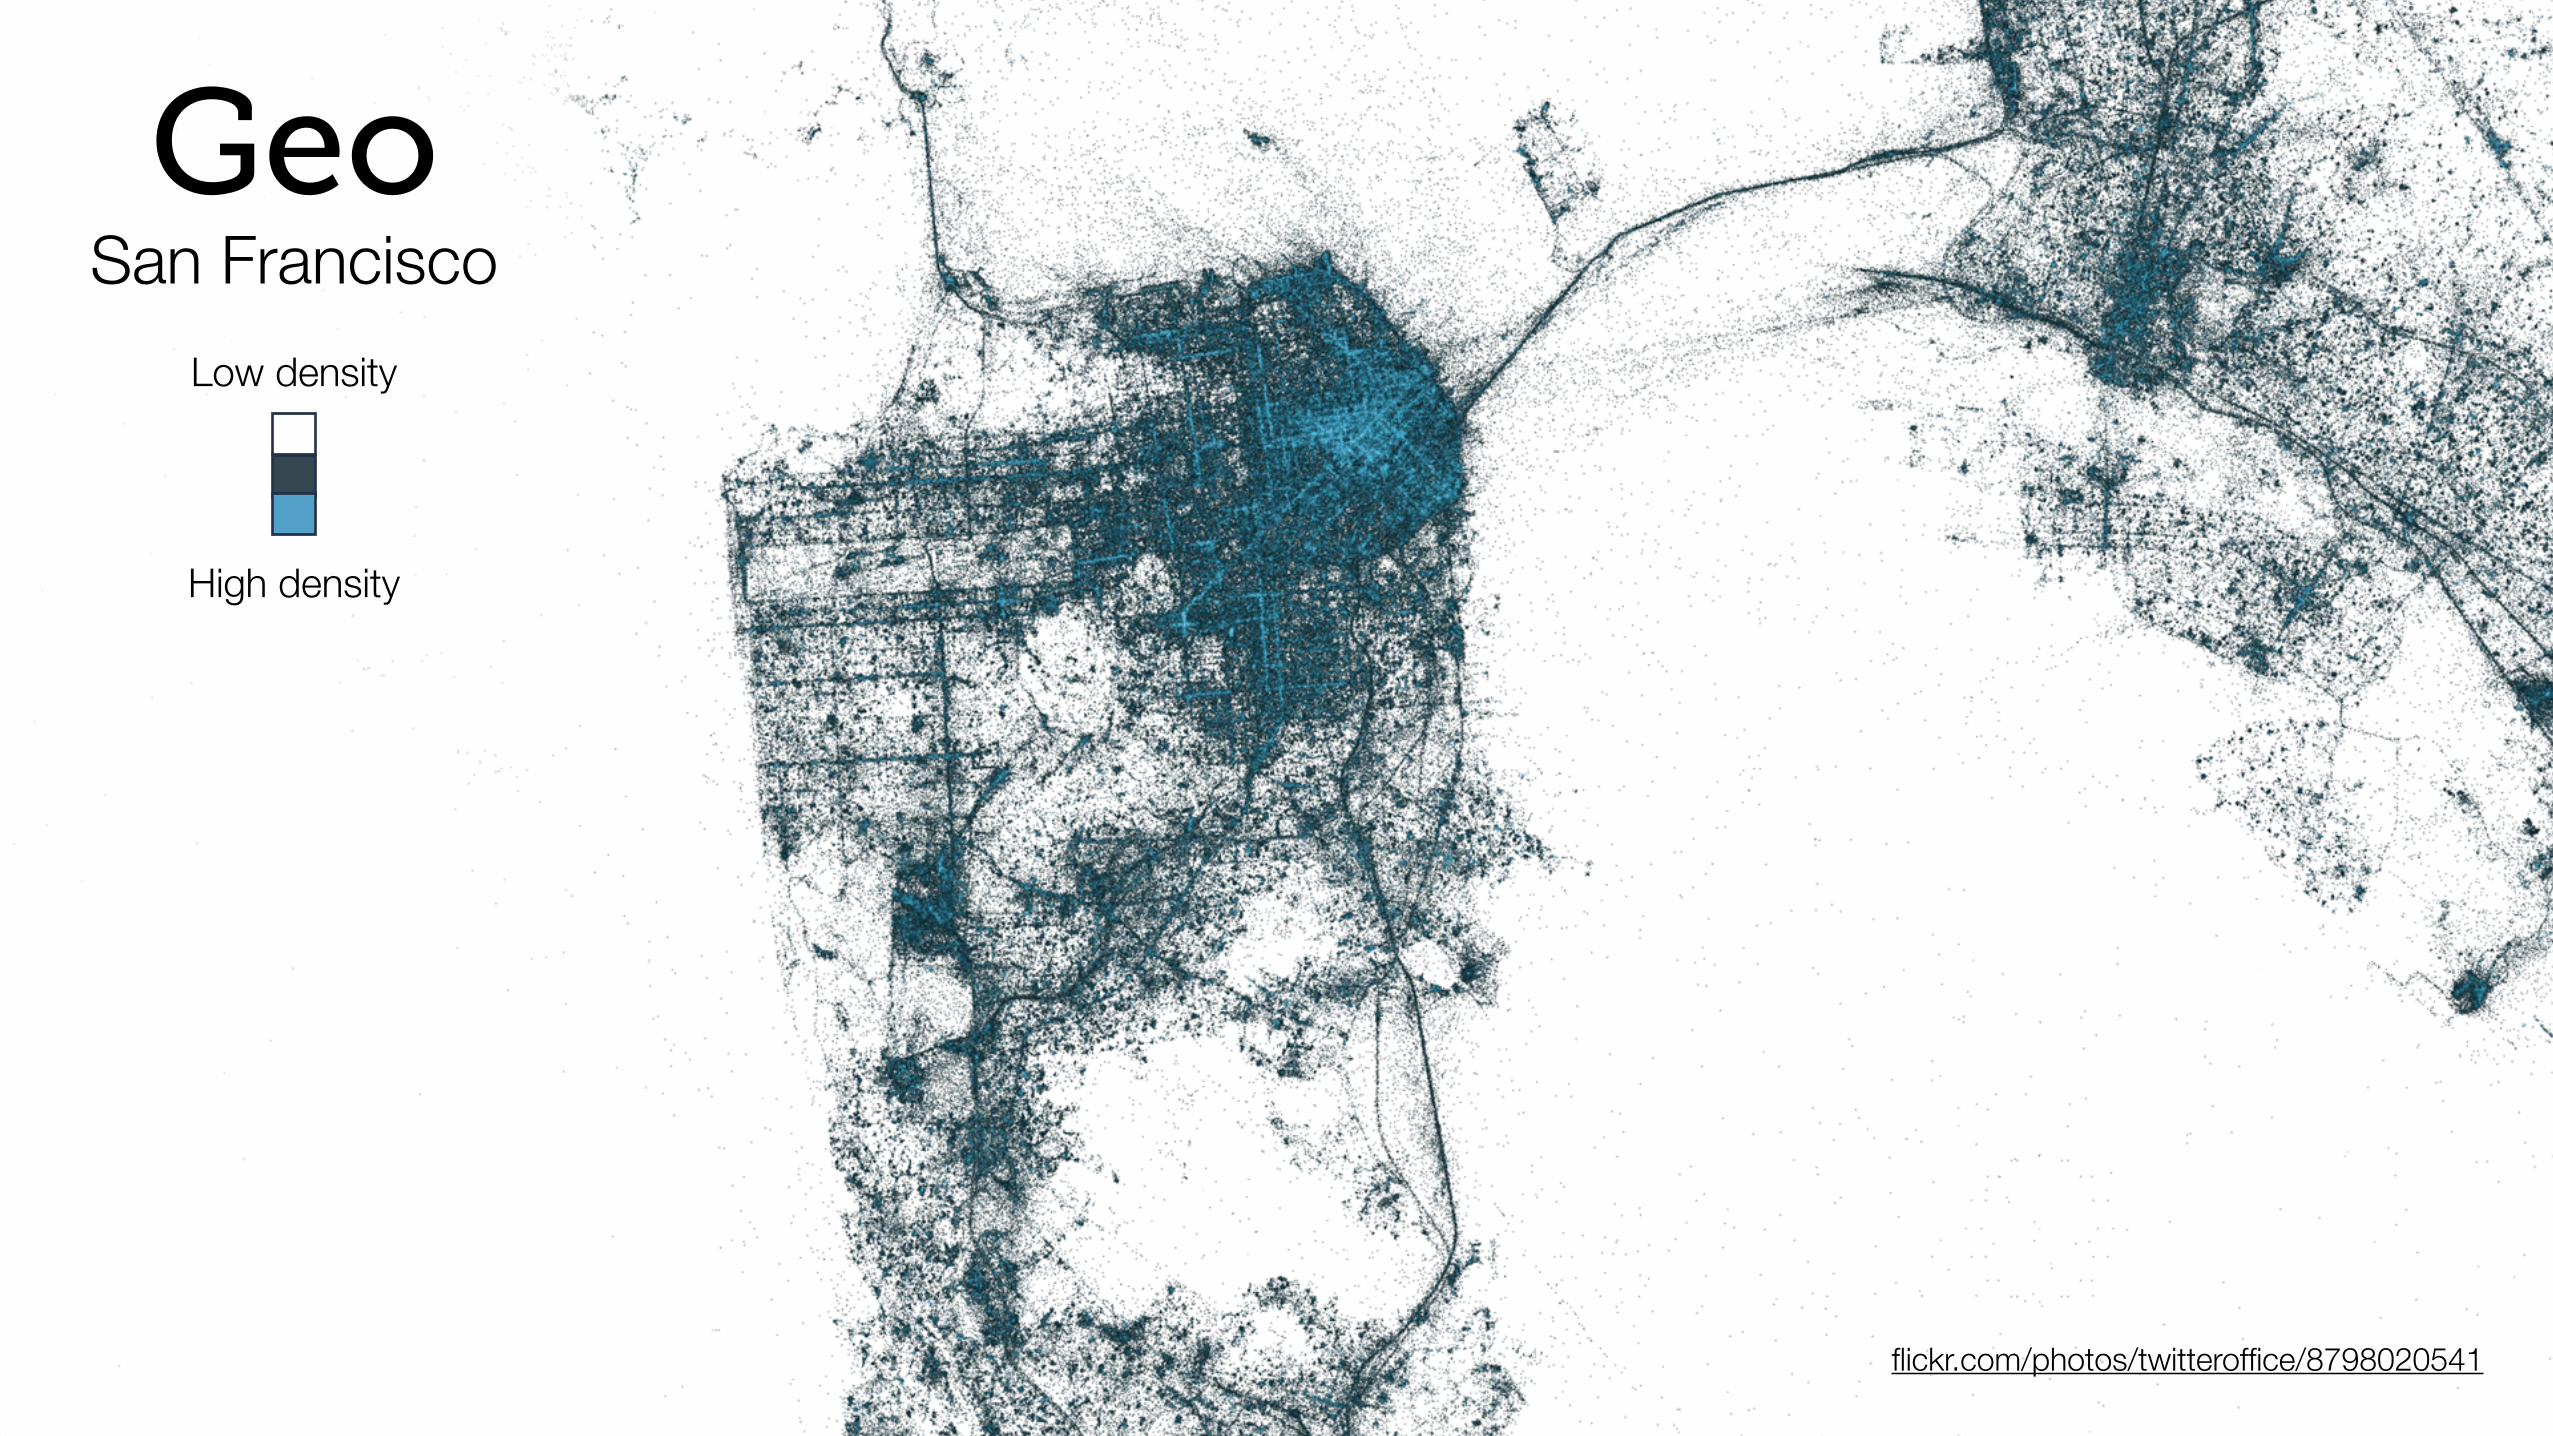
GeoSan Francisco
flickr.com/photos/twitteroffice/8798020541
Low density
High density

GeoSan Francisco
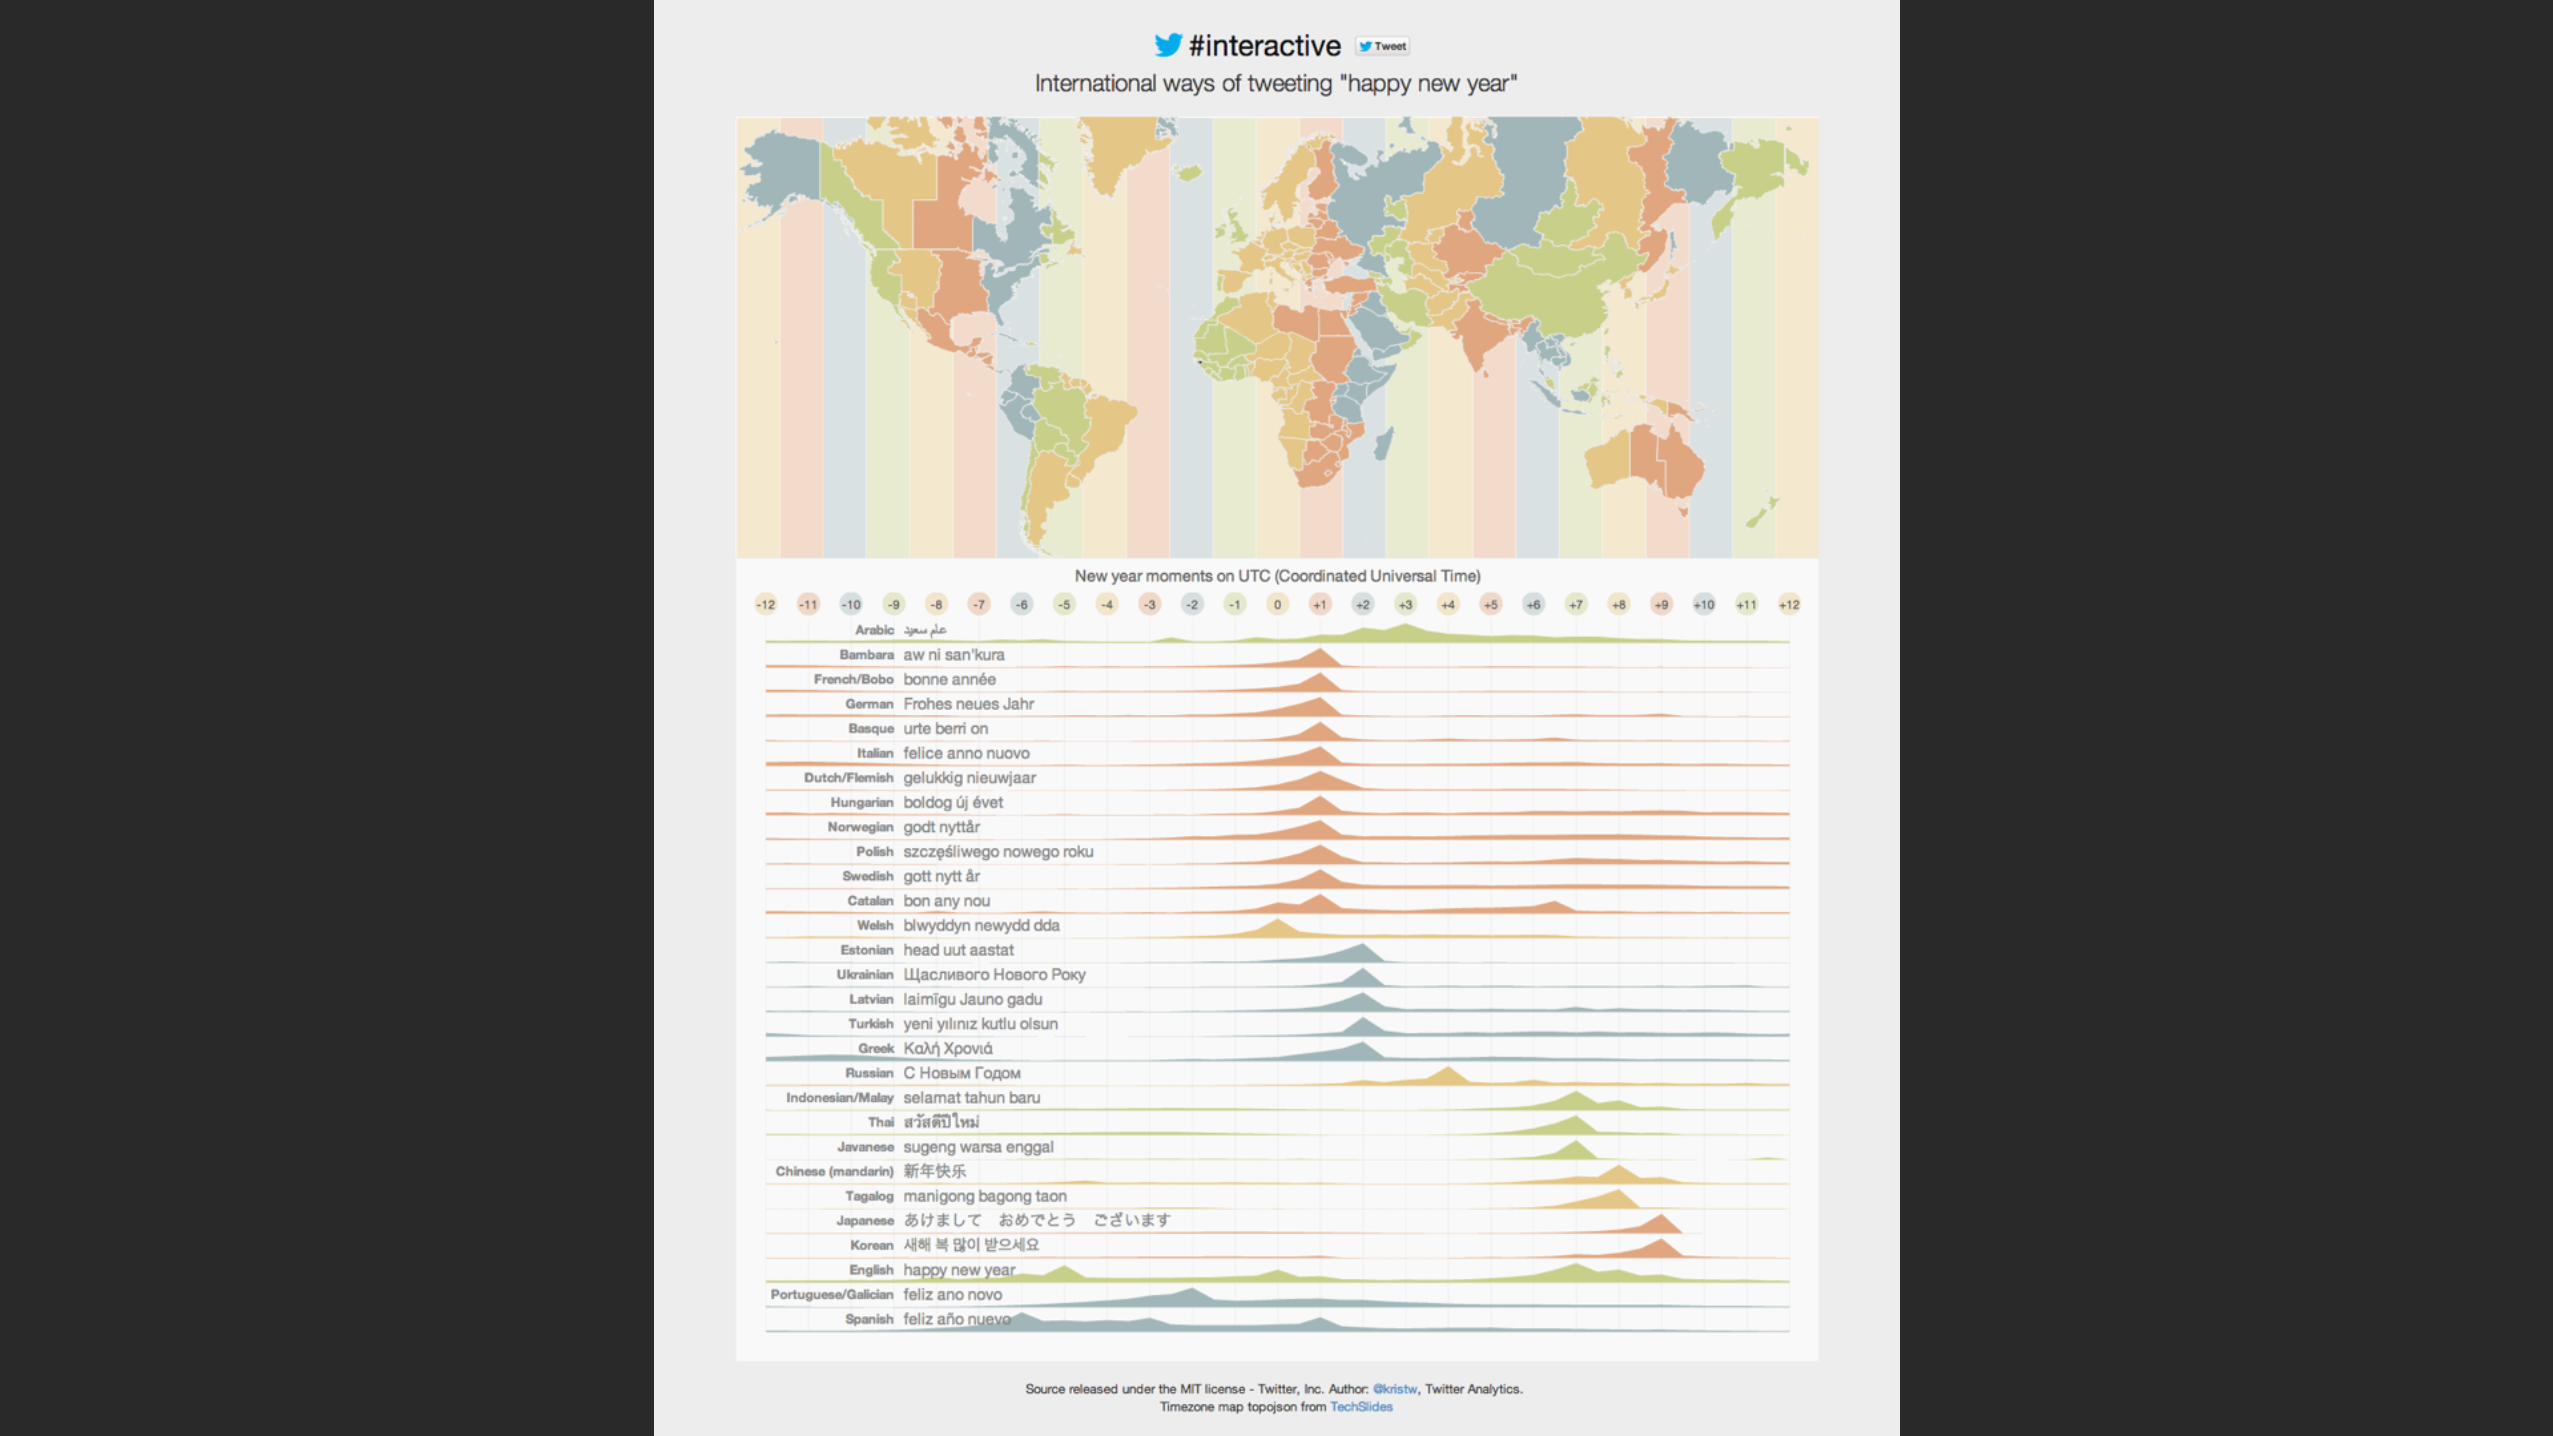
Rebuild the world based on
tweet volumes
twitter.github.io/interactive/andes/

How are these phrases used in Tweets? Is there any pattern?

data wrangling
output insights, products, stories
exploratory data analysis
report results
in-depth analysis
communication, storytelling
raw data

Big data wrangling

Having all TweetsHow people think I feel.

How people think I feel. How I really feel.
Having all Tweets

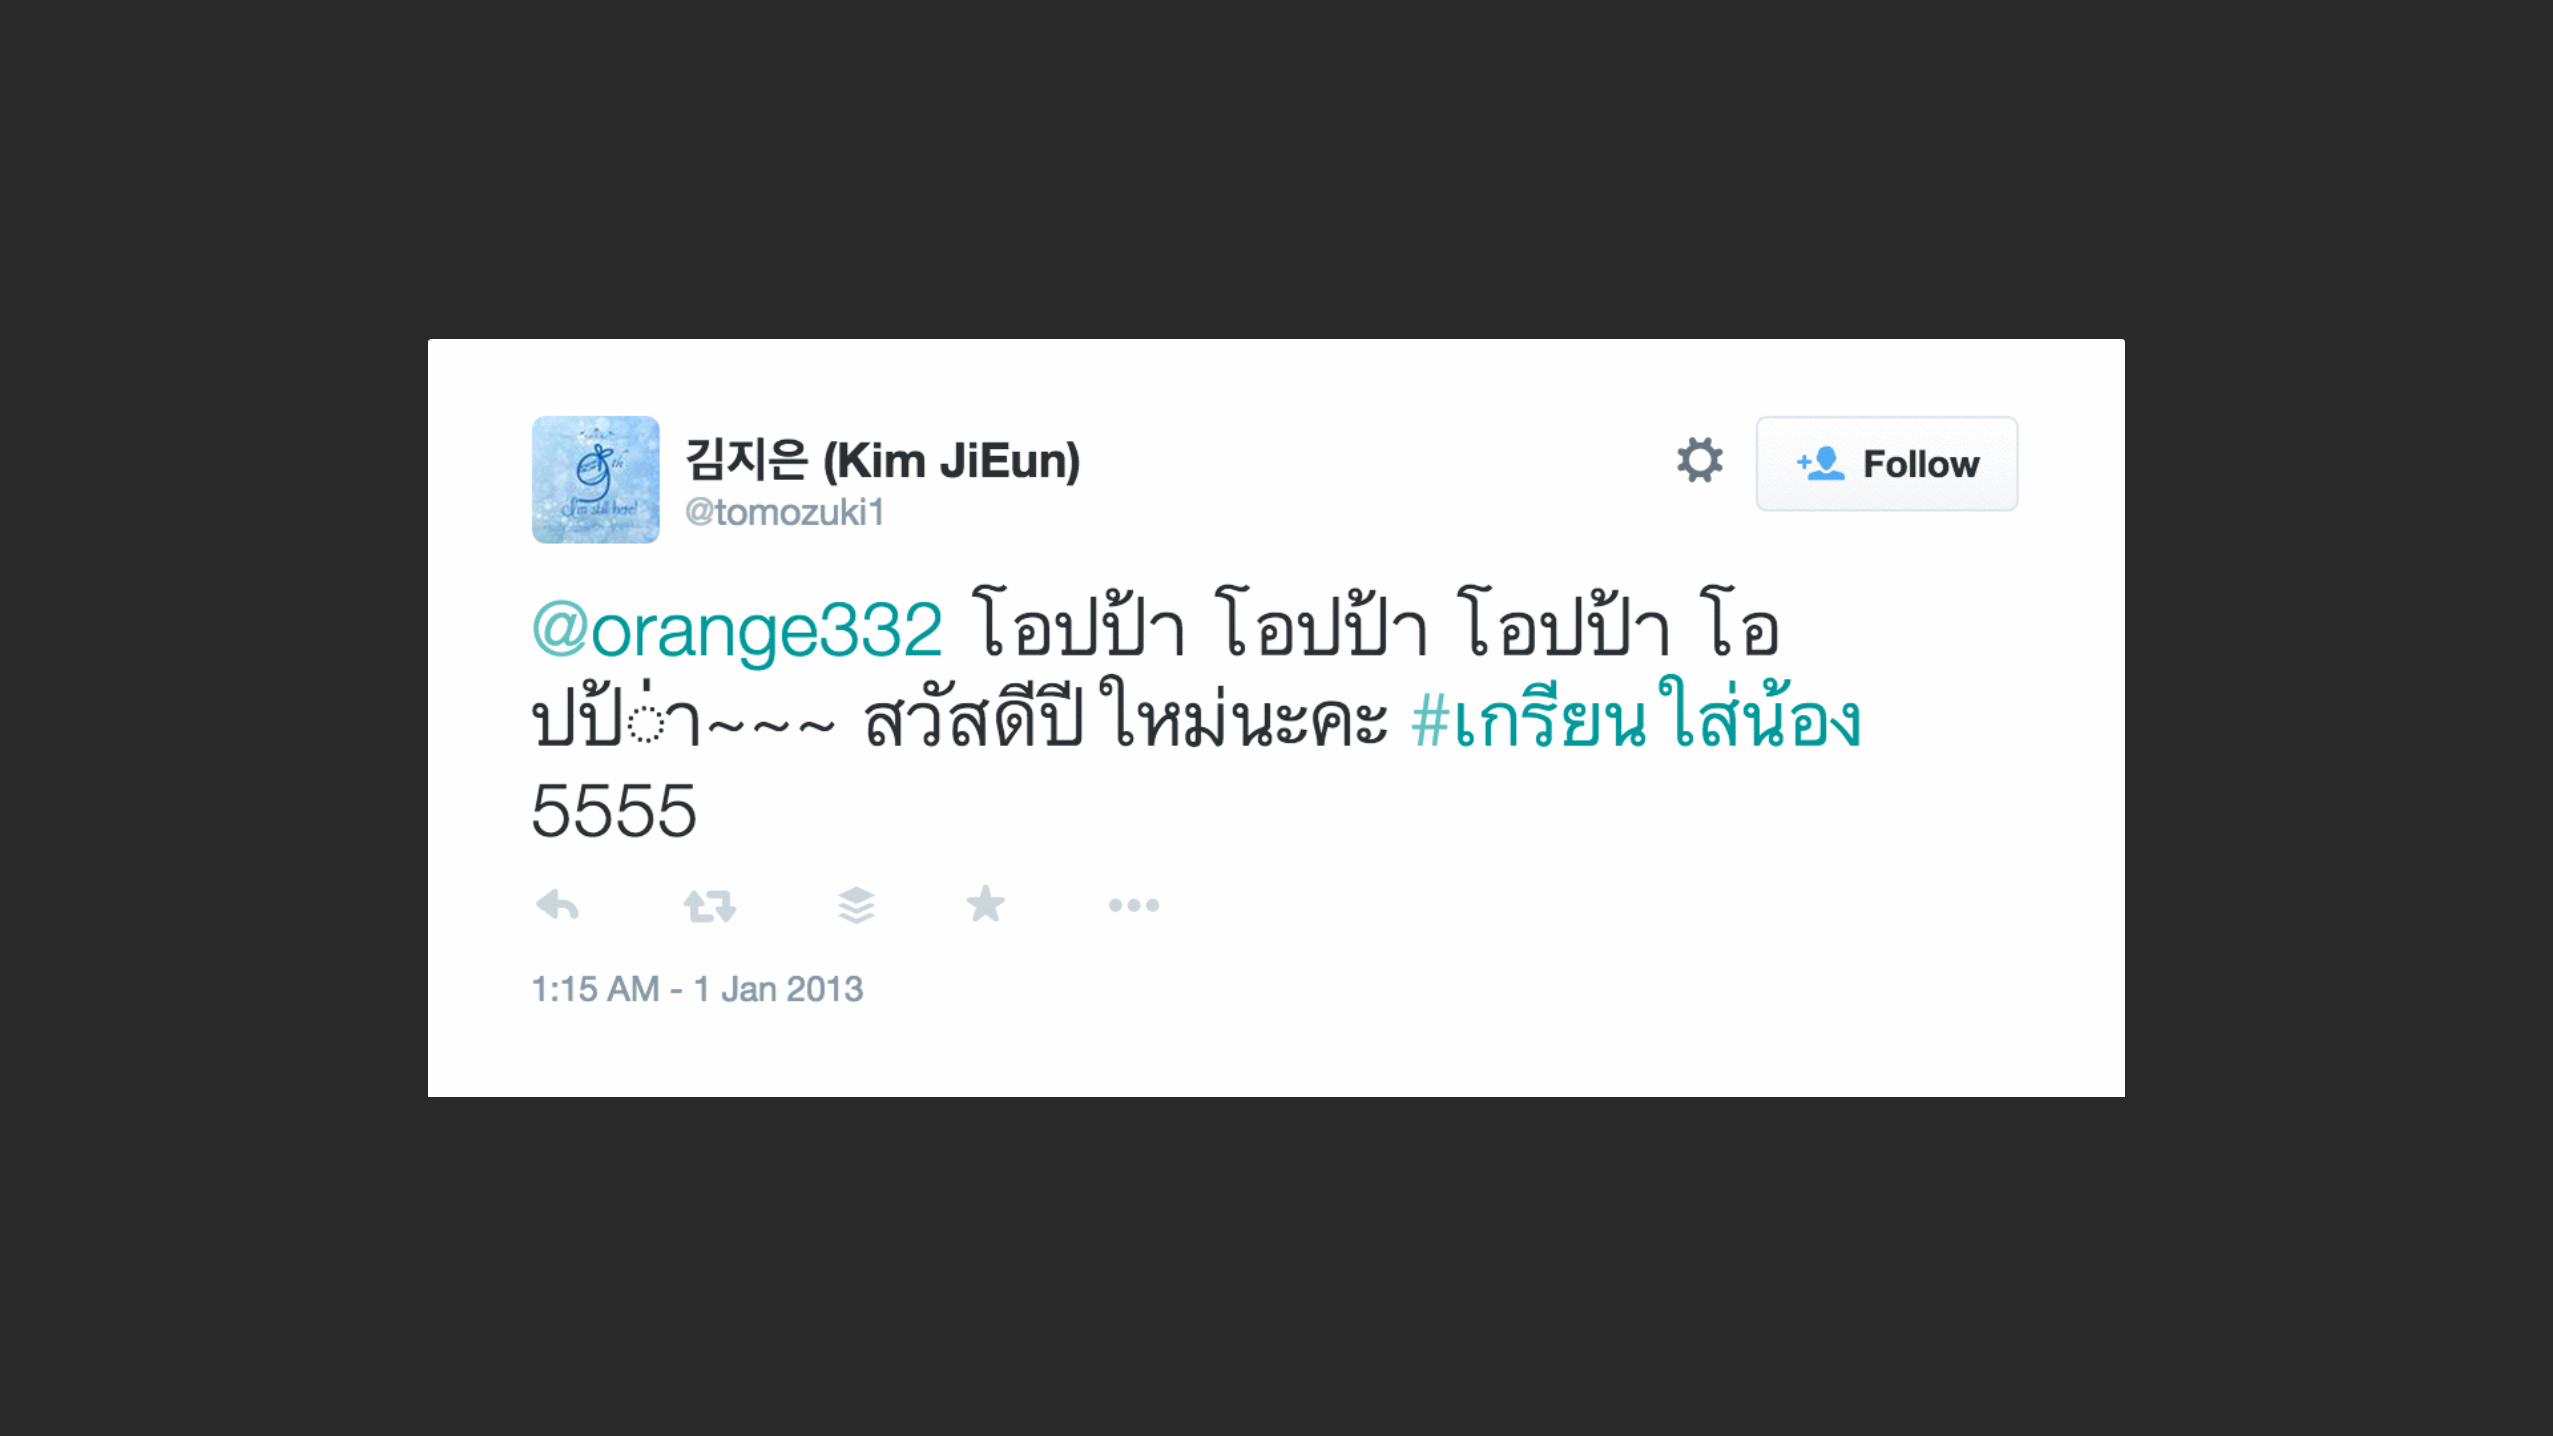
• Too much data, want only relevant Tweets
• contain “สวัสดีปีใหม่”
• variations: หวัดดีปีใหม่, หวัดดีปีหม่ายยย
• typos: หวัดตีปีใหม่
• Need to aggregate & reduce size
• Long processing time (hours)
Challenges

Hadoop ClusterData Storage
Workflow

Hadoop Cluster
Pig / Hive / Scalding (slow)
Data Storage
Tool
Workflow

Hadoop Cluster
Pig / Hive / Scalding (slow)
Data Storage
Tool
Workflow

Hadoop Cluster
Pig / Hive / Scalding (slow)
Data Storage
Tool
Smaller datasetYour laptop
Workflow

Hadoop Cluster
Pig / Hive / Scalding (slow)
Data Storage
Tool
Final dataset
Tool node.js / python / etc. (fast)
Your laptop
Workflow
Smaller dataset

Exploratory Data Analysis

Improve design for releasing to public


Demo / New Year 2013twitter.github.io/interactive/newyear2014/


Another fun fact: Developed using 2012 data
Then update data on Jan 2, 2013

4.3 Data Analysis Tool

data wrangling
output insights, products, stories
exploratory data analysis
report results
in-depth analysis
communication, storytelling
raw data
Logging user activities

UsersUseTwitter

UsersUse
Product Managers
Curious

UsersUse
Curious
Engineers
Log datain Hadoop Write Twitter
Instrument
Product Managers

What are being logged?
tweetactivities

What are being logged?
tweet from home timeline on twitter.com tweet from search page on iPhone
activities

What are being logged?
tweet from home timeline on twitter.com tweet from search page on iPhone
sign up log in
retweet etc.
activities

Organize?

log event a.k.a. “client event”
[Lee et al. 2012]

log event a.k.a. “client event”
client : page : section : component : element : actionweb : home : timeline : tweet_box : button : tweet
1) User ID 2) Timestamp 3) Event name
4) Event detail
[Lee et al. 2012]

Twitter for Banana

Count page visits
banana : home : - : - : - : impressionhome page

User sessionsSession#1
A
B
start
end
Session#4
start
end
A
Session#2
B
start
end
A
Session#3
C
start
end
Aclient event
client event

Funnel
home page
profile page

Funnel analysis
banana : home : - : - : - : impression
banana : profile : - : - : - : impression
1 jobhome page
profile page
1 hour

Funnel analysis
banana : home : - : - : - : impression
banana : profile : - : - : - : impression banana : search : - : - : - : impression
home page
profile page search page
2 jobs2 hours

Funnel analysis
banana : home : - : - : - : impression
banana : profile : - : - : - : impression banana : search : - : - : - : impression
home page
profile page search page
Specify all funnels manually!
n jobsn hours

Goal
banana : home : - : - : - : impression
… ……
1 job => all funnels, visualized
home page

User sessionsSession#1
A
B
start
end
Session#4
start
end
A
Session#2
B
start
end
A
Session#3
C
start
end
A

Aggregate4 sessions
A
BB C
start
end endend
A A
end
A

Aggregate
A
BB C
start
end endend
end
4 sessions

Aggregate
C
start
end endend
end
A
B
4 sessions

Aggregate
C
start
end endend
end
A
B
4 sessions

Aggregate
C
start
end endend
A
B end
4 sessions

Aggregate
C
start
endend
A
B end
4 sessions

Aggregate
C
start
endend
A
B end
4 sessions

Aggregate
start
endend
A
CB end
4 sessions

Aggregate
4,000,000 sessions
endend
A
CB end
start

Demo / Flying SessionsUsing Visualizations to Monitor Changes and Harvest Insights from a Global-Scale Logging
Infrastructure at Twitter by Krist Wongsuphasawat and Jimmy Lin. in Proc. IEEE Conference on Visual Analytics Science and Technology (VAST), Paris, France, 13 November, 2014

visualizationdataWhat is it about?
Data => Visual display + Interaction
What is it good for? Exploratory data analysis & storytelling
How is it related to data science? It is one of the skills often utilized in the process.
Example projects
interactive.twitter.com @kristw / kristw.yellowpigz.com

Thank you

Questions?