data that sings only in seattle presentation oct 9 2014
TRANSCRIPT

A S S E S S I N G T R E N D S T H R O U G H N E I G H B O R H O O D P R O F I L E S
Data That Sings
Brought To You By

Overview
Assessing data sources
Data source examples
Only in Seattle data project
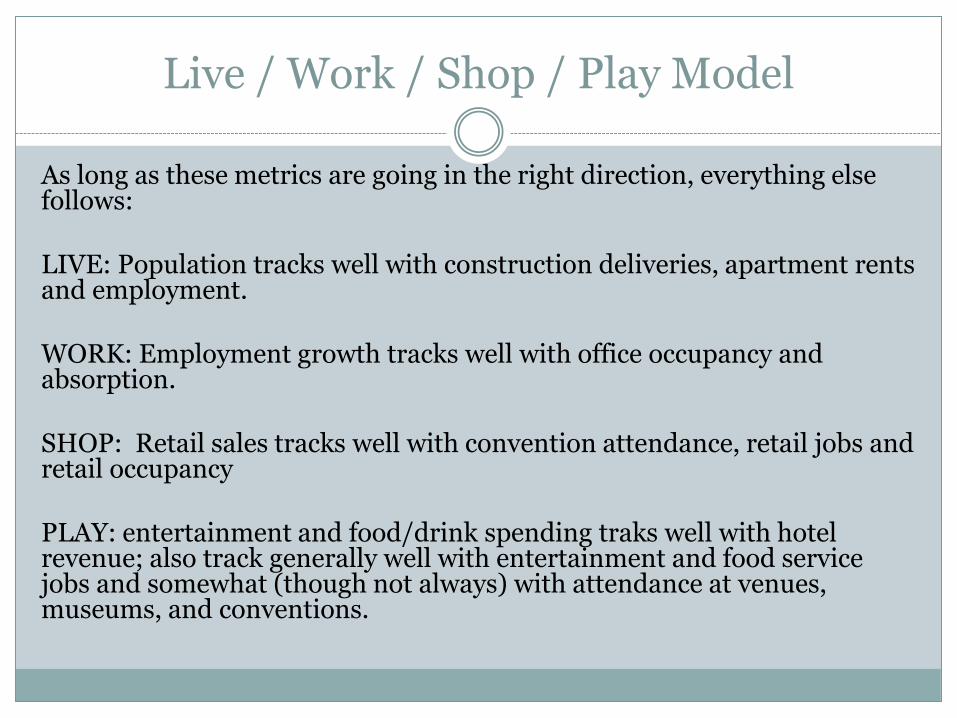
Live / Work / Shop / Play Model
As long as these metrics are going in the right direction, everything else follows: LIVE: Population tracks well with construction deliveries, apartment rents and employment. WORK: Employment growth tracks well with office occupancy and absorption. SHOP: Retail sales tracks well with convention attendance, retail jobs and retail occupancy PLAY: entertainment and food/drink spending traks well with hotel revenue; also track generally well with entertainment and food service jobs and somewhat (though not always) with attendance at venues, museums, and conventions.

The “Dashboard”
What is it?
- An overview
- Intuitive
- Easy to read
- Quickly understood

Assessing Data Sources
What are your boundaries?
How well do Census tracts match?

Assessing Data Sources (cont’d)
Can you replicate this each year?
The most important thing when trending is to have apples-to-apples data each year.
Mixing sources = NOT ideal
Understand the limitations of your data

Assessing Data Sources (cont’d)
Paid versus free sources
Paid Sources Free Sources
Easier to use No Cost
Quicker to use More transparent methodology
May have more current estimates Historic data usually more readily available
Not subject to federal funding changes Most paid services are largely based on free sources
Boundaries (usually) more customizable Widely used and recognized

Data Sources: Some Examples
Subscription Services (Esri)
Government Websites (e.g. Census Bureau)
Direct Requests (Department of Revenue, PSRC)


To look up industry codes: http://www.naics.com/search/

Making Data Requests

Employment Data
Puget Sound Regional Council Estimates Usually slightly more up-to-date than alternate source.
On the map application Intuitive interface
Includes other data than employee counts
Commute patterns
Wages
Race, Age, Sex of workers
Can view by number of workers or number of jobs (some workers have multiple jobs)
Can view worker data by place of employment or place of residence

Tutorial: On the Map
Use to zoom in
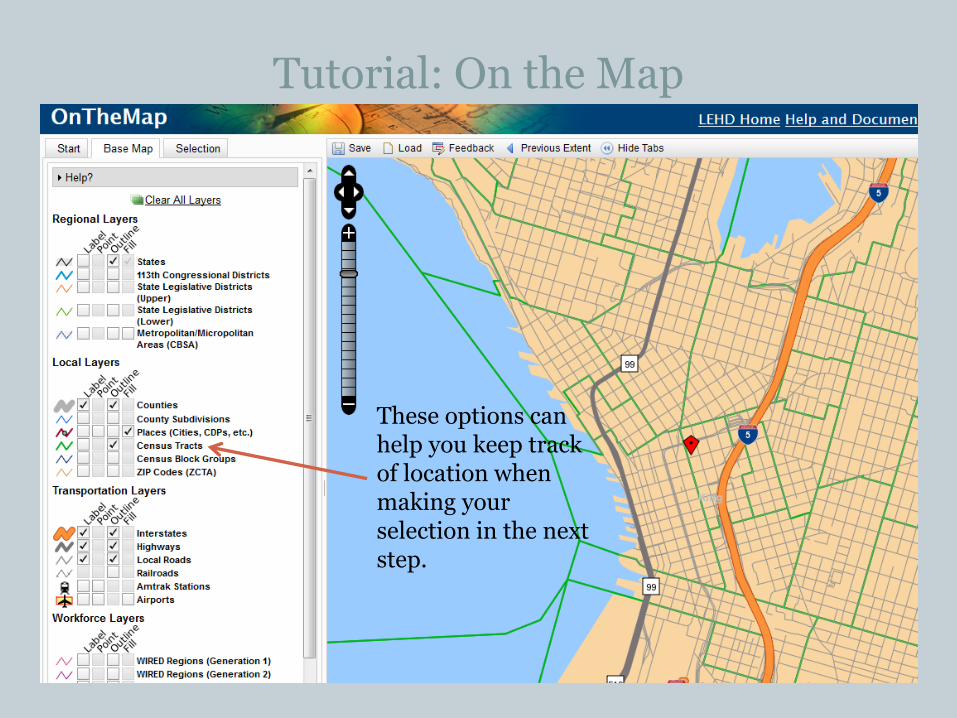
Tutorial: On the Map
These options can help you keep track of location when making your selection in the next step.

Tutorial: On the Map
How would you like to select?
What would you like to select?

Tutorial: On the Map

Tutorial: On the Map

Tutorial: On the Map

Tutorial: On the Map

Tutorial: On the Map
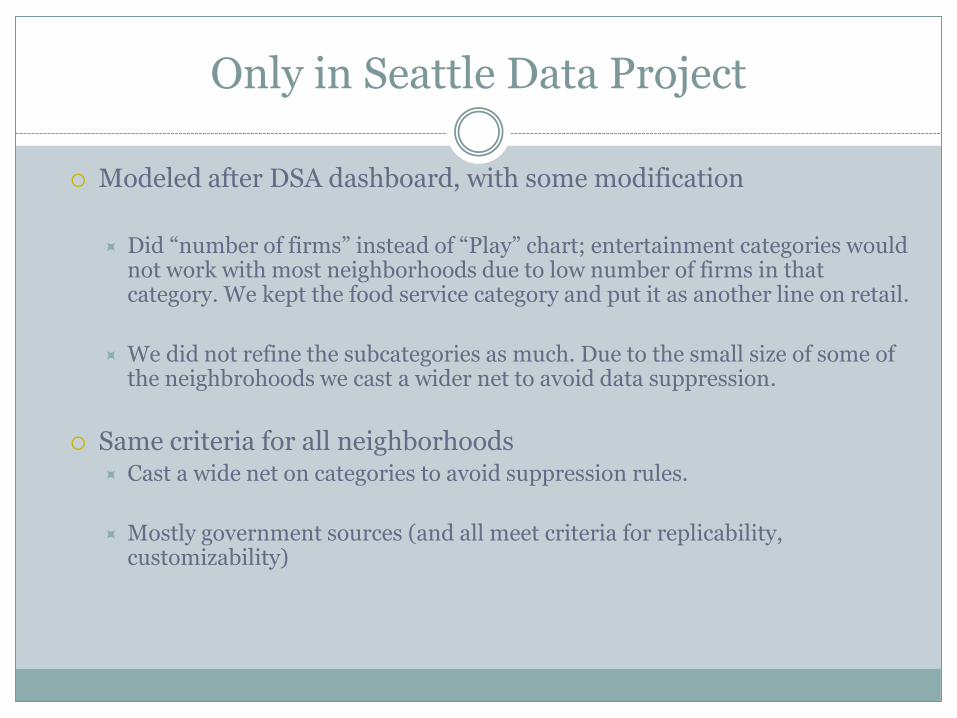
Only in Seattle Data Project
Modeled after DSA dashboard, with some modification
Did “number of firms” instead of “Play” chart; entertainment categories would
not work with most neighborhoods due to low number of firms in that category. We kept the food service category and put it as another line on retail.
We did not refine the subcategories as much. Due to the small size of some of the neighbrohoods we cast a wider net to avoid data suppression.
Same criteria for all neighborhoods Cast a wide net on categories to avoid suppression rules.
Mostly government sources (and all meet criteria for replicability, customizability)

Only in Seattle Data Project
Boundaries:
Used the boundaries from neighborhoods OIS grant applications.
With exceptions; boundaries were adjusted where two or more neighborhoods overlapped in their “claimed” territory. Where there was conflict or where the boundary was too small to gather data effectively, we favored the urban village or city clerk boundaries.

Only in Seattle Data Project
What sources did we use:
Population: Esri, Census data
Employment: PSRC
Number of firms and sales data: Washington State Department of Revenue
Let’s take a look:
https://public.tableausoftware.com/profile/dsareasearch#!/vizhome/OISNeighborhoodProfileDashboard/NeighborhoodProfileDashboard

Only in Seattle Data Project
Dealing with outliers: zero in on them, is there something causing this?
Examples: increases in Lake City driven by automotive sales, drop one year in Othello when Safeway was being remodeled, light rail construction affecting Columbia City and Capitol Hill (and possibly Othello).
Examining these could depend on your expertise in the neighborhood but we can also look at finer detail in the data (not available for all neighborhoods due to the suppression rules mentioned); contact me if you want to troubleshoot any particular data points.

Next Steps
Your feedback
Refining the data for 2015?
Refine categories
Refine methodology?
Different data
Different sources?

Questions
For further information, or to inquire about customized data products, please contact:
Elliott Krivenko
Downtown Seattle Association / Metropolitan Improvement District
206-613-3255