data structure definition - europa · sdmx self-learning package student book no. 4 – data...
TRANSCRIPT

SDMX self-learning package No. 4 Student book
Data Structure Definition

SDMX self-learning package Student book No. 4 – Data Structure Definition
Produced by Eurostat, Directorate B: Statistical Methodologies and Tools
Unit B-5: Statistical Information Technologies
Last update of content September 2010
Version 1.0

SDMX self-learning package Student book No. 4 – Data Structure Definition
TABLE OF CONTENTS 1 SCOPE OF THE STUDENT BOOK.......................................................................................................... 1
2 SDMX INFORMATION MODEL (SDMX-IM): DATA STRUCTURES .............................................. 2
2.1 SCOPE OF THIS CHAPTER........................................................................................................................... 2 2.2 SDMX INFORMATION MODEL AND CONTENT ORIENTED GUIDELINES ..................................................... 2 2.3 GETTING A DATA STRUCTURE FOR MY DATA ............................................................................................ 2
2.3.1 From a Number to Statistical data ................................................................................................. 2 2.3.2 From a Table to the Data structure................................................................................................ 3
3 STEP BY STEP: CREATION OF A DATA STRUCTURE DEFINITION ........................................... 5
3.1 SCOPE OF THIS CHAPTER........................................................................................................................... 5 3.2 DATA IN TIME SERIES FORMAT ................................................................................................................ 8 3.3 DATA IN CROSS-SECTIONAL FORMAT ...................................................................................................... 8 3.4 BUILDING THE DATA STRUCTURE DEFINITION FOR TIME SERIES DATA.................................................. 10
3.4.1 Concepts....................................................................................................................................... 10 3.4.2 Code Lists..................................................................................................................................... 12 3.4.3 Dimensions, Attributes, Groups and Measures ............................................................................ 13
3.5 ADDITIONAL DEFINITIONS FOR THE CROSS-SECTIONAL DATA REPRESENTATION.................................... 15 3.6 BUILDING OF THE SDMX-ML DATA STRUCTURE ................................................................................... 17 3.7 SPECIAL CROSS-SECTIONAL FORMAT (CENSUS) ..................................................................................... 19
4 STEP-BY-STEP CREATION OF THE DSD FOR THE TOURISM EXAMPLE............................... 21
4.1 DATA STRUCTURE WIZARD (DSW) ....................................................................................................... 21 4.2 CREATION OF THE TOURISM DSD WITH THE DSW................................................................................. 22
4.2.1 Definition of Code Lists................................................................................................................ 22 4.2.2 Definition of a Concept Scheme ................................................................................................... 24 4.2.3 Definition of a DSD...................................................................................................................... 26 4.2.4 Export the DSD ............................................................................................................................ 32
5 THE MESSAGE IMPLEMENTATION GUIDE (MIG)........................................................................ 33
6 GLOSSARY................................................................................................................................................ 34

SDMX self-learning package Student book No. 4 – Data Structure Definition
1/34
1 Scope of the student book
The student book aims to provide an understanding and complete view of Data Structure Definitions (DSD) and the way to create a DSD artefact from a data table example. This includes:
• Definition of DSD components;
• Step by Step creation of DSD artefact;
• SDMX-ML Structure Messages;
• The Message Implementation Guide (MIG).
At the end of this student book, the user should be able to create and understand a DSD artefact and to create it from a statistical data table.
This student book is the fourth one of a set of 8 student books (see Table 1 - Student books on SDMX) which altogether provides the complete set of information to master SDMX, with a particular focus on the data model.
Ref. Title
[01] Introduction to SDMX
[02] The SDMX Information Model
[03] SDMX-ML Messages
[04] Data Structure Definition
[05] Metadata Structure Definitions
[06] XML based technologies used in SDMX
[07] SDMX architecture using the pull method for data sharing – Part 1
[08] SDMX architecture using the pull method for data sharing – Part 2
Table 1 - Student books on SDMX
Prerequisites
The reading of the first Student Book is strongly recommended to gain a global view of SDMX Information Model and the basics of the Data & Metadata structures. The studying of the second student book would help to understand the detailed application of the Information Model objects used in Data Structure Definitions.

SDMX self-learning package Student book No. 4 – Data Structure Definition
2/34
2 SDMX Information Model (SDMX-IM): Data Structures1
2.1 Scope of this chapter
The scope of this chapter is to summarize the introduction provided in the first student book to the SDMX-IM.
We will introduce the nomenclature used in Data Structure Definitions explain the different parts of a SDMX data structure definition sample.
2.2 SDMX Information Model and Content oriented guidelines
The SDMX Information model provides a way of modelling statistical data, structural metadata, reference metadata and the data exchange processes by the representation of concepts, relationships, constraints, rules, and operations to specify data semantics for a chosen statistical domain.
Content oriented guidelines are a set of propositions to harmonize the application of SDMX information model to provide concrete solutions for the interoperability in the exchange of data and metadata between organisations.
2.3 Getting a data structure for my data
2.3.1 From a Number to Statistical data
Statistical data is represented with numbers, such as: 11353511
Only looking at the number one will have no clue about its meaning. As a statistical data piece it can be the measurement of a particular phenomenon - also known as an ‘observation’. To identify the substance of this measurement a number of questions need to be answered, for example:
• What is its subject? • What units does it measure? • What country or geographical region does it apply to, if any? • When was the measurement taken and at what frequency is measured?
Each question refers an idea, or ‘concept’ to describe the data. The questions above lead to descriptor concepts like the Statistical Subject, Unit of measure, Country, Time and Frequency.
1 The SMDX Information Model, Content Oriented Guidelines and Data Structures are introduced in the first student book ‘Introduction to SDMX’. The ‘SMDX Information Model’ is explained more in detail in the student book 2.

SDMX self-learning package Student book No. 4 – Data Structure Definition
3/34
While providing answers to the above questions, the data will start to make sense:
• Subject is ‘total population’; • Unit of measure is ‘number of people’; • Country is ‘Belgium’; • Time is ‘1 January 2001’ and Frequency is ‘annually’.
This example demonstrates on how to define statistical data with a set of descriptor concepts. Thus, a Data Structure Definition (DSD) can be defined as follows.
A DSD (key family) specifies a set of descriptor concepts (concepts that describe and identify a set of data). It tells which concepts are dimensions (identification and description), and which are attributes (just description), and it gives the attachment level for each of these concepts, based on the packaging structure (Data Set, Group, Series/Section, Observation) as well as their status (mandatory versus conditional). It also specifies which code lists provide possible values for the dimensions, as well as the possible values for the attributes, either as code lists or as free text fields. A data structure definition can be used to describe time series data, cross-sectional and multidimensional table data2
2.3.2 From a Table to the Data structure
Statistical data presented in tables can be transformed to derive its SDMX data structure. An example of monthly data is presented in Table 2.
Exports and Imports of Wood of country ‘BELGIUM’
per month with country ‘FRANCE’ seasonally adjusted.
(In millions of Euros). Year 2008. Invoices Payments
KEY DIMENSIONS M:BE:3:300:FR M:BE:2:300:FR January 130 100 February 120 110 March 145 105 April 150 120 … … …
Table 2 - Sample: Tabled statistical data in time series format
From Table 2 the following statistical concepts / descriptors with its values can be derived:
1. Frequency, with the values: M for monthly; 2. Reporting Country, with the value: BE ‘Belgium’; 3. Direction of the flow, or type of transaction with the values: 2 for credits, receipts or
goods (exports), 3 for debit, payments or goods (imports); 2 Examples of time series, cross-sectional and multidimensional data tables are provided in the Student book 1 - Introduction to SDMX.

SDMX self-learning package Student book No. 4 – Data Structure Definition
4/34
4. Topic/variable with these values: 300 for income; 5. Vis-à-vis Country/Company: FR for FRANCE; 6. Time period, with defines the observation period for the time series; 7. Time format, providing the format for the time dimension; 8. Unit of measure with different values, for example, EUR – Euros; 9. Unit multiplier, in the example the multiplier is millions.
In the above order the key for this time-series data would be formed like M:BE:3:300:FR (the colon ‘:’ to separates the dimension values). This identifies the Monthly (=M) imports (3=debit/payments/goods) of incomes (=300) of the reporting Company/Country or area (=Belgium) to the vis-à-vis area (=France).
Regarding the concepts, the next step is to distinguish between Dimensions, Attributes and Measures. The key Dimensions contribute to the unique identification of a data series or - more globally – a set of data. The they are linked at Series level. Attributes provide additional information and can be linked to different levels. The Measures contain the value observed over a period of time (time-series data). The concepts Time Dimension (Time period), which is not part of the key, and the attribute Time format complete the needed definitions.
The time series in the example are expressed in millions of Euros. The concepts ‘unit’ and ‘unit multiplier’ do not contribute to the identifications of the series; they only provide additional information of the data inside the tables. In consequence, they act as attributes, specifying additional description of the data.
The concepts 1 to 5 are mandatory for the clear identification of the time series data. They are dimensions and form the key of the data structure (as been shown above).
A more formal definition of a sample data structure is provided in Table 3. It should be noted that in this particular example only two statistical domain specific concepts are used (balance of payments topic, direction of the flow/type of the transaction). Most of the other concepts are actually SDMX Cross Domain Concepts, of the SDMX Content Oriented Guidelines (COG)3, which should be applied wherever possible.
3 The COG were discussed in the first Student book – Introduction to SDMX

SDMX self-learning package Student book No. 4 – Data Structure Definition
5/34
Pos. in
key
Dimension or
Attribute
Concept name Identifier Attach-ment level
Code list
1 Dimension Frequency FREQ CL_FREQ
2 Dimension Reporting/reference area
REF_AREA CL_AREA
3 Dimension Data type for balance of payments statistics
DATA_TYPE_BOP
CL_DATA_TYPE_BOP
4 Dimension Balance of payments topic
BOP_ITEM CL_ BOP_ITEM
5 Dimension Vis-à-vis area COUNT_AREA CL_AREA
Dimension Time period TIME_PERIOD
Attribute Time format TIME_FORMAT Series CL_TIME_FORMAT
Attribute Unit of measure UNIT Series CL_UNIT
Attribute Unit multiplier UNIT_MULT Series CL_UNIT_MULT
Table 3 - Sample Data structure
3 Step by Step: Creation of a Data Structure Definition
3.1 Scope of this chapter
The scope of this chapter is to follow the steps needed to create a Data Structure Definition (DSD) from statistical tables in times-series and cross-sectional data representations and to introduce to SDMX-ML data structure messages. This includes creating the artefacts linked to the DSD and gathering the complete knowledge of the structure.
The steps going to be followed are these:
1. Show the difference between Time Series (TS) Data or Cross-Sectional (CS) Data.
2. Building the Data Structure Definition: • Define all the concepts related to the data; • Identify which concepts are dimensions and which ones are attributes; • Declare the measures, the values which are observed; • Attach or build the code lists.

SDMX self-learning package Student book No. 4 – Data Structure Definition
6/34
The main steps to build the DSD can be drawn as follows:
Figure 1 - Overview of the steps for Data Structure definition
Example used: The statistical example to explain the Time Series and Cross-Sectional data representation is taken from the Tourism domain. It refers to the number of different tourism establishments for a few countries (AT, ES, IT, FR) and continues the example presented in the Student book 1.

SDMX self-learning package Student book No. 4 – Data Structure Definition
7/34
Figure 2 presents a graphical illustration of the difference between the two formats, Time series and Cross-Sectional data:
Figure 2 – Statistical CUBE illustrating TS and CS slices through the data
For the given example the building of the DSD is based on pre-existing data already stored in statistical tables (or other means like databases or data-files). Thus, the structure of the data is already predefined by the actual data exchange where the statistical concepts have already been well defined in the past. The properties of every concept and characteristics of their values can be derived by studying the available set of collected data.
Nevertheless, a redesign towards SDMX should also be taken as an opportunity to validate and update the previous data structure design. The reduction of a statistical table to a common data model for data exchange could contribute to obtain a clearer view for any kind of new structure. For the case of this student book such a redesign process is not covered, but only the one-to-one transfer of data presented in statistical tables with their underlying structures (concepts, code lists, dimensions, attributes and measures) towards the corresponding SDMX Data Structure Definition.

SDMX self-learning package Student book No. 4 – Data Structure Definition
8/34
3.2 Data in Time Series Format
The statistical table includes header information, like the title, the table number, the related tourism data set and the date of extraction. In addition, it presents the statistical concepts, which are normally not visible in table rows & columns of the extracted table itself.
Starting with the Time Series example, the Table 4 below presents the statistical data according to yearly observation periods. For this table it is looked at only one geographical (GEO) entity (FR = France) for the development in the number of tourism establishment types over a specified period.
Number of touristic establishments - TS
FREQ: A – Annual GEO: FR – France TOUR_INDICATOR: A001 – Establishments UNIT: NBR - Number
Topic Time
A100 Hotels and similar
B010 Tourist Campsites
B020 Holiday dwellings
2002A00 18768 8354 1934
2003A00 18617 8331 1968
2004A00 18598 8289 2251
2005A00 18689 8174 2329
2006A00 18361 8138 2325
2007A00 18135 8052 2406
2008A00 17970 7981 2537
2009A00 17723 7923 2964
Table 4 - Time series representation
3.3 Data in Cross-Sectional Format
Number of touristic establishments - CS
TIME: 2007A00 TOUR_INDICATOR: A001 - Establishments UNIT: NBR - Number
Indicator Country
A100 Hotels and similar
B010 Tourist Campsites
B020 Holiday dwellings
AT 14204 540 3388
ES 17827 1220 4843
FR 18135 8052 2406
IT 34058 2587 61810
Table 5 – Cross-Sectional example

SDMX self-learning package Student book No. 4 – Data Structure Definition
9/34
Cross-sectional data organisation is used for the exchange of data with more than one observation type in a data set. This means it is intended for situations where the statistical data consist of multiple observations at a single point in time, or for each combination of dimension members in the multidimensional table. An example of another statistical domain is foreign trade statistics, where, for combination of reporting country, partner country, commodity and time period there may be up to three observations: a value, a weight and/or quantity.
IndicatorPartner
CZECHREPUBLIC 44471 577197 14843
FRANCE 23521 451799 8206
POLAND 51391 895943 17810
TIME: 2007M12 REPORTER: DE - GermanyPRODUCT: Roofing tilesFLOW: Import
WEIGHTin 100KG
VALUEin EUROS
QUANTITYin m³
External Trade (non-real example)
Table 6 - External Trade - CS
The Cross-sectional example in Table 5 the data is presented according to a snapshot of one observation year ‘2007’. The table illustrates a number of geographical (GEO) entities (Countries: AT, ES, FR, IT), where for each of them three phenomenon (tourism establishment types: Hotels and similar, Tourist campsites & Holiday dwellings) are observed. This observations concern only the year 2007 highlighting the main difference to Time-Series data, where one phenomenon is measured over time (e.g. yearly observations from 2002 to 2009)
Nevertheless, Cross-Sectional example refers to the same statistical indicators and data than the Time-Series one. Therefore, the concepts for the time-series structure are maintained, but the DSD definition has to include additional specifications for a Cross-Sectional Format.

SDMX self-learning package Student book No. 4 – Data Structure Definition
10/34
3.4 Building the Data Structure Definition for Time Series data
In the first step, the focus is on the definitions for the Time series data organisation, although it will get obvious during the process that these definitions are valid for both, TS and CS data organisation.
3.4.1 Concepts
Going into the details of data presented in the examples in Table 4 & Table 5, the first step to be performed is to specify the concepts, which comprise the data underlying the statistical table. They used to identify and further describe the statistical data and are thus indispensable to transform pure numbers into statistical information.
The list of concepts to be defined is valid for representations, the ‘Time series presentation of the data in Table 4’ and the ‘Cross-sectional one in Table 5’. All the concepts used to build the respective Data Structure Definition for the examples will be finally listed in the Concept section of the SDMX-ML Structure file in Figure 3 below:
Figure 3 - Concept section of the Message Implementation Guide (MIG)
Above in Figure 3 it can be recognized that the concepts for the statistical topic are gathered into a ‘Concept Scheme = TOUR_concepts’ which is identified by its ID ‘TOUR_concepts’, the ID of the maintaining agency ‘ESTAT’ and the version number. These items and the contained concepts have to be encoded for example in the Data Structure Wizard (DSW), a tool to build SDMX DSDs.
The Concepts are identified by their ID (for example ‘TOUR_INDICATOR’) and may have information about code lists (CL_TOUR_INDICAT) which provide the values for the respective concept and contain a language dependent description (please compare Figure 3).

SDMX self-learning package Student book No. 4 – Data Structure Definition
11/34
The Concepts to be defined in the example are in detail:
• FREQUENCY; the frequency for the data is ‘annual’. The value ‘a = annual’ for this concept is taken from the Frequency code list (CL_FREQ);
• COUNTRY with the values (for example ‘FR’ = France) provided by a Cross Domain ISO-country code list (CL_COUNTRY);
• TOURISM INDICATOR: Its values are taken from a specific domain code list (CL_TOUR_INDICAT) - value ‘A001’ = Establishments;
• TOURISM ACTIVITY: The values are also taken from a specific domain code list (CL_TOUR_ACTIVITY) - value ‘A100’ = Hotels and similar;
• TIME PERIOD, which assigns the period of the time series observed. • TIME FORMAT representing annual data and linked to a Cross Domain code list
(CL_TIME_FORMAT) for its values; • UNIT, with the value ‘number’ from the unit code list (CL_UNIT); • OBSERVATION VALUE represents the measured statistical data values; • OBSERVATION STATUS, which provides information on the status of a specific
observation value (for example: ‘f’ = forecasted data or ‘p’ = provisional data).
The link of the concepts to the statistical table (TS format) is illustrated in the below Figure 4:
Figure 4 - Concepts linked to the TS statistical table

SDMX self-learning package Student book No. 4 – Data Structure Definition
12/34
3.4.2 Code Lists
In order to be able to exchange and understand data, it needs to be declared, what the possible values for each concept are. Besides the possibility to define text formats for free text values, which are usually used for attributes, the commonly used approach is to attach lists of values. Such a list of possible values is known as a ‘code list’. Each value on that list has a language-independent abbreviation - a ‘code’ - and a language-specific description. This helps us avoid problems of translation in describing the data: the code can be translated into descriptions in any language without having to change the code associated with the data itself.
Wherever possible, the values for code lists are taken from international standards; such as those proposed in the SDMX Content-Oriented Guidelines or other internationally standardized ones (for example ISO-code lists for countries and currencies). For the example, specific code lists have to be defined or the appropriate existing code list has to be chosen for the dimensions as well as for the attributes not represented by free-text values. Those dimensions and attributes linked to code lists are named as ‘coded’ ones.
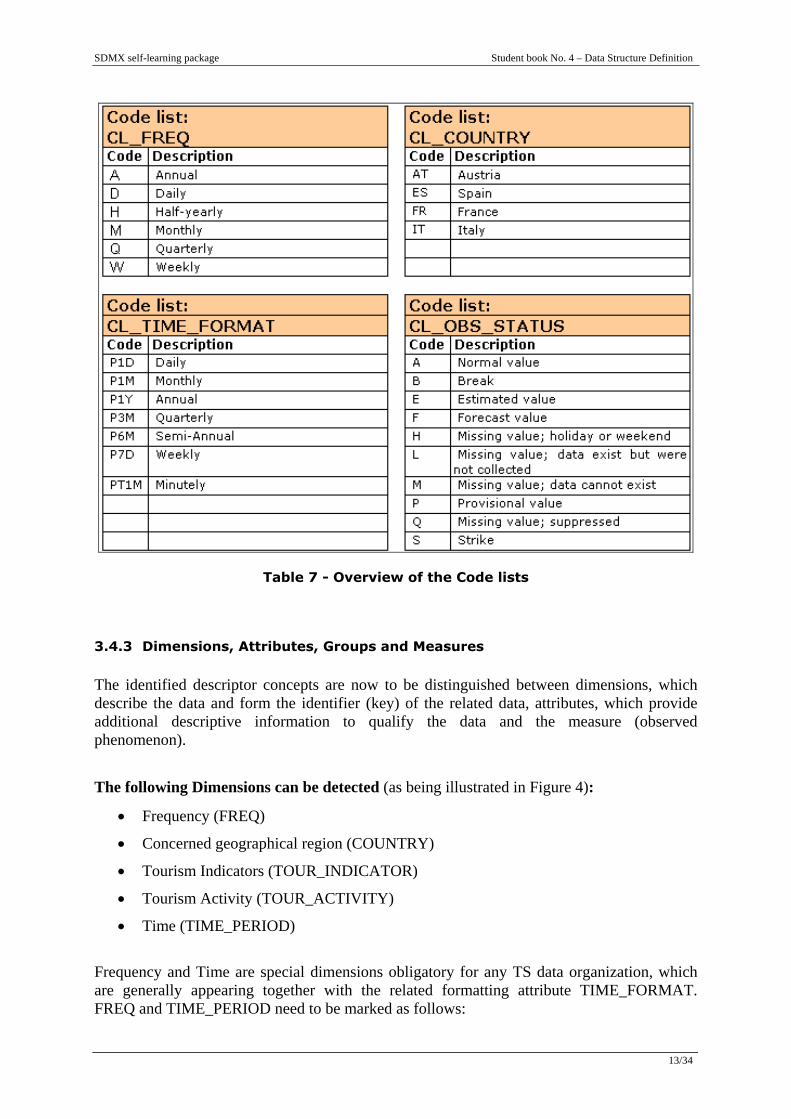
See Table 7 for an overview on the code lists associated to the concepts of the example. Please note that for some of them only a selection of codes is presented.
SDMX self-learning package Student book No. 4 – Data Structure Definition
13/34
Table 7 - Overview of the Code lists
3.4.3 Dimensions, Attributes, Groups and Measures
The identified descriptor concepts are now to be distinguished between dimensions, which describe the data and form the identifier (key) of the related data, attributes, which provide additional descriptive information to qualify the data and the measure (observed phenomenon).
The following Dimensions can be detected (as being illustrated in Figure 4):
• Frequency (FREQ)
• Concerned geographical region (COUNTRY)
• Tourism Indicators (TOUR_INDICATOR)
• Tourism Activity (TOUR_ACTIVITY)
• Time (TIME_PERIOD) Frequency and Time are special dimensions obligatory for any TS data organization, which are generally appearing together with the related formatting attribute TIME_FORMAT. FREQ and TIME_PERIOD need to be marked as follows:

SDMX self-learning package Student book No. 4 – Data Structure Definition
14/34
• A time series always has a ‘frequency’ (FREQ). This is a descriptor concept that describes the intervals of time between observations. The ‘isFrequencyDimension’ option has to be chosen to identify this one. There can be only one frequency dimension per Data Structure Definition.
• The Time dimension (TIME_PERIOD) is a special dimension that must be included in any Data Structure Definition which will be used for time-series data messages. This dimension is marked as ‘isTimeDimension’ in the DSD (key family) section.
The Dimension elements contain references to a descriptor concept and the code list from which the dimension value has to be taken. The order of declaration of the dimensions is important as it describes the order in which the dimensions will appear in the keys (except for the time dimension, which is not part of the key). Usually FREQ and COUNTRY are the first concepts in this order.
Attributes in the example:
An attribute element of the DSD will contain information such as the concept used for the attribute, the attachment level for both representations (time-series and cross-sectional) and whether a value has to be provided or not (‘Mandatory’ versus ‘Conditional’).
Amongst them is for example the UNIT of measure or information on the OBS_STATUS. Attributes with coded values included the name of the code list providing the values. The others may have a data format specified using the ‘TextFormat’ element.
Now the attachment level: ‘Observation’, ‘Group’, ‘Series’ or ‘DataSet’ for the attributes in a time series representation is defined. The concept of the time format is specified with the ‘isTimeFormat’-option (value set to true) and is typically a mandatory series-level attribute whose value is taken from an ISO8601 compliant code list. For attributes attached to the group level, the group has to be specified, to which the attributes are attached with an ‘AttachmentGroup’ element4.
In Figure 4 - Concepts linked to the TS statistical table – above it is illustrated that the OBSERVATION STATUS is attached directly to the observation value (‘Observation level’). TIME FORMAT is usually kept on the same level (‘Series’ in the example) as the FREQUENCY and TIME PERIOD dimensions. The UNIT is as well attached at the ‘Series level’.
4 More in dept explanation on the choice of the attachment levels for attributes is provided in the student book 2 – SDMX Information Model.

SDMX self-learning package Student book No. 4 – Data Structure Definition
15/34
Attachment level for the Attributes in the time-series data representation:
Attribute Attachment Level
OBSERVATION STATUS Observation
TIME FORMAT Series
UNIT Series
Table 8 - Attributes with their attachment level
Grouping / Packaging structures:
The Group element declares the desired groupings of data, such as the sibling group, which contains a set of series which are identical regarding their concepts, except that they are measured with different frequencies (annual, quarterly & monthly observations). No grouping is foreseen in the example5.
Primary measure:
Finally, it is to indicate which concept will contain the measured value. Conventionally, it is associated with the Observation Value (OBS_VALUE) concept for the time series data format.
3.5 Additional definitions for the Cross-sectional data representation
Cross-sectional representations of the data may be derived from the same Data Structure Definition from which time-series representations are structured, as long as the needed additional structural metadata is provided. Therefore, a specific functionality allows multiple measures to be declared in the Data Structure Definition, taking its representational values from a so-called ‘Cross-sectional Measure dimension’. When data is structured to represent a set of multiple observations at a single point in time, the ‘section’ – one or more observations for each declared measure – replaces the series in the data structure for the cross-sectional format.
Cross-sectional data structures take the same concepts in describing the data. The attachment of the concepts changes (e.g. Series to Section) for the Cross-sectional presentation of the data.
The definition of the key to the data changes as well, since each cross-sectional measure represents at least one dimension of the key at the section level. These dimensions are gathered by the so-called ‘Measure dimension’.
The other elements of the key can be found at the Section level in the example, similar to its declaration at the Series level for time-series data structures.
Consequently, the Cross-Sectional example shows the same kind of data than the Time-Series made before in a different organisation.
In addition to the elements for the DSD for the time-series data, additional specifications for a Cross-Sectional format have to be added, in order to use the DSD for SDMX-ML data messages of both data organisations.
5 More in dept explanation on grouping / packaging structures is provided in the student book 2 – SDMX Information Model.

SDMX self-learning package Student book No. 4 – Data Structure Definition
16/34
The multiple measures of the Cross-Sectional data representation need to be defined in the Measure dimension. The values of the Measure dimension are also going to be treated like concepts:
• ‘COUNTRY’ is declared as ‘Measure dimension’, and the elements of this dimension are taken from a code list ‘CL_COUNTRY’ (please compare Table 7 - Overview of the Code lists).
• Furthermore, the attachment level for the dimensions and the attributes in relation with the cross-sectional format have to be defined:
Dimension Attachment Level FREQUENCY Section TOUR_INDICATOR Section TOUR_ACTIVITY Section TIME PERIOD Section Attribute Attachment Level OBSERVATION STATUS Observation TIME FORMAT Section UNIT Section
Table 9 - Cross-Sectional Attachment
Figure 5 - Concepts linked to the CS statistical table

SDMX self-learning package Student book No. 4 – Data Structure Definition
17/34
3.6 Building of the SDMX-ML data structure
Now, having a good overview of the structure of the data, the structure presented in Table 10 can be formally defined in SDMX-ML, preferably supported by a dedicated SDMX tool like for example the Data Structure Wizard (DSW) or the DSD building feature of the SDMX Registry of Eurostat.
Key (TS) Key (CS) Concept ID Concept Name Format Code List ID Code List Name
1 1CS AttachmentSection
FREQ Frequency CL_FREQ(1.0) Frequency code list
2 COUNTRY Tourism Country
CL_COUNTRY(1.0) Country Codelist
3 2CS AttachmentSection
INDIC_TO Tourism Indicator
CL_TOUR_INDICAT (1.0) Tourism Indicator code list
4 3CS AttachmentSection
ACTIVITY_TO Tourism Activity
CL_TOUR_ACTIVITY (1.0) Tourism Activity code list
AT Austria CL_COUNTRY(1.0) Country Codelist
ES Spain CL_COUNTRY(1.0) Country Codelist
FR France CL_COUNTRY(1.0) Country Codelist
IT Italy CL_COUNTRY(1.0) Country Codelist
CS AttachmentSection
TIME_PERIOD Time period
OBS_VALUE Observation value
Attachment level / TS
Attachment level / CS
Conditional, Mandatory
Observation Observation Conditional OBS_STATUS Status of the observation
CL_OBS_STATUS (1.0) Observation status code list
Series Section Mandatory UNIT Unit CL_UNIT(1.0) Unit codelist
Series Section Mandatory TIME_FORMAT Time format CL_TIME_FORMAT (1.0) Time Format
STRUCTURE FOR THE DSD - Time series (TS) and Cross-sectional (CS)
Attachment level and usage status
Dimensions
Time Reference and observations
Observation Attached Attributes
Other Attributes
CS Measures
4
Table 10 - Structure overview for the creation of the DSD
Applying one of those tools (for example the DSW) to define DSD with its referenced artifacts, the defined Data structure definitions will be stored in a dedicated SDMX-ML structure message format. The so called SDMX-ML Structure message format contains the description of the structural metadata, such as the key family, concept scheme, concepts and the code lists. Since SDMX-ML Structure messages are not easy to read, the Figure 6 - KeyFamily part of the MIG – presents the data structure in the user friendly Message Implementation Guide (MIG) format.

SDMX self-learning package Student book No. 4 – Data Structure Definition
18/34
Figure 6 - KeyFamily part of the MIG

SDMX self-learning package Student book No. 4 – Data Structure Definition
19/34
3.7 Special Cross-sectional format (Census)
A special Cross-sectional data organization was decided for the exchange of data with regards to the establishment of new Census 2011. A hypercube must be described as a DSD, thus SDMX based. Consequently a DSD has to be produced for each of the Census Hypercubes.
The below detailed Data Structure format (CS data organization without CS measures) was decided for the Census Hub pilot application, because of its flexibility with regards to the handling of cross-tabulated data and the specifically lean & easy to implement structure.
Such a type of DSD is expected to be quite frequently used in the future for similar data transmissions.
The example focuses on the first Census hypercube included in the Census Hub pilot project with the Dimensions: AGE, CAS (Current activity status), GEO (Geographical area) & SEX. A second hypercube replaces the Dimension CAS (Current activity status) with the one: Marital status.
The main specification of the Census Cross-sectional structure of the first hypercube can be summarized as follows:
• No multiple phenomenon are measured, thus no Cross-sectional measures are defined;
• The Primary measure OBS_VALUE is included to be compliant with the SDMX standard and to measure the related phenomenon;
• The Dimensions declared: AGE, CAS (Current activity status), GEO (Geographical area) & SEX representing the ‘key’ to the Census data. They are attached with the measure OBS_VALUE to the CS level of ‘Observation’. Further Dimensions are the special ones: TIME_PERIOD and FREQ. The TIME-PERIOD & FREQ dimensions and the attribute TIME_FORMAT are attached to CS Group level.
• A further attribute completes the DSD’s definition: Observation status (OBS_STATUS), which is attached at the ‘Observational’ level.
The building of the DSD follows the same steps as laid out before, but taking into account that the above specialties reduce the complexity within the steps and the number of steps, since no Cross-sectional measure dimension with its related concepts need to be defined.
The constructed Data Structure Definition is intended to handle SDMX-ML data messages in the Cross-sectional format, although a TS data organization would be possible, since the time dimension, frequency and time format are defined.
The Table 11 - Structure overview for the creation of the CENSUS-DSD presents an overview of the necessary definitions for the Census-DSD.

SDMX self-learning package Student book No. 4 – Data Structure Definition
20/34
Key (CS) Concept ID Concept Name Code List ID
1CS AttachmentObservation
AGE Age classes CL_AGE_M
2CS AttachmentObservation CAS Current activity status CL_CAS_M
3CS AttachmentObservation GEO Geographical area CL_GEO
4CS AttachmentObservation SEX Sex CL_SEX_M
CS AttachmentGroup TIME_PERIOD Time period
CS AttachmentGroup
FREQ Frequency CL_FREQ
CS AttachmentObservation Conditional OBS_VALUE Observation value
CS AttachmentGroup Manadatory TIME_FORMAT Time format CL_TIME_FORMAT
CS AttachmentObservation Conditional OBS_STATUS Status of the Observation CL_OBS_STATUS
STRUCTURE FOR THE DSD - Census Hub - Cross-sectional (CS)
Attributes
Attachment level and usage status
Dimension
Primary Measure
Table 11 - Structure overview for the creation of the CENSUS-DSD

SDMX self-learning package Student book No. 4 – Data Structure Definition
21/34
4 Step-by-step creation of the DSD for the Tourism example
4.1 Data Structure Wizard (DSW)
The Data Structure Wizard (DSW) application provides an improved solution for the management of Data Structure Definitions (DSDs) within the SDMX v2.0 standard. It can act as a hybrid tool that can be used both offline and on-line (linked to an SDMX Registry), depending on users’ choice and access rights.
• The offline mode is intended to be used for the maintenance of SDMX v2.0 artefacts. A local repository will be used for storing SDMX-ML Structure files of the artefacts.
• In the on-line mode, the tool communicates with any standard-compliant SDMX Registry (e.g. the SDMX-Registry of Eurostat) offering in the same time all the functionalities provided in the offline mode. Moreover, after editing and storing the DSD artefacts locally (offline), the edited (or a new) artefact can be submitted to the SDMX Registry (while the user needs to have ‘maintain’ privilege).
Other facilities of the application include the creation of SDMX-ML sample data files based on DSD linked templates or the building of the Message Implementation Guide (MIG) for a given DSD. Also, DSW provides several importing/exporting mechanisms from/to SDMX-ML v2.0 files. The HELP-system of the application offers screenshot supported step by step explanations for the creation of each SDMX artifact with the DSW.
As a summary, DSW covers the following functionalities for handling structural metadata artefacts:
• Interaction with any standard-compliant SDMX Registry as described above.
• Maintenance of the following SDMX v2.0 artefacts:
o Code Lists; o Concept Schemes; o Data Structure Definitions; o Data Flows; o Category Schemes; o Hierarchical Code lists; o Organization Schemes.
• Creation of a data message template for a specified DSD in SDMX v2.0 format;
• Import and export of artefacts from/to SDMX-ML v2.0 format;
• Import and export to/from other formats;
• Building and exporting of a MIG for a given DSD;
• Printing of summary reports for Code lists, Concepts from Concept Schemes, DSDs, Dataflows and printing of reports for the DSDs components and for the Codes from Code lists;
• Search facilities (search Dataflow for a specified DSD, search DSD for a specified Dataflow, search all DSDs using a code list and search all the DSDs using a given concept).

SDMX self-learning package Student book No. 4 – Data Structure Definition
22/34
4.2 Creation of the Tourism DSD with the DSW6
4.2.1 Definition of Code Lists
To create a new code list in the application: By selecting 'Add' from the contextual menu of the 'Code lists' node, a new Code Lists page displays on the right side of the screen and, on the left pane, a child node of Code Lists appears marked with '++' (as indicated by the red arrow '2' in the figure below).
In order to create a Code list, the minimum requirements are to fill in the mandatory fields from the 'Code List Attributes Panel' and 'CodeList Properties Panel' sections, and then press 'Save Code List' button. The mandatory fields are highlighted in yellow and marked by the (*) sign.
CodeList Information
In the page displayed in the figure above, select the 'Code List Information' tab as indicated by the red arrow '3'.
In the Code List Attributes Panel (4) the user has to perform the following actions: Fill in the mandatory 'ID'; Select the 'Agency ID’ that is initially pre-filled with the first 'AgencyID' from the
agencies list provided by the application (requiring an Organisation Scheme and at least one Agency (e.g. ESTAT) to be defined in the Organisation Scheme artefact section);
6 The following step-by-step creation of the DSD does only touch the main objects and elements, which are needed to build the DSD for the Tourism example. For a more specific introduction to the DSW, a user guide is provided with the tool and its help-system offers detailed guidance for the creation of artefacts. The DSW version 0.8.6 was used for this chapter.

SDMX self-learning package Student book No. 4 – Data Structure Definition
23/34
Optionally the other fields can be filled. The 'Version' field may be provided by the user, but if it is omitted, the version is considered as 1.0 for a new code list or consecutively increased;
If 'Is Final' check box is selected, the artefact is protected (no further modification possible) and can be referenced by other artefacts (e.g. by a DSD).
In the CodeList Properties Panel (5) the user may perform the following actions: Fill in the mandatory 'Names'. At least one localized (language) value has to be defined. To save all the information entered, press 'Save CodeList' (6).
CodeList Elements
In the top of the 'CodeList Elements' tab, there is a section where the existing elements of the currently selected Code list are listed (with their value and parent code), as indicated by red arrow '1' in the below figure.
In order to add a value, press 'New Code' button as indicated by the red arrow '2', then: • Fill in the mandatory 'Value' field with the code (3); • Fill in the 'Descriptions' field (4), which is also mandatory, with the code description; • Press the 'Save Code' button (5) and the information will be added in the upper main
section of the 'Codelist Elements' tab; • The steps (2-5) are repeated for each code to be entered; • The 'Remove Code' button deletes a code after its selection; • To view the codes created as a code tree, the user must press the 'Tree view' button from
the section pointed by arrow '2' and a popup window will display the code tree. After having filled in all the mandatory fields, the new code list should be saved by pressing 'Save Code list' (6). As a result, the tree from the left pane of the screen is refreshed to display the newly created code list. The name of the new code list is a combination of the 'ID', 'Agency ID' and 'Version', which uniquely identifies it.

SDMX self-learning package Student book No. 4 – Data Structure Definition
24/34
4.2.2 Definition of a Concept Scheme
Concept Schemes represent a collection of concepts. To start the creation of a concept scheme in the DSW application:
• Select the 'ConceptSchemes' artefact node from the SDMX Artefacts tree, right click on it
and select 'Add' (1). A child node of 'ConceptSchemes' appears marked with '++' (2). In the figure above, there are two tabs ('ConceptScheme Information' and 'ConceptScheme Elements') where the user has to complete at least the mandatory information in order to create a new ConceptScheme artefact.
ConceptScheme Information (3)
In the ConceptScheme Attributes Panel (4) the following actions may be performed: • Fill in the 'ID', select the 'Agency ID' and provide the 'Version'; if the completion of this
field is omitted, the version is considered as 1.0; • Optionally fill in the other fields. Selecting 'Is Final' check box protects the saved artefact
and allows referencing it. In the ConceptScheme Properties Panel (5) the following actions have to be performed: • Fill in the mandatory 'Names' - field. Optionally fill in the respective language
'Description' field for each language dependent name entered. Save all the information entered, by pressing the 'Save ConceptScheme' button (6).
ConceptScheme Elements
In the top of the 'ConceptScheme Elements' tab (1 – in the figure below) a table section lists the concepts defined for the current Concept Scheme with their ID and Parent concept (for example applicable for the CS Measure concepts: AT, ES, FR & IT, where the parent concept COUNTRY has to be entered).

SDMX self-learning package Student book No. 4 – Data Structure Definition
25/34
In the Concept *NAME* Properties section the user can add a concept for the current scheme he is completing, by pressing the button 'New Concept' (2).
After pressing 'New Concept', the table from the header of tab is enabled (if it was empty) and a new gridline is added (red rectangle). The following steps have to be performed: • Fill in the 'ID' field & 'Names' field (3 & 4), which both are mandatory hence yellow and
marked by *. • Optionally fill in the properties displayed in the 'Text Format' panel. Press 'Save Concept' button (5) and the information will be added to the gridline in the table.
For each needed concept in our example the steps 2 to 5 have to be repeated. To view the concepts created or associated to the current ConceptScheme under the form of a tree list, press the 'Tree view' button.

SDMX self-learning package Student book No. 4 – Data Structure Definition
26/34
To save the entire concept scheme that now includes the newly created Concepts for the Tourism example in the overview table, press the 'Save ConceptScheme' button (6).
4.2.3 Definition of a DSD
Before starting creating a new DSD, there must be at least one concept scheme with concepts defined in the DSW application.
By selecting 'Add' from the contextual menu of the 'DSDs' node, a new DSD page displays on the right side of the screen and, on the left pane, a child node of DSD appears marked with '++' (2). In order to start completing the DSD artefact, select the 'DSD Information' tab (3) in figure above.

SDMX self-learning package Student book No. 4 – Data Structure Definition
27/34
DSD Information
In the DSD Attributes Panel (4), the user should perform the following operations: • Fill in the mandatory 'ID' and 'AgencyID', which is pre-filled with the first AgencyID
from the 'OrganisationScheme' list provided by the DSW application. • The other fields ('Valid From', 'Valid To', 'URI', 'URN' and 'Is Final') are optional. The
URI field is pointing to an SDMX Structure message containing complete details on the dataflow. The 'URN' (universal resource name) attribute can hold a valid SDMX Registry link. If 'Is Final' check box is selected, the artefact is protected (no further modification possible) and can be referenced by other artefacts (e.g. a Dataflow based on this DSD)
• The 'Version field' may be filled in. If it is omitted, the version is considered as 1.0. The 'ValidFrom' and 'ValidTo' may hold inclusive dates for providing supplementary validity information about the current version of the DSD.
In the DSD Properties Panel (5), the following actions are required: • Fill in the 'Names' and optionally fill in the 'Description' field. To save all the information entered, press 'Save DSD'.
DSD Elements - Primary Measure
The 'DSD' screen contains a second tab called 'DSD Elements' (2).
First the 'Primary Measure' (highlighted in a red square) needs to be defined. Press the button 'Choose' (2) to select the related OBS_VALUE concept. A popup window displays where the user can search and select the concept of the related concept scheme by ID or by name. After filling in all the mandatory fields, the button 'Save DSD' (3) stores the updated artefact.

SDMX self-learning package Student book No. 4 – Data Structure Definition
28/34
DSD Elements - Dimensions
In 'DSD Elements' (1) in the figure below select 'Dimensions' tab (2).
In this panel the user should perform the following actions: • Add a new dimension, by pressing the button 'New Dimension' (3). A new gridline will be
added in the table (red rectangle) listing the dimensions included in the current DSD. • To 'Select a 'Role' (4) - the user has to choose from a drop down list: 'Dimension',
'TimeDimension', 'FrequencyDimension' or 'MeasureDimension'. • Since COUNTRY is the Measure Dimension of our example, the Role, Concept and Code
list providing the values for the COUNTRY concept have been chosen accordingly (4-6). • Optionally, complete the elements from the Text Format section to define a specific text
format of the Dimension.
To save the Dimension and the updated data structure created, press first 'Save Dimension' (7) than 'Save DSD' (8).

SDMX self-learning package Student book No. 4 – Data Structure Definition
29/34
After the above Dimensions have been defined, the used will switch to the next tab.
DSD Elements - Group Keys
Here, the user may declare any useful groupings of the declared (non-Time) dimensions. These form partial keys to which attributes may be attached. One possible grouping is the so-called ‘Sibling group’ (please compare in Student book 1), which will not be defined for the TOURISM example. For completeness the below figure illustrates the steps:
• Add a new group, by pressing the 'New Group' (3). • Fill in the name of the group key in the 'Group Key ID' textbox (4). • Select the Dimensions forming the group key from the 'Available' list and transfer it to the
'Selected' box (5). Save the group by pressing the 'Save Group' button (3 – besides 'New Group'), than perform 'Save DSD' (6).

SDMX self-learning package Student book No. 4 – Data Structure Definition
30/34
DSD Elements - XS Measures
In 'DSD Elements' tab (1) select the definitions for the Cross-sectional Measures - 'XS Measures' tab (2) in the figure below.
This screen is only enabled if the user has selected in the 'Dimensions' tab above, the 'Measure Dimension' value in the 'Role' drop down list for the COUNTRY Dimension.
The following actions need to be performed to create the four Cross-sectional measures of the COUNTRY Measure Dimension of the TOURISM example: • Choose a value to complete the 'Concept' field (3) for each of the Cross-sectional
measures (XSMeasures) defined for the current DSD artefact and listed in the table section (highlighted by a red rectangle in the figure above);
• Choose the COUNRY code list; • Note: Filling in the 'Text Format' section is not obligatory. In order to save Cross-sectional Measure, press the 'Save XSMeasure' button (4). To save the current data structure with the updates, press the 'Save DSD' button.

SDMX self-learning package Student book No. 4 – Data Structure Definition
31/34
DSD Elements - Attributes
In 'DSD Elements' tab (1) in the figure below select the 'Attributes' tab (2).
In this screen the following actions have to be performed: • Add a new attribute by pressing the 'New attribute' button (3). A new gridline is added in
the table section of the screen (highlighted by the red rectangle). • Choose a concept by pressing the button 'Choose' of the mandatory 'Concept' field (4) and
follow the indicated steps. Select an 'Assignment Status' (5). This status indicates whether a value has to be provided for this attribute in the data-file, thus, two attachment statuses are possible: 'Mandatory' and 'Conditional'.

SDMX self-learning package Student book No. 4 – Data Structure Definition
32/34
The 'Attachment Group' element is enabled when this attribute will be attached to a 'Group' level. It indicates to which declared group or groups the attribute may be attached. No group is declared and no such attachment is foreseen for the TOURISM example. • Select an 'Attachment Level' from the respective drop down list (6). The options available
are 'DataSet', 'Group', 'Series' and 'Observation'. • When selecting 'Observation' as attachment level, the 'Attachment Measure' section (7)
becomes enabled and the user must choose from the available measures, the ones to be used for attachment. This means to move at least one value from the corresponding 'Available' list box into the 'Selected' one.
• When the user selects 'Group' as attachment level, the 'Attached Group ID' section (8) becomes enabled and the user can usually select from the available groups the ones the attribute needs to be attached to (not in the TOURISM example).
• The Attribute type should be defined for special attributes with the 'Is...' drop down list options; these are: 'TimeFormat', 'Entity Attribute', 'NonObservational Time Attribute', 'Count Attribute', 'Frequency Attribute' or 'Identity Attribute'. Thus, for the example, the TIME_FORMAT attribute will be marked as 'Is... TimeFormat '.
• In the 'CrossSectional Attachment Level' section, the attachment level for the Cross-sectional data organisation needs to be defined, since the TOURISM DSD will support both TS and CS data-files.
• Optionally, the 'Text Format' section can be filled. To save the attribute currently edited, press the 'Save Attribute' button (9). To save the current data structure, press the 'Save DSD' button (10).
4.2.4 Export the DSD
To export the created DSD including the referenced artefacts (Code lists, Concept Scheme) into a single SDMX-ML Structure file the user right-clicks on the respective DSD in the 'SDMX Artefacts' tree and chooses 'Export' in the context menu. It is also possible to export the DSD and the referenced artefacts, like the Code lists & the Concept Scheme, separately. The exported SDMX-ML files are provided in an archive in annex to this student book.
In the 'Export Panel' on the right the DSD is selected for export including its references (checkbox). By pressing the 'Export' button, the export destination can be selected and confirmed. A similar function of the DSW allows the import of DSDs and other artefacts.

SDMX self-learning package Student book No. 4 – Data Structure Definition
33/34
5 The Message Implementation Guide (MIG)
The Message Implementation Guide is a (rich-text file) document, which lists all the specification of a DSD in XML format. The MIG helps a user in producing or even in reading/understanding an SDMX data set and/or its structure. It is designed for people not skilled in SDMX or XML.
For this, the MIG contains the detailed descriptions of the structure of a particular data set concerning the following elements:
• Dimensions (concept, representation and attachment level); • Measures (concept, representation and attachment level); • Attributes (concept, representation and attachment level); • Concepts; • Code lists.
The DSW tool contains a feature to create the MIG for a defined DSD. To build and save the MIG (as an rtf-file), the user presses the button 'Download MIG' (highlighted with the red rectangle) in the screen below. The download destination folder can be selected and the operation confirmed.
An example of the MIG for the TOURISM DSD is presented in the archive in annex.

SDMX self-learning package Student book No. 4 – Data Structure Definition
34/34
6 Glossary
Table 12 presents the list of concepts and acronyms with their definition.
Concept Definition
COG Content Oriented Guidelines
CS Cross-Sectional
DSD Data Structure Definition
DSW Data Structure Wizard
ISO International Organisation for Standardisation
MIG Message Implementation Guide
MSD Metadata Structure Definition
SDMX Statistical Data and Metadata eXchange
SDMX-IM SDMX Information Model
SDMX-ML SDMX Mark-up Language - XML format for the exchange of SDMX-structured data and metadata
TS Time Series
URI Unified Resource Identifier
URN Unified Resource Name
XML EXtensible Mark-up Language
Table 12 – Glossary