data storage and processing gis topics and applications
TRANSCRIPT

Data Storage and Processing
GIS Topics and Applications

GIS Models Over Time
• Simple Representation– CAD model
• Data Analysis– Raster model
• Data Collection– Vector model
• Relational and Rules– Object model

Objects
• GIS Features as Objects is a recent method of representing aspects of the real-world in GIS
• Example of the shift from specialty data to DBMS that are spatially-aware
• Non-planar, temporally shifting, topologically linked, rule-based actions

Vector Geometry as Objects
• Parcels– Planar geometries with attribute information
• Parcels as objects in a Cadastral “carpet”– Objects with topology rules (“don’t overlap, unless”)– Members of “regional” features (zoning, municipality)– Composed of surveyed parts (COGO, benchmarks)– Keys that link to attribute tables (owner(s), assessments,
plans, etc)

Cadastre Example
benchmark survey (COGO) parcels zones

Attributes as Objects• Not only can multiple sets of geospatial features interact
with rules, the attributes can be linked with one another, with their own set of rules and actions
• Ownership record linked to GIS parcel– Search on multiple owners, records– Removal of parcel warns about “orphan” owner
• Functions that can be performed by GIS analyst can be embedded in the actual database

Manipulating Vector Mode Databases

Common Operations
• Selection by Attributes or Location• Dissolve• Append• Clip• Intersect• Union

Select by Attributes
• Create WHERE clauses that match a subset of the features in a vector dataset.
• WHERE clauses are a part of Structured Query Language (SQL)
• Analogous to "Find" in some other software.• Match all records where…– "COUNTY" = 'Gloucester'– NOT "TYPE" = 'Wetlands'– "POP2000" > 100000

Select by Location
• Proximity or overlay based on features in one layer and features in another layer or the same layer.
• Several methods to compare proximity & overlay– Distance from– Touching (on edge)– Contains or Within– Partial Overlaps– Exact Matches

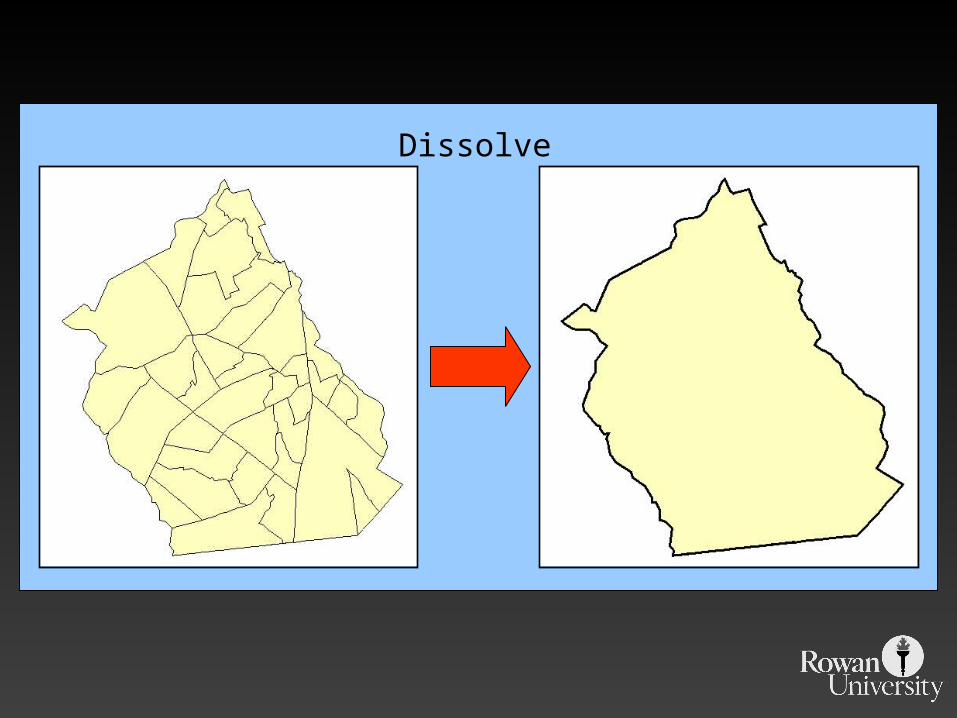
Dissolve

Dissolve FeaturesInput Output

Append

Layers to Append
Input Layer 1 Input Layer 2
Appended Layers
Overlapping Polygons/Polylines are preserved!

Clip

Output Layer
Clipped Features
Input Layer & Clipping Layer
Input Layer
Clip Polygon

Intersect

Intersection
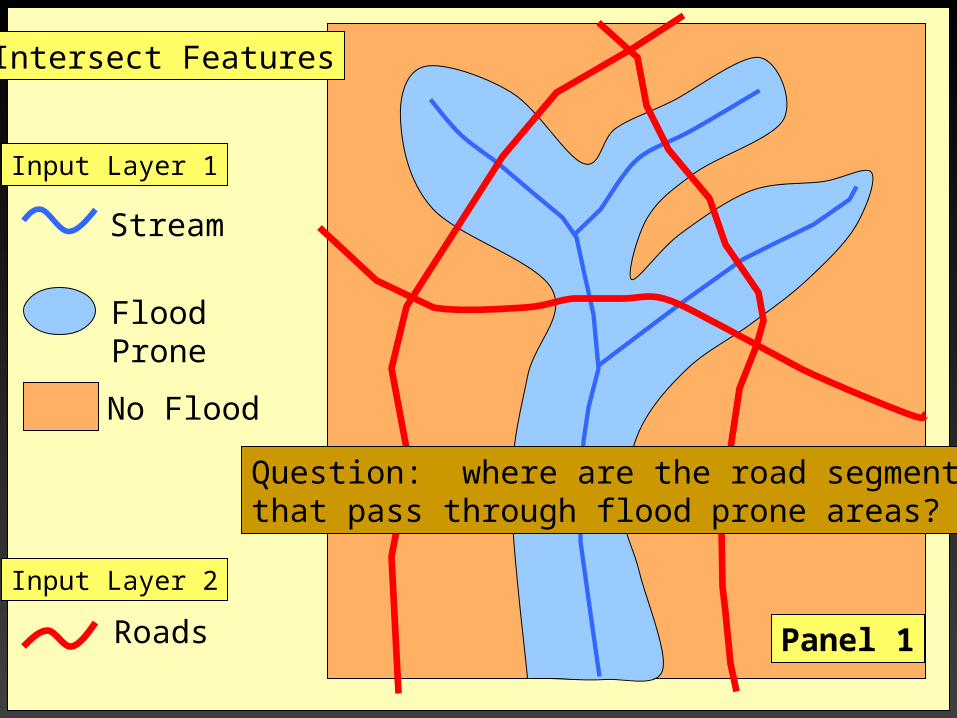
• Where are the Road segments that are in flood prone areas.
• Select flood prone from Input Layer 1
• Intersect roads and flood prone [Layer 2].

Stream
No Flood
FloodProne
Intersect Features
Input Layer 1
Roads
Input Layer 2
Panel 1
Stream
No Flood
FloodProne
Intersect Features
Input Layer 1
Input Layer 2
Roads
Question: where are the road segments that pass through flood prone areas?
Panel 1

Stream
No Flood
FloodProne
Intersect Features
Roads
Input Layer 1
Input Layer 2
Select flood prone areas and then intersect Input Layer 1 with Layer 2 Roads.
Panel 2

Study Area
FloodProne
Intersect Features
Output Layer
Roads that pass through flood prone areas. Attributes of both layers maintained in table.Length of roads in flood areas becomes attribute
Roads
Panel 3

Intersection
• Where are the places that are residential and flood prone.
• Select flood prone from Input Layer 1
• Select residential from Input Layer 2
• Intersect

Stream
No Flood
FloodProne
Intersect Features
Input Layer 1
Panel 1

Intersect Features
Input Layer 2
Residential
Commercial
Industry
Open space Panel 2
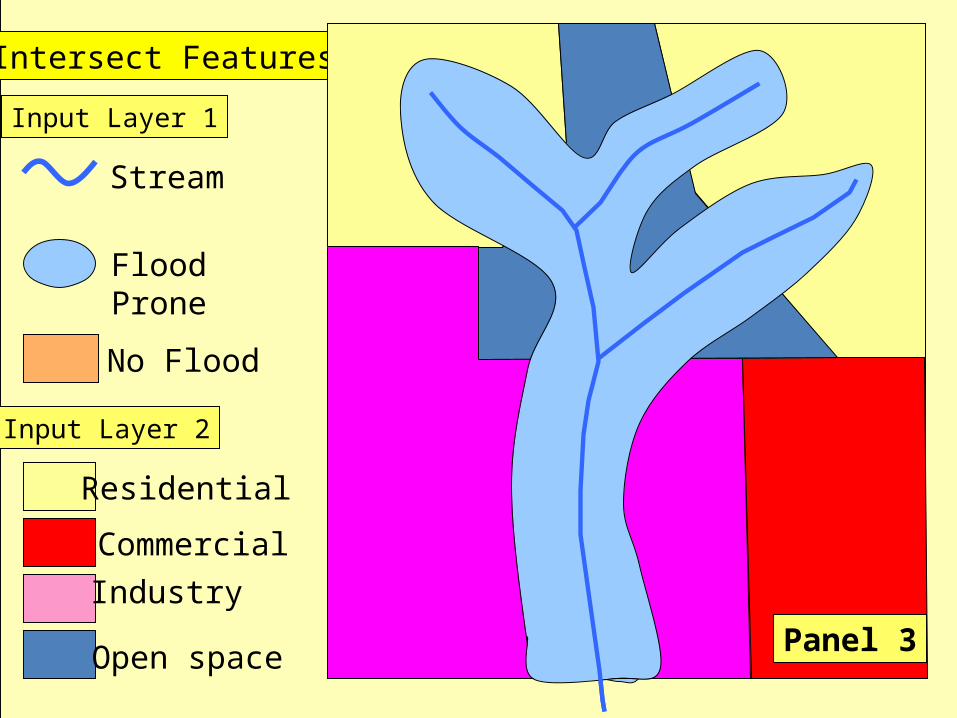
Stream
No Flood
FloodProne
Intersect Features
Input Layer 1
Input Layer 2
Residential
Commercial
Industry
Open space Panel 3

Extent
Intersect Features
Output Layer
Residential &Flood Prone
Panel 4

Panel 1
Panel 2
Panel 3Panel 4

Union

Agricultural Land Use
Corn
Green Beans
Tomatoes
Wheat
Panel 1

Soil Quality
Poor
Fair
Good
Excellent
Panel 2

Agricultural Land Use
Corn
Green Beans
Tomatoes
Wheat
Soil Quality
Poor
Fair
Good
Excellent
Corn &Poor Green Beans & Poor
Green Beans & Fair
Tomatoes & Fair
Tomatoes & Good
Wheat & Good
Wheat & Excellent
Corn & Excellent
Panel 3

Let’s See How It Works

Dissolve

Dissolve Operation
1. Right Click
2. Click to select.

1. Click to open menu
2. Click to open Add Field dialog
Add Field for Dissolve

Type a name and click OK
Name and Type of Field for Dissolve

Table with Code Field
Resulting field

DoubleClick
Click
Click
Do the Dissolve
4
2
3
1
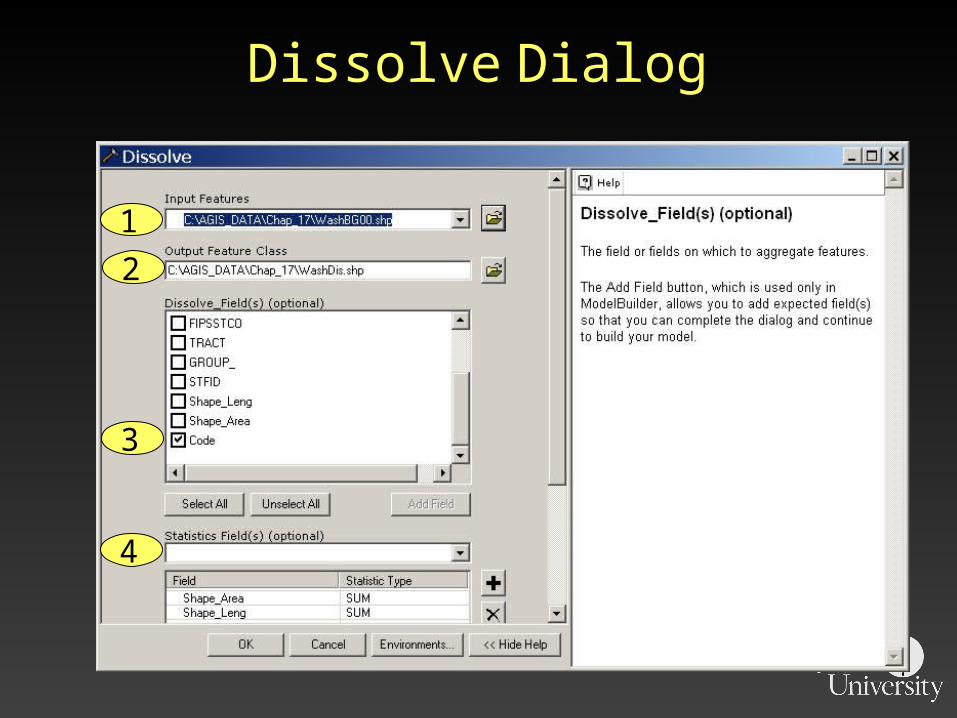
Dissolve Dialog
Dissolve

Click
Click
DoubleClick
Append Operation

4
2
3
1
Append Dialog

Append
Two layers before append One layer after append

Click
Click
DoubleClick
Clip Operation

2
3
1
Clip Dialog

Clipping
Roads before clipping Roads after Clipping

Intersection

Intersection Procedure
• Where are the areas that are residential in land use and flood prone?– Select flood prone areas from flood prone
layer– Select residential areas from land use layer– Do intersection

Intersect

Residential

Select by Attributes Dialog
Selecting flood prone and water areas


Select by Attributes Dialog
Selecting residential areas


Click
Click
DoubleClick
Intersection Operation

4
2
3
1
5
6
Intersection Dialog
Remember, if you did a selection, then get input features from drop down or drag into dialog from TOC

Intersection Result

Intersection
Result

Union

Click
Click
DoubleClick
Union Operation

4
2
3
5
1
Union Dialog

This map depicts land use patterns for a portion of Washington Township prior to performing the union operation in which land use and flood prone layers were overlain.
This map depicts land use patterns for a portion of Washington Township after performing the union operation in which land use and flood prone layers were overlain. Notice that some of the land use polygons have been cut creating new polygons. This occurs in areas in which a polygon from the flood prone layer intersects a land use polygon. The attributes of the new layer enable the analyst to map the coincidence of each land use category with each flood proneness category.