data science 101: an introduction - stanford university · datascience101 i...
TRANSCRIPT

Data Science 101: an introduction
Data Science Team
Stanford University, Department of Statistics

Sexy jobs
“I keep saying the sexy job in the next ten years will be statisticians.People think I’m joking, but who would’ve guessed that computerengineers would’ve been the sexy job of the 1990s?”
“The ability to take data, to be able to understand it, to process it,to extract value from it, to visualize it, to communicate it’s going tobe a at the professional level but even at the educational level forelementary school kids, for high school kids, for college kids.Because now we really do have essentially free and ubiquitous data.”
I Hal Varian, Google’s Chief Economist

Google trends

Keeping things in perspective
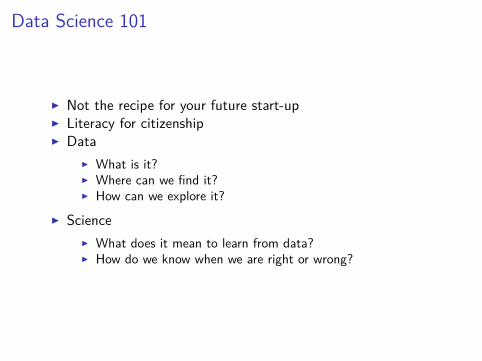
Data Science 101
I Not the recipe for your future start-upI Literacy for citizenshipI Data
I What is it?I Where can we find it?I How can we explore it?
I ScienceI What does it mean to learn from data?I How do we know when we are right or wrong?
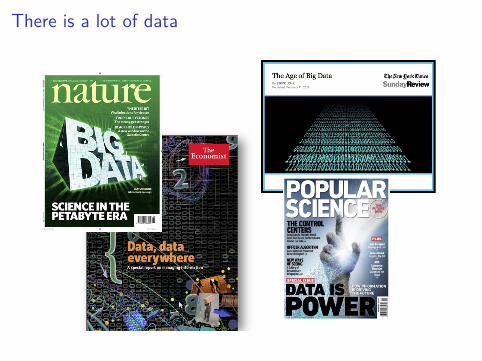
There is a lot of data

Some examples of Big Data
I Genetics data: it is easy to assess genetic variation at millionsof locations in the genome, and to sequence the entire DNA ofa subject; we measure expression levels of 20,000 genes indifferent tissues
I Physics experiments: the data generated in one year is 30petabytes (petabyte of average MP3-encoded songs wouldrequire 2000 years to play)
I Passively gathered dataI Products we buyI Topics that engage usI Our levels of physical activityI Who we talk to

Some sources of Data
I Stats for changeI Data.govI GEOI dbGapI CERNI Private data

Data can do a lot: sports

Data can do a lot: sports
Starting around 2001, the Oakland A’s picked players that scoutsthought were no good but data said otherwise.
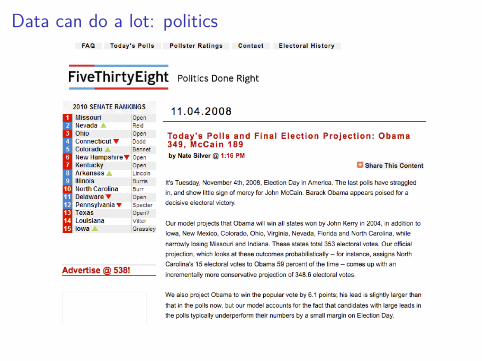
Data can do a lot: politics
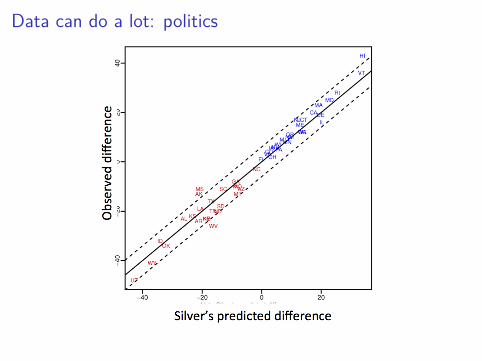
Data can do a lot: politics

Data can do a lot: recommendationsI NETFLIX: US based streaming and DVD rental-by-mail
companyI 10M customers, 10K titles, 1.9M DVDs per day
Netflix challenge
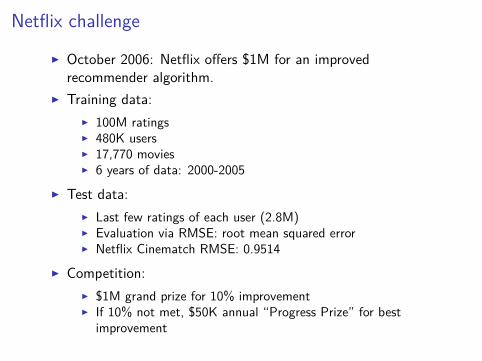
I October 2006: Netflix offers $1M for an improvedrecommender algorithm.
I Training data:I 100M ratingsI 480K usersI 17,770 moviesI 6 years of data: 2000-2005
I Test data:I Last few ratings of each user (2.8M)I Evaluation via RMSE: root mean squared errorI Netflix Cinematch RMSE: 0.9514
I Competition:I $1M grand prize for 10% improvementI If 10% not met, $50K annual “Progress Prize” for best
improvement

Netflix data: training
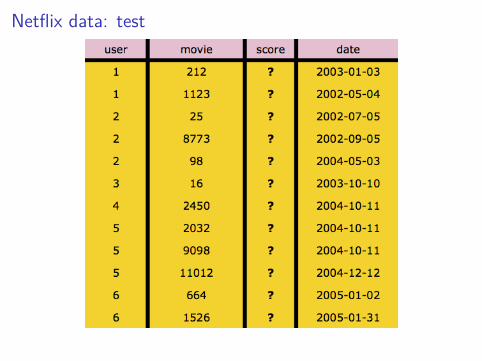
Netflix data: test
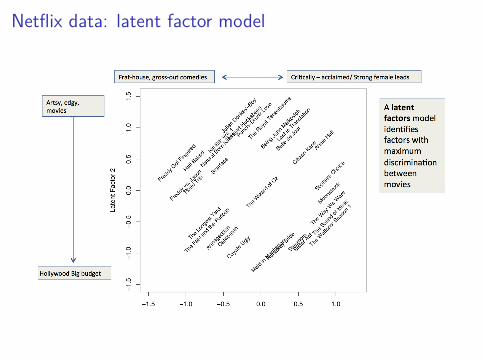
Netflix data: latent factor model
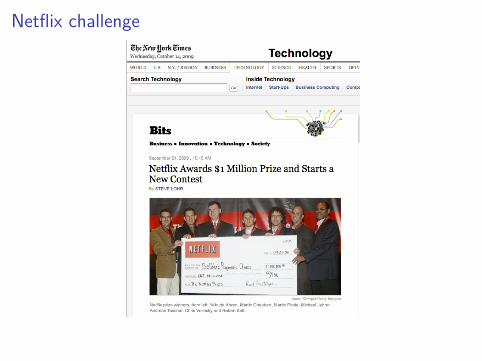
Netflix challenge
In Sept 2009 a team led by Chris Volinsky from AT&T StatisticsResearch was announced as winner!
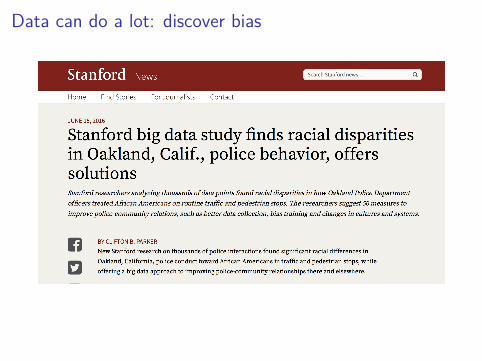
Data can do a lot: discover bias

Data can do a lot: medicine

Data can do a lot: language processing
I For example Google translateI New York Times article.

Is data all we need?

Is data all we need?

Is data all we need?
I It is easy to find “interesting” patterns where none exist!I How should we judge whether a “pattern” is interesting?I When should we worry about falsely labelling patterns“interesting”? (E.g. Google mistranslates a sentencevs. incorrect cancer diagnosis. . . )

Is data all we need?
Blindly used, machine learning algorithms can reinforce biaseshidden in data.

Science is losing its authority?

Learn how to use data
I Explore: identify patternsI Predict: make informed guessesI Infer: quantify what you know
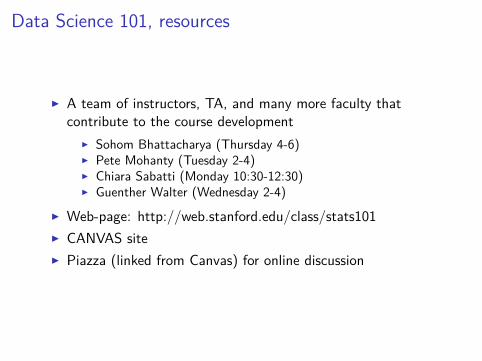
Data Science 101, resources
I A team of instructors, TA, and many more faculty thatcontribute to the course development
I Sohom Bhattacharya (Thursday 4-6)I Pete Mohanty (Tuesday 2-4)I Chiara Sabatti (Monday 10:30-12:30)I Guenther Walter (Wednesday 2-4)
I Web-page: http://web.stanford.edu/class/stats101I CANVAS siteI Piazza (linked from Canvas) for online discussion

Data Science 101: Evaluation
I Weekly homework (40% of grade)I Participation (attendance, activities in labs, etc.) (10%)I Midterm (30% if Midterm > Final)I In class final (30% if Final > Midterm)
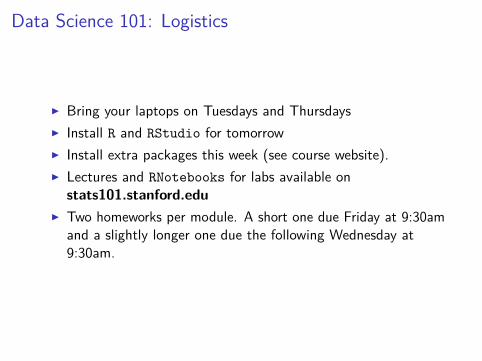
Data Science 101: Logistics
I Bring your laptops on Tuesdays and ThursdaysI Install R and RStudio for tomorrowI Install extra packages this week (see course website).I Lectures and RNotebooks for labs available on
stats101.stanford.eduI Two homeworks per module. A short one due Friday at 9:30am
and a slightly longer one due the following Wednesday at9:30am.