data report: dissolved rare earth elements (rees) in the
TRANSCRIPT

Proc. IODP | Volume 344
Harris, R.N., Sakaguchi, A., Petronotis, K., and the Expedition 344 ScientistsProceedings of the Integrated Ocean Drilling Program, Volume 344
Data report: dissolved rare earth elements (REEs) in the pore fluids of Sites U1378, U1380, U1381, and U1414
drilled during IODP Expeditions 334 and 3441
Jon Yang,2 Ji-Hoon Kim,3 Marta Torres,2 and Brian Haley2
Chapter contents
Abstract . . . . . . . . . . . . . . . . . . . . . . . . . . . . . . . 1
Introduction . . . . . . . . . . . . . . . . . . . . . . . . . . . 1
Study sites . . . . . . . . . . . . . . . . . . . . . . . . . . . . . 3
Methods . . . . . . . . . . . . . . . . . . . . . . . . . . . . . . 3
Results and discussion. . . . . . . . . . . . . . . . . . . . 4
Acknowledgments. . . . . . . . . . . . . . . . . . . . . . . 5
References . . . . . . . . . . . . . . . . . . . . . . . . . . . . . 6
Figures . . . . . . . . . . . . . . . . . . . . . . . . . . . . . . . . 9
Tables. . . . . . . . . . . . . . . . . . . . . . . . . . . . . . . . 14
Appendix . . . . . . . . . . . . . . . . . . . . . . . . . . . . . 16
Appendix tables. . . . . . . . . . . . . . . . . . . . . . . . 17
1Yang, J., Kim, J.-H., Torres, M., and Haley, B., 2018. Data report: dissolved rare earth elements (REEs) in the pore fluids of Sites U1378, U1380, U1381, and U1414 drilled during IODP Expeditions 334 and 344. In Harris, R.N., Sakaguchi, A., Petronotis, K., and the Expedition 344 Scientists, Proceedings of the Integrated Ocean Drilling Program, 344: College Station, TX (Integrated Ocean Drilling Program). doi:10.2204/iodp.proc.344.209.20182College of Earth, Ocean, and Atmospheric Science, Oregon State University, 104 CEOAS Administrative Building, Corvallis OR 97331-5503, USA. Correspondence author: [email protected] Institute of Geosciences and Mineral Resources, Daejeon 305-350, Republic of Korea.
AbstractIn this report, we present the concentrations of dissolved rareearth elements (REEs) in pore fluids recovered during Interna-tional Ocean Discovery Program (IODP) Expeditions 334 and 344from the active margin of Costa Rica. We measured dissolvedREEs at three sites on the Costa Rica margin: Sites U1378/U1380on middle slope of the continental margin and Sites U1381 andU1414 on the incoming Cocos plate. Pore fluids recovered fromthese cores were filtered and acidified after sampling and storeduntil the dissolved REEs could be measured directly using an auto-mated chromatography preconcentration system attached to aninductively coupled plasma–mass spectrometer at Oregon StateUniversity. At Sites U1378/U1380 on the continental slope, themeasured REE concentrations in the pore fluid were variable inthe upper 200 meters below seafloor (mbsf), ranging from 9 to162 pM, 24 to 120 pM, and 29 to 145 pM for La, Dy, and Yb, re-spectively, representing the light, middle, and heavy REEs. Deeperthan 200 mbsf at Sites U1378/U1380, measured concentrationsdecreased from 100 to 17 pM, 10 to 4 pM, and 50 to 10 pM for La,Dy, and Yb. At Site U1381 on the incoming Cocos plate, measuredconcentrations peaked at 192 (La), 43 (Dy), and 74 pM (Yb) at 20mbsf. Deeper than 80 mbsf, measured concentrations increase,particularly for the light and middle REEs, with averages of 273(La), 38 (Dy), and 26 pM (Yb). At the second site on the incomingplate, Site U1414, measured REE concentrations peak in the upper75 mbsf and return to relatively constant values deeper than 75mbsf. Peak concentrations of 834 (La), 223 (Dy), and 207 pM (Yb)are followed by average concentrations of ~25 (La), ~10 (Dy), and~20 pM (Yb) deeper than 75 mbsf. Dissolved REE concentrationsin the pore fluids were normalized to Post-Archean AustralianShale (PAAS) to evaluate relative abundances of light, middle, andheavy REEs. For all three sites, normalized concentrations show agreater abundance of heavy REEs relative to light and middleREEs. The trend for this greater relative abundance of heavy REEsis greatest for the upper portion of the sediment and becomes lesspronounced downcore.
IntroductionThe objective of the Costa Rica Seismogenesis Project (CRISP) un-dertaken by Expeditions 334 and 344 was to understand the pro-
doi:10.2204/iodp.proc.344.209.2018

J. Yang et al. Data report: dissolved rare earth elements in pore fluids
cesses controlling fault zone behavior during earth-quake nucleation and rupture propagation aterosional subduction zones. Offshore Costa Rica, theerosional subduction zone is formed by the incom-ing oceanic Cocos plate subducting under the Carib-bean plate. The CRISP study area is located offshorethe Osa Peninsula, an area characterized by low sedi-ment supply, fast convergence rates, abundant plateinterface seismicity, and variable relief of the sub-ducting plate along strike (see the Expedition 344summary chapter [Harris et al., 2013a]). An import-ant component to evaluating processes occurring aterosional subduction zones is the geochemical char-acterization of the interstitial pore fluids, which mayyield insights to the changes in fluid-rock interac-tions occurring in the depths of seismogenesis. Addi-tionally, important feedback mechanisms exist be-tween chemical reactions in the sediments and thehydrologic characteristics of the sediments includingporosity, permeability, and fluid pressure, which inturn influence the mechanical state of the plate in-terface at depth.
Rare earth elements (REEs) provide one tool to char-acterize the geochemistry of the interstitial pore flu-ids. REEs are categorized as the 14 naturally occur-ring members of the lanthanide series that share thesame valence electron shell and thus display similargroup chemical properties and characteristics. Im-portantly, however, REEs differentiate subtly inchemical reactivity as the ionic radius contracts withincreasing atomic number. This slight differentiationleads to consistent and predictable fractions betweenthe informally designated light (La to Nd), middle(Sm to Dy), and heavy (Ho to Lu) REEs during physi-cal, chemical, and biological processes (Byrne and Li,1995; Byrne and Sholkovitz, 1996; Elderfield andGreaves, 1982). To evaluate these relative fraction-ations among REEs, the standard practice is to nor-malize the concentrations to a reference material.For oceanic studies, the majority of REEs are sourcedfrom continental weathering and delivery by riversystems; therefore, Post-Archean Australian Shale(PAAS) is often used as the reference material (Elder-field et al., 1990; Pourmand et al., 2012; Sholkovitzet al., 1999; Taylor et al., 1981). Normalized to PAAS,dissolved oceanic REEs generally display enrichmentof heavy REEs relative to middle and light REEs (e.g.,De Baar et al., 1985; Elderfield and Greaves, 1982;Sholkovitz et al., 1994). This signature developsthrough the greater affinity of light REEs to adsorbonto marine particles and the stronger complexationof heavy REEs to dissolved carbonate, silicate, or dis-solved organic compounds (e.g., Akagi, 2013; Bauand Koschinsky, 2009; Byrne and Kim, 1990; Byrne
Proc. IODP | Volume 344
and Li, 1995). Additionally, whereas dissolved REEsexist dominantly in a +3 oxidation state, cerium (Ce)can be oxidized through microbial activity to a +4state that is more particle reactive, thus removing Cefrom solution at a greater rate and creating a nega-tive Ce anomaly relative to its neighboring REEs(e.g., Bau and Koschinsky, 2009; Moffett, 1990;Sholkovitz and Schneider, 1991). Europium (Eu) mayalso exist in a reduced +2 oxidation state, thoughthis state is typically only observed in high-tempera-ture reducing conditions such as those found at hy-drothermal vents (e.g., Elderfield, 1988; Klinkham-mer et al., 1983).
In marine pore fluids, the signatures of dissolvedREEs have been documented and associated withvarious diagenetic reactions in the sediments, al-though understanding the diagenetic cycling of REEsis still incomplete (e.g., Abbott et al., 2015; Haley etal., 2004; Kim et al., 2012; Sholkovitz et al., 1989). Inthe oxic zone of the sediments, pore fluid REE mea-surements attributable to particulate organic carbon(POC) show linear enrichment of heavy REEs relativeto light REEs, reflecting remineralization from POCand complexation of heavy REEs to dissolved or-ganic carbon (DOC) (Haley et al., 2004). Conversely,measurements of fresh, labile organic matter in thesediments that had been isolated through an H2O2
extraction have shown middle-REE enrichment(Freslon et al., 2014). In the ferruginous zone of thesediments, where the respiration of organic mattercontinues through the reductive dissolution of Feoxides, a characteristic middle-REE enriched signalin the pore fluids has been observed by several stud-ies (Abbott et al., 2015; Du et al., 2016; Haley et al.,2004). Although there has been some debate as tothe mechanisms behind the middle-REE enrichment,Fe oxide phases isolated through hydroxylamine anddithionite extractions have shown similar middle-REE enrichments, suggesting that the pore fluid sig-natures in this zone are a direct consequence of Feoxide dissolution (Abbott et al., 2016; Du et al.,2016). In the methanogenic zone of the sedimentcolumn, dissolved REEs in the pore fluids take on aheavy-REE enriched pattern (Kim et al., 2012; Soyol-Erdene and Huh, 2013). A recent study of methano-trophs in the Deepwater Horizon oil spill hasdemonstrated that light REEs (La, Ce, Pr, and Nd) areimportant cofactors in methanol dehydrogenase,providing a mechanism for a pore fluid signal de-pleted in light REEs relative to heavy REEs in metha-nogenic sediments (Shiller et al., 2017).
For the CRISP sites, we measured the pore fluid sig-nals at three different locations and from four differ-ent cores: Sites U1378/U1380 from the middle slope
2

J. Yang et al. Data report: dissolved rare earth elements in pore fluids
on the continental margin, Site U1381 from the in-coming plate, and Site U1414, also from the incom-ing plate (Fig. F1). We used a relatively novel samplepreconcentration system (seaFAST2 from ElementalScientific, Inc., Omaha, NE) with direct introductionto an inductively coupled plasma–mass spectrometer(ICP-MS) to measure REEs in these pore fluids.
Study sitesSite U1378 was drilled during Expedition 334 in themiddle slope of the Costa Rica margin, ~38 km off-shore the Osa Peninsula and 24 km from Caño Is-land (Fig. F1). This location is situated above an un-locked portion of the plate boundary, as defined byinterpolate earthquake relocation and geodetic mea-surements, and the upper plate sediment represent-ing the older framework wedge is overlaid by ~750 mof slope sediments (LaFemina et al., 2009; Expedi-tion 334 Scientists, 2012a; Vannucchi et al., 2016).This older framework wedge, however, was notreached during drilling at Site U1378 or at comple-mentary Hole U1380A because of unfavorable drill-ing conditions (Expedition 334 Scientists, 2012b).The sediment composition at Site U1378 is markedby a monotonous sequence of silty clay to clay alter-nating with widely interspersed centimeter-scalesandy layers. Hole U1380C was drilled during Expe-dition 344 as a complementary site to Site U1378.The goal for drilling Site U1380 was to reach thedeeper portions of the upper slope sequence and un-derlying framework wedge sequences (see the Expe-dition 344 summary chapter [Harris et al., 2013a]).The sediment recovered from this site was character-ized by an alternating, terrestrially sourced, turbid-itic upper slope to shelf sequence (see the Mid-slopeSite U1380 chapter [Harris et al., 2013d]). Given thecomplementary locations of Site U1378 and HoleU1380C, we combine the pore fluid data from thetwo sites to refer to general characterization of theCosta Rica upper slope.
On the incoming plate, Site U1381 was drilled inline with Sites U1378/U1380 to characterize the sedi-ment and oceanic crust entering the seismogeniczone (Fig. F1). The upper 50 m of Site U1381 is com-posed of a monotonous silty clay to clay sequenceand is underlain by a sequence characterized byabundant biogenic components and reflecting pe-lagic sediments (see the Input Site U1381 chapter[Harris et al., 2013b]). Site U1414 is also situated onthe incoming plate but is ~1 km seaward of the de-formation front offshore the Osa Peninsula andnorthwest of Site U1381 (see the Input Site U1414chapter [Harris et al., 2013c]).
Proc. IODP | Volume 344
MethodsPore fluid sampling
Whole-round cores recovered, cut, and capped onthe catwalk were taken to the shipboard laboratory.Samples collected between the seafloor and 50 me-ters below seafloor (mbsf) were processed in a nitro-gen-filled glove bag to avoid oxidation of redox-sen-sitive elements. All other samples were processedunder ambient atmospheric conditions. Cores weregenerally processed within 24 h of recovery and werekept capped in a nitrogen-filled environment at 4°Cuntil processing. For pore fluid collection, after ex-trusion from the core liner the surface of each whole-round sample was carefully scraped with a spatula toremove potential contamination from seawater andsediment smearing. The sediment was then loadedinto a titanium squeezer, modeled after the stainlesssteel squeezer of Manheim and Sayles (1974), andsubjected to pressures as high as 30 MPa but gener-ally <20 MPa using a hydraulic press. As the sedi-ment is pressurized and squeezed, pore fluid passesthrough a prewashed Whatman Number 1 filter andtitanium screen into an acid-washed 60 mL plasticsyringe attached to the bottom of the squeezer as-sembly. The pore fluid is then passed through an ad-ditional 0.2 µm Gelman polysulfone disposable filterand subsampled into acid-washed high-density poly-ethylene bottles. For trace-metal and REE analysis,the pore fluid samples were preserved with the addi-tion of ultraclean HNO3 to pH < 2 and stored at 4°Cuntil analysis onshore.
REE concentration measurementWe measured pore fluid REE concentrations usingthe seaFAST2 system from Elemental Scientific, Inc.,attached as the sample introduction unit to aThermo X-Series II ICP-MS. The seaFAST2 systemuses an ion exchange column with ethylenediamine-triacetic acid/iminodiacetic acid functional groups toselectively preconcentrate transition metals andREEs. An ammonium acetate buffer prepared as 14.5M ammonium hydroxide and 17.4 M glacial aceticacid washes out the alkali and alkaline earth-matrixelements from the column. A solution of 2 M HNO3
then elutes the REEs from the column and onto theICP-MS for quantification. Of the alkali and alkalineearth elements, Ba2+ is particularly problematic forthe analysis of REEs because Ba2+ can form oxides inthe plasma that interfere with the signal of both153Eu and 151Eu, Eu’s two main isotopes. For the porefluid samples in this study in particular, dissolvedBa2+ averaged ~1.5 µM, although values could reachas high as 18 µM in some cases (see the Expedition
3

J. Yang et al. Data report: dissolved rare earth elements in pore fluids
344 summary chapter [Harris et al., 2013a]). Beforethe REEs can be accurately measured, the signal fromBa must be removed or corrected for in the measuredEu signals. The seaFAST2 system is well-suited to sep-arating the Ba2+ signals from REEs in seawater,thereby minimizing the potential of isobaric interfer-ences from the formation of oxides (e.g., Hathorne etal., 2012; Yang and Haley, 2016). The timing of theBa2+ peak during the elution step was closely moni-tored to ascertain that there was no significant con-tribution from BaO formation on the Eu peak. TheICP-MS instrument was tuned to minimize oxide for-mation in the plasma by monitoring the formationof CeO, which was measured and minimized to lev-els of <2% formation.
Analytical precision was monitored through repli-cate measurements (N = 19) of an in-house seawaterstandard (NBP1097) and was quantified with a rela-tive standard deviation of <8% for all REEs except forSm at 11%, Ce at 20%, and Gd at 22% (Table T1). Ex-ternal reproducibility was monitored through repli-cate analyses (N = 10) of the PPREE1 acid mine drain-age reference material diluted 10,000-fold to matchthe REE concentrations with that of seawater andpore fluid and found to fall within one standard de-viation of the most probable values reported by Ver-planck et al. (2001) (Table T1). Detection limits weredetermined as three times the standard deviation ofthe blank signals and are listed in Table T1. Averagemethod blank levels were below these detection lim-its. Sample aliquots and instrument operating condi-tions for each analytical run are given in the “Ap-pendix.”
Results and discussionWe present the measurements of dissolved pore fluidREEs in Tables T2, T3, and T4. To illustrate thedownhole behavior of dissolved REEs as a series, weselected representative members of the light, middle,and heavy REE groups: La, Dy, and Yb, respectively.Downhole profiles of alkalinity, NH4
+, and Ba2+ inthe pore fluids are shown to contextualize the dis-solved REE profiles with the major geochemical char-acteristics of the sediment column (see the Expedi-tion 344 summary chapter [Harris et al., 2013a]).Dissolved concentrations of REEs are normalized toPAAS, and representative ratios of (Dy/La)N, (Yb/La)N,and (Yb/Dy)N, where N represents the normalized val-ues, are shown to assess the degree the relative abun-dances of the light, middle, and heavy REEs to oneanother. Ratios of other representative members ofthe light, middle, and heavy REEs did not vary ap-
Proc. IODP | Volume 344
preciably from the chosen ratios or affect interpreta-tion. Ratios of a composite average of light, middle,and heavy REEs also did not diverge significantlyfrom the interpreted results.
Sites U1378/U1380REEs measured in pore fluids of the upper slope ofCosta Rica show great variability in the upper 200mbsf, with La ranging from 9 to 162 pM, Dy from 24to 120 pM, and Yb from 29 to 145 pM (Fig. F2A; Ta-ble T2). REEs in this upper 200 mbsf interval also dis-play relatively greater abundances of middle andheavy REEs over light REEs (Fig. F2B). The highestnormalized ratios occur at 24 mbsf, where (Dy/La)N
is 41, (Yb/La)N is 190, and (Yb/Dy)N is 5. This sampledepth also corresponds to the lowest concentrationsof La and Dy in the upper 200 mbsf of the sedi-ments. Yb concentration at this depth is 97 pM,which is significantly higher than La and Tb, ac-counting for the elevated ratios. What accounts forthe low concentrations of light and middle REEs inthis sample, especially relative to the surroundingsamples, is less clear, but we cannot discredit the va-lidity of this signal that is above our detection limitsand within the reported error. Comparatively, ratiosin the upper 200 mbsf, not including the 24 mbsfsample, average ~8 for (Dy/La)N, ~18 for (Yb/La)N,and ~2 for (Yb/Dy)N. Overall, normalized patterns ofdissolved REEs in the upper 200 mbsf interval arecharacterized as increasing from light to heavy REEs(Fig. F2C).
Deeper than 200 mbsf, REE concentrations distinctlydecrease with depth in the core. In this interval, Ladecreases from ~100 to ~10 pM, Dy from ~10 to ~4pM, and Yb from ~50 to ~2 pM (Fig. F2A). The rela-tive abundances of middle and heavy REEs over lightREEs are elevated but less so than in the upper 200mbsf interval (Fig. F2B). Normalized ratios average~5 for (Dy/La)N, ~9 for (Yb/La)N, and ~2 for (Yb/Dy)N.Compared to the REE patterns of the upper 200mbsf, the lower depths in the sediment at the slopesite are relatively flat (Fig. F2C).
Although there is no discernible correlation betweenREEs and NH4
+ or Ba2+ throughout the entire core, arelatively strong relationship exists between REEsand alkalinity, particularly in the lower depths of thecore (Fig. F3). For pore fluid samples deeper than 200mbsf, the R2 values for a linear regression betweenREEs and alkalinity are 0.8886, 0.9807, and 0.9554for La, Dy, and Yb, respectively. If we extrapolatethese linear relationships to the interval shallowerthan 200 mbsf, the data show a net deficit relative to
4

J. Yang et al. Data report: dissolved rare earth elements in pore fluids
the alkalinity for La and Tb in a number of samples.By contrast, extrapolating the linear relationship forYb shows a slight net surplus in the upper 200 mbsf.
Site U1381On the incoming plate at Site U1381, the discerniblecharacteristic of dissolved REEs in pore fluids is local-ized maxima in concentrations at ~20 mbsf for La,Dy, and Yb and increases, particularly in La concen-trations, deeper than 80 mbsf (Fig. F4A; Table T3). Inthe uppermost pore fluid sample from the upper 2mbsf of the sediment, concentrations of light andmiddle REEs are elevated, with La = 192 pM, Dy = 43pM, and Yb = 36 pM. Comparatively, in samplesfrom 8 and 14 mbsf dissolved concentrations of La,Dy, and Yb average ~60, ~28, and ~46 pM, respec-tively. These dissolved REE concentrations reach lo-cal maxima of 193, 76, and 74 for La, Tb, and Yb, re-spectively, at ~20 mbsf before decreasing to averagesof ~60, ~17, and ~20 pM between 40 and 80 mbsf.Deeper than 80 mbsf, concentrations of light andmiddle REEs are particularly elevated, averaging 273,38, and 26 pM for La, Tb, and Yb, respectively, forthe three samples measured in this interval.
Normalized REE ratios generally show greater abun-dances of middle and heavy REEs relative to lightREEs throughout the core (Fig. F4B). These ratios arerelatively constant throughout the upper 80 mbsf,averaging ~3, ~8, and ~2 for (Dy/La)N, (Yb/La)N, and(Yb/Dy)N, respectively. An exception is the sample at50 mbsf, which shows elevated ratios of 10, 41, and4 for (Dy/La)N, (Yb/La)N, and (Yb/Dy)N, respectively.These elevated values may be an artifact of the rela-tively low concentrations of REEs because this partic-ular sample records the lowest values for the entirecore. For the three samples deeper than 80 mbsf,normalized ratios are the lowest in the core, averag-ing 2, 2, and 1 for (Dy/La)N, (Yb/La)N, and (Yb/Dy)N.These ratios are reflected in the overall normalizedREE patterns, with the deepest samples plotting be-low samples from the upper depths of the sediment(Fig. F4C). By comparison, REEs measured in theframework wedge of Site U1381 exhibit concentra-tions that are orders of magnitude greater than inthe pore fluids and show moderate anomalies in theEu signal and a relatively greater abundance of heavyREEs over light REEs (see Yan and Shi, 2016) (Fig.F5). Unlike dissolved REEs in the pore fluids of slopeSites U1378/U1380, no observable correlation existsbetween REEs and alkalinity at the incoming plateSite U1381.
Proc. IODP | Volume 344
Site U1414At the second site on the incoming plate, Site U1414,dissolved REEs in the pore fluids are characterized bya general peak in concentrations in the upper 75mbsf of the sediment and relatively low, constantvalues deeper than 75 mbsf (Fig. F6A, Table T4). Inthis upper 75 mbsf, REEs reach maximum values of834, 223, and 207 pM for La, Dy, and Yb, respec-tively. Deeper than 75 mbsf, REE profiles are fairlyconstant, averaging ~25, ~10, and ~20 pM for La, Dy,and Yb. The exception to this profile are two samplesat ~200 and ~250 mbsf, where La is 197 and 108 pM,respectively, Dy is 37 and 20 pM, and Yb is 38 and 20pM. Normalized REE ratios indicate a greater abun-dance of heavy REEs, particularly centered around100 mbsf (Fig. F6B). In general, the deepest porefluid samples in this core have the lowest normalizedratios and the flattest overall patterns, which is con-sistent with REEs at Sites U1381 and U1378/U1380(Fig. F6C). REEs measured in the framework wedgeunderlying these sediments are consistent with theframework wedge at Site U1381, showing orders ofmagnitude greater concentrations than the pore flu-ids, with moderate anomalies in the Eu signal andrelatively greater abundances of the heavy comparedto the light REEs (see Yan and Shi, 2016) (Fig. F5).
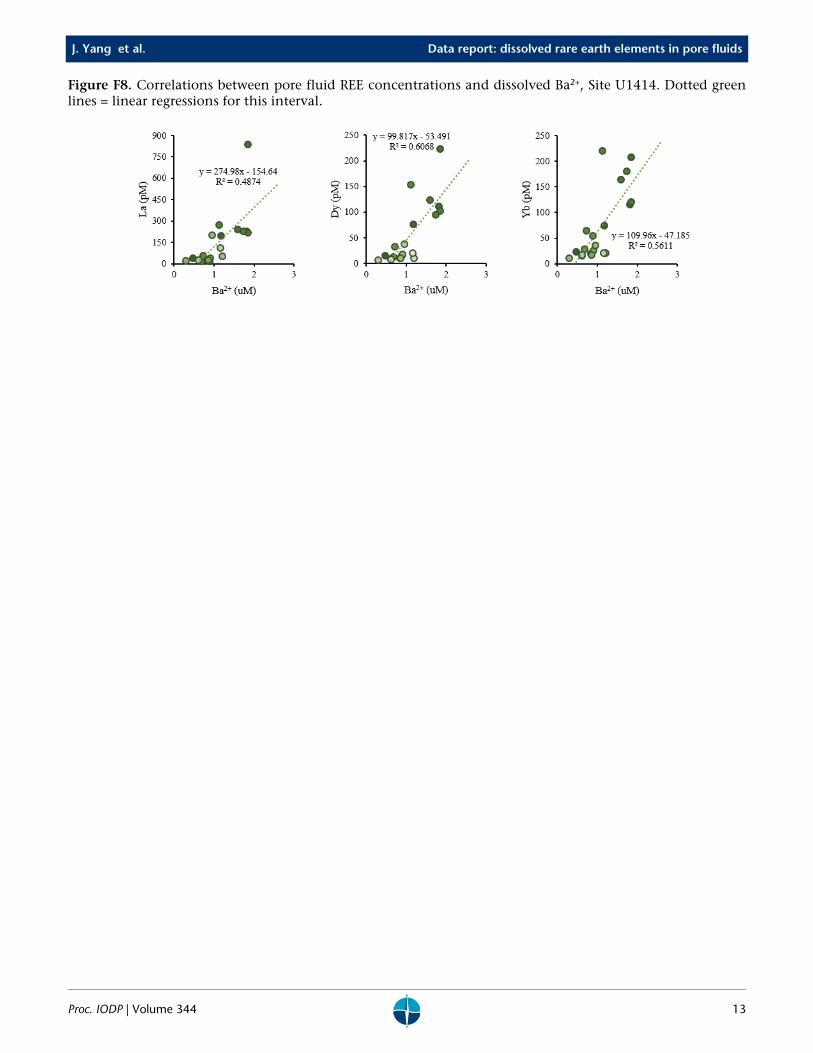
REEs at Site U1414 show a general positive correla-tion with pore fluid alkalinity, although linear re-gressions are relatively weak, with R2 values of 0.418,0.529, and 0.672 for alkalinity correlations with La,Dy, and Yb, respectively (Fig. F7). Pore fluid REEsalso show a slight positive correlation with dissolvedBa2+, except in the Ba2+ peak deeper than 300 mbsf(Fig. F8). For the interval not including the Ba2+
peak, the R2 values for a linear regression betweenBa2+ and REEs are 0.4874, 0.6068, and 0.5611 for La,Dy, and Yb, respectively. The concentrations of Ba2+
in this interval, however, is relatively low, with val-ues between 0.5 and ~2 µM.
AcknowledgmentsThis data report was greatly improved with the com-ments and suggestions of an anonymous reviewer.This research used samples and data provided by theInternational Ocean Discovery Program (IODP),which is sponsored by the US National Science Foun-dation and international partners. This research wasfinancially supported by awards from Korea Inte-grated Ocean Drilling Program (K-IODP) of Ministry
5

J. Yang et al. Data report: dissolved rare earth elements in pore fluids
of Oceans and Fisheries (MOF) to J.-H. Kim and byUS Science Support Program (USSSP) postcruise re-search awards T334B11 and T344A11 (Expeditions334 and 344) to M. Torres.
ReferencesAbbott, A.N., Haley, B.A., and McManus, J., 2016. The
impact of sedimentary coatings on the diagenetic Nd flux. Earth and Planetary Science Letters, 449:217–227. https://doi.org/10.1016/j.epsl.2016.06.001
Abbott, A.N., Haley, B.A., McManus, J., and Reimers, C.E., 2015. The sedimentary flux of dissolved rare earth ele-ments to the ocean. Geochimica et Cosmochimica Acta, 154:186–200. https://doi.org/10.1016/j.gca.2015.01.010
Akagi, T., 2013. Rare earth element (REE)–silicic acid com-plexes in seawater to explain the incorporation of REEs in opal and the “leftover” REEs in surface water: new interpretation of dissolved REE distribution profiles. Geochimica et Cosmochimica Acta, 113:174–192. https://doi.org/10.1016/j.gca.2013.03.014
Bau, M., and Koschinsky, A., 2009. Oxidative scavenging of cerium on hydrous Fe oxide: evidence from the dis-tribution of rare earth elements and yttrium between Fe oxides and Mn oxides in hydrogenetic ferromanganese crusts. Geochemical Journal, 43(1):37–47.https://doi.org/10.2343/geochemj.1.0005
Byrne, R.H., and Kim, K.-H., 1990. Rare earth element scav-enging in seawater. Geochimica et Cosmochimica Acta, 54(10):2645–2656. https://doi.org/10.1016/0016-7037(90)90002-3
Byrne, R.H., and Li, B., 1995. Comparative complexation behavior of the rare earths. Geochimica et Cosmochimica Acta, 59(22):4575–4589. https://doi.org/10.1016/0016-7037(95)00303-7
Byrne, R.H., and Sholkovitz, E.R., 1996. Marine chemistry and geochemistry of the lanthanides. In Gschneidner, K.A., Jr., and Eyring, L. (Eds.), Handbook on the Physics and Chemistry of Rare Earths, 23:497–593. https://doi.org/10.1016/S0168-1273(96)23009-0
De Baar, H.J.W., Bacon, M.P., Brewer, P.G., and Bruland, K.W., 1985. Rare earth elements in the Pacific and Atlantic Oceans. Geochimica et Cosmochimica Acta, 49(9):1943–1959.https://doi.org/10.1016/0016-7037(85)90089-4
Du, J., Haley, B.A., and Mix, A.C., 2016. Neodymium iso-topes in authigenic phases, bottom waters and detrital sediments in the Gulf of Alaska and their implications for paleocirculation reconstruction. Geochimica et Cos-mochimica Acta, 193:14–35. https://doi.org/10.1016/j.gca.2016.08.005
Elderfield, H., 1988. The oceanic chemistry of the rare-earth elements. Philosophical Transactions of the Royal Society, A: Mathematical, Physical & Engineering Sciences, 325:105–126. https://doi.org/10.1098/rsta.1988.0046
Elderfield, H., Upstill-Goddard, R., and Sholkovitz, E.R., 1990. The rare earth elements in rivers, estuaries, and
Proc. IODP | Volume 344
coastal seas and their significance to the composition of ocean waters. Geochimica et Cosmochimica Acta, 54(4):971–991. https://doi.org/10.1016/0016-7037(90)90432-K
Elderfield, H., and Greaves, M.J., 1982. The rare earth ele-ments in seawater. Nature, 296(5854):214–219. http://dx.doi.org/10.1038/296214a0
Expedition 334 Scientists, 2012a. Expedition 334 sum-mary. In Vannucchi, P., Ujiie, K., Stroncik, N., Malin-verno, A., and the Expedition 334 Scientists, Proceedings of the Integrated Ocean Drilling Program, 334: Tokyo (Inte-grated Ocean Drilling Program Management Interna-tional, Inc.). https://doi.org/10.2204/iodp.proc.334.101.2012
Expedition 334 Scientists, 2012b. Site U1378. In Freslon, N., Bayon, G., Toucanne, S., Bermell, S., Bollinger, C., Chéron, S., Etoubleau, J., Germain, Y., Khripounoff, A., Ponzevera, E., and Rouget, M.-L., 2014. Rare earth ele-ments and neodynium isotopes in sedimentary organic matter. Geochimica et Cosmochimica Acta, 140:177–198. https://doi.org/10.1016/j.gca.2014.05.016
Haley, B.A., Klinkhammer, G.P., and McManus, J., 2004. Rare earth elements in pore waters of marine sediments. Geochimica et Cosmochimica Acta, 68(6):1265–1279. https://doi.org/10.1016/j.gca.2003.09.012
Harris, R.N., Sakaguchi, A., Petronotis, K., Baxter, A.T., Berg, R., Burkett, A., Charpentier, D., Choi, J., Diz Fer-reiro, P., Hamahashi, M., Hashimoto, Y., Heydolph, K., Jovane, L., Kastner, M., Kurz, W., Kutterolf, S.O., Li, Y., Malinverno, A., Martin, K.M., Millan, C., Nascimento, D.B., Saito, S., Sandoval Gutierrez, M.I., Screaton, E.J., Smith-Duque, C.E., Solomon, E.A., Straub, S.M., Tan-ikawa, W., Torres, M.E., Uchimura, H., Vannucchi, P., Yamamoto, Y., Yan, Q., and Zhao, X., 2013a. Expedition 344 summary. In Harris, R.N., Sakaguchi, A., Petronotis, K., and the Expedition 344 Scientists, Proceedings of the Integrated Ocean Drilling Program, 344: College Station, TX (Integrated Ocean Drilling Program). https://doi.org/10.2204/iodp.proc.344.101.2013
Harris, R.N., Sakaguchi, A., Petronotis, K., Baxter, A.T., Berg, R., Burkett, A., Charpentier, D., Choi, J., Diz Fer-reiro, P., Hamahashi, M., Hashimoto, Y., Heydolph, K., Jovane, L., Kastner, M., Kurz, W., Kutterolf, S.O., Li, Y., Malinverno, A., Martin, K.M., Millan, C., Nascimento, D.B., Saito, S., Sandoval Gutierrez, M.I., Screaton, E.J., Smith-Duque, C.E., Solomon, E.A., Straub, S.M., Tan-ikawa, W., Torres, M.E., Uchimura, H., Vannucchi, P., Yamamoto, Y., Yan, Q., and Zhao, X., 2013b. Input Site U1381. In Harris, R.N., Sakaguchi, A., Petronotis, K., and the Expedition 344 Scientists, Proceedings of the Inte-grated Ocean Drilling Program, 344: College Station, TX (Integrated Ocean Drilling Program). https://doi.org/10.2204/iodp.proc.344.103.2013
Harris, R.N., Sakaguchi, A., Petronotis, K., Baxter, A.T., Berg, R., Burkett, A., Charpentier, D., Choi, J., Diz Fer-reiro, P., Hamahashi, M., Hashimoto, Y., Heydolph, K., Jovane, L., Kastner, M., Kurz, W., Kutterolf, S.O., Li, Y., Malinverno, A., Martin, K.M., Millan, C., Nascimento, D.B., Saito, S., Sandoval Gutierrez, M.I., Screaton, E.J.,
6

J. Yang et al. Data report: dissolved rare earth elements in pore fluids
Smith-Duque, C.E., Solomon, E.A., Straub, S.M., Tan-ikawa, W., Torres, M.E., Uchimura, H., Vannucchi, P., Yamamoto, Y., Yan, Q., and Zhao, X., 2013c. Input Site U1414. In Harris, R.N., Sakaguchi, A., Petronotis, K., and the Expedition 344 Scientists, Proceedings of the Inte-grated Ocean Drilling Program, 334: Tokyo (Integrated Ocean Drilling Program Management International, Inc.). https://doi.org/10.2204/iodp.proc.344.104.2013
Harris, R.N., Sakaguchi, A., Petronotis, K., Baxter, A.T., Berg, R., Burkett, A., Charpentier, D., Choi, J., Diz Fer-reiro, P., Hamahashi, M., Hashimoto, Y., Heydolph, K., Jovane, L., Kastner, M., Kurz, W., Kutterolf, S.O., Li, Y., Malinverno, A., Martin, K.M., Millan, C., Nascimento, D.B., Saito, S., Sandoval Gutierrez, M.I., Screaton, E.J., Smith-Duque, C.E., Solomon, E.A., Straub, S.M., Tan-ikawa, W., Torres, M.E., Uchimura, H., Vannucchi, P., Yamamoto, Y., Yan, Q., and Zhao, X., 2013d. Mid-slope Site U1380. In Harris, R.N., Sakaguchi, A., Petronotis, K., and the Expedition 344 Scientists, Proceedings of the Inte-grated Ocean Drilling Program, 344: College Station, TX (Integrated Ocean Drilling Program). https://doi.org/10.2204/iodp.proc.344.106.2013
Hathorne, E.C., Haley, B., Stichel, T., Grasse, P., Zieringer, M., and Frank, M., 2012. Online preconcentration ICP-MS analysis of rare earth elements in seawater. Geochem-istry, Geophysics, Geosystems, 13(1):Q01020. https://doi.org/10.1029/2011GC003907
Kim, J.-H., Torres, M.E., Haley, B.A., Kastner, M., Pohlman, J.W., Riedel, M., and Lee, Y.-J., 2012. The effect of dia-genesis and fluid migration on rare earth element distri-bution in pore fluids of the northern Cascadia accretionary margin. Chemical Geology, 291:152–165. https://doi.org/10.1016/j.chemgeo.2011.10.010
Klinkhammer, G., Elderfield, H., and Hudson, A., 1983. Rare earth elements in seawater near hydrothermal vents. Nature, 305(5931):185–188. https://doi.org/10.1038/305185a0
LaFemina, P., Dixon, T.H., Govers, R., Norabuena, E., Turner, H., Saballos, A., Mattioli, G., Protti, M., and Strauch, W., 2009. Fore-arc motion and Cocos Ridge col-lision in Central America. Geochemistry, Geophysics, Geo-systems, 10(5):Q05S14. https://doi.org/10.1029/2008GC002181
Manheim, F.T., and Sayles, F.L., 1974. Composition and origin of interstitial waters of marine sediments, based on deep sea drill cores. In Goldberg, E.D. (Ed.), The Sea (Volume 5): Marine Chemistry: The Sedimentary Cycle: New York (Wiley), 527–568.
Moffett, J.W., 1990. Microbially mediated cerium oxida-tion in seawater. Nature, 345(6274):421–423. https://doi.org/10.1038/345421a0
Pourmand, A., Dauphas, N., and Ireland, T.J., 2012. A novel extraction chromatography and MC-ICP-MS technique for rapid analysis of REE, Sc and Y: revising Cl-chondrite and Post-Archean Australian Sahle (PAAS)
Proc. IODP | Volume 344
abundances. Chemical Geology, 291:38–54. https://doi.org/10.1016/j.chemgeo.2011.08.011
Ross, N., Torres, M.E., Haley, B.A., Solomon, E.A., and Kast-ner, M., 2015. Data report: strontium isotope analyses of pore fluids from the CRISP-A transect drilled during Expeditions 334 and 344. In Harris, R.N., Sakaguchi, A., Petronotis, K., and the Expedition 344 Scientists, Pro-ceedings of the Integrated Ocean Drilling Program, 344: Tokyo (Integrated Ocean Drilling Program Management International, Inc.). https://doi.org/10.2204/iodp.proc.344.201.2015
Shiller, A.M., Chan, E.W., Joung, D.J., Redmond, M.C., and Kessler, J.D., 2017. Light rare earth element depletion during Deepwater Horizon blowout methanotrophy. Sci-entific Reports, 7:10389. https://doi.org/10.1038/s41598-017-11060-z
Sholkovitz, E.R., Elderfield, H., Szymczak, R., and Casey, K., 1999. Island weathering: river sources of rare earth ele-ments to the western Pacific Ocean. Marine Chemistry, 68(1–2):39–57. https://doi.org/10.1016/S0304-4203(99)00064-X
Sholkovitz, E.R., Landing, W.M., and Lewis, B.L., 1994. Ocean particle chemistry: the fractionation of rare earth elements between suspended particles and seawater. Geochimica et Cosmochimica Acta, 58(6):1567–1579. https://doi.org/10.1016/0016-7037(94)90559-2
Sholkovitz, E.R., Piepgras, D.J., and Jacobsen, S.B., 1989. The pore water chemistry of rare earth elements in Buz-zards Bay sediments. Geochimica et Cosmochimica Acta, 53(11):2847–2856. https://doi.org/10.1016/0016-7037(89)90162-2
Sholkovitz, E.R., and Schneider, D.L., 1991. Cerium redox cycles and rare earth elements in the Sargasso Sea. Geo-chimica et Cosmochimica Acta, 55(10):2737–2743. https://doi.org/10.1016/0016-7037(91)90440-G
Soyol-Erdene, T.-O., and Huh, Y., 2013. Rare earth element cycling in the pore waters of the Bering Sea slope (IODP Exp. 323). Chemical Geology, 358:75–89. https://doi.org/10.1016/j.chemgeo.2013.08.047
Taylor, S.R., McLennan, S.M., Armstrong, R.L., and Tarney, J., 1981. The composition and evolution of the conti-nental crust: rare earth element evidence from sedimen-tary rocks. Philosophical Transactions of the Royal Society A: Mathematical, Physical and Engineering Sciences, 301(1461):381–399. https://doi.org/10.1098/rsta.1981.0119
Vannucchi, P., Morgan, J.P., Silver, E.A., and Kluesner, J.W., 2016. Origin and dynamics of depositionary subduction margins. Geochemistry, Geophysics, Geosystems, 17(6):1966–1974. https://doi.org/10.1002/2016GC006259
Verplanck, P.L., Antweiler, R.C., Nordstrom, D.K., and Tay-lor, H.E., 2001. Standard reference water samples for rare earth element determinations. Applied Geochemistry, 16(2):231–244. https://doi.org/10.1016/S0883-2927(00)00030-5
7

J. Yang et al. Data report: dissolved rare earth elements in pore fluids
Yan, Q., and Shi, X., 2016. Data report: major and trace ele-ment and Sr-Nd-Pb isotope analyses for basement rocks from the CRISP-A transect drilled during Expeditions 334 and 344. In Harris, R.N., Sakaguchi, A., Petronotis, K., and the Expedition 344 Scientists, Proceedings of the Integrated Ocean Drilling Program, 344: College Station, TX (Integrated Ocean Drilling Program). https://doi.org/10.2204/iodp.proc.344.205.2016
Proc. IODP | Volume 344
Initial receipt: 7 March 2018Acceptance: 11 July 2018Publication: 2 November 2018MS 344-209
8

J. Yang et al. Data report: dissolved rare earth elements in pore fluids
Figure F1. Drilling location map, adapted from Ross et al. (2015). A. Study area location off the Pacific coast ofCosta Rica. CRISP = Costa Rica Seismogenesis Project. B. Site locations drilled during Expeditions 334 and 344.Yellow circles = sites analyzed for pore fluid REEs in this report. C. Schematic depicting the subduction of theCocos plate under the Caribbean plate and the locations of Sites U1378/U1380 and Site U1381 along transectA–A′.
Site U1379
Site U1380
Site U1378
Site U1414
Site U1381
Site U1412
Site U1381 Site U1378/1380Site U1412 Site U1379
8°45'N
8°35'
8°25'
84°10' W 84°00'
A
C
B
CRISP
sites
Igneous oceancrust
Trenchaxis
Frontalprism
5 km
Slopeapron
Frameworkwedge
De
pth
(km
)
CostaRica
Site U1413
Proc. IODP | Volume 344 9

J. Yang et al. Data report: dissolved rare earth elements in pore fluids
Figure F2. Pore fluid REE concentrations, Sites U1378/U1380. Darker to lighter colored symbols representsamples from close to the surface of the sediment to increasing depth. A. Alkalinity, NH4
+, and Ba2+ (from Harriset al., 2013d) and La, Dy, and Yb concentrations representing the light, middle, and heavy REEs, respectively.B. PAAS-normalized (Tb/La)N, (Yb/La)N, and (Yb/Tb)N ratios showing relative abundances of the light, middle,and heavy REEs to each other. C. PAAS-normalized REE patterns.
Figure F3. Correlations between pore fluid REE concentrations and alkalinity, Sites U1378/U1380. Color andshading patterns correlate with depth profile shown in Figure F2. Square symbols = samples from deeper than200 mbsf, dotted line = linear regression for samples deeper than 200 mbsf.
Proc. IODP | Volume 344 10

J. Yang et al. Data report: dissolved rare earth elements in pore fluids
Figure F4. Pore fluid REE concentrations, Site U1381. Darker to lighter colored symbols represent samples fromclose to the surface of the sediment to increasing depth. A. Alkalinity, NH4
+, and Ba2+ (from Harris et al., 2013d)and La, Dy, and Yb concentrations representing the light, middle, and heavy REEs, respectively. B. PAAS-nor-malized (Tb/La)N, (Yb/La)N, and (Yb/Tb)N ratios showing relative abundances of the light, middle, and heavyREEs to each other. C. PAAS-normalized REE patterns.
Figure F5. (A) Site U1381 and (B) U1414 PAAS-normalized REE patterns for samples from the frameworkwedges underlying the sediments. Data from Yan and Shi, 2016.
Proc. IODP | Volume 344 11

J. Yang et al. Data report: dissolved rare earth elements in pore fluids
Figure F6. Pore fluid REE concentrations, Site U1414. Darker to lighter colored symbols represent samples fromclose to the surface of the sediment to increasing depth. A. Alkalinity, NH4
+, and Ba2+ (from Harris et al., 2013d)and La, Dy, and Yb concentrations representing the light, middle, and heavy REEs, respectively. B. PAAS-nor-malized (Tb/La)N, (Yb/La)N, and (Yb/Tb)N ratios showing relative abundances of the light, middle, and heavyREEs to each other. C. PAAS-normalized REE patterns.
Figure F7. Correlations between pore fluid REE concentrations and alkalinity, Site U1414. Color and shadingpatterns correlate with depth profile shown in Figure F6. Dotted line = linear regression of all data points.
Proc. IODP | Volume 344 12
J. Yang et al. Data report: dissolved rare earth elements in pore fluids
Figure F8. Correlations between pore fluid REE concentrations and dissolved Ba2+, Site U1414. Dotted greenlines = linear regressions for this interval.
Proc. IODP | Volume 344 13

J. Yang et al. Data report: dissolved rare earth elements in pore fluids
Table T1. Reproducibility and external reproducibility of the seaFAST2 method.
* = from Verplanck et al., 2001. RSD = relative standard deviation.
Table T2. Pore fluid REE concentrations, Sites U1378 and U1380.
Standard/Reference material Rare earth element: La Ce Pr Nd Sm Eu Gd Tb Dy Ho Er Tm Yb Lu
NBP1097 (N = 18) Average (pM): 39.8 19.8 7.1 27.3 6.2 2.2 7.5 2.6 9.3 3.5 8.3 2.4 9.3 2.41σ (pM): 3.2 4.0 0.4 2.1 0.7 0.2 1.7 0.1 0.4 0.1 0.4 0.05 0.5 0.1RSD (%): 8 20 6 8 11 8 22 4 5 3 5 2 5 3
PPREE1 (N = 10) Average (ppm): 85.9 171.5 21.5 95.1 21.9 6.5 26.2 4.4 23.8 4.9 12.7 1.9 8.9 1.31σ (ppm): 6.4 10.7 1.2 4.7 1.4 0.3 1.9 0.6 1.8 0.7 0.4 0.7 0.6 0.1
Most probable value (ppm)*: 80.4 161.2 21.2 92.3 20.3 5.95 23.8 3.65 22.0 4.43 11.9 1.48 8.2 1.12Mean average deviation (ppm)*: 5.9 8 1.3 5.7 1.5 0.48 1.7 0.33 0.7 0.09 0.4 0.05 0.13 0.03
Detection limit (pM): 1.52 2.73 0.28 2.60 0.18 0.08 1.30 0.06 0.60 0.12 0.12 0.02 0.06 0.02
Core, sectionDepth(mbsf)
La(pM)
Ce(pM)
Pr(pM)
Nd(pM)
Sm(pM)
Eu(pM)
Gd(pM)
Tb(pM)
Dy(pM)
Ho(pM)
Er(pM)
Tm(pM)
Yb(pM)
Lu(pM)
334-U1378B-1H-1 1.38 47 94 11 52 16 5 20 6 27 13 42 6 29 71H-4 4.96 57 145 15 79 24 7 34 8 48 16 49 10 52 112H-3 9.68 122 370 35 177 48 14 65 13 80 24 80 12 71 142H-4 11.18 133 338 39 204 54 16 79 16 102 31 109 15 88 173H-1 16.18 162 449 43 223 59 17 82 17 120 38 132 22 145 293H-6 23.63 9 18 3 16 7 3 12 5 40 18 69 14 97 225H-6 42.68 27 59 8 37 12 4 16 5 26 11 33 8 43 118H-2 63.82 17 38 6 29 10 4 15 5 24 15 51 7 37 99H-5 79.10 81 197 26 132 33 11 44 9 60 26 91 8 65 1210H-4 87.10 95 201 29 157 45 14 67 13 81 24 74 13 81 1713H-4 107.88 99 262 34 170 48 15 65 14 90 26 81 11 84 1415H-2 118.48 50 103 15 75 22 7 30 7 36 18 55 7 40 917X-3 132.13 50 113 17 91 24 8 36 8 48 13 45 6 45 819X-5 148.55 65 137 20 101 29 10 40 9 54 20 62 10 63 1334X-2 277.96 87 192 25 128 36 14 44 10 62 16 56 7 53 835X-5 292.08 108 220 30 142 35 14 45 10 53 13 38 5 39 637X-2 307.21 97 226 29 135 35 12 44 9 51 14 40 7 38 841X-5 340.74 57 107 16 75 21 8 28 7 35 11 30 6 30 747X-2 379.35 30 50 7 32 10 4 14 4 15 6 13 4 13 550X-2 402.27 46 68 10 44 12 5 17 5 21 8 18 5 18 656X-2 458.24 22 42 6 27 9 3 11 4 14 7 16 4 14 5
334-U1380A-10R-3 475.15 94 191 27 124 34 21 39 9 45 14 42 7 33 8
344-U1380C-3R-3 451.94 161 328 42 174 39 12 45 9 46 13 38 7 35 8
Proc. IODP | Volume 344 14
J. Yang et al. Data report: dissolved rare earth elements in pore fluids
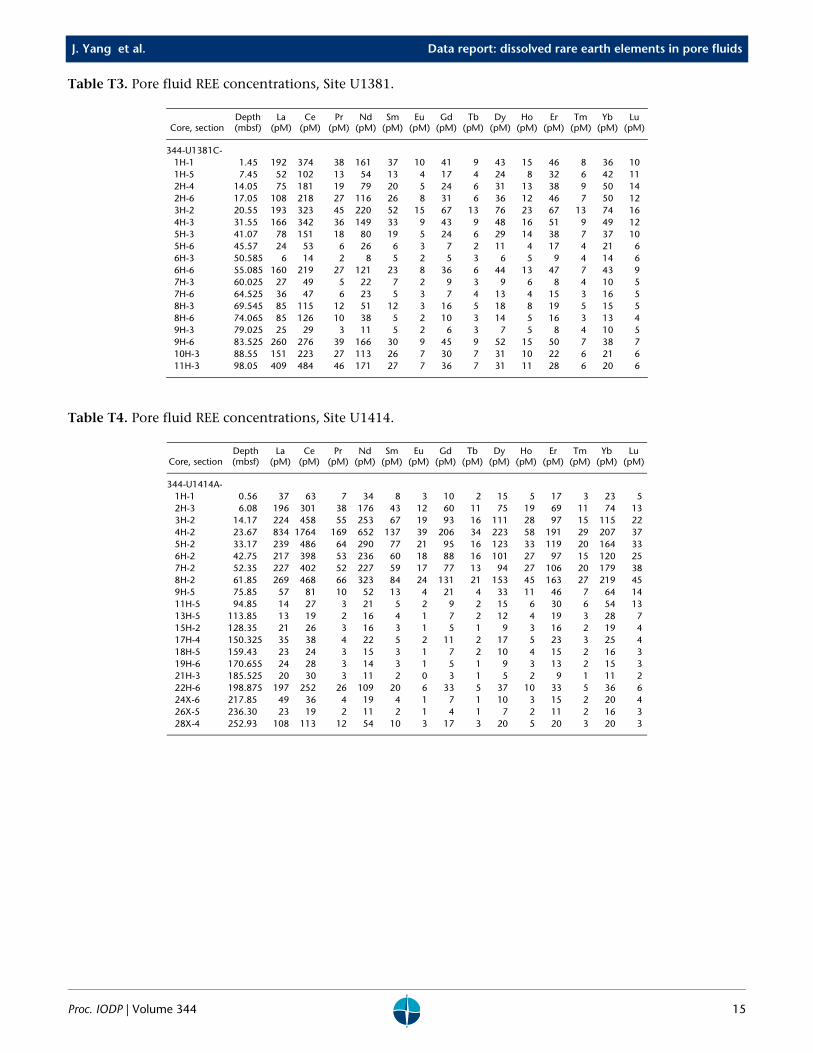
Table T3. Pore fluid REE concentrations, Site U1381.
Table T4. Pore fluid REE concentrations, Site U1414.
Core, sectionDepth(mbsf)
La(pM)
Ce(pM)
Pr(pM)
Nd(pM)
Sm(pM)
Eu(pM)
Gd(pM)
Tb(pM)
Dy(pM)
Ho(pM)
Er(pM)
Tm(pM)
Yb(pM)
Lu(pM)
344-U1381C-1H-1 1.45 192 374 38 161 37 10 41 9 43 15 46 8 36 101H-5 7.45 52 102 13 54 13 4 17 4 24 8 32 6 42 112H-4 14.05 75 181 19 79 20 5 24 6 31 13 38 9 50 142H-6 17.05 108 218 27 116 26 8 31 6 36 12 46 7 50 123H-2 20.55 193 323 45 220 52 15 67 13 76 23 67 13 74 164H-3 31.55 166 342 36 149 33 9 43 9 48 16 51 9 49 125H-3 41.07 78 151 18 80 19 5 24 6 29 14 38 7 37 105H-6 45.57 24 53 6 26 6 3 7 2 11 4 17 4 21 66H-3 50.585 6 14 2 8 5 2 5 3 6 5 9 4 14 66H-6 55.085 160 219 27 121 23 8 36 6 44 13 47 7 43 97H-3 60.025 27 49 5 22 7 2 9 3 9 6 8 4 10 57H-6 64.525 36 47 6 23 5 3 7 4 13 4 15 3 16 58H-3 69.545 85 115 12 51 12 3 16 5 18 8 19 5 15 58H-6 74.065 85 126 10 38 5 2 10 3 14 5 16 3 13 49H-3 79.025 25 29 3 11 5 2 6 3 7 5 8 4 10 59H-6 83.525 260 276 39 166 30 9 45 9 52 15 50 7 38 710H-3 88.55 151 223 27 113 26 7 30 7 31 10 22 6 21 611H-3 98.05 409 484 46 171 27 7 36 7 31 11 28 6 20 6
Core, sectionDepth(mbsf)
La(pM)
Ce(pM)
Pr(pM)
Nd(pM)
Sm(pM)
Eu(pM)
Gd(pM)
Tb(pM)
Dy(pM)
Ho(pM)
Er(pM)
Tm(pM)
Yb(pM)
Lu(pM)
344-U1414A-1H-1 0.56 37 63 7 34 8 3 10 2 15 5 17 3 23 52H-3 6.08 196 301 38 176 43 12 60 11 75 19 69 11 74 133H-2 14.17 224 458 55 253 67 19 93 16 111 28 97 15 115 224H-2 23.67 834 1764 169 652 137 39 206 34 223 58 191 29 207 375H-2 33.17 239 486 64 290 77 21 95 16 123 33 119 20 164 336H-2 42.75 217 398 53 236 60 18 88 16 101 27 97 15 120 257H-2 52.35 227 402 52 227 59 17 77 13 94 27 106 20 179 388H-2 61.85 269 468 66 323 84 24 131 21 153 45 163 27 219 459H-5 75.85 57 81 10 52 13 4 21 4 33 11 46 7 64 1411H-5 94.85 14 27 3 21 5 2 9 2 15 6 30 6 54 1313H-5 113.85 13 19 2 16 4 1 7 2 12 4 19 3 28 715H-2 128.35 21 26 3 16 3 1 5 1 9 3 16 2 19 417H-4 150.325 35 38 4 22 5 2 11 2 17 5 23 3 25 418H-5 159.43 23 24 3 15 3 1 7 2 10 4 15 2 16 319H-6 170.655 24 28 3 14 3 1 5 1 9 3 13 2 15 321H-3 185.525 20 30 3 11 2 0 3 1 5 2 9 1 11 222H-6 198.875 197 252 26 109 20 6 33 5 37 10 33 5 36 624X-6 217.85 49 36 4 19 4 1 7 1 10 3 15 2 20 426X-5 236.30 23 19 2 11 2 1 4 1 7 2 11 2 16 328X-4 252.93 108 113 12 54 10 3 17 3 20 5 20 3 20 3
Proc. IODP | Volume 344 15

J. Yang et al. Data report: dissolved rare earth elements in pore fluids
AppendixTables AT1, AT2, and AT3 contain sample aliquot information and instrument operating conditions for eachpore fluid analytical run.
Proc. IODP | Volume 344 16

J. Yang et al. Data report: dissolved rare earth elements in pore fluids
Table AT1. Sample aliquot volumes used during pore fluid analyses.
Core, section
Sample aliquot measured
(mL)
334-U1378B-1H-1 21H-4 22H-3 22H-4 23H-1 23H-6 25H-6 28H-2 29H-5 210H-4 213H-4 215H-2 217X-3 219X-5 234X-2 235X-5 237X-2 241X-5 247X-2 250X-2 256X-2 2
334-U1380A-10R-3 2
344-U1380C-3R-3 2
344-U1381C-1H-1 2.51H-5 2.52H-4 2.52H-6 2.53H-2 2.54H-3 2.55H-3 2.55H-6 2.56H-3 2.56H-6 2.57H-3 2.57H-6 2.58H-3 2.58H-6 2.59H-3 2.59H-6 2.510H-3 2.511H-3 2.5
Core, section
Sample aliquot measured
(mL)
Table AT2. Thermo X-SeriesII inductively coupled plasma–mass spectrometer operating conditions.
Table AT3. Instrument sensitivity per run as indicated by the signal of an internal standard (115In).
RF power (W): 1400Cool gas flow (L/min): 13
Auxiliary gas flow (L/min): 0.8Nebulizer gas flow (L/min): 0.8
Data acquisition: Time-resolved analysisDwell time (ms): 10
Cones: NickelIsotopes monitored: 137Ba, 139La, 140Ce, 141Pr, 146Nd, 147Sm, 153Eu,
157Gd, 159Tb, 163Dy, 165Ho, 166Er, 169Tm, 172Yb, 175LuOxide formation (CeO/Ce) (%): <3
Run date(2013) Expedition Site
Sensitivity (counts/s)
6 Aug 334/344 U1378/U1380 6,654,155344 U1381
15 Aug 344 U1381 7,840,588
344-U1414A-1H-1 32H-3 33H-2 34H-2 35H-2 36H-2 37H-2 38H-2 39H-5 311H-5 313H-5 315H-2 317H-4 318H-5 319H-6 321H-3 322H-6 324X-6 326X-5 328X-4 3
Core, section
Sample aliquot measured
(mL)
Proc. IODP | Volume 344 17