data points to racism and longer confinement of … points to racism and longer confinement of...
TRANSCRIPT
July 2017
Travis County Jail in 2015:Data points to racism and longer confinement of African Americans
Racist Jailing in Travis County
Travis County Jail in 2015: Data points to racism and longer confinement of African Americans
This report was compiled by Chris Harris for Grassroots LeadershipJuly 2017
Design by: Catherine CunninghamCover Art: Favianna Rodriguez and Julio Salgado via the Until We Are All Free Tool Kit by Culture Strike and Mobilize the Immigrant Vote
Grassroots Leadership is an Austin, Texas-based national organization that works for a more just society where prison profiteering, mass incarceration, deportation and criminalization are things of the past.The historical ties between racism and the growth of mass incarceration in the United States are undeniable. Institutional racism throughout the various stages of the criminal justice system, including initial contact with law enforcement, have led to unequal and excessive incarceration of Black people for generations. Our mass incarceration crisis, fueled by racist policing and discriminatory criminal justice policies, continues to have devastating impacts on working class families and communities of color.This report and analysis of booking data from the Travis County Jail in 2015 highlights that Blacks were not only jailed at a much higher rate, but also experienced significantly longer periods of confinement compared to any other race, even when facing the same type and number of charges.We seek to bring these issues to the forefront in Austin/Travis County in order to unite community groups and policy makers in urgent action to address these inequities.
About the Data
The analysis presented herein is based on data provided to Grassroots Leadership by the Travis County Sheriff ’s Office on July 5th, 2016 in response to an Open Records Request. The data includes all bookings into the Travis County Jail that occurred in 2015, demographic data regarding each individual booked, all charges associated with each booking, the authority under which each charge was brought, the level code of each charge, the status of each charge as of the running of the report, the disposition of each charge, and the relevant dates related to each booking and charge.
Important notes regarding the analysis:
• Jail time calculations are based on a subtraction of Booking Date from Release Date for each booking. Since hours and minutes were not included in the data set, they are averages of unique days spent in Travis County jail. People that were booked and released on the same day are counted as having spent zero (0) days in jail.
• Jail time calculations only consider the bookings that included a Release Date (47,293 out of 47,660 total bookings).Therefore, hundreds of bookings including longer periods of incarceration are not included in these calculations, meaning that the jail time averages contained herein are likely under-reported.
1
OverviewLocal jails are a significant factor in mass incarceration in the United States. As the first place of incarceration for individuals in the criminal justice system, jail admissions in the U.S. were 19 times higher than the number of prison admissions in 20151 totaling just under 11 million people.2 Second to only state prisons in total daily incarceration, 2015 saw 731,000 people locked up on any given day in the 3,000 plus jails across the United States.3 That year in Travis County, there were 47,660 total bookings and the average daily population was 2,465.4 Mass incarceration disproportionately impacts people of color. Despite representing only about 30 percent of the United States’ population, people of color account for more than 60 percent of those imprisoned.5 Of males born in 2001, 1 in 3 Blacks and 1 in 6 Latinos will go to prison at some point during their lifetimes compared with only 1 out of every 17 Whites.6 Unsurprisingly, evidence points to disparate outcomes for those identified as both Black and Hispanic by the Travis County Jail in 2015. However, Blacks faced far more consistently unequal confinement and will therefore be the focus of this report. Nationally, Blacks are jailed at almost four times the rate of Whites7 and Black women are three times more likely than White women to be incarcerated.8 Mirroring national trends, the Urban Institute and the Center for Policing Equity recently found that among stops made by the Austin Police Department, Black motorists were four times more likely to be arrested as White motorists. A complex combination of factors contributes to these disparities, including socio-economic inequities and policing priorities and practices, particularly in neighborhoods and schools where Blacks are highly represented. A principal cause of these factors undoubtedly continues to be racism, both on the part of institutions and individuals within those institutions.Along with arrest rates, the length of confinement for individuals convicted of crimes clearly demonstrates the discriminatory treatment Blacks are subjected to within the criminal justice system. For example, Black male defendants in the federal system have been found to receive longer sentences than Whites arrested for the same offenses with comparable criminal histories9 by nearly 20 percent.10 Incredibly, as this report will show, discrimination against Blacks is also apparent in the length of confinement for “unconvicted” defendants in Travis County as well.While local jails do incarcerate people convicted of crimes, as well as those with parole violations, bench warrants and Immigration & Customs Enforcement (ICE) detainers, the vast majority of people held in jails, including the Travis County Jail, are pre-trial defendants that have not been convicted of any charge for which they’re detained. In fact, from 1999 to 2014, 99% of the growth in jail populations nationally was due to jails housing more pre-trial “unconvicted” defendants.11 Despite this, the average time individuals were locked up in local jails rose by about 9 days between 1983 and 2013.12 Therefore, jails are holding people for longer lengths of time even though more of the jail population has not been convicted of a crime.Jail time, however brief, wreaks havoc on the lives of individuals, families, and communities. Individuals miss work or even lose jobs and subsequently health insurance, vehicles, and housing with devastating effects on their families, especially if those individuals are a family’s sole wage earner. Parents lose custody of children, the infirm lose care-takers, and those with medical and mental health needs who are jailed often experience harmful lapses in care. In addition, detention beyond 24 hours is linked to further involvement in the criminal justice system.13 While racial disparity in jail time is by no means unique locally, sentencing discrimination14, and a more frequent inability to pay bail15 cannot fully explain why Blacks are so consistently subjected to lengthier confinement in Travis County.
TakeawayBooking data from the Travis County Jail in 2015 reveals significant and persistent discrepancies in the number of days spent in the County jail by people of color, particularly Blacks, as compared to Whites. These discrepancies existed regardless of a variety of factors, including but not limited to, the number of charges on the booking, the severity level of the charges and whether bond was approved, including Personal Recognizance Bonds.
2
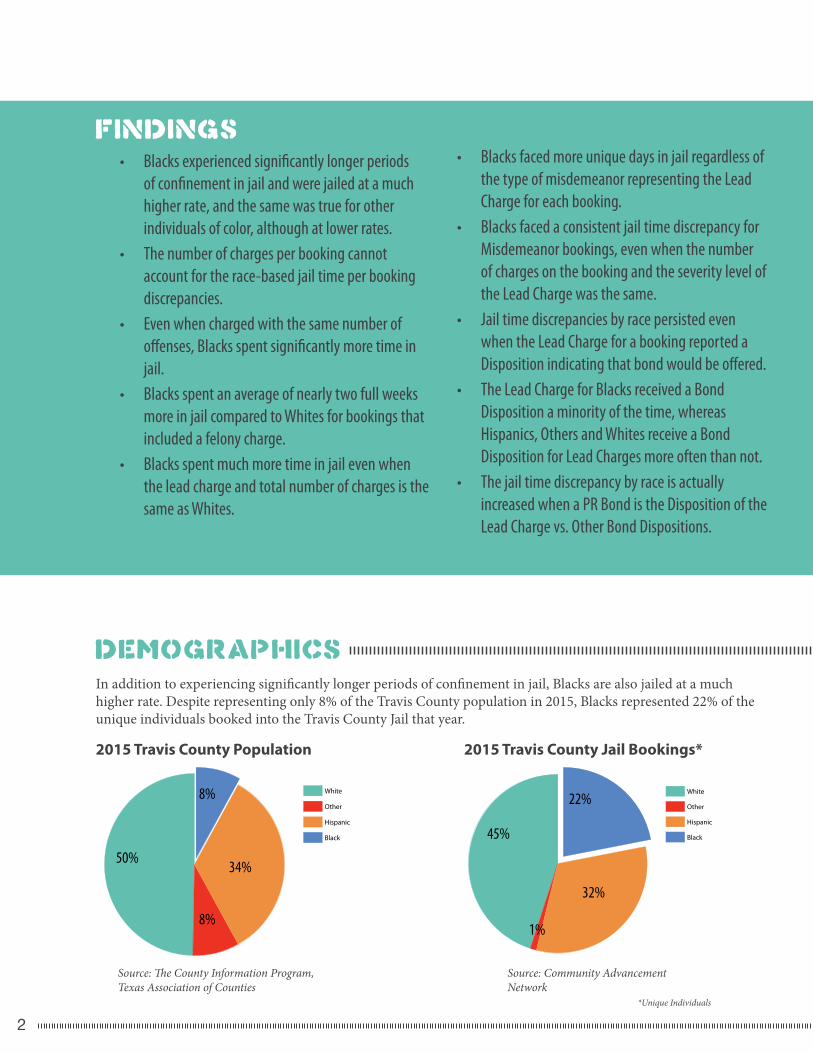
DemographicsIn addition to experiencing significantly longer periods of confinement in jail, Blacks are also jailed at a much higher rate. Despite representing only 8% of the Travis County population in 2015, Blacks represented 22% of the unique individuals booked into the Travis County Jail that year.
White
Other
Hispanic
Black
White
Other
Hispanic
Black
2015 Travis County Population 2015 Travis County Jail Bookings*
50%
8%
34%
8%
45%
22%
32%
1%
Source: The County Information Program, Texas Association of Counties
Source: Community Advancement Network
Findings• Blacks experienced significantly longer periods
of confinement in jail and were jailed at a much higher rate, and the same was true for other individuals of color, although at lower rates.
• The number of charges per booking cannot account for the race-based jail time per booking discrepancies.
• Even when charged with the same number of offenses, Blacks spent significantly more time in jail.
• Blacks spent an average of nearly two full weeks more in jail compared to Whites for bookings that included a felony charge.
• Blacks spent much more time in jail even when the lead charge and total number of charges is the same as Whites.
• Blacks faced more unique days in jail regardless of the type of misdemeanor representing the Lead Charge for each booking.
• Blacks faced a consistent jail time discrepancy for Misdemeanor bookings, even when the number of charges on the booking and the severity level of the Lead Charge was the same.
• Jail time discrepancies by race persisted even when the Lead Charge for a booking reported a Disposition indicating that bond would be offered.
• The Lead Charge for Blacks received a Bond Disposition a minority of the time, whereas Hispanics, Others and Whites receive a Bond Disposition for Lead Charges more often than not.
• The jail time discrepancy by race is actually increased when a PR Bond is the Disposition of the Lead Charge vs. Other Bond Dispositions.
*Unique Individuals
3
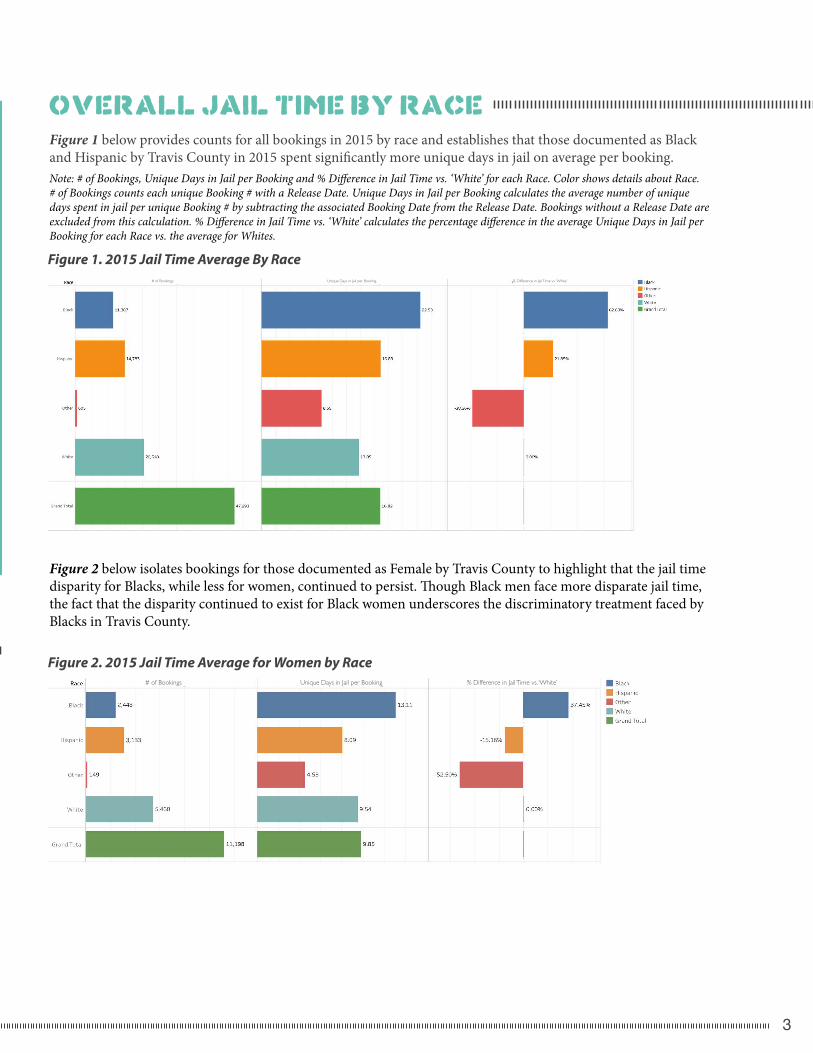
Overall jail time by raceFigure 1 below provides counts for all bookings in 2015 by race and establishes that those documented as Black and Hispanic by Travis County in 2015 spent significantly more unique days in jail on average per booking.Note: # of Bookings, Unique Days in Jail per Booking and % Difference in Jail Time vs. ‘White’ for each Race. Color shows details about Race. # of Bookings counts each unique Booking # with a Release Date. Unique Days in Jail per Booking calculates the average number of unique days spent in jail per unique Booking # by subtracting the associated Booking Date from the Release Date. Bookings without a Release Date are excluded from this calculation. % Difference in Jail Time vs. ‘White’ calculates the percentage difference in the average Unique Days in Jail per Booking for each Race vs. the average for Whites.
Figure 2 below isolates bookings for those documented as Female by Travis County to highlight that the jail time disparity for Blacks, while less for women, continued to persist. Though Black men face more disparate jail time, the fact that the disparity continued to exist for Black women underscores the discriminatory treatment faced by Blacks in Travis County.
Figure 1. 2015 Jail Time Average By RaceUnique Days in Jail per Booking % Difference in Jail Time vs. ‘White’# of Bookings
Figure 2. 2015 Jail Time Average for Women by Race# of Bookings Unique Days in Jail per Booking % Difference in Jail Time vs. ‘White’
4
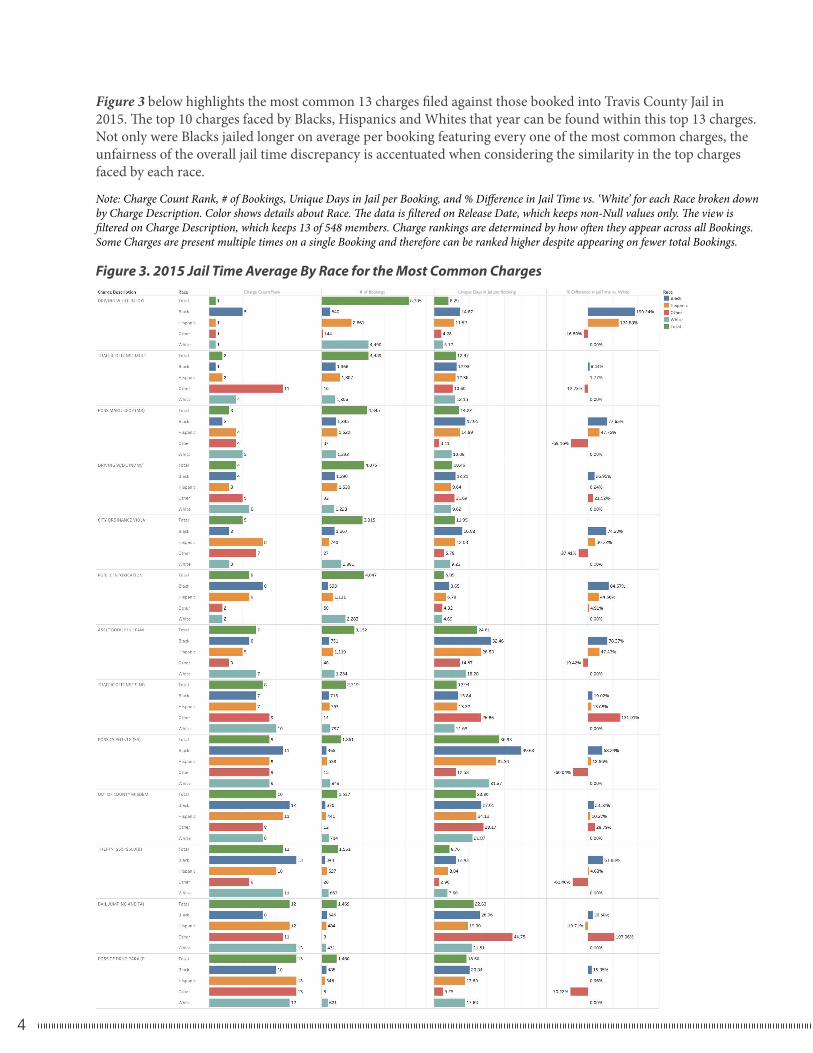
Figure 3 below highlights the most common 13 charges filed against those booked into Travis County Jail in 2015. The top 10 charges faced by Blacks, Hispanics and Whites that year can be found within this top 13 charges. Not only were Blacks jailed longer on average per booking featuring every one of the most common charges, the unfairness of the overall jail time discrepancy is accentuated when considering the similarity in the top charges faced by each race.
Note: Charge Count Rank, # of Bookings, Unique Days in Jail per Booking, and % Difference in Jail Time vs. ‘White’ for each Race broken down by Charge Description. Color shows details about Race. The data is filtered on Release Date, which keeps non-Null values only. The view is filtered on Charge Description, which keeps 13 of 548 members. Charge rankings are determined by how often they appear across all Bookings. Some Charges are present multiple times on a single Booking and therefore can be ranked higher despite appearing on fewer total Bookings.
Figure 3. 2015 Jail Time Average By Race for the Most Common ChargesCharge Count Rank # of Bookings Unique Days in Jail per Booking % Difference in Jail Time vs. ‘White’
5
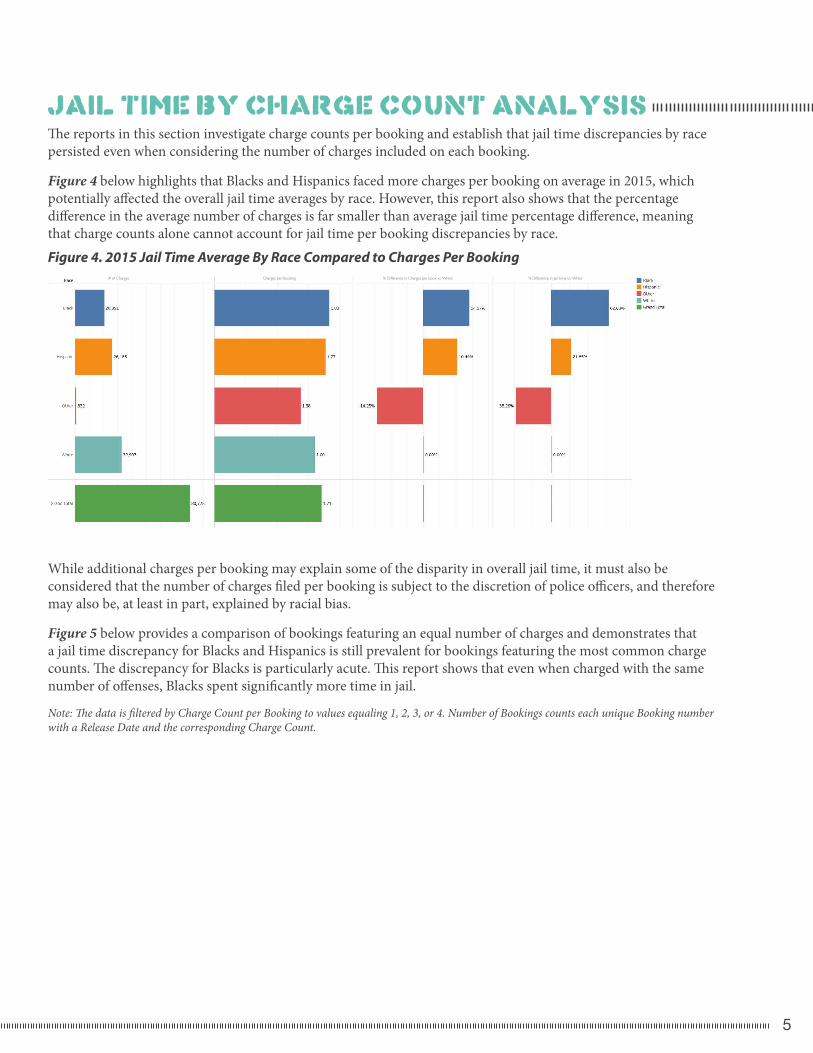
JAIL TIME BY CHARGE COUNT ANALYSISThe reports in this section investigate charge counts per booking and establish that jail time discrepancies by race persisted even when considering the number of charges included on each booking.
Figure 4 below highlights that Blacks and Hispanics faced more charges per booking on average in 2015, which potentially affected the overall jail time averages by race. However, this report also shows that the percentage difference in the average number of charges is far smaller than average jail time percentage difference, meaning that charge counts alone cannot account for jail time per booking discrepancies by race.
Figure 4. 2015 Jail Time Average By Race Compared to Charges Per Booking% Difference in Jail Time vs. ‘White’% Difference in Charges per book vs. ‘White’Charges per Booking# of Charges
While additional charges per booking may explain some of the disparity in overall jail time, it must also be considered that the number of charges filed per booking is subject to the discretion of police officers, and therefore may also be, at least in part, explained by racial bias.
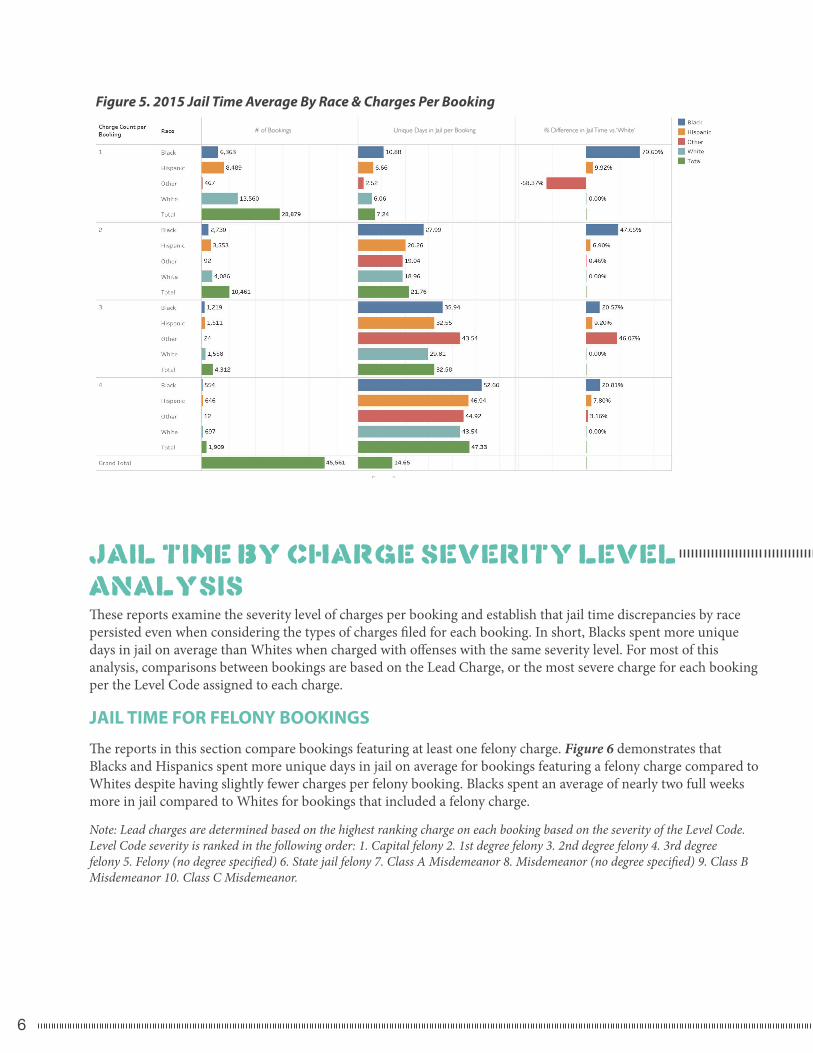
Figure 5 below provides a comparison of bookings featuring an equal number of charges and demonstrates that a jail time discrepancy for Blacks and Hispanics is still prevalent for bookings featuring the most common charge counts. The discrepancy for Blacks is particularly acute. This report shows that even when charged with the same number of offenses, Blacks spent significantly more time in jail.
Note: The data is filtered by Charge Count per Booking to values equaling 1, 2, 3, or 4. Number of Bookings counts each unique Booking number with a Release Date and the corresponding Charge Count.
6
JAIL TIME BY CHARGE SEVERITY LEVEL ANALYSISThese reports examine the severity level of charges per booking and establish that jail time discrepancies by race persisted even when considering the types of charges filed for each booking. In short, Blacks spent more unique days in jail on average than Whites when charged with offenses with the same severity level. For most of this analysis, comparisons between bookings are based on the Lead Charge, or the most severe charge for each booking per the Level Code assigned to each charge.
JAIL TIME FOR FELONY BOOKINGS
The reports in this section compare bookings featuring at least one felony charge. Figure 6 demonstrates that Blacks and Hispanics spent more unique days in jail on average for bookings featuring a felony charge compared to Whites despite having slightly fewer charges per felony booking. Blacks spent an average of nearly two full weeks more in jail compared to Whites for bookings that included a felony charge.
Note: Lead charges are determined based on the highest ranking charge on each booking based on the severity of the Level Code. Level Code severity is ranked in the following order: 1. Capital felony 2. 1st degree felony 3. 2nd degree felony 4. 3rd degree felony 5. Felony (no degree specified) 6. State jail felony 7. Class A Misdemeanor 8. Misdemeanor (no degree specified) 9. Class B Misdemeanor 10. Class C Misdemeanor.
Figure 5. 2015 Jail Time Average By Race & Charges Per Booking
# of Bookings Unique Days in Jail per Booking % Difference in Jail Time vs. ‘White’
7
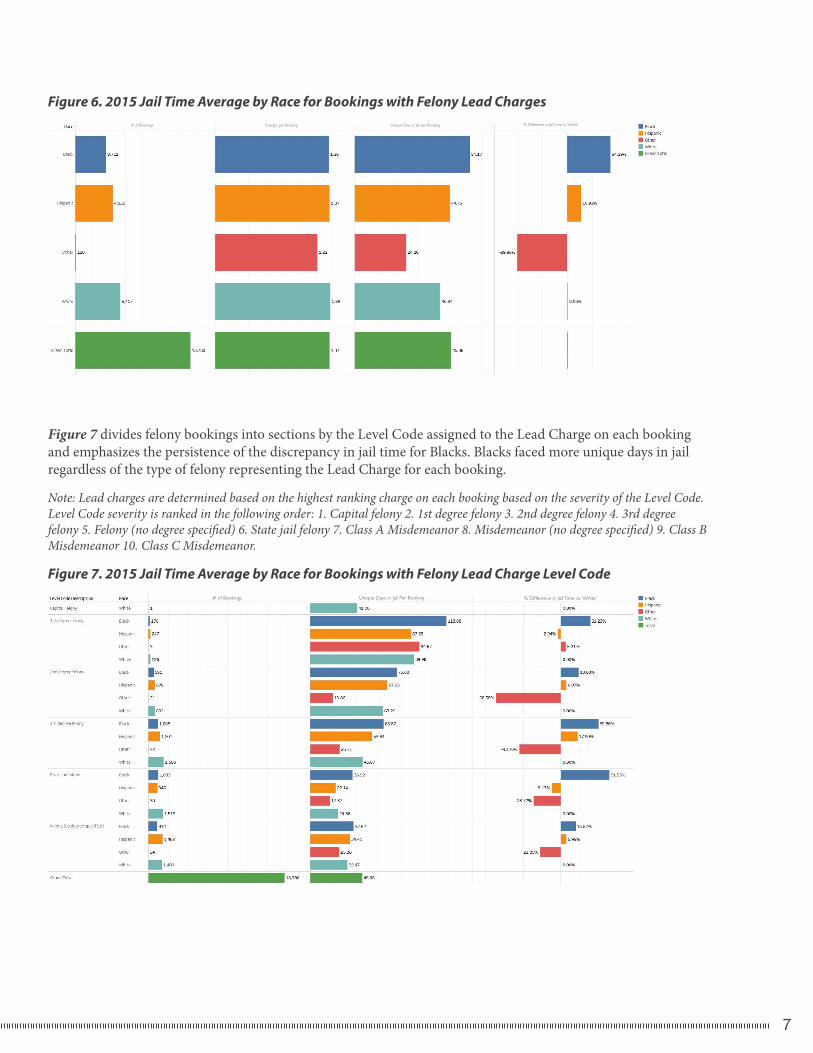
Figure 6. 2015 Jail Time Average by Race for Bookings with Felony Lead Charges
Figure 7 divides felony bookings into sections by the Level Code assigned to the Lead Charge on each booking and emphasizes the persistence of the discrepancy in jail time for Blacks. Blacks faced more unique days in jail regardless of the type of felony representing the Lead Charge for each booking.
Note: Lead charges are determined based on the highest ranking charge on each booking based on the severity of the Level Code. Level Code severity is ranked in the following order: 1. Capital felony 2. 1st degree felony 3. 2nd degree felony 4. 3rd degree felony 5. Felony (no degree specified) 6. State jail felony 7. Class A Misdemeanor 8. Misdemeanor (no degree specified) 9. Class B Misdemeanor 10. Class C Misdemeanor.
Unique Days in Jail per Booking % Difference in Jail Time vs. ‘White’# of Bookings Charges per Booking
Figure 7. 2015 Jail Time Average by Race for Bookings with Felony Lead Charge Level CodeUnique Days in Jail Per Booking % Difference in Jail Time vs. ‘White’# of Bookings
8
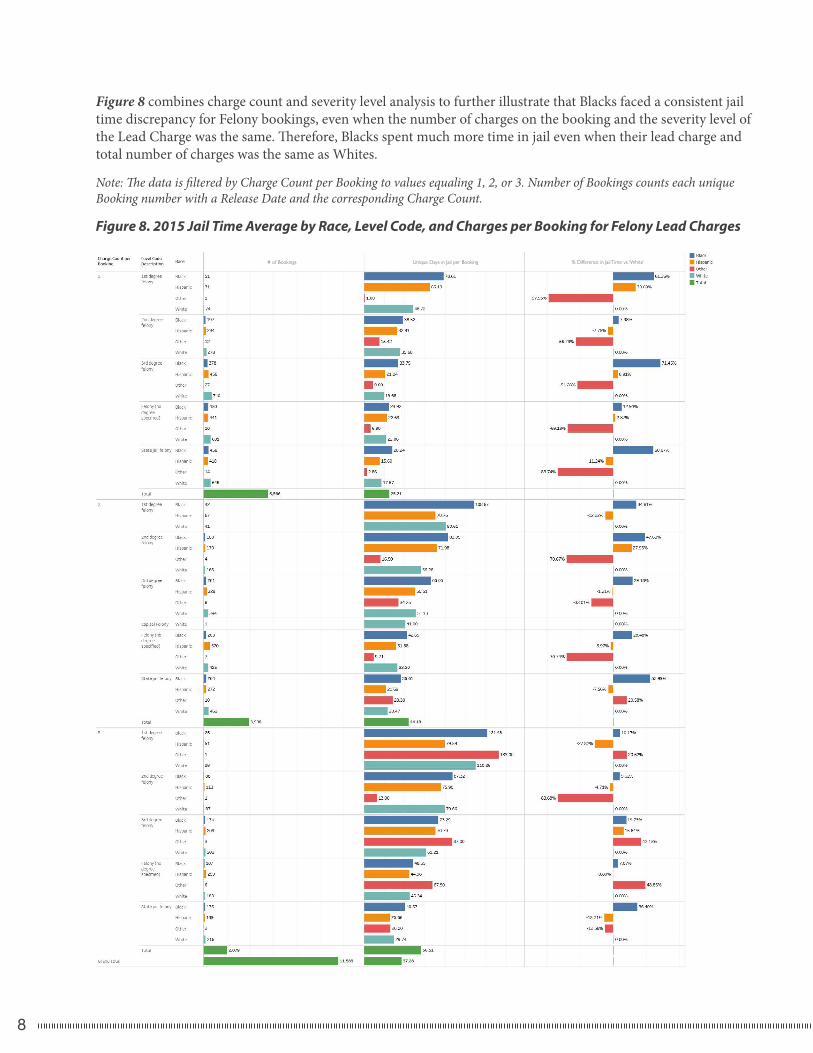
Figure 8 combines charge count and severity level analysis to further illustrate that Blacks faced a consistent jail time discrepancy for Felony bookings, even when the number of charges on the booking and the severity level of the Lead Charge was the same. Therefore, Blacks spent much more time in jail even when their lead charge and total number of charges was the same as Whites.
Note: The data is filtered by Charge Count per Booking to values equaling 1, 2, or 3. Number of Bookings counts each unique Booking number with a Release Date and the corresponding Charge Count.
Figure 8. 2015 Jail Time Average by Race, Level Code, and Charges per Booking for Felony Lead Charges
Unique Days in Jail per Booking % Difference in Jail Time vs. ‘White’# of Bookings
9
JAIL TIME FOR MISDEMEANOR BOOKINGS
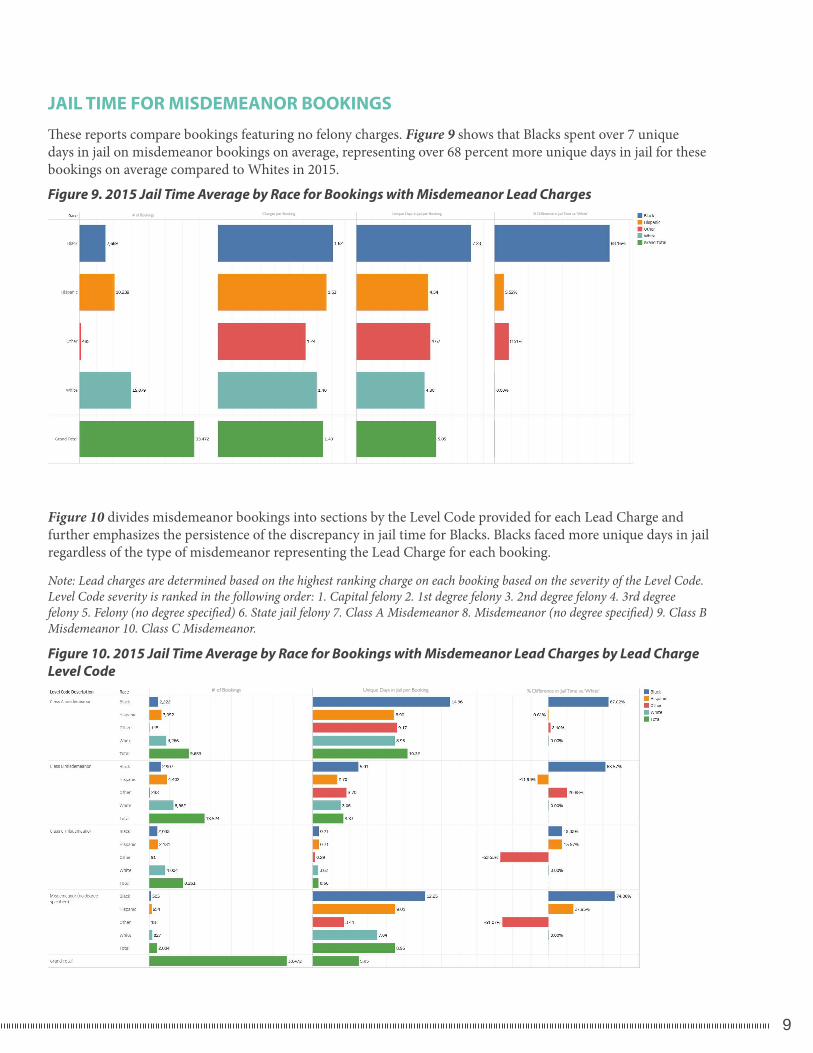
These reports compare bookings featuring no felony charges. Figure 9 shows that Blacks spent over 7 unique days in jail on misdemeanor bookings on average, representing over 68 percent more unique days in jail for these bookings on average compared to Whites in 2015.
Figure 9. 2015 Jail Time Average by Race for Bookings with Misdemeanor Lead Charges
Figure 10 divides misdemeanor bookings into sections by the Level Code provided for each Lead Charge and further emphasizes the persistence of the discrepancy in jail time for Blacks. Blacks faced more unique days in jail regardless of the type of misdemeanor representing the Lead Charge for each booking.
Note: Lead charges are determined based on the highest ranking charge on each booking based on the severity of the Level Code. Level Code severity is ranked in the following order: 1. Capital felony 2. 1st degree felony 3. 2nd degree felony 4. 3rd degree felony 5. Felony (no degree specified) 6. State jail felony 7. Class A Misdemeanor 8. Misdemeanor (no degree specified) 9. Class B Misdemeanor 10. Class C Misdemeanor.
Figure 10. 2015 Jail Time Average by Race for Bookings with Misdemeanor Lead Charges by Lead Charge Level Code
Unique Days in Jail per Booking
% Difference in Jail Time vs. ‘White’Unique Days in Jail per Booking
% Difference in Jail Time vs. ‘White’# of Bookings Charges per Booking
# of Bookings
10
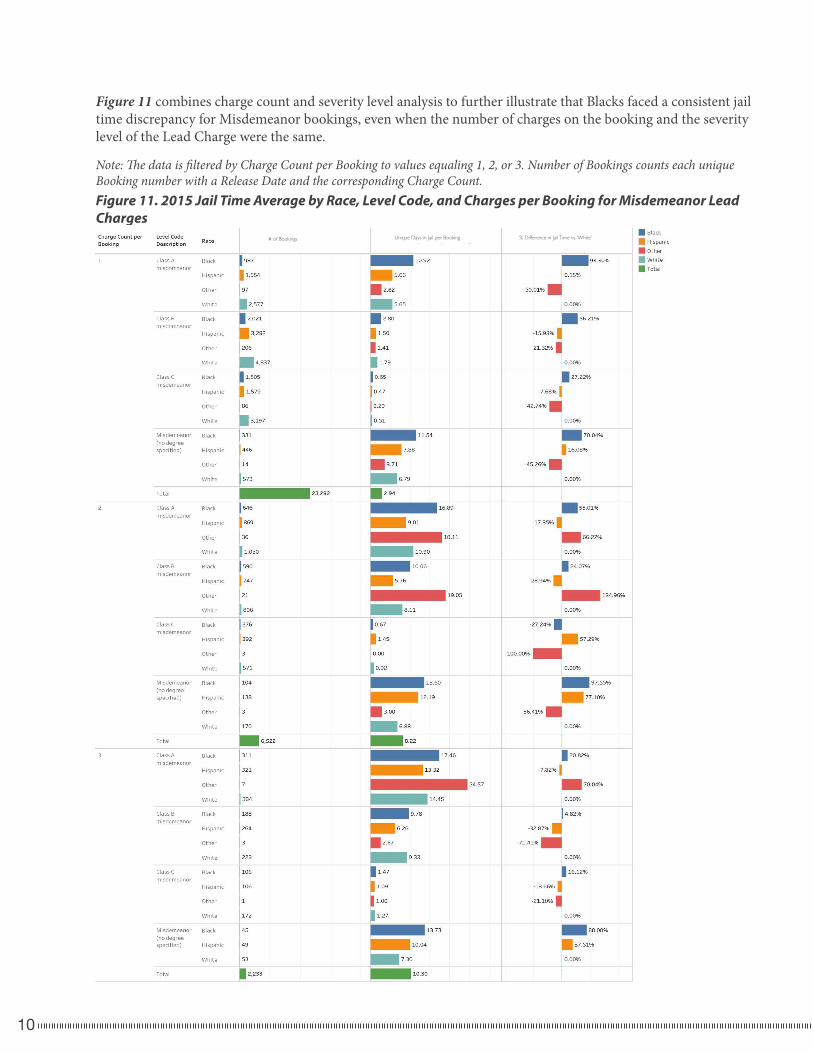
Figure 11 combines charge count and severity level analysis to further illustrate that Blacks faced a consistent jail time discrepancy for Misdemeanor bookings, even when the number of charges on the booking and the severity level of the Lead Charge were the same.
Note: The data is filtered by Charge Count per Booking to values equaling 1, 2, or 3. Number of Bookings counts each unique Booking number with a Release Date and the corresponding Charge Count.Figure 11. 2015 Jail Time Average by Race, Level Code, and Charges per Booking for Misdemeanor Lead Charges
Unique Days in Jail per Booking % Difference in Jail Time vs. ‘White’# of Bookings
11
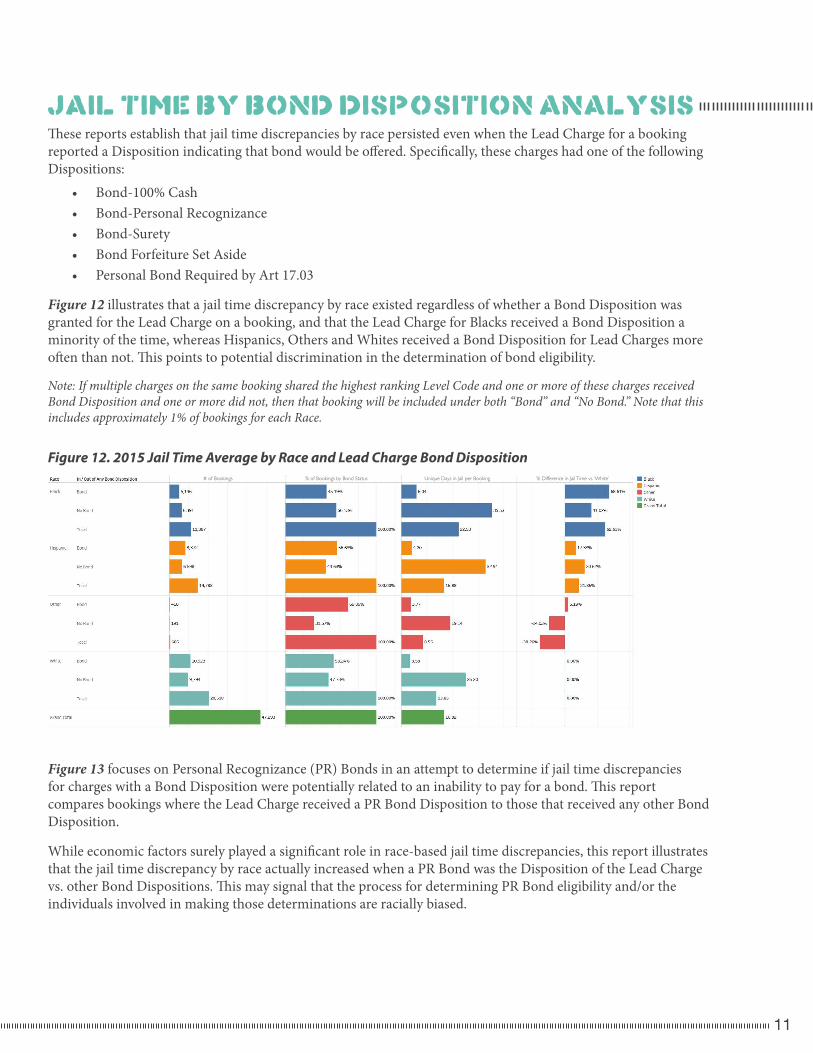
JAIL TIME BY BOND DISPOSITION ANALYSISThese reports establish that jail time discrepancies by race persisted even when the Lead Charge for a booking reported a Disposition indicating that bond would be offered. Specifically, these charges had one of the following Dispositions:
• Bond-100% Cash• Bond-Personal Recognizance• Bond-Surety• Bond Forfeiture Set Aside• Personal Bond Required by Art 17.03
Figure 12 illustrates that a jail time discrepancy by race existed regardless of whether a Bond Disposition was granted for the Lead Charge on a booking, and that the Lead Charge for Blacks received a Bond Disposition a minority of the time, whereas Hispanics, Others and Whites received a Bond Disposition for Lead Charges more often than not. This points to potential discrimination in the determination of bond eligibility.
Note: If multiple charges on the same booking shared the highest ranking Level Code and one or more of these charges received Bond Disposition and one or more did not, then that booking will be included under both “Bond” and “No Bond.” Note that this includes approximately 1% of bookings for each Race.
Figure 12. 2015 Jail Time Average by Race and Lead Charge Bond Disposition
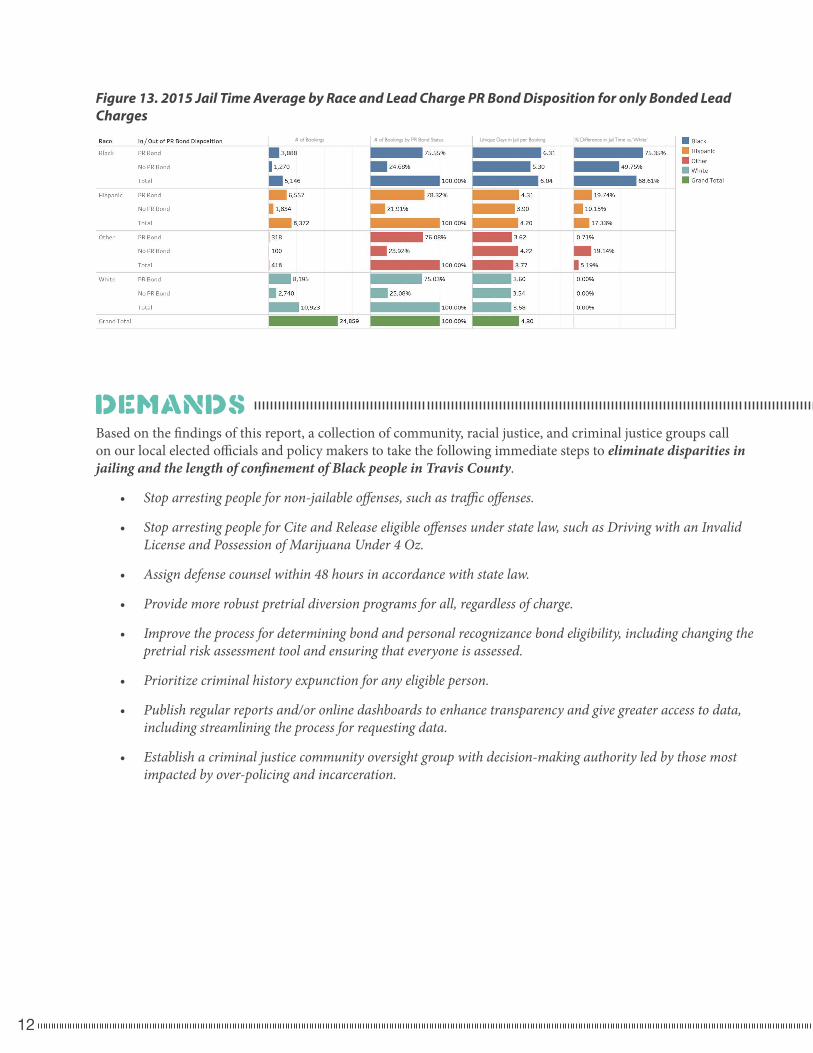
Figure 13 focuses on Personal Recognizance (PR) Bonds in an attempt to determine if jail time discrepancies for charges with a Bond Disposition were potentially related to an inability to pay for a bond. This report compares bookings where the Lead Charge received a PR Bond Disposition to those that received any other Bond Disposition.
While economic factors surely played a significant role in race-based jail time discrepancies, this report illustrates that the jail time discrepancy by race actually increased when a PR Bond was the Disposition of the Lead Charge vs. other Bond Dispositions. This may signal that the process for determining PR Bond eligibility and/or the individuals involved in making those determinations are racially biased.
Unique Days in Jail per Booking % Difference in Jail Time vs. ‘White’# of Bookings % of Bookings by Bond Status
12
Figure 13. 2015 Jail Time Average by Race and Lead Charge PR Bond Disposition for only Bonded Lead Charges
# of Bookings # of Bookings by PR Bond Status Unique Days in Jail per Booking % Difference in Jail Time vs. ‘White’
DemandsBased on the findings of this report, a collection of community, racial justice, and criminal justice groups call on our local elected officials and policy makers to take the following immediate steps to eliminate disparities in jailing and the length of confinement of Black people in Travis County.
• Stop arresting people for non-jailable offenses, such as traffic offenses.
• Stop arresting people for Cite and Release eligible offenses under state law, such as Driving with an Invalid License and Possession of Marijuana Under 4 Oz.
• Assign defense counsel within 48 hours in accordance with state law.
• Provide more robust pretrial diversion programs for all, regardless of charge.
• Improve the process for determining bond and personal recognizance bond eligibility, including changing the pretrial risk assessment tool and ensuring that everyone is assessed.
• Prioritize criminal history expunction for any eligible person.
• Publish regular reports and/or online dashboards to enhance transparency and give greater access to data, including streamlining the process for requesting data.
• Establish a criminal justice community oversight group with decision-making authority led by those most impacted by over-policing and incarceration.
References1. Jails Have Become Warehouses for the Poor, Ill and Addicted, a Report Says - https://mobile.nytimes.com/2015/02/11/us/jails-
have-become-warehouses-for-the-poor-ill-and-addicted-a-report-says.html
2. Todd D. Minton and Zhen Zeng, Jail Inmates in 2015 - https://www.bjs.gov/content/pub/pdf/ji15.pdf
3. Incarceration’s Front Door: The Misuse of Jails in America - http://archive.vera.org/sites/default/files/resources/downloads/incarcerations-front-door-report.pdf
4. Travis County Jail Dashboard - 12/14/2015 - https://www.traviscountytx.gov/media/kunena/attachments/101/TC-JAIL-DASHBOARD-12-14-15-final.pdf
5. Prison Policy Initiative - http://www.prisonpolicy.org/profiles/US.html#disparities
6. Prevalence of Imprisonment in the U.S. Population, 1974-2001 - http://www.bjs.gov/content/pub/pdf/piusp01.pdf
7. Todd D. Minton and Daniela Golinelli, Jail Inmates at Midyear 2013 - Statistical Tables (Washington, DC: U.S. Department of Justice, Office of Justice Programs, Bureau of Justice Statistics, 2014)
8. Paige M. Harrison and Allen J. Beck, Ph.D., Prisoners in 2005 - Statistical Tables (Washington, DC: U.S. Department of Justice, Office of Justice Programs, Bureau of Justice Statistics, 2006)
9. Sonja B. Starr & M. Marit Rehavi, Racial Disparity in Federal Criminal Charging and its Sentencing Consequences, UOF Michigan Law & Econ, Empirical Legal Studies Center Paper No.12-002 (2012).
10. U.S. Sentencing Comm’n, Report on the Continuing Impact of United States v. Bookeron Federal Sentencing (Jan. 30, 2013) - http://www.ussc.gov/news/congressional-testimony-and-reports/booker-reports/report-continuing-impact-united-states-v-booker-federal-sentencing
11. https://www.prisonpolicy.org/blog/2015/08/14/jailsmatter/
12. Incarceration’s Front Door: The Misuse of Jails in America - http://archive.vera.org/sites/default/files/resources/downloads/incarcerations-front-door-report.pdf
13. Incarceration’s Front Door: The Misuse of Jails in America - http://archive.vera.org/sites/default/files/resources/downloads/incarcerations-front-door-report.pdf
14. Tina Frierburger and Carly Hilinski. “The Impact of Race, Gender, and Age on the Pretrial Decision,” Criminal Justice Review 35(3), (2010), 330
15. American Civil Liberties Union, Racial Disparities in Sentencing: Hearing on Reports of Racism in the Justice System of the United States. (Washington, DC: American Civil Liberties Union, 2014), 1-3.
For more information, please contact
Grassroots Leadership [email protected] or (512) 499-8111
Twitter: @Grassroots_Newswww.grassrootsleadership.org
Travis County Jail in 2015:Data points to racism and longer confinement of African Americans’
July 2017