data point: 2020 mortgage market activity and trends
TRANSCRIPT

1
CONSUMER FINANCIAL PROTECTION BUREAU | AUGUST 2021
Data Point: 2020 Mortgage Market Activity and Trends

2 DATA POINT: 2020 MORTGAGE MARKET ACTIVITY AND TREND
This is another in an occasional series of publications from the Consumer Financial Protection Bureau’s Office of Research. These publications are intended to further the Bureau’s objective of providing an evidence-based perspective on consumer financial markets, consumer behavior, and regulations to inform the public discourse. See 12 U.S.C. §5493(d).[1]
[1] This report was prepared by Feng Liu, Young Jo, Vanessa Jimenez-Read, and Alex Rodrigue.
3
Table of contents Table of contents......................................................................................................... 3
1. Introduction ............................................................................................................. 4
2. Mortgage applications and originations ............................................................. 10
3. Mortgage outcomes by demographic groups and loan types .......................... 16
3.1 Distribution of home loans ........................................................................ 16
3.2 Mortgage characteristics of home loans ................................................... 20
3.3 Denial rates ................................................................................................ 27
4. Monthly mortgage trends and activities .............................................................. 31
5. Mortgage trends and activities by states ............................................................ 46
6. Lending institutions .............................................................................................. 49
7. Conclusion ............................................................................................................. 55

4
1. Introduction This Data Point article provides an overview of residential mortgage lending in 2020 based on the data collected under the Home Mortgage Disclosure Act (HMDA). HMDA is a data collection, reporting, and disclosure statute enacted in 1975. HMDA data are used to assist in determining whether financial institutions are serving the housing credit needs of their local communities; facilitate public entities’ distribution of funds to local communities to attract private investment; and help identify possible discriminatory lending patterns and enforce antidiscrimination statutes.1 Institutions covered by HMDA are required to collect and report specified information about each mortgage application acted upon and mortgage purchased. The data include the disposition of each application for mortgage credit; the type, purpose, and characteristics of each home mortgage application or purchased loan; the census-tract designations of the properties; loan pricing information; demographic and other information about loan applicants, such as their race, ethnicity, sex, age, and income; and information about loan sales.2
The 2020 HMDA data3 are the third year of data that incorporate amendments made to HMDA by the Dodd-Frank Wall Street Reform and Consumer Protection Act of 2010 (DFA). Among the changes made by the DFA were new data points, revisions to certain existing data points, and authorizing the Bureau to require the collection and reporting of additional data points. The Bureau issued a final rule implementing these and other changes in October 2015 (2015 HMDA rule).4 The 2015 HMDA rule made five primary changes to the data collected starting on January 1, 2018: (1) mandated reporting of open-end lines of credit (LOCs) by financial institutions with an annual LOC origination volume exceeding a coverage threshold of 100 LOCs
1 For a brief history of HMDA, see Federal Financial Institutions Examination Council, “History of HMDA,” available at www.ffiec.gov/hmda/history2.htm (last modified Sept. 06, 2018) . 2 See Filing instructions guide for HMDA data collected in 2020 (June 2020), available at https://s3.amazonaws.com/cfpb-hmda-public/prod/help/2020-hmda-fig.pdf for a full list of items reported under HMDA for 2020. 3 The 2020 HMDA data, which are used for the analysis of this Data Point, cover mortgage applications acted upon and mortgages purchased during the calendar year of 2020 and reported in 2021. Similarly, the 2018 and 2019 HMDA data refer to applications acted upon and mortgages purchased during the calendar years of 2018 and 2019 respectively. 4 See Home Mortgage Disclosure (Regulation C), 80 FR 66128 (Oct. 28, 2015). In September 2017, the Bureau published in the Federal Register a rule which made a few technical corrections to and clarified certain requirements of the rule implementing HMDA. This rule also increased the threshold for collecting and reporting data about LOCs for a period of two years. See Home Mortgage Disclosure (Regulation C), 82 FR 43088 (Sep. 13, 2017).
5
in each of the two preceding years5; (2) changed the transactional coverage definition from loan-purpose-based to one based primarily on whether the loan was secured by a dwelling; (3) modified definitions and values of some existing data points; (4) required reporting of 27 new data points6; and (5) established a uniform coverage threshold of 25 closed-end loan originations in each of the two preceding years for depository institutions (DIs) and non-depository institutions (non-DIs) to report closed-end loans, with the closed-end threshold change for DIs taking effect on January 1, 2017. 7
Because of these significant changes starting with the 2018 HMDA data, the HMDA data since 2018 are not completely comparable to the HMDA data before 2018. To maintain the consistency for cross-year comparisons, this article uses only the HMDA data from 2018 to 2020 and focuses on trends in mortgage applications and originations during these three years. In doing so, we have incorporated a number of new and revised data points that were not collected prior to the 2018 HMDA data. We have also incorporated analyses of LOCs and other dwelling-secured transactions in the article. We note that readers who are interested in the historical trends of mortgage applications and activities prior to 2018 can refer to the previous CFPB publications.8 Lastly, some estimates in this article are not completely consistent with those from the previous CFPB publications because some records were dropped in the previous publications to make the post-2018 data consistent with the pre-2018 data.9
On June 17th, 2021, the Bureau published a static application-level 2020 HMDA data file that consolidates data from individual reporters. The data file is modified to protect applicant and
5 The 2017 HMDA rule temporarily increased the 100-LOC coverage threshold to 500 LOCs for the 2018 and 2019 HMDA data. Then, the 2019 HMDA rule extended the 500-LOC threshold to the 2020 and 2021 HMDA data. See Home Mortgage Disclosure (Regulation C), 84 FR 57946 (Oct. 29, 2019); 82 FR 43088 (Sept. 13, 2017). 6 Beginning with the 2018 HMDA data, the Economic Growth, Regulatory Relief, and Consumer Protection Act (EGRRCPA) exempted certain insured depository institutions and credit unions from the requirement to collect and report data on 26 of the 27 new data points added under the 2015 HMDA rule for certain types of transactions. For more details on the new data points, see the article “An Updated Review of the New and Revised Data Points in HMDA: Further Observations using the 2019 HMDA data,” available at https://www.consumerfinance.gov/data-research/research-reports/revised-data-points-hmda/ 7 This 25-loan coverage threshold was increased to 100 loans in May of 2020 by the 2020 HMDA rule, which became effective on July 1, 2020. See Home Mortgage Disclosure (Regulation C), 85 F. R. 28364 (May 12, 2020), available at https://www.federalregister.gov/documents/2020/05/12/2020-08409/home-mortgage-disclosure-regulation-c. 8 See “Data Point: 2018 Mortgage Market Activity and Trends,” available at https://www.consumerfinance.gov/data-research/research-reports/data-point-2018-mortgage-market-activity-and-trends/. 9 In previous CFPB publications examing trends and activity in mortgage markets since the 2018 HMDA data were reported, the Bureau excluded all open-end LOCs, except those that are reverse mortgages, and applications for a loan purpose other than home purchase, home improvement, or refinance.

6
borrower privacy.10 The data file and the Data Point article reflect the data as of April 31, 2021. Though this static file will not change, the Bureau will also provide an updated file separately to reflect any later resubmissions or late submissions. The results using the updated file may differ from those reported in this Data Point article, although the Bureau expects them to be largely consistent.
The remainder of this article summarizes the 2020 HMDA data and recent trends in mortgage applications and originations. Some of the key findings are:11
4,472 financial institutions reported at least one closed-end record in 2020, down by 18.8 percent from 5,505 financial institutions who reported in 2019.
In total, the number of closed-end originations (excluding reverse mortgages) in 2020 increased by 65.2 percent, from 8.3 million in 2019 to 13.6 million in 2020. Most of the increase was driven by an increase in the number of refinance loans. For example, the number of home-purchase loans secured by site-built one-to-four-family properties increased by about 387,000, whereas the number of refinance loans increased by 149.1 percent from 3.4 million in 2019 to 8.4 million in 2020.
The number of open-end lines of credit originations excluding reverse mortgages (HELOCs12) in 2020 decreased by 16.6 percent, from 1.04 million in 2019 to 869,000 in 2020.
The share of loans secured by closed-end home-purchase loans for site-built, one-to-four-family, first lien, principal-residence properties for Black borrowers increased in 2020 and the share of refinance loans for Asian borrowers increased in 2020.
10 For more information concerning these modifications and the Bureau’s analyses under the balancing test it adopted to protect applicant and borrower privacy while also fulfilling HMDA’s disclosure purposes, see Disclosure of Loan-Level HMDA Data 84 FR 649 (Jan. 31, 2019). 11 This Data Point article is based on the analysis of the static consolidated application-level 2018, 2019, and 2020 HMDA data files. Some data points used in this article were modified or withheld in the public HMDA data. 12 Open-end lines of credit secured by dwellings (excluding reverse mortgages) are commonly known as home equity lines of credit, or HELOCs. In the rest of the article, where it is applicable, we have used the term HELOC in lieu of open-ended line of credits excluding reverse mortgage. Beginning with the data collected in 2018, the reporting of HELOCs became mandatory rather than optional.

7
Black and Hispanic white borrowers had lower median loan amounts, lower median credit scores, higher denial rates, and paid higher median interest rates and total loan costs compared to non-Hispanic white and Asian borrowers.13
In April and May of 2020, contrary to typical seasonal patterns, the home-purchase origination volume declined, likely reflecting the effects of the pandemic and nationwide shutdown. Starting in June of 2020, the home-purchase volume recovered and increased significantly in terms of year-over-year comparison despite the typical low home sale seasons near the end of the year.
The refinance boom observed in 2020 largely was the continuation of the trends since the second quarter of 2019.
One factor that may affect comparing the mortgage market trends in 2020 to those in 2018 and 2019 is the change in one of the two reporting thresholds in Regulation C. Specifically, the reporting threshold for closed-end transactions in 2020 was higher than the threshold in 2018 and 2019. The 2015 HMDA rule14 required, among other things, that financial institutions report their closed-end mortgage activities under HMDA if they (1) originated no fewer than 25 closed-end mortgage loans in each of the two preceding years and (2) meet other reporting criteria such as asset and locational tests. This “25-loan” closed-end reporting threshold applied to the HMDA reporting activities in 2018 and 2019. However, CFPB raised this 25-loan threshold to a 100-loan threshold in May of 2020 (2020 HMDA rule), which became effective on July 1, 2020.15 16
13 A recent CFPB publication shows that there is heterogeneity in mortgage characteristics across Asian American Pacific Islander subgroups. The report titled “Asian American and Pacific Islanders in the Mortgage Market,” is available at https://www.consumerfinance.gov/data-research/research-reports/asian-american-and-pacific-islanders-in-the-mortgage-market/ 14 See Home Mortgage Disclosure (Regulation C), 80 F. R. 66127 (Oct. 28, 2015), available at https://www.federalregister.gov/documents/2015/10/28/2015-26607/home-mortgage-disclosure-regulation-c. 15 See Home Mortgage Disclosure (Regulation C), 85 F. R. 28364 (May 12, 2020), available at https://www.federalregister.gov/documents/2020/05/12/2020-08409/home-mortgage-disclosure-regulation-c. 16 Even though the 2020 HMDA rule changed the open-end reporting threshold to 200-LOCs, the change does not take into effect until January 1st, 2022. For the HMDA activity years of 2018 to 2020, the open-end reporting threshold had remained constant at 500-LOCs. The 2017 HMDA rule initially set the threshold to 500-LOCs temporarily for the 2018 and 2019 HMDA data. Then, the 2019 HMDA rule extended the 500-LOC threshold to the 2020 as well as 2021 HMDA data. Therefore, the open-end reporting threshold change by the 2020 HMDA rule had no effect on the analysis of open-end LOCs in this report.
8
In the 2020 HMDA data, 4,472 financial institutions reported at least one record that is not flagged as an open-end line of credit.17 Among the closed-end reporters, 200 reported fewer than 25 closed-end originations, 588 reported between 25 and 99 closed-end originations, and 3,678 reported at least 100 closed-end originations.
The HMDA reporting volume thresholds are set with a two-year lookback period. In total, based on the 2018 and 2019 HMDA data, 4,919 financial institutions reported at least 25 closed-end mortgage originations in both 2018 and 2019, 3,235 financial institutions reported at least 100 closed-end mortgage originations in both 2018 and 2019, and 1,684 financial institutions reported at least 25 closed-end mortgage originations in both 2018 and 2019 but had fewer than 100 closed-end originations in at least one of these two years. These 1,684 financial institutions would have been required to report their closed-end activities in 2020 according to the 2015 HMDA rule, but were no longer required to report under the 2020 HMDA rule. Together, these 1,684 newly exempted financial institutions reported about 120,000 closed-end loans in 2018, accounting for 1.9% of all closed-end originations reported in 2018, and about 116,000 closed-end loans in 2019, accounting for 1.4% of all closed-end originations reported in 2019.
Among the newly exempted financial institutions, more than half voluntarily reported closed-end activities in the 2020 HMDA data, even though they were no longer required to do so. Of the 1,684 newly exempted financial institutions, 893 reported about 116,000 closed-end originations, while 791 did not report any closed-end activities in the 2020 HMDA data. These
17 The HMDA data since 2018 contain a data point indicating whether the covered loan is, or the application is for, an open-end line of credit. This data point, however, is among the partially exempt data points under the EGRRCPA. The allowable values for this field include “Code 1—Open-end line of credit, Code 2—Not an open-end line of credit, Code 1111—Exempt”. Under the EGRRCPA, depository institutions that originated less than 500 closed-end originations in each of the preceding two years generally do not have to report partially exempt data points for their closed-end transactions, and depository institutions that originated less than 500 open-end originations in each of the preceding two years generally do not have to report partially exempt data points for their open-end transactions. On the other hand, for HMDA activity years between 2018 and 2020, a financial institution that originated no fewer than 500 open-end lines of credit in both of the preceding two years and meet other criterion must report their open-end activities to HMDA. Given so, in these three years, financial institutions that were eligible for the partial exemption for open-end transactions under the EGRRCPA have not been required to report any open-end lines of credit to HMDA . Therefore, in the rest of the report, we have assumed all records with the open-end lines of credit flag reported as “Exempt” to be closed-end transactions. We acknowledge that it is possible that some reporters had voluntarily reported open-end transactions and reported an open-end flag as “Exempt”. To the extent that such voluntary reporting of open-end lines of credit exists, the numbers of closed-end records would be overestimated in this report. In the 2020 HMDA data, about 1.73 million records were reported as open-end lines of credit, 23.2 million records were affirmatively reported as not open-end lines of credit, and 578,000 records had the open-end line-of-credit flag reported as “Exempt”. For originated loans, about 906,000 records were reported as open-end lines of credit, 13.2 million records were affirmatively reported as not open-end lines of credit, and 432,000 records had the open-end lines of credit flag reported as “Exempt”.

9
791 financial institutions reported about 73,000 closed-end originations in 2019, accounting for less than one percent of all closed-end originations.
The closed-end origination volume reported to HMDA increased from about 8.26 million in 2019 to about 13.64 million in 2020, or about a 65.2% increase. This increase occurred despite the increase in the closed-end reporting threshold. Given the substantial increase in total origination volume reported and small origination volume of the newly exempted financial institutions that did not report 2020 HMDA data, the impact of the threshold change likely did not significantly affect the overall trends and patterns presented in this article.
10
2. Mortgage applications and originations In 2020, a total of 4,475 financial institutions—banks, savings associations, credit unions, and non-depository mortgage lenders—reported data on approximately 22.7 million applications and 14.5 million originations under HMDA. In contrast, in 2019, 5,508 financial institutions reported data on 15.1 million applications and 9.3 million originations under HMDA. Compared to 2019, the number of reporters decreased by 1,033, or about 18.8 percent, likely due primarily to the increase in the closed-end reporting threshold that was implemented by the 2020 HMDA rule. On the other hand, despite the drop in the number of financial institutions reporting HMDA data, the total number of applications and originations increased substantially in 2020. The total number of reported applications increased by about 7.5 million or 50 percent and the number of originations increased by 5.2 million or 56.0 percent.
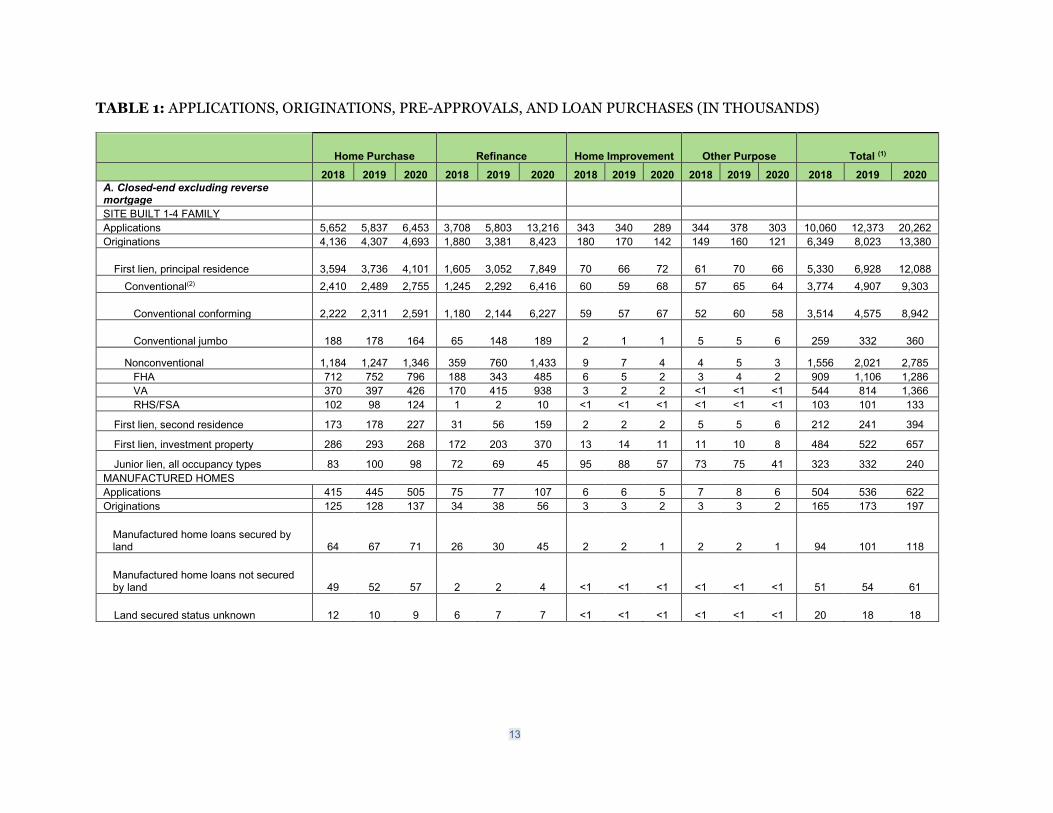
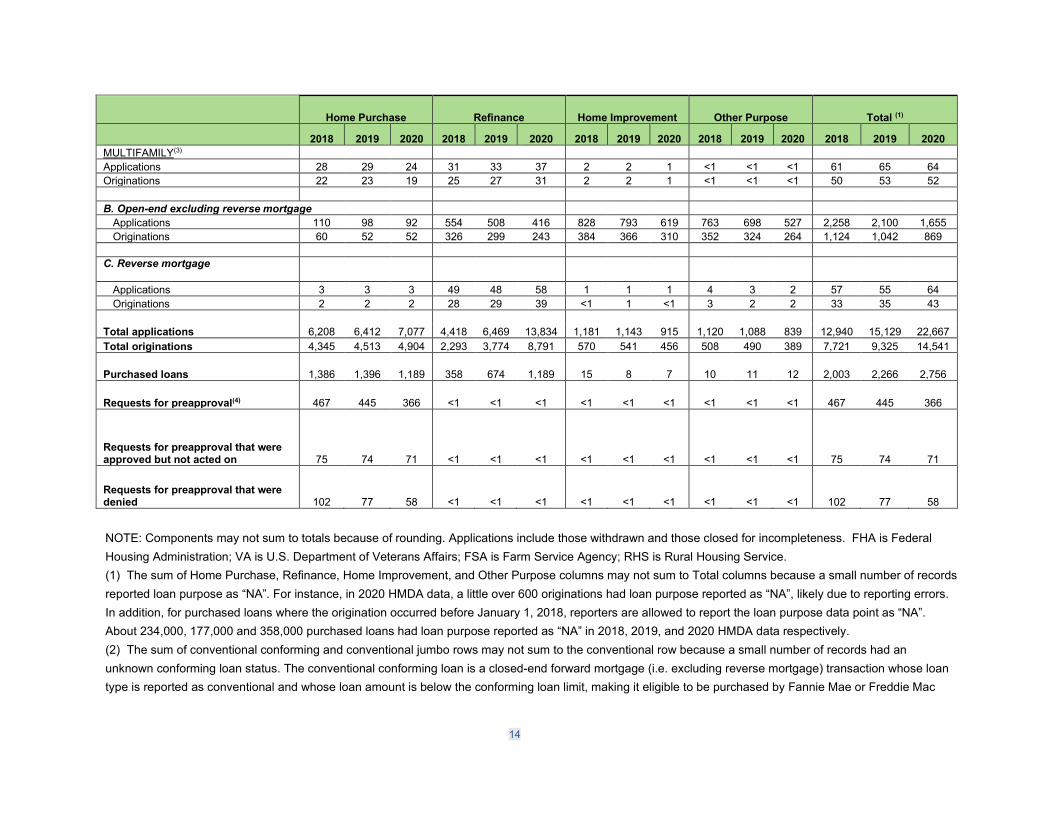
The bottom rows of Table 1 present the total count of the number of records, including total applications, originations, purchased loans, and requests for approvals reported each year from 2018 to 2020. The top panels of Table 1 break down the total records by types of transactions: closed-end excluding reverse mortgages, open-end line of credits excluding reverse mortgage, or reverse mortgages. Within closed-end transactions, we further divide by property types: a site-built one-to-four family unit, manufactured home, or multifamily transactions. We also categorize by loan purposes: home purchase, home improvement, refinance, and other purpose. The closed-end site-built one-to-four family originations are then disaggregated by lien status (e.g., first lien, junior lien) and occupancy types (e.g., principal residence, second residence, investment property). Then, the first-lien, principal-residence originations are further disaggregated by whether they are conventional loans or not. Within the conventional loan category, we disaggregate by whether the loan is conforming or jumbo. Within the non-conventional loan category, we disaggregate by loans insured or guaranteed by Federal Housing Administration (FHA), Department of Veterans Affairs (VA), or USDA Rural Housing Service or Farm Service Agency (RHS/FSA). For manufactured home originations, we disaggregate by whether manufactured home loans are secured by land (non-chattel loans) or not secured by land (chattel loans).18
18 Manufactured-home lending differs from lending for site-built homes. Furthermore, even among the manufactured home loans, chattel-secured lending differs greatly from those that are not chattel secured.
11
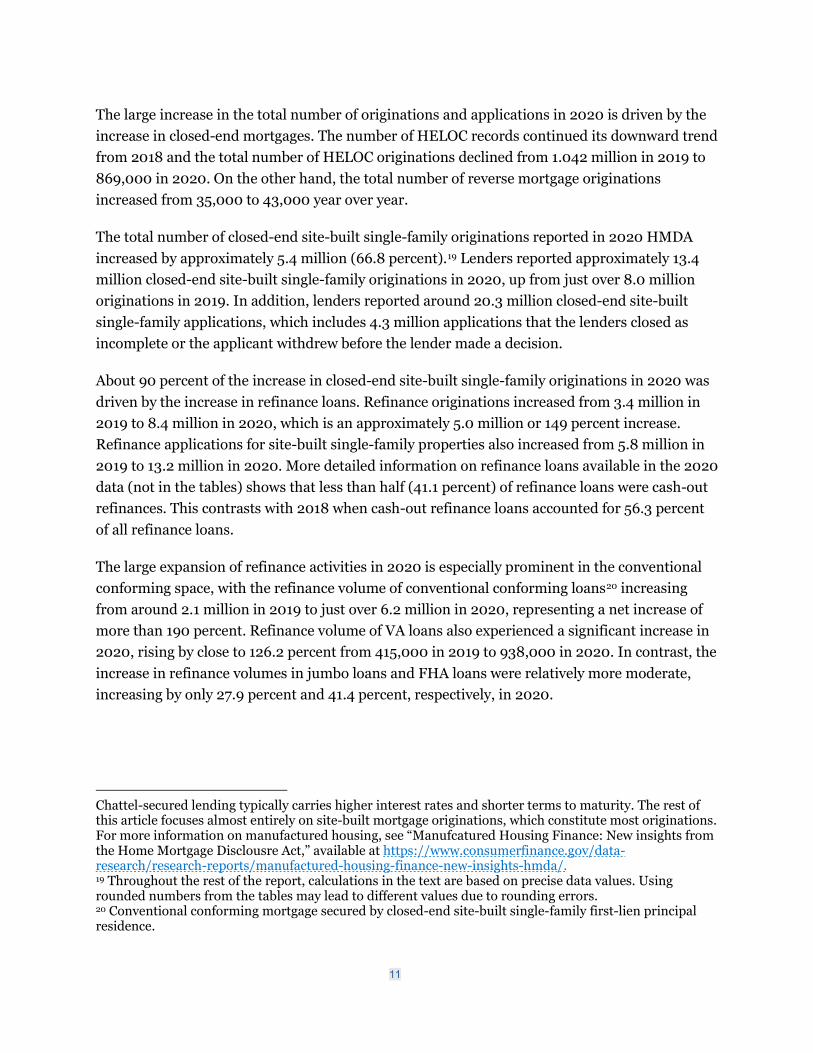
The large increase in the total number of originations and applications in 2020 is driven by the increase in closed-end mortgages. The number of HELOC records continued its downward trend from 2018 and the total number of HELOC originations declined from 1.042 million in 2019 to 869,000 in 2020. On the other hand, the total number of reverse mortgage originations increased from 35,000 to 43,000 year over year.
The total number of closed-end site-built single-family originations reported in 2020 HMDA increased by approximately 5.4 million (66.8 percent).19 Lenders reported approximately 13.4 million closed-end site-built single-family originations in 2020, up from just over 8.0 million originations in 2019. In addition, lenders reported around 20.3 million closed-end site-built single-family applications, which includes 4.3 million applications that the lenders closed as incomplete or the applicant withdrew before the lender made a decision.
About 90 percent of the increase in closed-end site-built single-family originations in 2020 was driven by the increase in refinance loans. Refinance originations increased from 3.4 million in 2019 to 8.4 million in 2020, which is an approximately 5.0 million or 149 percent increase. Refinance applications for site-built single-family properties also increased from 5.8 million in 2019 to 13.2 million in 2020. More detailed information on refinance loans available in the 2020 data (not in the tables) shows that less than half (41.1 percent) of refinance loans were cash-out refinances. This contrasts with 2018 when cash-out refinance loans accounted for 56.3 percent of all refinance loans.
The large expansion of refinance activities in 2020 is especially prominent in the conventional conforming space, with the refinance volume of conventional conforming loans20 increasing from around 2.1 million in 2019 to just over 6.2 million in 2020, representing a net increase of more than 190 percent. Refinance volume of VA loans also experienced a significant increase in 2020, rising by close to 126.2 percent from 415,000 in 2019 to 938,000 in 2020. In contrast, the increase in refinance volumes in jumbo loans and FHA loans were relatively more moderate, increasing by only 27.9 percent and 41.4 percent, respectively, in 2020.
Chattel-secured lending typically carries higher interest rates and shorter terms to maturity. The rest of this article focuses almost entirely on site-built mortgage originations, which constitute most originations. For more information on manufactured housing, see “Manufcatured Housing Finance: New insights from the Home Mortgage Disclousre Act,” available at https://www.consumerfinance.gov/data-research/research-reports/manufactured-housing-finance-new-insights-hmda/. 19 Throughout the rest of the report, calculations in the text are based on precise data values. Using rounded numbers from the tables may lead to different values due to rounding errors. 20 Conventional conforming mortgage secured by closed-end site-built single-family first-lien principal residence.

12
The closed-end site-built single-family mortgage originations for home purchase rose by a modest 9.0 percent, from just over 4.3 million in 2019 to nearly 4.7 million in 2020. When limited to the first-lien principal residence, the home-purchase loan originations increased by 9.8 percent, from 3.7 million in 2019 to 4.1 million in 2020. Among them, the conventional conforming market saw the largest increase of 12.1 percent in 2020, while the jumbo loans saw a decrease of 7.6 percent.
In 2020, about 197,000 loans secured by manufactured homes were originated, compared to 173,000 such loans in 2019. About 137,000 manufactured home loans were taken out for home-purchase, up slightly from 128,000 in 2019. Among them, about 71,000 were secured by both home and land, while 57,000 were secured by a manufactured home but not land.
The decrease in interest rates was likely a main driver behind the substantial increase in refinance applications and loans. Average interest rates declined throughout 2020 and were lower in 2020 than in 2019. According to Primary Mortgage Market Survey21, the average rate on 30-year fixed-rate conventional conforming mortgage loans started at 3.72 percent at the beginning of 2020 and decreased to a historically lowest level of 2.67 percent by the end of 2020. In contrast, interest rates decreased from 4.51 percent at the beginning of 2019 to 3.74 percent by the end of 2019. The reported interest rates in HMDA data follow a consistent pattern. The median interest rate for 30-year fixed-rate conventional conforming loans secured by first-lien principal residence for borrowers with a credit score of at least 620 was 3.125 in the 2020 HMDA data compared to 4.125 in the 2019 HMDA data.
Finally, HMDA data include information on loans purchased by reporting institutions during the reporting year, although the purchased loans may have been originated before 2020. Table 1 shows that financial institutions purchased 2.8 million loans from other institutions in 2020, a 21.6 percent increase from 2019.
21 This measure comes from Freddie Mac’s Primary Mortgage Market Survey and is available from the Federal Reserve Bank of St. Louis’ Federal Reserve Economic Database (FRED) at https://fred.stlouisfed.org/series/MORTGAGE30US.
13
TABLE 1: APPLICATIONS, ORIGINATIONS, PRE-APPROVALS, AND LOAN PURCHASES (IN THOUSANDS)
Home Purchase Refinance Home Improvement Other Purpose Total (1)
2018 2019 2020 2018 2019 2020 2018 2019 2020 2018 2019 2020 2018 2019 2020 A. Closed-end excluding reverse mortgage SITE BUILT 1-4 FAMILY Applications 5,652 5,837 6,453 3,708 5,803 13,216 343 340 289 344 378 303 10,060 12,373 20,262 Originations 4,136 4,307 4,693 1,880 3,381 8,423 180 170 142 149 160 121 6,349 8,023 13,380
First lien, principal residence 3,594 3,736 4,101 1,605 3,052 7,849 70 66 72 61 70 66 5,330 6,928 12,088 Conventional(2) 2,410 2,489 2,755 1,245 2,292 6,416 60 59 68 57 65 64 3,774 4,907 9,303
Conventional conforming 2,222 2,311 2,591 1,180 2,144 6,227 59 57 67 52 60 58 3,514 4,575 8,942
Conventional jumbo 188 178 164 65 148 189 2 1 1 5 5 6 259 332 360
Nonconventional 1,184 1,247 1,346 359 760 1,433 9 7 4 4 5 3 1,556 2,021 2,785 FHA 712 752 796 188 343 485 6 5 2 3 4 2 909 1,106 1,286 VA 370 397 426 170 415 938 3 2 2 <1 <1 <1 544 814 1,366 RHS/FSA 102 98 124 1 2 10 <1 <1 <1 <1 <1 <1 103 101 133
First lien, second residence 173 178 227 31 56 159 2 2 2 5 5 6 212 241 394
First lien, investment property 286 293 268 172 203 370 13 14 11 11 10 8 484 522 657
Junior lien, all occupancy types 83 100 98 72 69 45 95 88 57 73 75 41 323 332 240 MANUFACTURED HOMES Applications 415 445 505 75 77 107 6 6 5 7 8 6 504 536 622 Originations 125 128 137 34 38 56 3 3 2 3 3 2 165 173 197
Manufactured home loans secured by land 64 67 71 26 30 45 2 2 1 2 2 1 94 101 118
Manufactured home loans not secured by land 49 52 57 2 2 4 <1 <1 <1 <1 <1 <1 51 54 61
Land secured status unknown 12 10 9 6 7 7 <1 <1 <1 <1 <1 <1 20 18 18
14
Home Purchase Refinance Home Improvement Other Purpose Total (1)
2018 2019 2020 2018 2019 2020 2018 2019 2020 2018 2019 2020 2018 2019 2020 MULTIFAMILY(3) Applications 28 29 24 31 33 37 2 2 1 <1 <1 <1 61 65 64 Originations 22 23 19 25 27 31 2 2 1 <1 <1 <1 50 53 52 B. Open-end excluding reverse mortgage
Applications 110 98 92 554 508 416 828 793 619 763 698 527 2,258 2,100 1,655 Originations 60 52 52 326 299 243 384 366 310 352 324 264 1,124 1,042 869
C. Reverse mortgage
Applications 3 3 3 49 48 58 1 1 1 4 3 2 57 55 64 Originations 2 2 2 28 29 39 <1 1 <1 3 2 2 33 35 43
Total applications 6,208 6,412 7,077 4,418 6,469 13,834 1,181 1,143 915 1,120 1,088 839 12,940 15,129 22,667 Total originations 4,345 4,513 4,904 2,293 3,774 8,791 570 541 456 508 490 389 7,721 9,325 14,541 Purchased loans 1,386 1,396 1,189 358 674 1,189 15 8 7 10 11 12 2,003 2,266 2,756
Requests for preapproval(4) 467 445 366 <1 <1 <1 <1 <1 <1 <1 <1 <1 467 445 366
Requests for preapproval that were approved but not acted on 75 74 71 <1 <1 <1 <1 <1 <1 <1 <1 <1 75 74 71
Requests for preapproval that were denied 102 77 58 <1 <1 <1 <1 <1 <1 <1 <1 <1 102 77 58 NOTE: Components may not sum to totals because of rounding. Applications include those withdrawn and those closed for incompleteness. FHA is Federal Housing Administration; VA is U.S. Department of Veterans Affairs; FSA is Farm Service Agency; RHS is Rural Housing Service. (1) The sum of Home Purchase, Refinance, Home Improvement, and Other Purpose columns may not sum to Total columns because a small number of records reported loan purpose as “NA”. For instance, in 2020 HMDA data, a little over 600 originations had loan purpose reported as “NA”, likely due to reporting errors. In addition, for purchased loans where the origination occurred before January 1, 2018, reporters are allowed to report the loan purpose data point as “NA”. About 234,000, 177,000 and 358,000 purchased loans had loan purpose reported as “NA” in 2018, 2019, and 2020 HMDA data respectively. (2) The sum of conventional conforming and conventional jumbo rows may not sum to the conventional row because a small number of records had an unknown conforming loan status. The conventional conforming loan is a closed-end forward mortgage (i.e. excluding reverse mortgage) transaction whose loan type is reported as conventional and whose loan amount is below the conforming loan limit, making it eligible to be purchased by Fannie Mae or Freddie Mac

15
(collectively known as Government Sponsored Enterprises, or GSEs). The conventional non-conforming or jumbo loan is a closed-end forward mortgage transaction with its loan type reported as conventional and a loan amount above the conforming loan limit, making it ineligible to be purchased by the GSEs. (3) A multifamily property consists of site-built five or more units. (4) Consists of all requests for preapproval. Preapprovals are not related to a specific property and thus are distinct from applications. SOURCE: Here and in subsequent tables and figures, except as noted, Federal Financial Institutions Examination Council, data reported under the Home Mortgage Disclosure Act (www.ffiec.gov/hmda).
16
3. Mortgage outcomes by demographic groups and loan types The HMDA data are a key resource for policymakers and the public to understand the distribution of mortgage credit across demographic groups. Tables 2 through 4 provide information on loan shares, product usage, certain mortgage/borrower characteristics, pricing information, and denial rates by applicant income, neighborhood income, and applicant race and ethnicity. Tables 2 through 4 focus on closed-end first-lien home purchase and refinance loans secured by site-built one-to-four-family, principal residence properties, which accounted for approximately 83.1 percent of all HMDA originations excluding purchased loans in 2020.
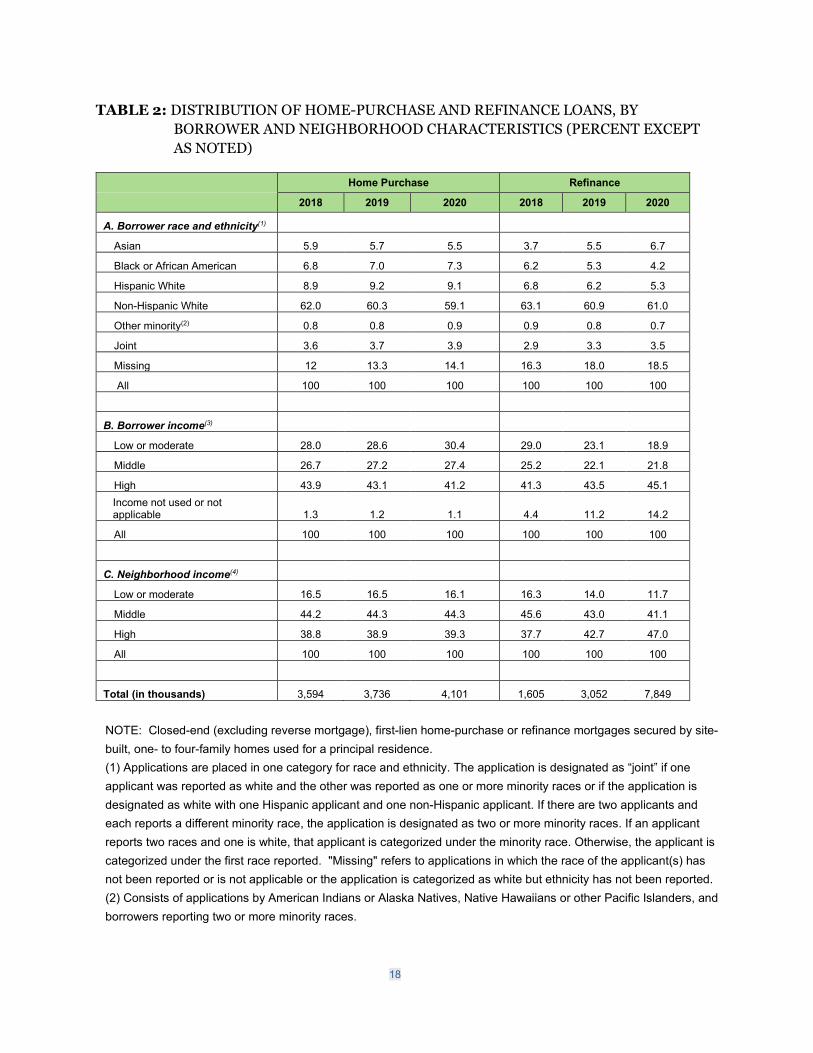
3.1 Distribution of home loans Table 2 presents different groups’ shares of closed-end (excluding reverse mortgage) site-built one-to-four-family, first lien, principal residence home purchase and refinance loans and how these shares have changed since 2018. Continuing the trend, Black borrowers’ share of home-purchase loans increased from 6.8 percent in 2018 to 7.3 percent in 2020, whereas the share for Hispanic white borrowers was at 9.1 percent in 2020, decreasing slightly from 9.2 percent in 2019 but higher than 8.9 percent in 2018. For non-Hispanic white borrowers, their share of home-purchase loans was 59.1 percent in 2020, down from 62.0 percent in 2018.
Non-Hispanic white borrowers accounted for about 61.0 percent of all refinance loans in 2020, up slightly from 60.9 percent in 2019. Asian borrowers took up a larger share among refinance loans in 2020 than in previous years, accounting for about 6.7 percent of all refinance loans in 2020, compared to 5.5 percent in 2019. In contrast, the shares of Black and Hispanic white borrowers among refinance loans decreased in 2020. The Hispanic white borrowers’ share of refinance loans declined from 6.2 percent in 2019 to 5.3 percent in 2020, and the Black borrowers’ share of refinance loans declined from 5.3 percent in 2019 to 4.2 percent in 2020.
We note that such observations are set against the backdrop in which origination volumes of refinance loans had increased substantially for all groups in 2020 and the similar trends already started in 2019 when the refinance boom began.
17
The shares of home purchase and refinance loans exhibit opposite trends for low- and moderate-income (LMI) borrowers compared with high-income borrowers.22 The LMI borrower share of home-purchase loans increased from 28.6 percent to 30.4 percent, whereas high-income borrowers’ share decreased from 43.1 percent to 41.2 percent. The LMI borrower share of refinance loans decreased from 23.1 percent to 18.9 percent, while high-income borrowers’ share increased from 43.5 percent to 45.1 percent.
The trends in shares of LMI and high-income neighborhoods mirror those of the borrowers for refinance loans but not for home purchase loans.23 The LMI neighborhoods’ share of refinance loans decreased, whereas high-income neighborhoods’ share of refinance loans increased. On the other hand, the share of home purchase loans in LMI neighborhoods declined slightly, while the share in high-income neighborhoods increased slightly between 2019 and 2020.
Even though the share of refinance loans for most racial/ethnic groups, LMI borrowers, and LMI neighborhoods has decreased, because of the increase in the total number of refinance loans, the number of refinance loans has increased for all groups between 2018 and 2020.24 For example, the share of refinance loans for Black borrowers decreased from 5.3 percent to 4.2 percent but the number increased by about 63,000. The increase in the number of refinance loans was especially large for non-Hispanic white borrowers, Asian borrowers, high-income borrowers, and high-income neighborhoods.
22 In accordance with the definitions used by the federal bank supervisory agencies to enforce the Community Reinvestment Act, LMI borrowers are defined as those with incomes less than 80 percent of the estimated current area median family income (AMFI). Middle-income borrowers have incomes of at least 80 percent and less than 120 percent of AMFI, and high-income borrowers have incomes of at least 120 percent of AMFI. AMFI is estimated based on the incomes of residents of the metropolitan area or nonmetropolitan portion of the state in which the loan-securing property is located. For AMFI estimates, see Federal Financial Institutions Examination Council (2020), “FFIEC Median Family Income Report,” available at https://www.ffiec.gov/Medianincome.htm. A very small percentage of records had income reported as zero or negative. They are included in the LMI group. 23 Definitions for LMI, middle-income, and high-income neighborhoods are identical to those for LMI, middle-income, and high-income borrowers, but are based on the ratio of census-tract median family income to AMFI measured from the census data. 24 The bottom of Table 2 provides the total loan counts for each year, and thus the number of loans to a given group in a given year can be easily computed. For example, the number of home-purchase loans to Asians in 2020 was approximately 226,000, calculated by multiplying 4.1 million loans by 5.5 percent.
18
TABLE 2: DISTRIBUTION OF HOME-PURCHASE AND REFINANCE LOANS, BY BORROWER AND NEIGHBORHOOD CHARACTERISTICS (PERCENT EXCEPT AS NOTED)
Home Purchase Refinance
2018 2019 2020 2018 2019 2020
A. Borrower race and ethnicity(1)
Asian 5.9 5.7 5.5 3.7 5.5 6.7
Black or African American 6.8 7.0 7.3 6.2 5.3 4.2
Hispanic White 8.9 9.2 9.1 6.8 6.2 5.3
Non-Hispanic White 62.0 60.3 59.1 63.1 60.9 61.0
Other minority(2) 0.8 0.8 0.9 0.9 0.8 0.7
Joint 3.6 3.7 3.9 2.9 3.3 3.5
Missing 12 13.3 14.1 16.3 18.0 18.5
All 100 100 100 100 100 100
B. Borrower income(3)
Low or moderate 28.0 28.6 30.4 29.0 23.1 18.9
Middle 26.7 27.2 27.4 25.2 22.1 21.8
High 43.9 43.1 41.2 41.3 43.5 45.1 Income not used or not applicable 1.3 1.2 1.1 4.4 11.2 14.2
All 100 100 100 100 100 100
C. Neighborhood income(4)
Low or moderate 16.5 16.5 16.1 16.3 14.0 11.7
Middle 44.2 44.3 44.3 45.6 43.0 41.1
High 38.8 38.9 39.3 37.7 42.7 47.0
All 100 100 100 100 100 100
Total (in thousands) 3,594 3,736 4,101 1,605 3,052 7,849 NOTE: Closed-end (excluding reverse mortgage), first-lien home-purchase or refinance mortgages secured by site-built, one- to four-family homes used for a principal residence. (1) Applications are placed in one category for race and ethnicity. The application is designated as “joint” if one applicant was reported as white and the other was reported as one or more minority races or if the application is designated as white with one Hispanic applicant and one non-Hispanic applicant. If there are two applicants and each reports a different minority race, the application is designated as two or more minority races. If an applicant reports two races and one is white, that applicant is categorized under the minority race. Otherwise, the applicant is categorized under the first race reported. "Missing" refers to applications in which the race of the applicant(s) has not been reported or is not applicable or the application is categorized as white but ethnicity has not been reported. (2) Consists of applications by American Indians or Alaska Natives, Native Hawaiians or other Pacific Islanders, and borrowers reporting two or more minority races.

19
(3) The categories for the borrower-income group are as follows: Low- or moderate-income (or LMI) borrowers have income that is less than 80 percent of estimated current area median family income (AMFI), middle-income borrowers have income that is at least 80 percent and less than 120 percent of AMFI, and high-income borrowers have income that is at least 120 percent of AMFI. (4) The categories for the neighborhood-income group are based on the ratio of census-tract median family income to area median family income published by FFIEC (available at https://www.ffiec.gov/Medianincome.htm), and the three categories have the same cutoffs as the borrower-income groups (see note 3).

20
3.2 Mortgage characteristics of home loans The median characteristics of mortgage loans and borrowers may differ substantially by race and ethnicity, borrower income and neighborhoods, and loan types. Table 3A shows the median loan amount, credit scores of borrowers, interest rates, and total loan costs of home purchase loans for different race/ethnicity groups, borrower income, neighborhood income, and enhanced loan types over time. 25 The sample is limited to closed-end first-lien mortgages for site-built one-to-four-family, principal residences with loan purpose being home purchase. Table 3B presents similar information for refinance loans.
The median loan amounts for home purchase loans have risen consistently across all categories, likely reflecting the rise in home prices. 26 Among different racial/ethnic groups, in 2020, Asian borrowers continued to take out home-purchase loans with the largest median loan amount, with a median of about $362,000. In contrast, Black borrowers continued to take out loans with the smallest median loan amount for home purchase, at approximately $236,000. The median loan amount of home purchase loans for Hispanic white borrowers was $241,000 in 2020, while the median loan amount of home purchase loans for non-Hispanic white borrowers was $247,000.
Not surprisingly, in 2020, the median loan amount of home purchase loans for high-income borrowers was $350,000, which is almost twice that of LMI borrowers, $180,000. Similarly, the median loan amount of home-purchase loans secured by properties in high-income areas was $314,000, compared to $208,000 in LMI neighborhoods. Loan amounts vary by loan type. The home-purchase jumbo loans have a median loan amount of $891,000 in 2020. In comparison, the median loan amounts of home-purchase loans were $162,000 for RHS/FSA loans and $221,000 for FHA loans, respectively.
Similar to the home-purchase loans, in 2020, the median loan amount of refinance loans for Asian borrowers was also higher than other racial/ethnic groups, at approximately $359,000 in
25 We report the medians instead of averages in Tables 3A and 3B because medians are more stable and less subject to outliers than averages. In general, the patterns of averages looked similar to the patterns in medians. Combining the transaction types (closed-end, open-end, reverse mortgage), loan types reported under HMDA (conventional, FHA, VA, RHS/FSA), conforming loan status based on the loan amount reported and the conforming loan limits published by the Federal Housing Finance Agency (FHFA), all single family LARs can be grouped into seven categories: 1) Conventional Conforming; 2) Conventional Non-conforming or Jumbo; 3) FHA; 4) VA; 5) RHS/FSA; 6) HELOC; and 7) Reverse Mortgage. These categories are referred to as the “Enhanced Loan Types”. 26 All dollar amounts are reported in nominal terms.

21
2020, compared to $235,000 for Black borrowers, $250,000 for Hispanic white borrowers, and $246,000 for non-Hispanic white borrowers.
Credit scores are widely used in mortgage underwriting and pricing. Where applicable, credit scores have been collected and reported in HMDA since 2018.27 Table 3A shows that the median credit scores for closed-end home purchase mortgage loans secured by first-lien principal-residence site-built single-family properties are higher in 2020 than in 2019. But the variations of median credit scores among different groups remain. Black and Hispanic white borrowers continued to have lower median credit scores than other racial/ethnic groups. The median credit score of Black borrowers who took out home-purchase loans was 690 in 2020, and the median credit score of Hispanic white home-purchase loan borrowers was 712. In comparison, the median credit scores of non-Hispanic white and Asian home-purchase loan borrowers were 748 and 761 in 2020, respectively.
High-income home-purchase borrowers have higher median credit scores than middle and LMI borrowers, and borrowers taking out home-purchase loans secured by properties in high-income neighborhoods have higher median credits scores than borrowers in middle and LMI neighborhoods as well. In terms of loan types, the median credit score for home-purchase jumbo loan borrowers was 779 in 2020, the median credit score of conventional conforming home-purchase loan borrowers was 760, while the median credit score of FHA home-purchase loan borrowers was 669.
The median credit scores of refinance loan borrowers are higher than those of home-purchase loan borrowers, both overall and across most groups. The median credit score of Black borrowers who refinanced in 2020 was 726, and the median credit score of Hispanic white refinance borrowers was 744. In comparison, the median credit scores of non-Hispanic white and Asian borrowers who refinanced in 2020 were 769 and 779, respectively. The median credit score for refinance jumbo loan borrowers was 778 in 2020, the median credit score of conventional conforming refinance loan borrowers was 771, and the median credit score of FHA refinance loan borrowers was 669.
Mortgage interest rates were significantly lower in 2020 than in the preceding two years. The median interest rate for home-purchase loans secured by first-lien principal-residence site-built single-family properties was 3.125 percent in 2020, compared to 4.125 percent in 2019 and 4.750 in 2018. However, variations in interest rates among different racial/ethnic groups remain. At 3.250 percent, Black and Hispanic white borrowers continued to pay higher median interest rates than all other racial/ethnic groups for home-purchase loans. The median interest
27 To protect applicant and borrower privacy, credit score is excluded from the application-level HMDA data made available to the public.
22
rate for Asian home-purchase borrowers was 3.0 percent in 2020 and, the median interest rate for non-Hispanic white home-purchase borrowers was 3.125 percent. For home purchases, FHA loans had higher median interest rates than other enhanced loan types, at 3.250 percent in 2020, while VA loans had the lowest median interest rate at 3.0 percent.
Total loan costs, a data point collected and reported under HMDA since 2018, represent the sum of origination charges that the lender charges, charges for the services that borrowers cannot shop for (e.g., appraisal fees or credit report fees), and charges for services borrowers can shop for such as settlement agent or title insurance fees.28
The median total loan costs for home-purchase loans in 2020 was $4,736, up from $4,475 in 2019. Hispanic white borrowers of home-purchase loans paid $6,208 in median total loan costs, the highest among all racial/ethnic groups. The next highest was Black borrowers. The median total loan costs for Black home-purchase loan borrowers was $5,980. In comparison, the median total loan costs of home-purchase loans were $4,344 for non-Hispanic white borrowers and $4,892 for Asian borrowers.
The median total loan costs of home-purchase loans was higher for high-income borrowers ($4,916) and middle-income borrowers ($4,901) than LMI borrowers ($4,376). On the other hand, the median total loan costs of home-purchase loans was higher for loans secured by properties in LMI neighborhoods ($4,859) than those in middle-income ($4,637) or in high-income neighborhoods ($4,790). Among various enhanced loan types for home-purchase loans, FHA loans had the highest median total loan costs, at $8,052, likely reflecting the required upfront mortgage insurance premium which could be a significant part of the total loan costs of FHA loans. The median total loan costs was $6,233 for VA home-purchase loans.
The median total loan costs for refinance loans in 2020 was $3,310, which is lower than that for home-purchase loans, and down from $3,556 in 2019. The Hispanic white borrowers who refinanced in 2020 paid $3,932 in median total loan costs, also the highest among all racial/ethnic groups for refinance loans. The next highest was Black borrowers. The median total loan costs for Black refinance loan borrowers was $3,836. The median total loan costs of refinance loans were $3,204 for non-Hispanic white borrowers and $2,992 for Asian borrowers.
28 The total loan costs collected under HMDA only applies to originated loans that are subject to specified requirements in Regulation Z. It is limited to “buyer-paid” portions of the total loan costs on the TILA-RESPA Integrated Disclosure Rule (TRID) Closing Disclosure of applicable loans. In other words, under the HMDA reporting requirements, it includes the charges by the lenders as well as the charges by the third party service providers in connection with obtaining the loan to the extent those are paid by a consumer rather than by a seller or other third party.

23
The median total loan costs of refinance loans were similar across high-income ($3,316), middle-income ($3,278), and LMI borrowers ($3,306). On the other hand, the median total loan costs of refinance loans was higher for loans secured by properties in LMI neighborhoods ($3,443) than those in middle-income ($3,319) or high-income neighborhoods ($3,272). The pattern of median total loan costs for refinance loans by enhanced loan types was consistent with the pattern for home-purchase loans.

24
TABLE 3A: MEDIAN LOAN AMOUNTS, CREDIT SCORES, INTEREST RATES, AND TOTAL LOAN COSTS OF HOME-PURCHASE LOANS, BY BORROWER AND NEIGHBORHOOD CHARACTERISTICS AND ENHANCED LOAN TYPE
Median Loan Amount (Thousands
of Dollars) Median Credit
Score Median Interest Rate
(Percent) Median Total Loan
Cost (Dollars)
2018 2019 2020 2018 2019 2020 2018 2019 2020 2018 2019 2020 A. Borrower race and ethnicity(1)
Asian 333 340 362 755 757 761 4.500 3.886 3.000 4,638 4,702 4,892
Black or African American 204 217 236 682 683 690 4.875 4.250 3.250 5,235 5,457 5,980
Hispanic White 209 221 241 703 705 712 4.875 4.250 3.250 5,564 5,765 6,208
Non-Hispanic White 216 227 247 741 744 748 4.625 4.125 3.125 4,010 4,122 4,344
Other minority(2) 224 234 254 711 712 717 4.750 4.125 3.125 4,842 5,085 5,468
Joint 278 291 315 726 727 735 4.625 4.125 3.125 4,918 5,015 5,238
Missing 253 262 280 739 740 743 4.625 4.000 3.125 4,548 4,738 4,975
B. Borrower income(3)
Low or moderate 150 161 180 718 721 727 4.750 4.250 3.125 3,879 4,051 4,376
Middle 212 225 248 724 725 732 4.750 4.125 3.125 4,407 4,598 4,901
High 309 321 350 749 751 755 4.625 4.000 3.125 4,619 4,716 4,916 Income not used or not applicable 238 261 276 748 755 754 4.500 3.990 3.000 3,418 3,565 3,569
C. Neighborhood income(4)
Low or moderate 178 189 208 713 715 722 4.750 4.250 3.250 4,336 4,526 4,859
Middle 201 213 232 726 727 733 4.750 4.125 3.125 4,212 4,370 4,637
High 283 294 314 751 752 755 4.625 4.000 3.125 4,463 4,565 4,790
D. Enhanced Loan Type(5)
Conventional conforming 228 239 261 754 757 760 4.750 4.125 3.125 3,607 3,717 3,920
Jumbo 745 785 891 774 775 779 4.350 3.875 3.125 5,718 5,781 6,232
FHA 191 206 221 664 663 669 4.875 4.250 3.250 6,963 7,336 8,052
VA 246 258 285 710 712 720 4.500 3.990 3.000 5,352 5,332 6,233
RHS/FSA 137 145 162 692 691 693 4.750 4.125 3.125 4,348 4,551 4,989
Total 225 237 256 734 736 741 4.750 4.125 3.125 4,332 4,475 4,736 NOTE: Closed-end (excluding reverse mortgage) home-purchase first-lien mortgages secured by site-built one-to-four-family, principal-residence properties. (1) See table 2, note 1. (2) See table 2, note 2. (3) See table 2, note 3.

25
(4) See table 2, note 4 (5)The conventional conforming loan is a closed-end forward mortgage (i.e. excluding reverse mortgage) transaction whose loan type is reported as conventional and whose loan amount is below the conforming loan limit, making it eligible to be purchased by Fannie Mae or Freddie Mac (collectively known as Government Sponsored Enterprises, or GSEs). The conventional non-conforming, or jumbo loan is a closed-end forward mortgage transaction with its loan type reported as conventional and a loan amount above the conforming loan limit, making it ineligible to be purchased by the GSEs. The FHA, VA, and RHS/FSA loans follow the definition of loan types under HMDA and are restricted to closed-end loans excluding reverse mortgages.

26
TABLE 3B: MEDIAN LOAN AMOUNTS, CREDIT SCORES, INTEREST RATES, AND TOTAL LOAN COSTS OF REFINANCE LOANS, BY BORROWER AND NEIGHBORHOOD CHARACTERISTICS AND ENHANCED LOAN TYPE
Median Loan Amount (Thousands
of Dollars) Median Credit
Score Median Interest Rate
(Percent) Median Total Loan
Cost (Dollars)
2018 2019 2020 2018 2019 2020 2018 2019 2020 2018 2019 2020 A. Borrower race and ethnicity(1)
Asian 317 387 359 744 763 779 4.375 3.750 2.875 3,478 3,176 2,992 Black or African
American 177 222 235 690 698 726 4.625 3.990 3.000 4,323 4,224 3,836
Hispanic White 196 244 250 707 719 744 4.750 3.990 3.000 3,974 4,125 3,932
Non-Hispanic White 187 239 246 730 749 769 4.625 3.875 3.000 3,444 3,378 3,204
Other minority(2) 202 250 261 707 720 749 4.625 3.900 2.999 4,196 4,098 3,722
Joint 246 304 303 716 740 763 4.500 3.875 2.990 3,918 3,609 3,419
Missing 206 263 272 720 740 765 4.500 3.875 2.990 4,175 4,080 3,554
B. Borrower income(3)
Low or moderate 136 170 180 718 730 763 4.625 4.000 3.125 3,551 3,671 3,306
Middle 186 224 235 720 742 766 4.625 3.990 3.000 3,726 3,621 3,278
High 271 328 319 732 754 771 4.500 3.875 2.999 3,743 3,525 3,316 Income not used or not applicable 183 257 252 702 704 731 4.250 3.625 2.875 3,275 3,305 3,357
C. Neighborhood income(4)
Low or moderate 154 200 212 710 726 754 4.625 3.990 3.000 3,741 3,737 3,443
Middle 174 220 227 720 737 761 4.625 3.875 3.000 3,643 3,593 3,319
High 251 307 302 735 754 773 4.500 3.875 2.990 3,662 3,474 3,272
D. Enhanced Loan Type(5)
Conventional conforming 184 240 256 736 755 771 4.625 3.875 3.000 3,192 3,231 3,184
Jumbo 760 840 882 761 772 778 4.250 3.625 3.125 4,257 3,809 4,110
FHA 182 219 218 659 663 669 4.625 3.990 3.134 6,573 6,712 5,716
VA 228 269 271 692 706 736 4.375 3.625 2.750 5,937 3,528 3,114
RHS/FSA 128 174 167 696 701 714 3.880 3.625 3.000 4,055 4,399 4,440
Total 196 250 259 724 744 766 4.625 3.875 3.000 3,664 3,556 3,310 NOTE: Closed-end (excluding reverse mortgage) refinance first-lien mortgages secured by site-built one-to-four-family, principal-residence properties. (1) See table 2, note 1. (2) See table 2, note 2. (3) See table 2, note 3. (4) See table 2, note 4. (5) See table 3A, note 5.

27
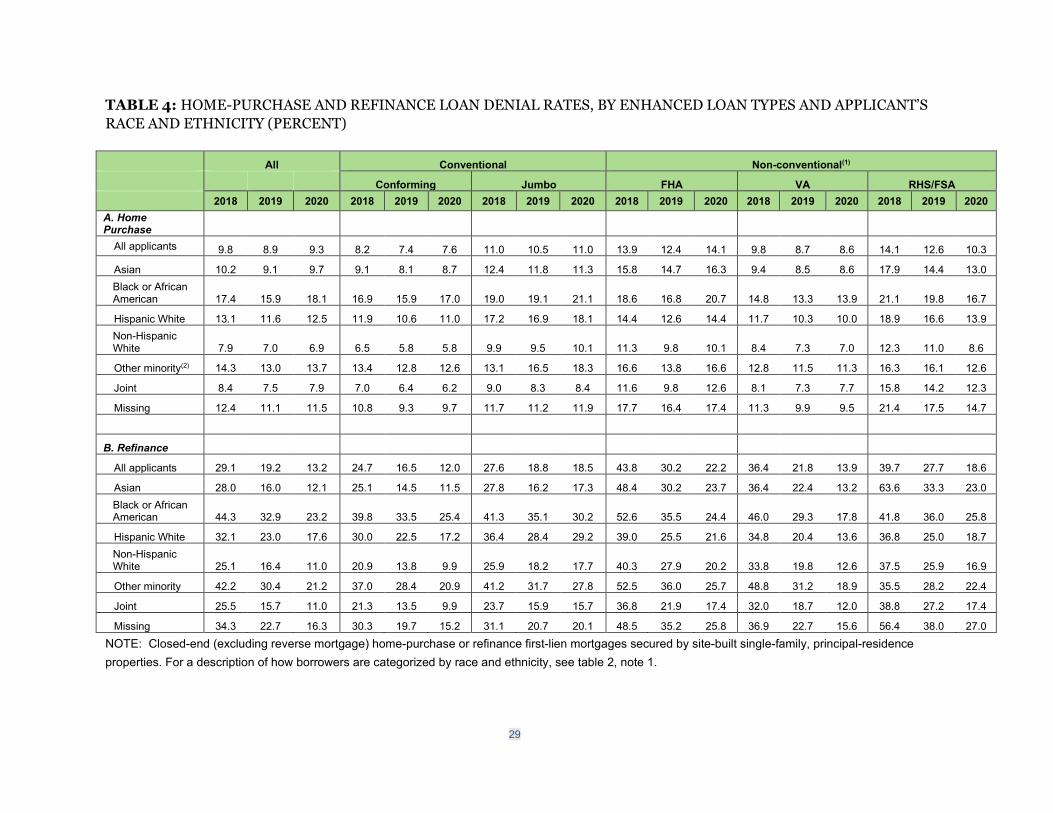
3.3 Denial rates The overall denial rate for home-purchase applications for all applicants was 9.3 percent in 2020, higher than that in 2019 (8.9 percent) but lower than that in 2018 (9.8 percent).29 About 14.1 percent of FHA applications (excluding withdrawn or incomplete applications) for home-purchase loans were denied in 2020, followed by applications for jumbo loans with a denial rate of 11 percent. The conventional conforming home-purchase applications had a denial rate of 7.6 percent in 2020, the lowest among all enhanced loan types.
The denial rates for refinance applications were higher than those for home-purchase loans, but had been falling in the past two years, accompanying the large refinance boom. The overall denial rate on applications for refinance loans was 13.2 percent in 2020, 6 percentage points lower than in 2019 and less than half of the denial rate (29.1 percent) in 2018. Consistent with home-purchase applications, applications for FHA refinance loans were more likely to be denied (22.2 percent) than all other enhanced loan types, while applications for conventional conforming refinance loans were the least likely to be denied (12.0 percent).
As in the past years, Black and Hispanic white borrowers had notably higher denial rates in 2020 than non-Hispanic white and Asian borrowers. Among home-purchase applications, the overall denial rates were 18.1 percent for Black applicants and 12.5 percent for Hispanic white applicants in 2020, both of which were higher than those in 2019. In contrast, the overall denial rates of home-purchase applications were 9.7 percent for Asian applicants and 6.9 percent for non-Hispanic white applicants. Unlike other groups, non-Hispanic white home-purchase applicants’ denial rate dropped slightly in 2020 to 6.9 percent from their denial rate in 2019 (7.0 percent).
Within each enhanced loan type except FHA loans, Black and Hispanic white applicants for home-purchase loans had higher denial rates than non-Hispanic white or Asian applicants. For example, the denial rates of home-purchase loan applications for conventional conforming loans was 17.0 percent for Black applicants and 11.0 percent for Hispanic white applicants. In contrast, the denial rate of home-purchase loan applications for conventional conforming loans was 5.8 percent for non-Hispanic white applicants. On the other hand, for FHA home-purchase applications, the denial rate of Asian applicants was slightly higher than that of Hispanic white applicants but lower than that of Black applicants.
29 Denial rates are calculated as the number of denied loan applications divided by the total number of applications, excluding withdrawn applications and application files closed for incompleteness.

28
Consistent with denials for home-purchase loans, Black and Hispanic white applicants were also more likely to be denied for refinance applications, although the denial rates for refinance applications fell overall for all racial/ethnic groups in 2020. About 23.2 percent of Black applicants applying for refinance loans were denied in 2020 and 17.6 percent of Hispanic white refinance applications were denied, compared to the denial rates of 12.1 percent and 11.0 percent for Asian and non-Hispanic white refinance loan applicants, respectively. The denial rate disparities of refinance loan applications among different groups were smaller among FHA and VA loan applications than conventional conforming and jumbo loans. For example, the denial rates for conventional conforming refinance applications stood at 25.4 percent, 17.2 percent, 11.5 percent, and 9.9 percent for Black, Hispanic white, Asian, and non-Hispanic white applicants in 2020. The denial rates for FHA refinance applications were 24.4 percent, 21.6 percent, 23.7 percent, and 20.2 percent for Black, Hispanic white, Asian, and non-Hispanic white applicants.
29
TABLE 4: HOME-PURCHASE AND REFINANCE LOAN DENIAL RATES, BY ENHANCED LOAN TYPES AND APPLICANT’S RACE AND ETHNICITY (PERCENT)
All Conventional Non-conventional(1)
Conforming Jumbo FHA VA RHS/FSA
2018 2019 2020 2018 2019 2020 2018 2019 2020 2018 2019 2020 2018 2019 2020 2018 2019 2020 A. Home Purchase
All applicants 9.8 8.9 9.3 8.2 7.4 7.6 11.0 10.5 11.0 13.9 12.4 14.1 9.8 8.7 8.6 14.1 12.6 10.3
Asian 10.2 9.1 9.7 9.1 8.1 8.7 12.4 11.8 11.3 15.8 14.7 16.3 9.4 8.5 8.6 17.9 14.4 13.0 Black or African American 17.4 15.9 18.1 16.9 15.9 17.0 19.0 19.1 21.1 18.6 16.8 20.7 14.8 13.3 13.9 21.1 19.8 16.7
Hispanic White 13.1 11.6 12.5 11.9 10.6 11.0 17.2 16.9 18.1 14.4 12.6 14.4 11.7 10.3 10.0 18.9 16.6 13.9 Non-Hispanic White 7.9 7.0 6.9 6.5 5.8 5.8 9.9 9.5 10.1 11.3 9.8 10.1 8.4 7.3 7.0 12.3 11.0 8.6
Other minority(2) 14.3 13.0 13.7 13.4 12.8 12.6 13.1 16.5 18.3 16.6 13.8 16.6 12.8 11.5 11.3 16.3 16.1 12.6
Joint 8.4 7.5 7.9 7.0 6.4 6.2 9.0 8.3 8.4 11.6 9.8 12.6 8.1 7.3 7.7 15.8 14.2 12.3
Missing 12.4 11.1 11.5 10.8 9.3 9.7 11.7 11.2 11.9 17.7 16.4 17.4 11.3 9.9 9.5 21.4 17.5 14.7
B. Refinance
All applicants 29.1 19.2 13.2 24.7 16.5 12.0 27.6 18.8 18.5 43.8 30.2 22.2 36.4 21.8 13.9 39.7 27.7 18.6
Asian 28.0 16.0 12.1 25.1 14.5 11.5 27.8 16.2 17.3 48.4 30.2 23.7 36.4 22.4 13.2 63.6 33.3 23.0 Black or African American 44.3 32.9 23.2 39.8 33.5 25.4 41.3 35.1 30.2 52.6 35.5 24.4 46.0 29.3 17.8 41.8 36.0 25.8
Hispanic White 32.1 23.0 17.6 30.0 22.5 17.2 36.4 28.4 29.2 39.0 25.5 21.6 34.8 20.4 13.6 36.8 25.0 18.7 Non-Hispanic White 25.1 16.4 11.0 20.9 13.8 9.9 25.9 18.2 17.7 40.3 27.9 20.2 33.8 19.8 12.6 37.5 25.9 16.9
Other minority 42.2 30.4 21.2 37.0 28.4 20.9 41.2 31.7 27.8 52.5 36.0 25.7 48.8 31.2 18.9 35.5 28.2 22.4
Joint 25.5 15.7 11.0 21.3 13.5 9.9 23.7 15.9 15.7 36.8 21.9 17.4 32.0 18.7 12.0 38.8 27.2 17.4
Missing 34.3 22.7 16.3 30.3 19.7 15.2 31.1 20.7 20.1 48.5 35.2 25.8 36.9 22.7 15.6 56.4 38.0 27.0 NOTE: Closed-end (excluding reverse mortgage) home-purchase or refinance first-lien mortgages secured by site-built single-family, principal-residence properties. For a description of how borrowers are categorized by race and ethnicity, see table 2, note 1.

30
(1) Nonconventional loans are those insured by the Federal Housing Administration or backed by guarantees from the U.S. Department of Veterans Affairs, the Farm Service Agency, or the Rural Housing Service. (2) See table 2, note 1.

31
4. Monthly mortgage trends and activities The discussion and tables in previous chapters provide historical comparisons on an annual basis. In this chapter, we show the monthly trends of mortgage activities from 2018 to 2020. In doing so, we rely on the action taken date that was collected and reported under HMDA. We note that the action taken date is a data field not available in the publicly released version of the modified HMDA data.
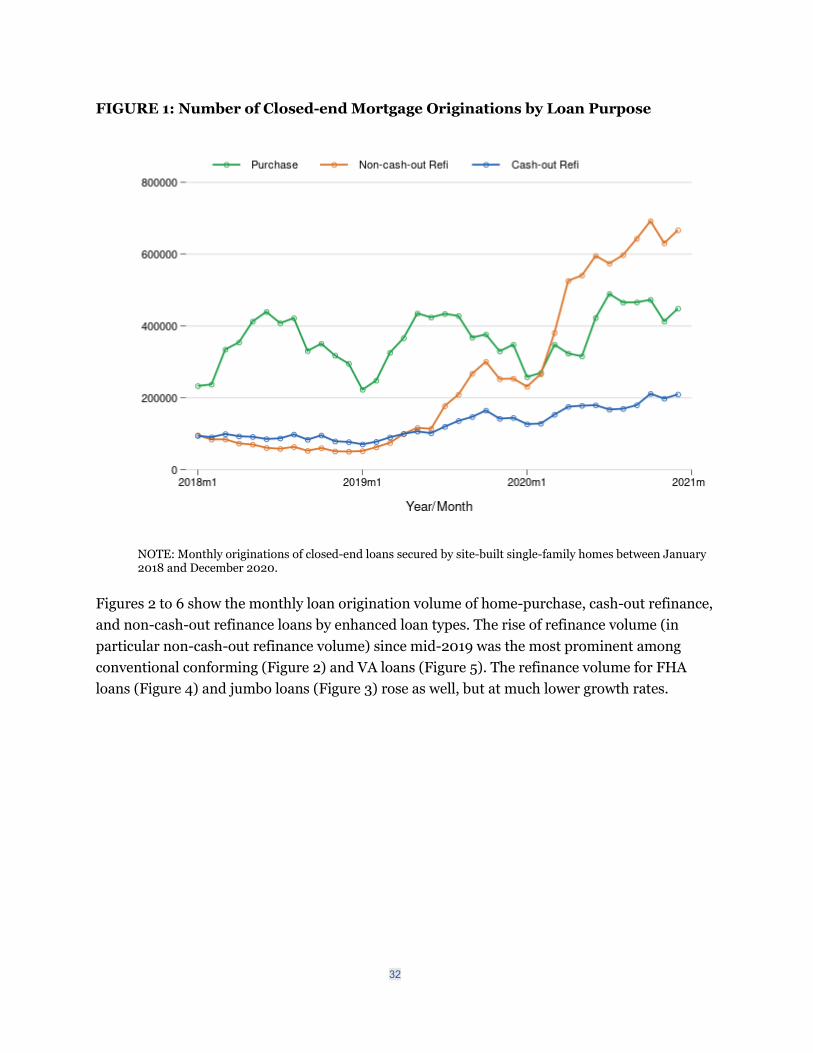
Figure 1 plots the number of originations for closed-end mortgage loans secured by site-built single-family homes in each month between January 2018 and December 2020, separated by three loan purposes: home purchase, cash-out refinance, and non-cash-out refinance. The home purchase origination volume clearly displays a strong seasonal pattern, as home sales typically fluctuate as the numbers of home sellers and buyers entering the markets change with the seasons. The overall levels of home purchase loans in 2018 and in the first half of 2019 were largely similar. The home-purchase loan origination volume appeared to rise year-over-year in the second half of 2019. In April and May 2020, contrary to typical seasonal patterns, the home-purchase origination volume declined, likely reflecting the effects of the pandemic and nationwide shutdown. But starting in June 2020, the home-purchase volume recovered and increased significantly in terms of year-over-year comparison despite the typical low-home-sale seasons near the end of the year.
The volume of cash-out refinance loans was higher than non-cash-out refinance loans in 2018 and during the first quarter of 2019. In May 2019, the non-cash-out refinance loan volume exceeded the cash-out refinance volume, and soon after, the refinance volume, in particular, the non-cash-out refinance volume, significantly increased. Other than a mild drop in the refinance volume in the last quarter of 2019, the refinance boom we observed in 2020 very much looked like a continuation of the trends since the second quarter of 2019. Monthly non-cash-out refinance volume reached as high as over 692,000 loans per month in October 2020 and stayed above 600,000 per month for 4 months in a row near the end of 2020.
32
FIGURE 1: Number of Closed-end Mortgage Originations by Loan Purpose
NOTE: Monthly originations of closed-end loans secured by site-built single-family homes between January 2018 and December 2020.
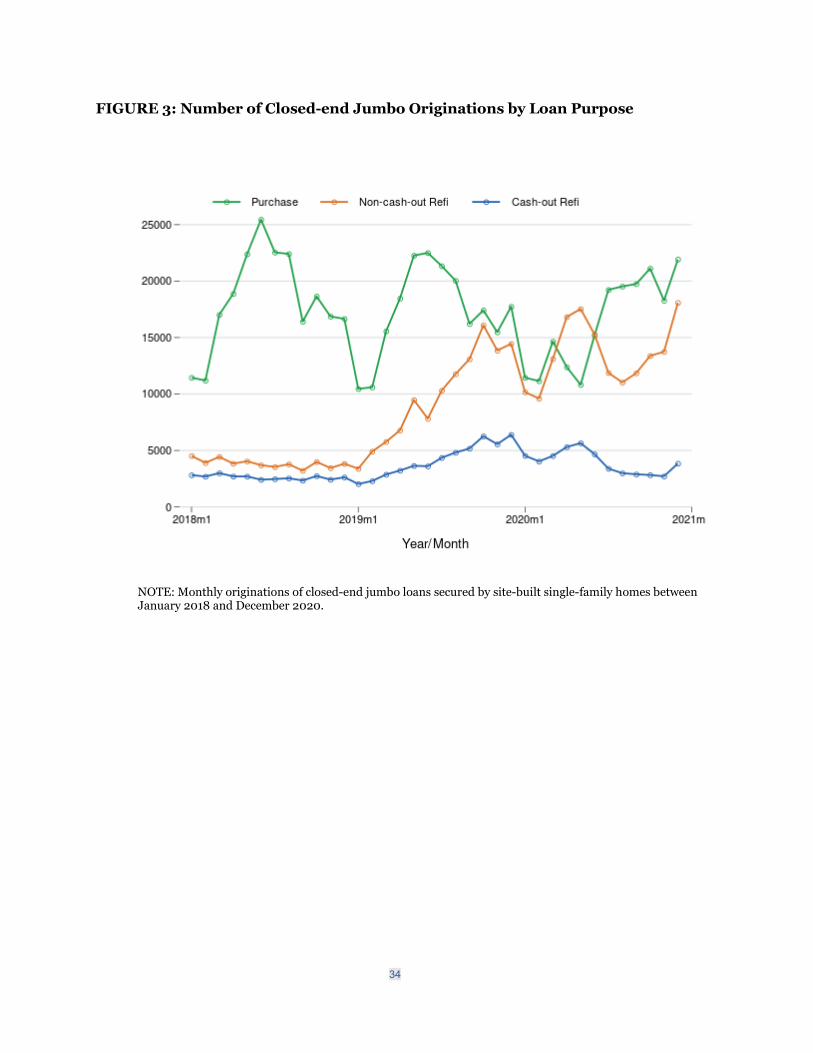
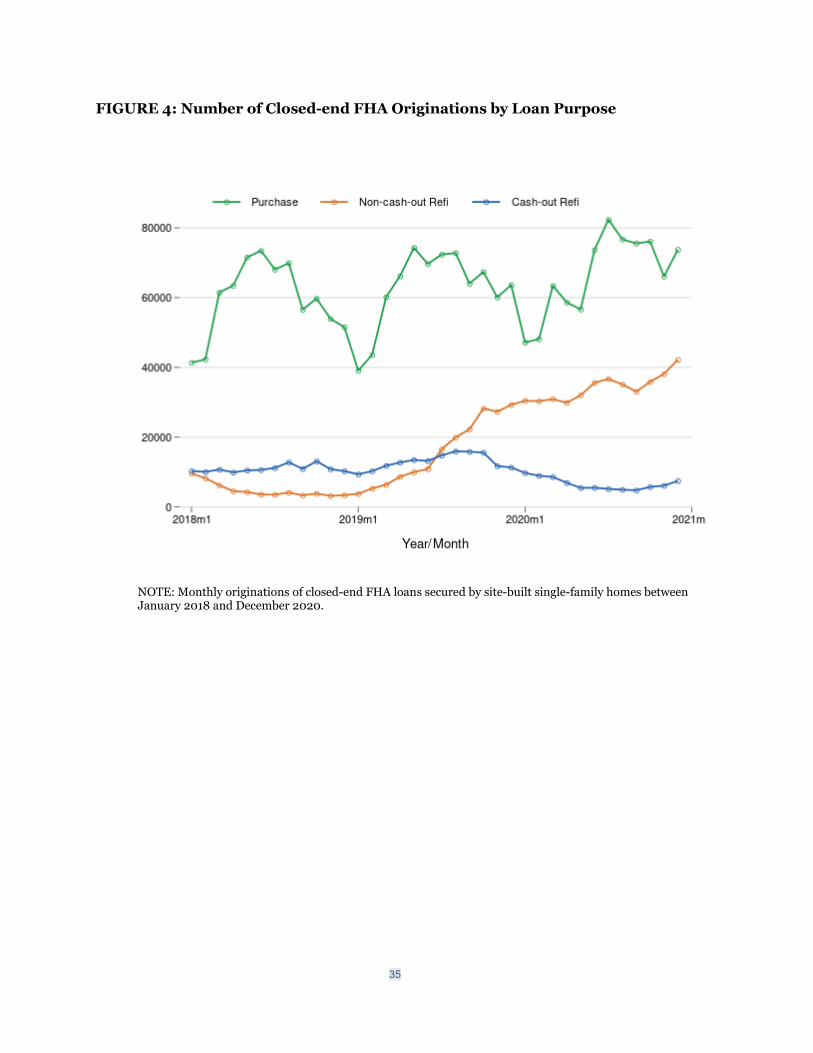
Figures 2 to 6 show the monthly loan origination volume of home-purchase, cash-out refinance, and non-cash-out refinance loans by enhanced loan types. The rise of refinance volume (in particular non-cash-out refinance volume) since mid-2019 was the most prominent among conventional conforming (Figure 2) and VA loans (Figure 5). The refinance volume for FHA loans (Figure 4) and jumbo loans (Figure 3) rose as well, but at much lower growth rates.

33
FIGURE 2: Number of Closed-end Conventional Conforming Originations by Loan Purpose
NOTE: Monthly originations of closed-end conventional conforming loans secured by site-built single-family homes between January 2018 and December 2020.
34
FIGURE 3: Number of Closed-end Jumbo Originations by Loan Purpose
NOTE: Monthly originations of closed-end jumbo loans secured by site-built single-family homes between January 2018 and December 2020.
35
FIGURE 4: Number of Closed-end FHA Originations by Loan Purpose
NOTE: Monthly originations of closed-end FHA loans secured by site-built single-family homes between January 2018 and December 2020.

36
FIGURE 5: Number of Closed-end VA Originations by Loan Purpose
NOTE: Monthly originations of closed-end VA loans secured by site-built single-family homes between January 2018 and December 2020.

37
FIGURE 6: Number of Closed-end RHS/FSA Originations by Loan Purpose
NOTE: Monthly originations of closed-end RHS/FSA loans secured by site-built single-family homes between January 2018 and December 2020.
Figure 7 shows the monthly origination volume of closed-end home-purchase loans broken down by race/ethnicity. Compared to the same period in 2019, Asian, Black, Hispanic white, and non-Hispanic white borrowers all saw a significant increase in origination volumes in the second half of 2020. Because the share of non-Hispanic white borrowers far exceeds the shares of Asian, Black and Hispanic white borrowers, in order to aid the visual comparison of the lending volumes and shares of minority borrowers over time, we included Figures 7A, 8A, 9A, and 10A where white borrowers are dropped and the vertical axis is rescaled accordingly. Figure 8 shows among home-purchase loan originations the relative share of each of these groups by month. Overall, since May 2020, Hispanic white, Black, and Asian borrowers have all accounted for larger shares of home purchase loans (Figure 8A).

38
FIGURE 7: Number of Closed-end Home-purchase Loan Originations by Race and Ethnicity
NOTE: Monthly originations of closed-end home-purchase loans secured by site-built single-family homes between January 2018 and December 2020.

39
FIGURE 7A: Number of Closed-end Home-purchase Loan Originations by Race and Ethnicity (Minorities Only)
NOTE: Monthly originations of closed-end home-purchase loans secured by site-built single-family homes between January 2018 and December 2020.

40
FIGURE 8: Share of Closed-end Home-purchase Loan Originations by Race and Ethnicity
NOTE: Monthly originations of closed-end home-purchase loans secured by site-built single-family homes between January 2018 and December 2020.
41
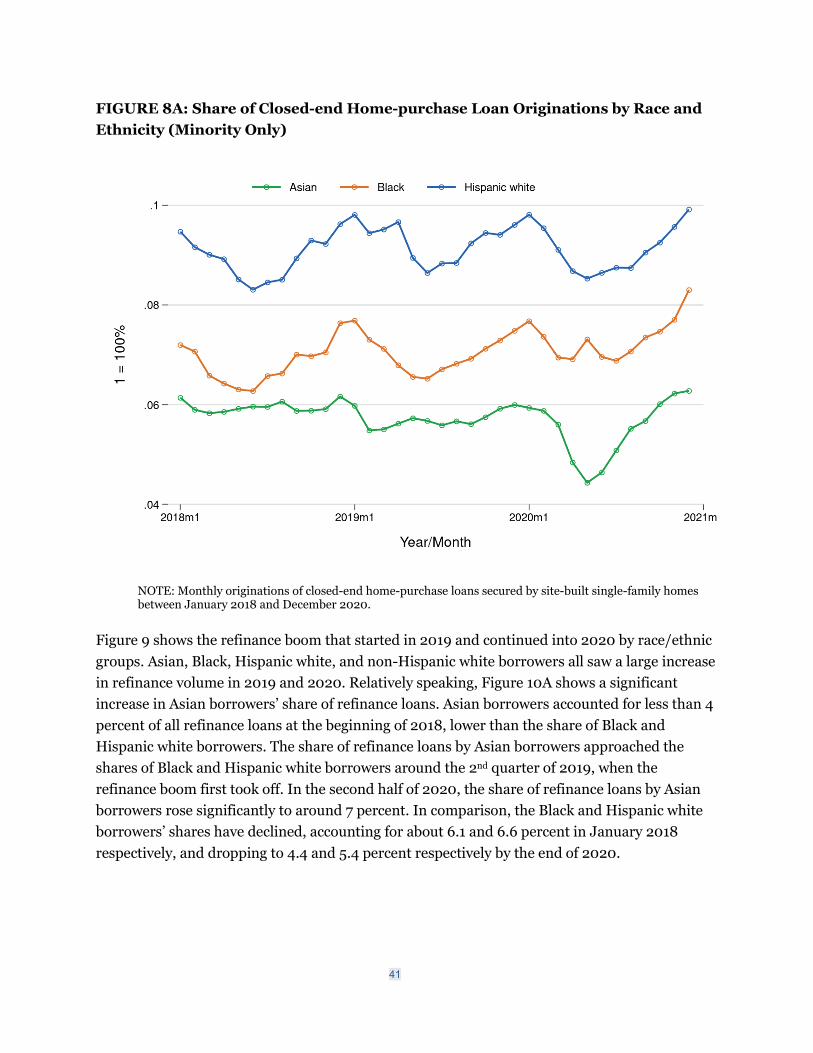
FIGURE 8A: Share of Closed-end Home-purchase Loan Originations by Race and Ethnicity (Minority Only)
NOTE: Monthly originations of closed-end home-purchase loans secured by site-built single-family homes between January 2018 and December 2020.
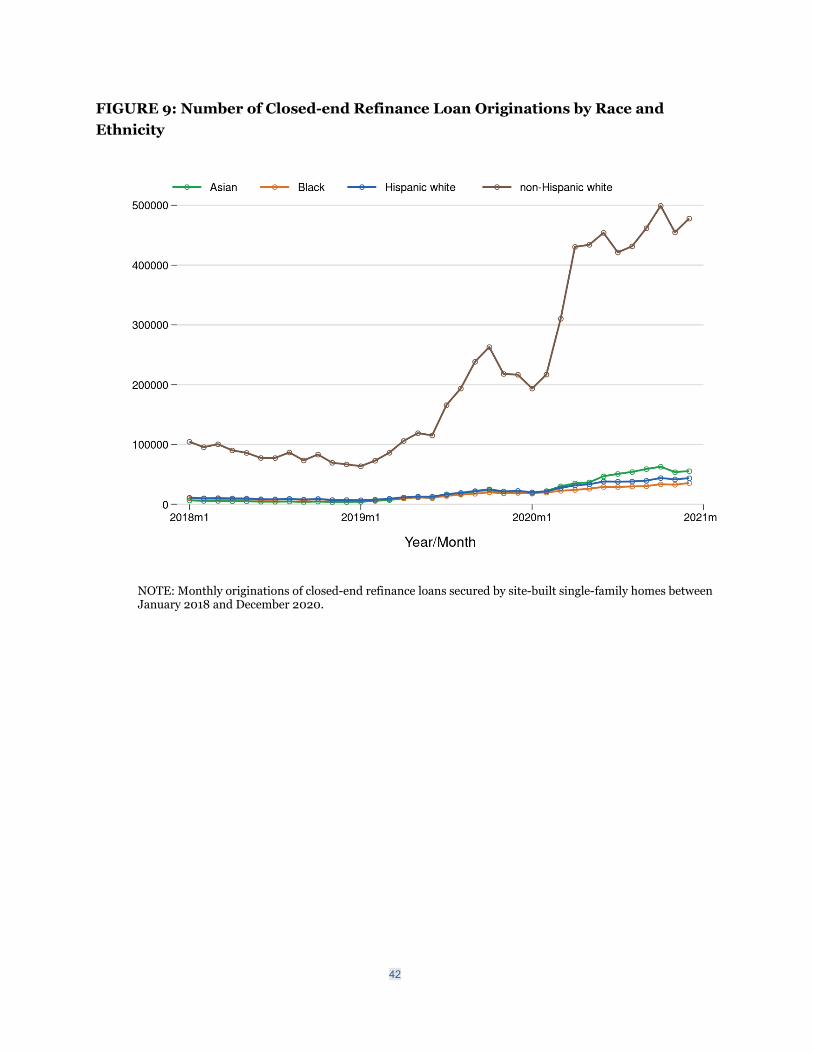
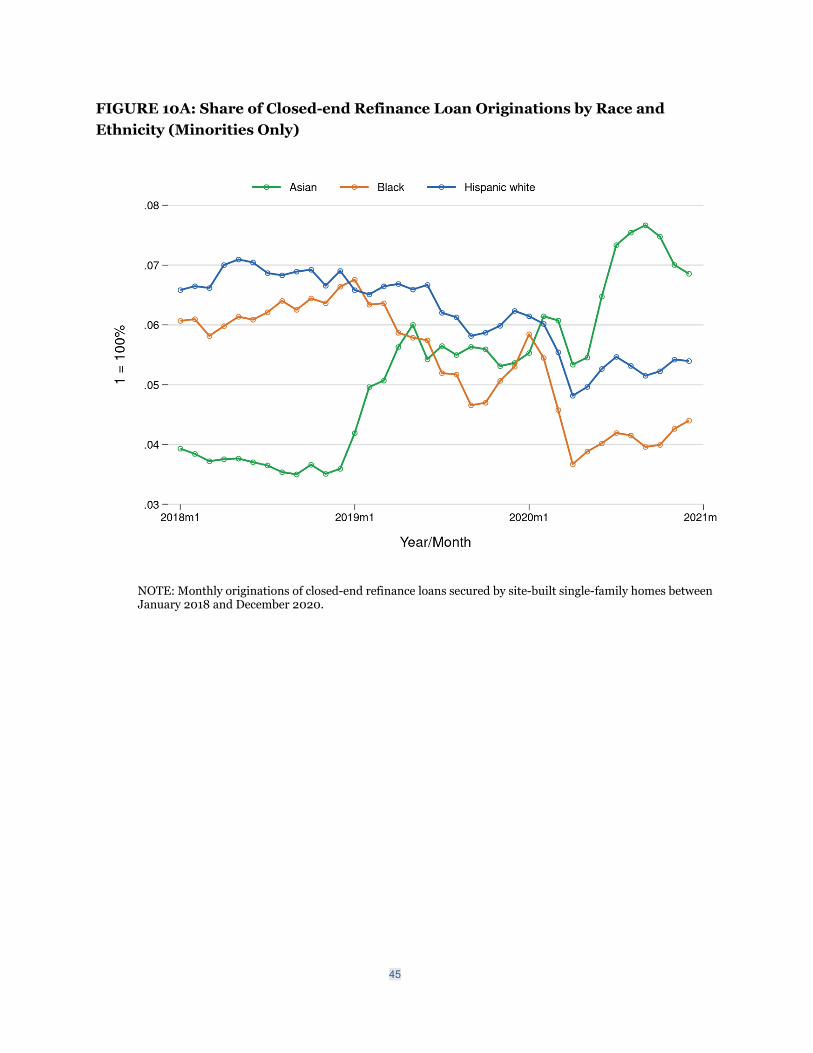
Figure 9 shows the refinance boom that started in 2019 and continued into 2020 by race/ethnic groups. Asian, Black, Hispanic white, and non-Hispanic white borrowers all saw a large increase in refinance volume in 2019 and 2020. Relatively speaking, Figure 10A shows a significant increase in Asian borrowers’ share of refinance loans. Asian borrowers accounted for less than 4 percent of all refinance loans at the beginning of 2018, lower than the share of Black and Hispanic white borrowers. The share of refinance loans by Asian borrowers approached the shares of Black and Hispanic white borrowers around the 2nd quarter of 2019, when the refinance boom first took off. In the second half of 2020, the share of refinance loans by Asian borrowers rose significantly to around 7 percent. In comparison, the Black and Hispanic white borrowers’ shares have declined, accounting for about 6.1 and 6.6 percent in January 2018 respectively, and dropping to 4.4 and 5.4 percent respectively by the end of 2020.
42
FIGURE 9: Number of Closed-end Refinance Loan Originations by Race and Ethnicity
NOTE: Monthly originations of closed-end refinance loans secured by site-built single-family homes between January 2018 and December 2020.

43
FIGURE 9A: Number of Closed-end Refinance Loan Originations by Race and Ethnicity (Minority Only)
NOTE: Monthly originations of closed-end refinance loans secured by site-built single-family homes between January 2018 and December 2020.

44
FIGURE 10: Share of Closed-end Refinance Loan Originations by Race and Ethnicity
NOTE: Monthly originations of closed-end refinance loans secured by site-built single-family homes between January 2018 and December 2020.
45
FIGURE 10A: Share of Closed-end Refinance Loan Originations by Race and Ethnicity (Minorities Only)
NOTE: Monthly originations of closed-end refinance loans secured by site-built single-family homes between January 2018 and December 2020.
46
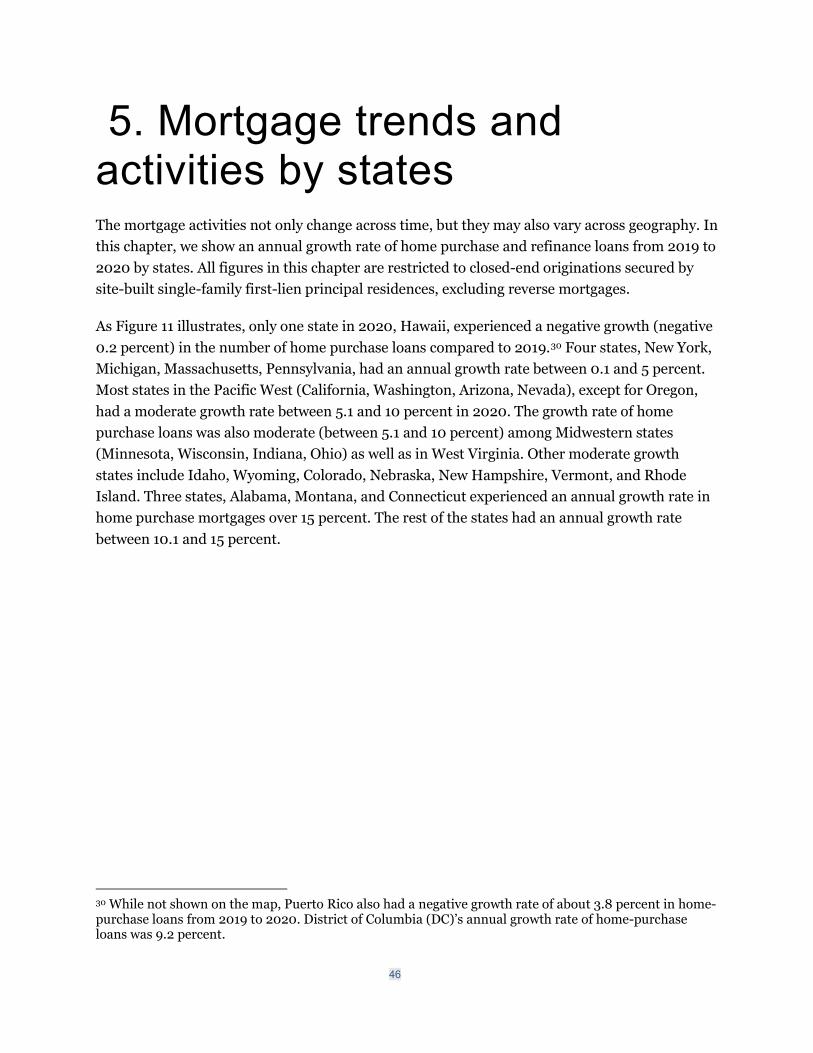
5. Mortgage trends and activities by states The mortgage activities not only change across time, but they may also vary across geography. In this chapter, we show an annual growth rate of home purchase and refinance loans from 2019 to 2020 by states. All figures in this chapter are restricted to closed-end originations secured by site-built single-family first-lien principal residences, excluding reverse mortgages.
As Figure 11 illustrates, only one state in 2020, Hawaii, experienced a negative growth (negative 0.2 percent) in the number of home purchase loans compared to 2019.30 Four states, New York, Michigan, Massachusetts, Pennsylvania, had an annual growth rate between 0.1 and 5 percent. Most states in the Pacific West (California, Washington, Arizona, Nevada), except for Oregon, had a moderate growth rate between 5.1 and 10 percent in 2020. The growth rate of home purchase loans was also moderate (between 5.1 and 10 percent) among Midwestern states (Minnesota, Wisconsin, Indiana, Ohio) as well as in West Virginia. Other moderate growth states include Idaho, Wyoming, Colorado, Nebraska, New Hampshire, Vermont, and Rhode Island. Three states, Alabama, Montana, and Connecticut experienced an annual growth rate in home purchase mortgages over 15 percent. The rest of the states had an annual growth rate between 10.1 and 15 percent.
30 While not shown on the map, Puerto Rico also had a negative growth rate of about 3.8 percent in home-purchase loans from 2019 to 2020. District of Columbia (DC)’s annual growth rate of home-purchase loans was 9.2 percent.
47
FIGURE 11: Annual Growth Rate of Closed-end Home-purchase Loan Originations by State
NOTE: Annual growth rate of closed-end home-purchase originations secured by site-built single-family homes from 2019 to 2020.
For refinance loans, all states saw more than 100 percent growth rate in 2020 compared to 2019, as shown in Figure 12.31 Two states, Nevada and Colorado, had an annual growth rate in refinance loans of less than 125 percent, while three states, North Dakota, South Dakota, and Virginia, more than tripled their total number of refinance loan originations in 2020 compared to 2019.
31 While not shown on the map, the annual growth rates of refinance loans for Puerto Rico and DC from 2019 to 2020 were about 103 percent and 180 percent respectively.

48
FIGURE 12: Annual Growth Rate of Closed-end Refinance Loan Originations by State
NOTE: Annual growth rate of closed-end refinance originations secured by site-built single-family homes from 2019 to 2020.
49
6. Lending institutions In 2020, 4,466 financial institutions reported closed-end applications and originations excluding reverse mortgages32 (Table 5A), down from 5,500 institutions in 2019. The decrease in the number of institutions reporting closed-end transactions is most likely driven by the increased reporting threshold that took effect in July 2020 due to the 2020 HMDA rule. As discussed in Section 2, the overall market volume of closed-end transactions excluding reverse mortgages, however, has increased from 13.0 million applications in 2019 to 20.9 million applications in 2020.
The financial institutions are broadly categorized into depository institutions (DIs) and non-depository institutions (non-DIs). Table 5A shows the number of DIs and non-DIs among the closed-end reporting institutions. DIs included 2,024 banks and thrifts (hereafter, banks) of which 1,366 were small (assets less than $1 billion), and 1,403 credit unions. Non-DIs included 77 mortgage companies affiliated with DIs and 962 independent mortgage companies.33
Among DIs, banks collectively originated most of the reported closed-end loans, whereas, among non-DIs, independent mortgage companies originated significantly more loans than mortgage companies affiliated with DIs. For example, banks collectively originated 3.8 million loans, accounting for 27.9 percent of all reported closed-end originations in 2020. Credit unions originated 1.1 million loans, accounting for only 7.9 percent. Independent mortgage companies originated 8.2 million loans, accounting for 60.4 percent of all reported loans, whereas affiliates of DIs originated only 518,000 loans or 3.8 percent.
In 2020, independent mortgage companies originated 60.7 percent (2.5 million divided by 4.1 million) of all closed-end (excluding reverse mortgage) first-lien, owner-occupied, site built, one-to-four-family, home-purchase loans. They also originated 63.1 percent (5 million divided by 7.8 million) of all first-lien, owner-occupied, one-to-four family site-built refinance loans. In contrast, in 2019, independent mortgage companies originated 56.4 of first-lien, owner-
32 Reverse mortgages can be structured as either close-end or open-end transactions. Tables 5a and 5b exclude reverse mortgages. There is no separate reporting threshold for reverse mortgages. 33 Data on bank assets were drawn from the Federal Deposit Insurance Corporation’s Reports of Condition and Income. The $1 billion threshold is based on the combined assets of all banks within a given banking organization. Fed. Fin. Inst. Examination Council, HMDA Data Publication, https://ffiec.cfpb.gov/data-publication/ (data from the HMDA Reporter Panel can be used to help identify the various types of institutions).

50
occupied, one-to-four-family, site-built, home-purchase loans and 58.1 percent of first-lien, owner-occupied, one-to-four family site-built refinance loans.34
Only a small percentage of institutions (17.7 percent, 792 out of 4,466) reported fewer than 100 closed-end originations in 2020, accounting for about 39,000 total originations or less than 0.3 percent of all originations. About 7 percent of institutions (199 out of 4,466), originated fewer than 25 loans, totaling just 2,200 originations.35
A number of differences exist between DIs and non-DIs with respect to the closed-end activity reported in 2020. First, DIs originated a significantly higher percentage of conventional loans than non-DIs. Second, smaller shares of loans originated by DIs went to minority borrowers, LMI borrowers, and in LMI neighborhoods than non-DIs. Third, non-DIs sold more of their originated loans compared to DIs. The HMDA data provide information on whether lenders sold originated loans within the same calendar year that they were originated, as well as the type of institution to which the lenders sold the loans, such as one of the GSEs or a banking institution.36 Table 5A shows that non-DIs sold almost all of their loans in the same calendar year that they originated them.
A distinct pattern emerges within a specific institution type. For example, among DIs, credit unions were the least likely to sell originated loans compared to banks. Small banks and large banks sold 85.7 percent and 72.9 percent, respectively, of their refinance loans within the same calendar year of the originations. In contrast, credit unions sold 44.3 percent of their refinance loans during the same period.
34 See “2019 Mortgage Market Activity and Trends,” available at https://www.consumerfinance.gov/data-research/research-reports/data-point-2019-mortgage-market-activity-and-trends/. 35 These results include all originated dwelling-secured, closed-end loans, excluding reverse mortgage for all reporters. Effective July 1, 2020, the reporting threshold of 100 closed-end originations applies to originations in each of the previous two years. 36 Because loan sales are recorded in the HMDA data only if the loans are originated and sold in the same calendar year, loans originated toward the end of the year are less likely to be reported as sold. For that reason, statistics on loan sales are computed using only loans originated during the first three quarters of the year.

51
TABLE 5A: LENDING ACTIVITIES BY INSTITUTION TYPES: CLOSED-END EXCLUDING REVERSE MORTGAGES
Type of institution(1)
Small bank
Large bank
Credit union
Affiliated mortgag
e company
Independent
mortgage company
All
Number of institutions 1,366 658 1,403 77 962 4,466
Applications (thousands) 972 4,763 1,795 776 12,642 20,948
Originations (thousands) 744 3,059 1,082 518 8,226 13,629
Purchases (thousands) 9 1,389 27 243 1,067 2,735
SIZE DISTRIBUTION Institutions with originations <25
Number of institutions 29 3 96 5 66 199
Originations (thousands) <1 <1 1.3 <1 <1 2.2
Institutions with 25 ≤ originations < 100 Number of institutions 188 33 315 1 56 593
Originations (thousands) 13 2 19 <1 3 37
Institutions with 100 ≤ originations < 1000 Number of institutions 1,024 289 750 24 311 2,398
Originations (thousands) 347 145 269 11 141 913
Institutions with 1000 ≤ originations Number of institutions 125 333 242 47 529 1,276
Originations (thousands) 383 2,912 793 506 8,082 12,676
Home-purchase loans(thousands)(2) 199 945 259 208 2,489 4,101
Conventional (percent) 76.7 83.1 89.2 59.5 58.7 67.2
LMI borrower (percent) (3) 32.4 26.1 28.7 30.8 31.9 30.4
LMI neighborhood (percent) (4) 13.9 13.8 15.1 14.3 17.4 16.1
Non-Hispanic White (percent) (5) 74.6 63.7 64.6 56.9 55.8 59.1
Minority borrower (percent) (5) 14.1 19.3 17.3 24.5 25.4 22.9
Sold (percent) (6) 77.9 69.9 49.3 98.5 94.5 85.1
Refinance loans (thousands)(2) 392 1,634 614 258 4,951 7,849
Conventional (percent) 88.8 94.7 97.0 76.8 75.3 81.7
LMI borrower (percent) (3) 18.5 17.4 21.9 17.1 19.2 18.9
LMI neighborhood (percent) (4) 8.6 9.5 12.0 11.3 12.7 11.7
Non-Hispanic White (percent) (5) 77.9 68.9 67.2 65.2 56.0 61.0
Minority borrower (percent) (5) 7.6 14.3 14.0 17.6 18.9 17.0
Sold (percent) (6) 85.7 72.9 44.3 99.3 96.2 86.4

52
(1) Small banks consist of those banks with assets (including the assets of all other banks in the same banking organization) of less than $1 billion at the end of 2020. Affiliated mortgage companies are nondepository mortgage companies owned by or affiliated with a banking organization or credit union. (2) Closed-end first-lien mortgages for site-built single-family, principal-residence homes. (3) See table 2, note 3. (4) See table 2, note 4. (5) See table 2, note 1. "Minority borrower" refers to non-white borrowers (excluding joint or missing) or Hispanic white applicants. (6) Excludes originations made in the last quarter of the year because the incidence of loan sales tends to decline for loans originated toward the end of the year, as lenders report a loan as sold only if the sale occurs within the same year as origination. SOURCE: FFIEC HMDA data; bank asset data drawn from Federal Deposit Insurance Corporation Reports of Condition and Income (https://www.fdic.gov).
In 2020, 938 financial institutions reported open-end applications and originations excluding reverse mortgages (Table 5B), very similar to 936 institutions in 2019. As discussed in Section 2, the overall market volume of open-end transactions excluding reverse mortgages decreased from 2.1 million applications in 2019 to nearly 1.7 million applications in 2020.
Open-end line of credit excluding reverse mortgages (HELOC) originations are dominated by DIs. In 2020, 792 DIs, including 268 banks, of which 44 were small (assets less than $1 billion), and 524 credit unions, originated in total 850,000 HELOCs reported under HMDA, accounting for 97.8% of all HELOC originations reported. Only 146 non-DIs, including 10 mortgage companies affiliated with DIs and 136 independent mortgage companies reported HELOC originations, accounting for 2.2% of the market. Only a very small percentage (3.7 percent) of HELOCs were sold to other institutions.

53
TABLE 5B: LENDING ACTIVITIES BY INSTITUTION TYPES: OPEN-END EXCLUDING REVERSE MORTGAGES
Type of institution(1)
Small bank
Large bank
Credit union
Affiliated mortgage company
Independent mortgage company
All
Number of institutions 44 224 524 10 136 938
Applications (thousands) 2 1,175 440 <1 38 1,655
Originations (thousands) 1 575 274 <1 19 869
Purchases (thousands) <1 4 3 <1 <1 7
SIZE DISTRIBUTION Institutions with originations < 100
Number of institutions 39 22 236 9 127 433
Originations (thousands) <1 <1 4 <1 <1 5
Institutions with 100 ≤ originations < 500
Number of institutions 5 25 97 1 3 131
Originations (thousands) <1 6 16 <1 <1 23
Institutions with 500 ≤ originations
Number of institutions <1 177 191 <1 6 374
Originations (thousands) <1 569 254 <1 18 841
LMI borrower (percent)(2) 17.7 19.3 18.8 18.5 16.5 19.1
LMI neighborhood (percent)(3) 8.4 10.1 12.1 6.5 13.5 10.8
Non-Hispanic White (percent)(4) 84.5 72.3 69.2 86.3 50.0 70.9
Minority borrower (percent)(4) 3.6 11.0 11.5 4.8 16.5 11.2
Sold (percent)(5) 0.8 0.7 4.9 1.7 89.2 3.7 (1) See table 5A, note 1. (2) See table 2, note 3. (3) See table 2, note 4. (4) See table 5A, note 5. (5) See table 5A, note 6.
Table 6A lists the top 25 closed-end reporting institutions by the total number of closed-end originations and their lending characteristics.37 With about 1.14 million originated loans,
37 Some institutions may be part of a larger organization; however, the data in Tables 6A and 6B are at the reporter level. Because affiliate activity has declined markedly since the housing boom in the mid-2000s, a top 25 list at the organization level is not likely to be significantly different from Tables 6A and 6B.
54
Quicken Loans continued to be the highest volume closed-end lender, with a market share of about 8.4 percent.38
Table 6B lists the top 25 HELOC reporting institutions by origination volume in 2020. In total, the top 25 HELOC reporters accounted for about 402,000 HELOC originations, or 46.2 percent, of all HELOC originations reported under HMDA in 2020. All but one of the top 25 HELOC lenders were DIs. The two largest HELOC reporters in 2020 were Bank of America and Truist Bank, accounting for 5.6 percent and 4.5 percent of all HELOC originations reported in 2020.
Table 6C lists the top 10 reverse mortgage lenders by origination volume in 2020.39 In total, the top 10 reverse mortgage lenders accounted for 39,649 reverse mortgage originations, or approximately 91.7 percent, of all reverse mortgage originations reported under HMDA in 2020. American Advisor Group was the largest reverse mortgage lender that reported HMDA data in 2020, accounting for approximately 35.0 percent of all reverse mortgage originations reported. It was followed by Finance of America Reverse LLC with an annual market share of 20.2 percent.
38 Notably, loan counts and market shares derived from the HMDA data can differ from some other industry sources, such as the market shares compiled by the Inside Mortgage Finance (https://www.insidemortgagefinance.com/). For HMDA reporting purposes, institutions report only mortgage applications for which they make the credit decision. Under HMDA, if an application was approved by a third party (such as a correspondent) rather than the lending institution, then that third party reports the loan as its own origination, and the lending institution reports the loan as a purchased loan. Alternatively, if a third party forwards an application to the lending institution for approval, then the lending institution reports the application under HMDA (and the third party does not report anything). In contrast, the Inside Mortgage Finance considers loans to have been originated by the acquiring institution even if a third party makes the credit decision. Thus, many of the larger lending organizations that work with sizable networks of correspondents report considerable volumes of purchased loans in the HMDA data, while the Inside Mortgage Finance considers many of these purchased loans to be originations. 39 Applicants generally do not need to provide income information when applying for reverse mortgage loans. Therefore, the values for applicant income of reverse mortgages in the HMDA data are mostly “Not Applicable” and we excluded the LMI borrower column in Table 6C.
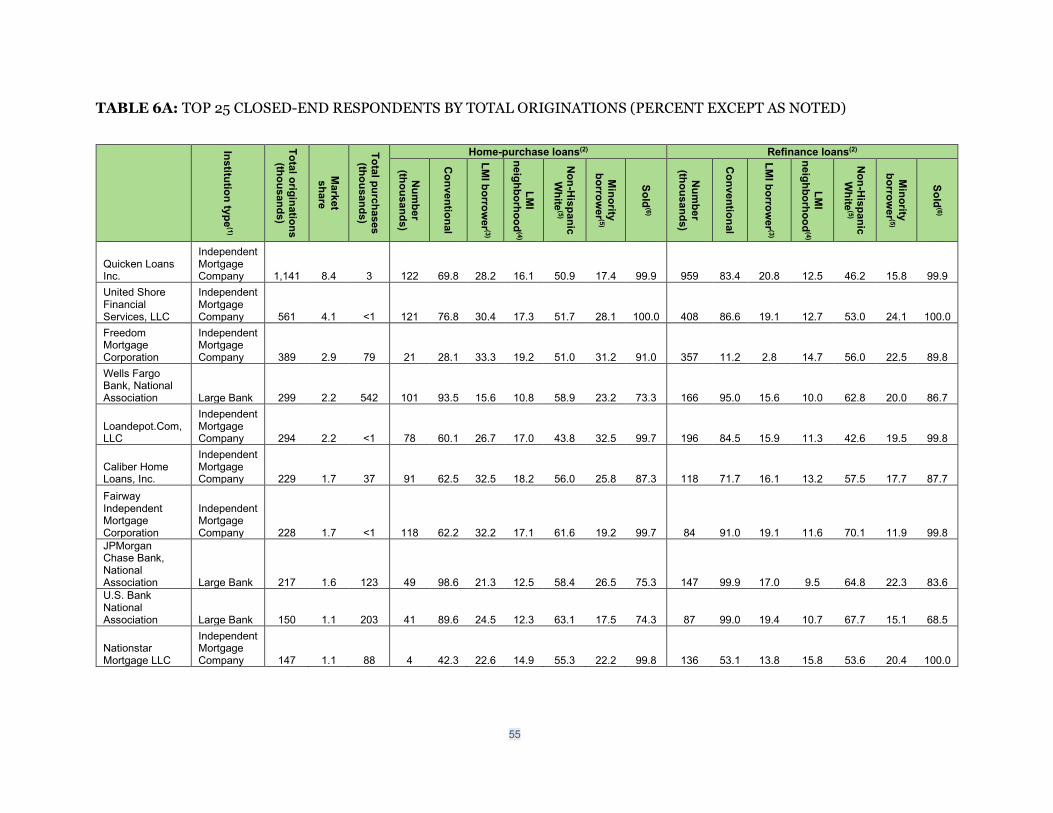
55
TABLE 6A: TOP 25 CLOSED-END RESPONDENTS BY TOTAL ORIGINATIONS (PERCENT EXCEPT AS NOTED)
Institution type(1)
Total originations (thousands)
Market
share
Total purchases (thousands)
Home-purchase loans(2) Refinance loans(2)
Num
ber (thousands)
Conventional
LMI borrow
er (3)
LMI
neighborhood(4)
Non-H
ispanic W
hite(5)
Minority
borrower (5)
Sold(6)
Num
ber (thousands)
Conventional
LMI borrow
er (3)
LMI
neighborhood(4)
Non-H
ispanic W
hite(5)
Minority
borrower (5)
Sold(6)
Quicken Loans Inc.
Independent Mortgage Company 1,141 8.4 3 122 69.8 28.2 16.1 50.9 17.4 99.9 959 83.4 20.8 12.5 46.2 15.8 99.9
United Shore Financial Services, LLC
Independent Mortgage Company 561 4.1 <1 121 76.8 30.4 17.3 51.7 28.1 100.0 408 86.6 19.1 12.7 53.0 24.1 100.0
Freedom Mortgage Corporation
Independent Mortgage Company 389 2.9 79 21 28.1 33.3 19.2 51.0 31.2 91.0 357 11.2 2.8 14.7 56.0 22.5 89.8
Wells Fargo Bank, National Association Large Bank 299 2.2 542 101 93.5 15.6 10.8 58.9 23.2 73.3 166 95.0 15.6 10.0 62.8 20.0 86.7
Loandepot.Com, LLC
Independent Mortgage Company 294 2.2 <1 78 60.1 26.7 17.0 43.8 32.5 99.7 196 84.5 15.9 11.3 42.6 19.5 99.8
Caliber Home Loans, Inc.
Independent Mortgage Company 229 1.7 37 91 62.5 32.5 18.2 56.0 25.8 87.3 118 71.7 16.1 13.2 57.5 17.7 87.7
Fairway Independent Mortgage Corporation
Independent Mortgage Company 228 1.7 <1 118 62.2 32.2 17.1 61.6 19.2 99.7 84 91.0 19.1 11.6 70.1 11.9 99.8
JPMorgan Chase Bank, National Association Large Bank 217 1.6 123 49 98.6 21.3 12.5 58.4 26.5 75.3 147 99.9 17.0 9.5 64.8 22.3 83.6 U.S. Bank National Association Large Bank 150 1.1 203 41 89.6 24.5 12.3 63.1 17.5 74.3 87 99.0 19.4 10.7 67.7 15.1 68.5
Nationstar Mortgage LLC
Independent Mortgage Company 147 1.1 88 4 42.3 22.6 14.9 55.3 22.2 99.8 136 53.1 13.8 15.8 53.6 20.4 100.0
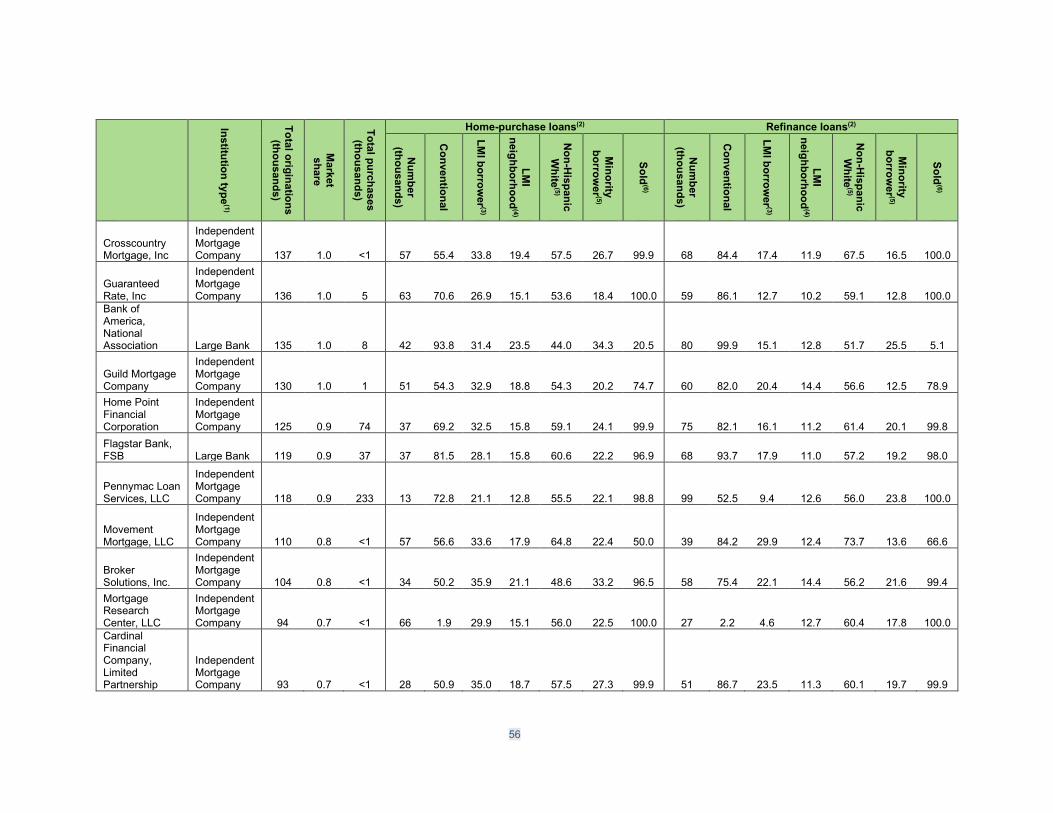
56
Institution type(1)
Total originations (thousands)
Market
share
Total purchases (thousands)
Home-purchase loans(2) Refinance loans(2)
Num
ber (thousands)
Conventional
LMI borrow
er (3)
LMI
neighborhood(4)
Non-H
ispanic W
hite(5)
Minority
borrower (5)
Sold(6)
Num
ber (thousands)
Conventional
LMI borrow
er (3)
LMI
neighborhood(4)
Non-H
ispanic W
hite(5)
Minority
borrower (5)
Sold(6)
Crosscountry Mortgage, Inc
Independent Mortgage Company 137 1.0 <1 57 55.4 33.8 19.4 57.5 26.7 99.9 68 84.4 17.4 11.9 67.5 16.5 100.0
Guaranteed Rate, Inc
Independent Mortgage Company 136 1.0 5 63 70.6 26.9 15.1 53.6 18.4 100.0 59 86.1 12.7 10.2 59.1 12.8 100.0
Bank of America, National Association Large Bank 135 1.0 8 42 93.8 31.4 23.5 44.0 34.3 20.5 80 99.9 15.1 12.8 51.7 25.5 5.1
Guild Mortgage Company
Independent Mortgage Company 130 1.0 1 51 54.3 32.9 18.8 54.3 20.2 74.7 60 82.0 20.4 14.4 56.6 12.5 78.9
Home Point Financial Corporation
Independent Mortgage Company 125 0.9 74 37 69.2 32.5 15.8 59.1 24.1 99.9 75 82.1 16.1 11.2 61.4 20.1 99.8
Flagstar Bank, FSB Large Bank 119 0.9 37 37 81.5 28.1 15.8 60.6 22.2 96.9 68 93.7 17.9 11.0 57.2 19.2 98.0
Pennymac Loan Services, LLC
Independent Mortgage Company 118 0.9 233 13 72.8 21.1 12.8 55.5 22.1 98.8 99 52.5 9.4 12.6 56.0 23.8 100.0
Movement Mortgage, LLC
Independent Mortgage Company 110 0.8 <1 57 56.6 33.6 17.9 64.8 22.4 50.0 39 84.2 29.9 12.4 73.7 13.6 66.6
Broker Solutions, Inc.
Independent Mortgage Company 104 0.8 <1 34 50.2 35.9 21.1 48.6 33.2 96.5 58 75.4 22.1 14.4 56.2 21.6 99.4
Mortgage Research Center, LLC
Independent Mortgage Company 94 0.7 <1 66 1.9 29.9 15.1 56.0 22.5 100.0 27 2.2 4.6 12.7 60.4 17.8 100.0
Cardinal Financial Company, Limited Partnership
Independent Mortgage Company 93 0.7 <1 28 50.9 35.0 18.7 57.5 27.3 99.9 51 86.7 23.5 11.3 60.1 19.7 99.9

57
Institution type(1)
Total originations (thousands)
Market
share
Total purchases (thousands)
Home-purchase loans(2) Refinance loans(2)
Num
ber (thousands)
Conventional
LMI borrow
er (3)
LMI
neighborhood(4)
Non-H
ispanic W
hite(5)
Minority borrow
er (5)
Sold(6)
Num
ber (thousands)
Conventional
LMI borrow
er (3)
LMI
neighborhood(4)
Non-H
ispanic W
hite(5)
Minority borrow
er (5)
Sold(6)
Finance of America Mortgage LLC
Independent Mortgage Company 87 0.6 <1 26 63.6 28.9 19.0 52.9 22.0 100.0 49 91.3 17.1 13.0 56.3 18.0 100.0
AmeriSave Mortgage Corporation
Independent Mortgage Company 87 0.6 <1 <1 68.6 17.8 13.9 46.6 14.5 100.0 81 89.6 17.8 10.9 40.0 12.2 100.0
Newrez LLC
Independent Mortgage Company 85 0.6 127 8 60.9 31.7 17.8 57.2 25.8 100.0 70 74.0 19.5 14.1 57.8 17.0 100.0
PrimeLending, A Plainscapital Company
Affiliated Mortgage Company 83 0.6 2 44 62.7 32.3 15.3 62.8 20.5 95.8 31 89.7 20.1 11.4 72.7 12.9 98.5
Top 25 institutions
… 5,297 1562 1310 66.0 29.0 16.5 55.5 23.9 88.9 4 76.0 16.7 12.5 54.0 18.8 93.0
All institutions … 13,629 2735 4101 67.2 30.4 16.1 59.1 22.9 85.1 7,849 81.7 18.9 11.7 61.0 17.0 86.4
(1) See table 5A, note 1. (2) Closed-end (excluding reverse mortgage) first-lien mortgages for site-built single-family, principal-residence homes. (3) See table 2, note 3. (4) See table 2, note 4. (5) See table 5A, note 5. (6) See table 5A, note 6. SOURCE: FFIEC HMDA data; bank asset data drawn from Federal Deposit Insurance Corporation Reports of Condition and Income (https://www.fdic.gov).
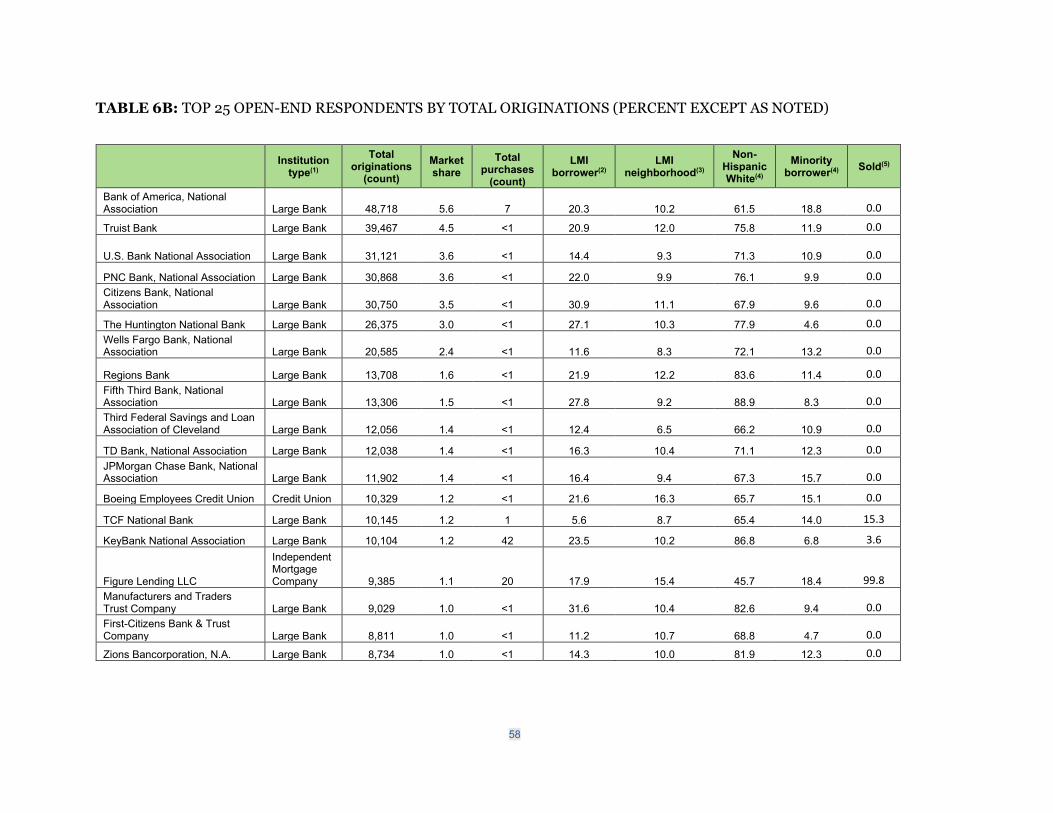
58
TABLE 6B: TOP 25 OPEN-END RESPONDENTS BY TOTAL ORIGINATIONS (PERCENT EXCEPT AS NOTED)
Institution type(1)
Total originations
(count) Market share
Total purchases
(count)
LMI borrower(2)
LMI neighborhood(3)
Non-Hispanic White(4)
Minority borrower(4) Sold(5)
Bank of America, National Association Large Bank 48,718 5.6 7 20.3 10.2 61.5 18.8 0.0 Truist Bank Large Bank 39,467 4.5 <1 20.9 12.0 75.8 11.9 0.0
U.S. Bank National Association Large Bank 31,121 3.6 <1 14.4 9.3 71.3 10.9 0.0
PNC Bank, National Association Large Bank 30,868 3.6 <1 22.0 9.9 76.1 9.9 0.0 Citizens Bank, National Association Large Bank 30,750 3.5 <1 30.9 11.1 67.9 9.6 0.0
The Huntington National Bank Large Bank 26,375 3.0 <1 27.1 10.3 77.9 4.6 0.0 Wells Fargo Bank, National Association Large Bank 20,585 2.4 <1 11.6 8.3 72.1 13.2 0.0
Regions Bank Large Bank 13,708 1.6 <1 21.9 12.2 83.6 11.4 0.0 Fifth Third Bank, National Association Large Bank 13,306 1.5 <1 27.8 9.2 88.9 8.3 0.0 Third Federal Savings and Loan Association of Cleveland Large Bank 12,056 1.4 <1 12.4 6.5 66.2 10.9 0.0
TD Bank, National Association Large Bank 12,038 1.4 <1 16.3 10.4 71.1 12.3 0.0 JPMorgan Chase Bank, National Association Large Bank 11,902 1.4 <1 16.4 9.4 67.3 15.7 0.0
Boeing Employees Credit Union Credit Union 10,329 1.2 <1 21.6 16.3 65.7 15.1 0.0
TCF National Bank Large Bank 10,145 1.2 1 5.6 8.7 65.4 14.0 15.3
KeyBank National Association Large Bank 10,104 1.2 42 23.5 10.2 86.8 6.8 3.6
Figure Lending LLC
Independent Mortgage Company 9,385 1.1 20 17.9 15.4 45.7 18.4 99.8
Manufacturers and Traders Trust Company Large Bank 9,029 1.0 <1 31.6 10.4 82.6 9.4 0.0 First-Citizens Bank & Trust Company Large Bank 8,811 1.0 <1 11.2 10.7 68.8 4.7 0.0 Zions Bancorporation, N.A. Large Bank 8,734 1.0 <1 14.3 10.0 81.9 12.3 0.0
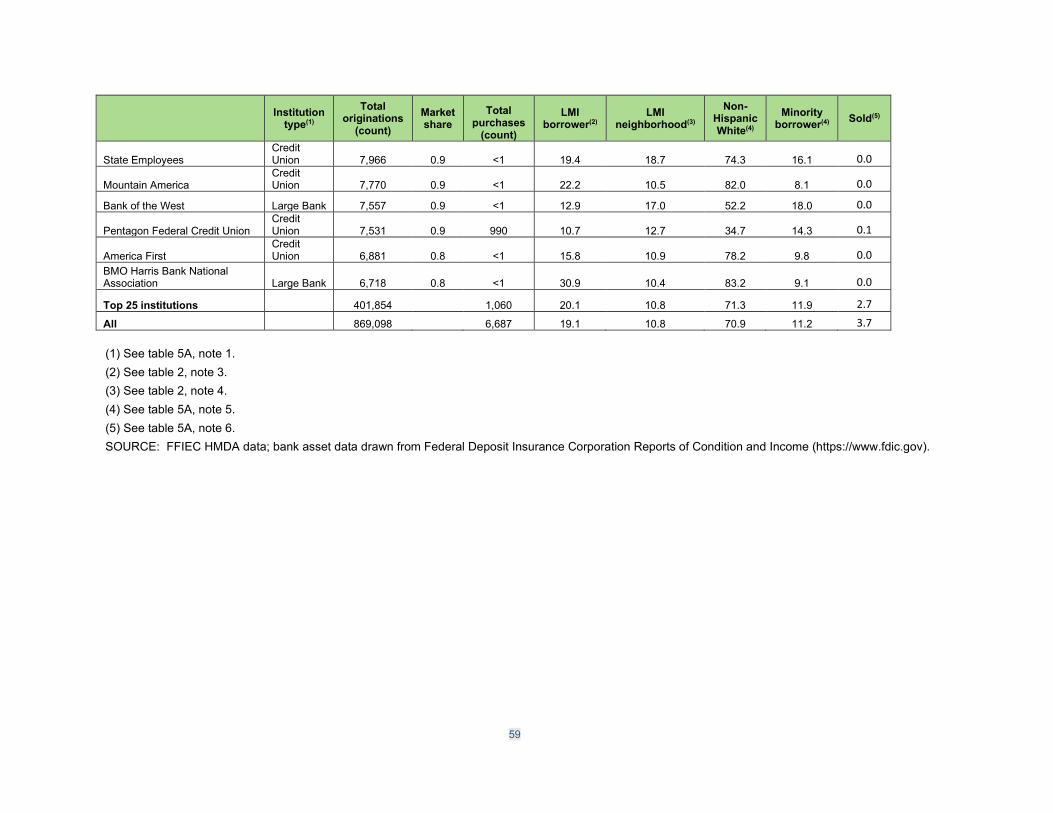
59
Institution type(1)
Total originations
(count) Market share
Total purchases
(count)
LMI borrower(2)
LMI neighborhood(3)
Non-Hispanic White(4)
Minority borrower(4) Sold(5)
State Employees Credit Union 7,966 0.9 <1 19.4 18.7 74.3 16.1 0.0
Mountain America Credit Union 7,770 0.9 <1 22.2 10.5 82.0 8.1 0.0
Bank of the West Large Bank 7,557 0.9 <1 12.9 17.0 52.2 18.0 0.0
Pentagon Federal Credit Union Credit Union 7,531 0.9 990 10.7 12.7 34.7 14.3 0.1
America First Credit Union 6,881 0.8 <1 15.8 10.9 78.2 9.8 0.0
BMO Harris Bank National Association Large Bank 6,718 0.8 <1 30.9 10.4 83.2 9.1 0.0
Top 25 institutions 401,854 1,060 20.1 10.8 71.3 11.9 2.7
All 869,098 6,687 19.1 10.8 70.9 11.2 3.7 (1) See table 5A, note 1. (2) See table 2, note 3. (3) See table 2, note 4. (4) See table 5A, note 5. (5) See table 5A, note 6. SOURCE: FFIEC HMDA data; bank asset data drawn from Federal Deposit Insurance Corporation Reports of Condition and Income (https://www.fdic.gov).

60
TABLE 6C: TOP 10 REVERSE MORTGAGE RESPONDENTS BY TOTAL ORIGINATIONS (PERCENT EXCEPT AS NOTED)
Institution type(1)
Total originati
ons (count)
Market share
Total purchases
(count) LMI
neighborhood(2)
Non-Hispanic White(3)
Minority borrower(3) Sold(4)
American Advisers Group
Independent Mortgage Company 15,112 35.0 1,967 19.5 69.1 10.3 100.0
Finance of America Reverse LLC
Independent Mortgage Company 8,741 20.2 1,109 17.5 67.9 13.6 99.3
Reverse Mortgage Funding LLC
Independent Mortgage Company 4,587 10.6 1,832 14.9 73.9 9.6 100.0
Mutual of Omaha Mortgage, Inc
Affiliated Mortgage Company 2,684 6.2 20 16.7 83.4 10.0 100.0
PHH Mortgage Corporation
Independent Mortgage Company 2,651 6.1 2,117 22.6 71.5 17.5 100.0
Longbridge Financial, LLC
Independent Mortgage Company 1,999 4.6 4,569 15.7 83.9 12.5 100.0
Open Mortgage, LLC
Independent Mortgage Company 1,807 4.2 <1 26.8 59.2 24.2 72.7
HighTechLending Inc
Independent Mortgage Company 891 2.1 <1 21.0 68.7 22.8 95.3
Liberty Home Equity Solutions, INC.
Independent Mortgage Company 625 1.5 275 24.8 71.2 18.2 100.0
All Reverse Mortgage, INC.
Independent Mortgage Company 552 1.3 <1 13.9 86.4 10.0 99.2
Top 10 institutions ... 39,649 11,889 18.7 71.1 12.6 98.6
All institutions ... 43,225 14,446 18.6 71.7 12.7 97.6 (1) See table 5A, note 1. (2) See table 2, note 4. (3) See table 5A, note 5. (4) See table 5A, note 6. SOURCE: FFIEC HMDA data; bank asset data drawn from Federal Deposit Insurance Corporation Reports of Condition and Income (https://www.fdic.gov)

61
7. Conclusion The 2020 HMDA data are the third year of data that reflect changes implemented by the 2015 HMDA rule. The 2015 HMDA rule made changes to institution and transaction reporting criteria and revised the data points that institutions covered under HMDA must report.
The number of financial institutions reporting 2020 HMDA data declined compared to 2019, most likely due to the change in the closed-end reporting threshold. Despite the drop in the number of reporters, the total number of closed-end originations, as well as applications, increased substantially between 2019 and 2020, which was mostly driven by the refinance boom. The refinance boom observed in 2020 continued the trends that began in the second quarter of 2019. The overall volume of home-purchase and refinance loans increased for all racial/ethnic groups. Relatively speaking, Black borrowers increased their share of closed-end home-purchase loans in 2020 while Asian borrowers increased their share of refinance loans. Black and Hispanic white borrowers continued to have lower median loan amounts, lower median credit scores, paid higher median interest rates and total loan costs, and were more likely to be denied than non-Hispanic white and Asian borrowers. The share of home-purchase originations and applications by non-DIs were higher in 2020 than in 2019.