data mining techniques for analyzing mhd fluctuation data from toroidal fusion plasmas ) b.d....
Post on 19-Dec-2015
214 views
TRANSCRIPT

Data mining techniques for analyzing MHD fluctuation data from
toroidal fusion plasmas
)
B.D. Blackwell , D.G. Pretty , S. Yamamoto , K. Nagasaki , E. Ascasibar , R. Jimenez-Gomez , S. Sakakibara , F. Detering
Boyd Blackwell, Australia-Korea Foundation mission to KSTAR, 2010
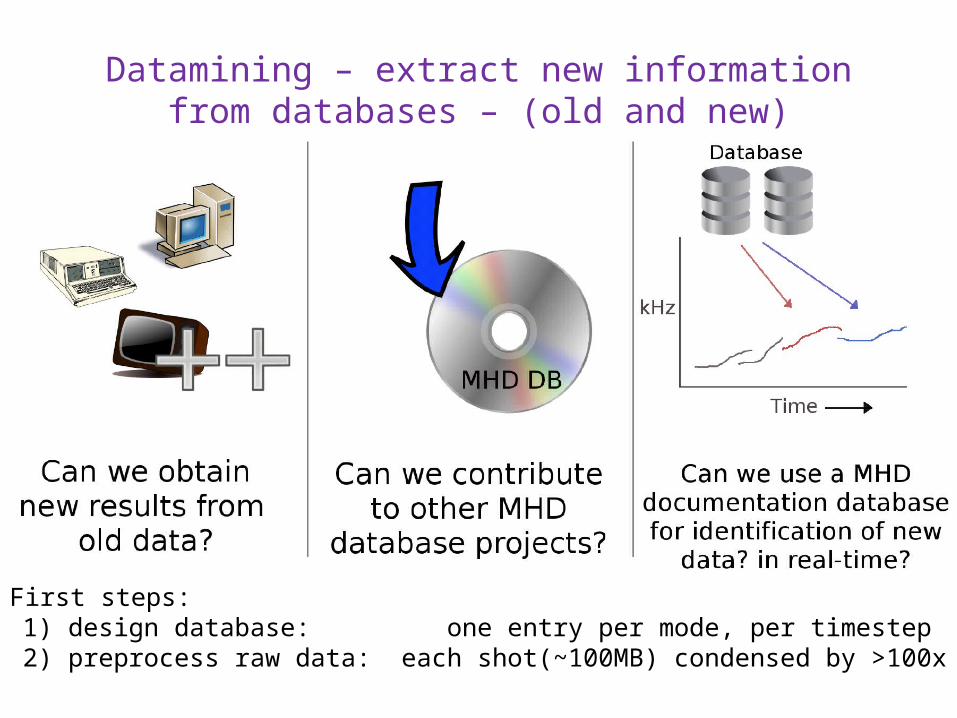
Datamining – extract new information from databases – (old and new)
First steps: 1) design database: one entry per mode, per timestep2) preprocess raw data: each shot(~100MB) condensed by >100x
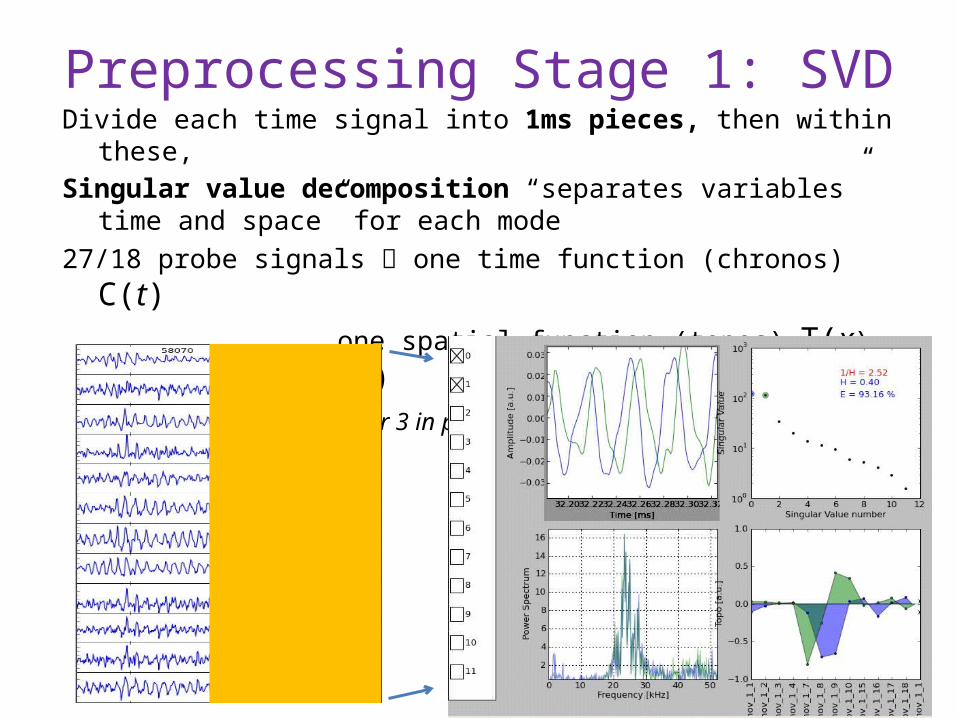
Preprocessing Stage 1: SVDDivide each time signal into 1ms pieces, then within these, Singular value decomposition “separates variables” time and space” for each
mode
27/18 probe signals one time function (chronos) C(t) one spatial function (topos) T(x) Fmode
= C(t) T(x) per mode (actually 2 or 3 in practice, sin-like and cos-like, travelling wave)
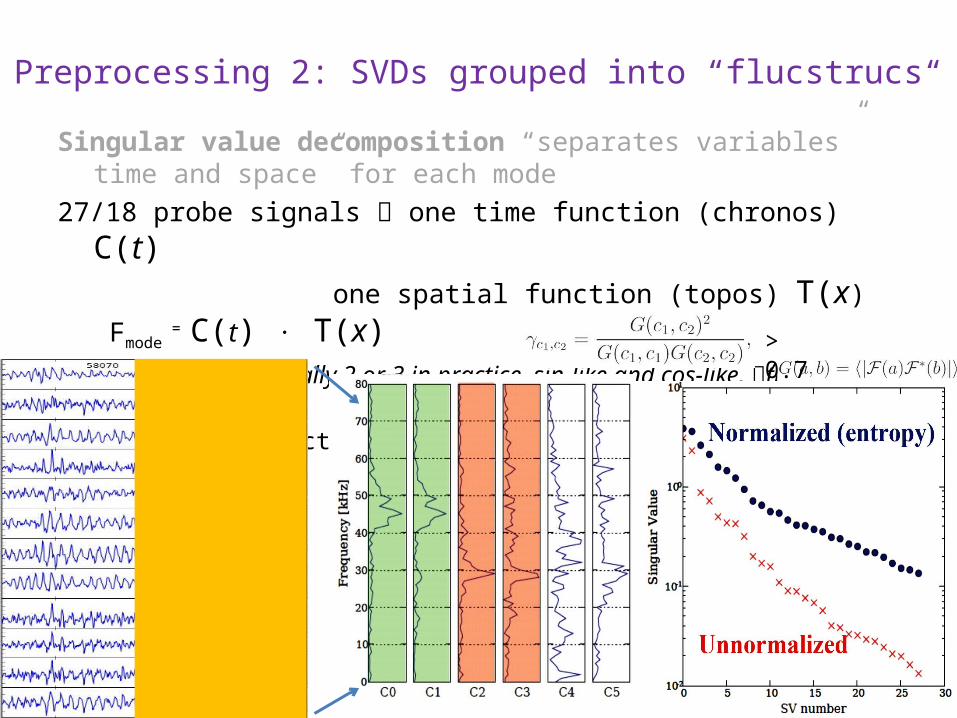
Preprocessing 2: SVDs grouped into “flucstrucs“Singular value decomposition “separates variables” time and space” for each
mode
27/18 probe signals one time function (chronos) C(t) one spatial function (topos) T(x) Fmode
= C(t) T(x) per mode (actually 2 or 3 in practice, sin-like and cos-like, travelling wave)
Group Singular Vectors with matching spectra> 0.7

Blackwell, ISHW/Toki Conference 10/2007
Data Mining Classification by Clustering
Full dataset
Cluster in delta-phase
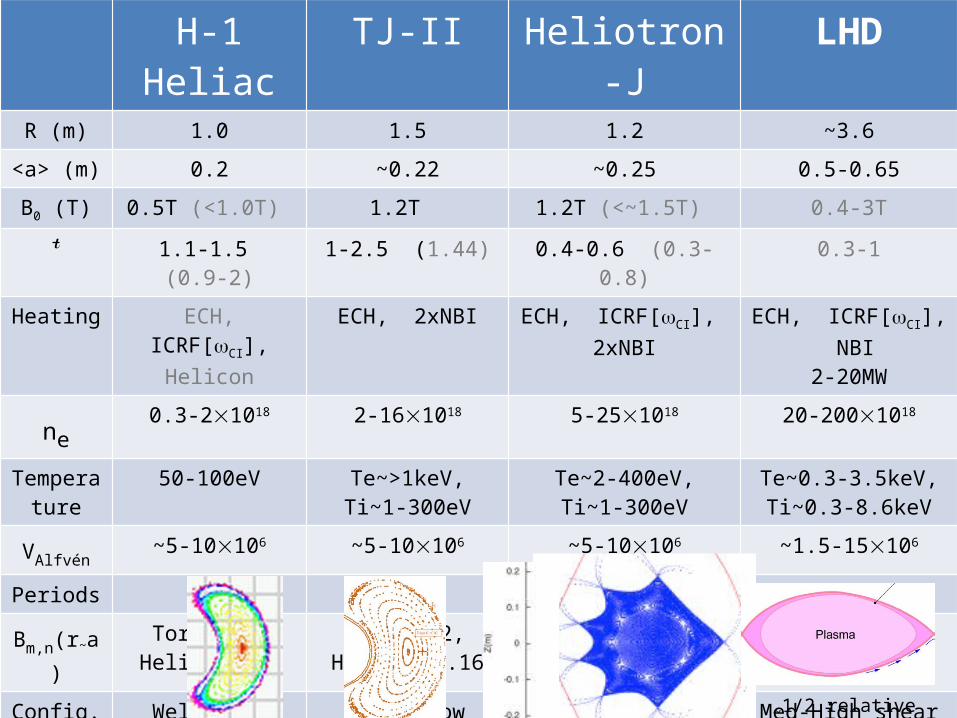
H-1 Heliac TJ-II Heliotron-J LHDR (m) 1.0 1.5 1.2 ~3.6
<a> (m) 0.2 ~0.22 ~0.25 0.5-0.65
B0 (T) 0.5T (<1.0T) 1.2T 1.2T (<~1.5T) 0.4-3T
1.1-1.5 (0.9-2) 1-2.5 (1.44) 0.4-0.6 (0.3-0.8) 0.3-1
Heating ECH, ICRF[CI], Helicon
ECH, 2xNBI ECH, ICRF[CI], 2xNBI ECH, ICRF[CI], NBI2-20MW
ne0.3-21018 2-161018 5-251018 20-2001018
Temperature
50-100eV Te~>1keV,Ti~1-300eV
Te~2-400eV,Ti~1-300eV
Te~0.3-3.5keV,Ti~0.3-8.6keV
VAlfvén~5-10106 ~5-10106 ~5-10106 ~1.5-15106
Periods 3 4 4 m=10/l=2
Bm,n(r~a) Tor. 0.2, Helical 0.2 Tor 0.12, Helical 0.16 Tor 0.15, Helical 0.2 Tor 0.11, Helical 0.1
Config. Well, Low shear Well, Low shear V. Low shear Med-High shear
Features Hi-res ne profileFine configuration scan
Flexible configurationNBI and ECH
Variable bumpinessRF, NBI fast ions
Highest power, long pulse
~1/2 relative scale

Blackwell, KSTAR_ 2010
H-1: Identification with Alfvén Eigenmodes: ne• Coherent mode near iota = 1.4, 26-60kHz,
Alfvénic scaling with ne• m number resolved by bean array of Mirnov
coils to be 2 or 3.
• VAlfvén = B/(o) B/ne
• Scaling in ne in time (right) andover various discharges (below)
phase
1/ne
ne
f 1/ne
Critical issue in fusion reactors:
VAlfvén ~ fusion alpha velocity fusion driven instability!

H-1: Alfvén eigenmode “Zoo” 43210
3210

Overall fit assuming radial location
Better fit of frequency to iota, ne obtained if the location of resonance is assumed be either at the zero shear radius, or at an outer radius if the associated resonance is not present.
Assumed mode location
~ 5/4

Heliotron J: Poloidal Modes from m=-4 to 4
Clusters – Freq. vs time Corresponding phase variation
Data set of > 2,000 shots, including both directions of B0

TJII: Alfvénic/Non Alfvénic Scalings distinguished by Kullback-Leibler divergence
AlfvenicNon-Alfvenic

LHD: spectra complex, huge data volume
0 1 2 (sec) 3 4 5 6
0 Toroidal angle 5 rad
N=2
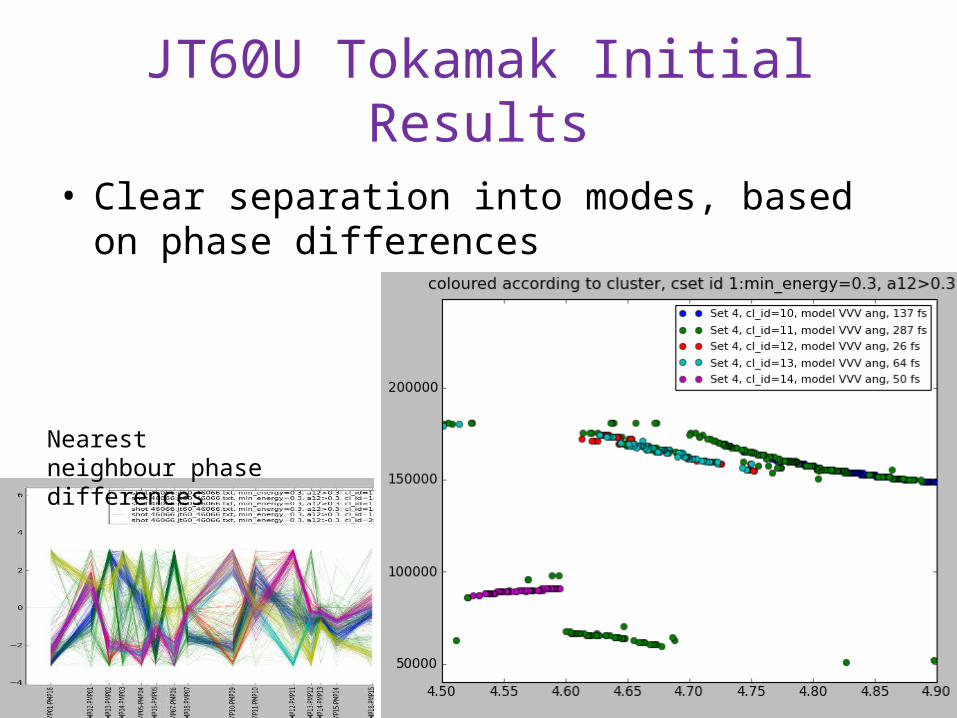
JT60U Tokamak Initial Results
• Clear separation into modes, based on phase differences
Nearest neighbour phase differences

Real Time Mode Identification• Identify by cluster probability density functions • Multivariate nature produces huge range in valuesSolution: modes are represented as multivariate von Mises distributions
-trivially compute the likelihood of any new data being of a certain type of documented mode.
H-1 application:Mode is clearly separated
from the rest
LHD
b)
a)
c)
Dashed Line is max likelihood mode before transition, solid line after

Conclusions/Future WorkDiscovery of new information • promising, but needs either very high quality of data, or human intervention (ideally both!)
Real time identification • Works well using Von Mises distribution to reduce problems in probability density function
Incorporation into IEA Stellarator CWGM MHD database• Needs further reduction to be most useful – several methods
– Store cluster statistics for a concise overview– Store more complete data for some “canonical” shots– Develop importance criteria – relationship to transitions, confinement loss
Time dependence important! – (Detering, Blackwell, Hegland, Pretty)
Currently adding W7-AS data – Tokamak data - JT60U - others?See D. Pretty, B. Blackwell, A data mining algorithm for automated characterisation of
fluctuations in multichannel timeseries.” Comput. Phys. Commun., 2009. [ Open source python code “PYFUSION” http://pyfusion.googlecode.com ]Supported an Australian Research Council grant and Kyoto University Visiting Professorship