data matters - doi.gov · northern mariana islands and puerto rico (u. s. terri - tories)....
TRANSCRIPT

DATA MATTERSInforming the Eradication ofInvasive Species on Islands
north america and the arctic region

May 2018
contributorsDena Spatz, Nick Holmes, Heath Packard, Gregg Howald, Chad Hanson, & Island Conservation Staff
Report by Island Conservation for the National Invasive Species Council SecretariatDeliverable for contract number d17px00181
Recommended citation: Island Conservation (2018) Data matters: informing the eradication of invasive species on islands: North America and the Arctic region. Contractor’s Report 2018-1. National Invasive Species Council Secretariat, Washington, DC
Cover photo credits:Puffin (left): Flickr/RoryCB| Black-legged kittiwake: Josh Keaton, NOAA/NMFS/AKRO/SFD | Murre: Josh Kea-ton, NOAA/NMFS/AKRO/SFD |Shipping vessel: Jamie K. Reaser, NISC | Brown rat: Flickr/Jean-Jacques Boujot
DATA MATTERSInforming the Eradication ofInvasive Species on Islands
north america and the arctic region
Version: May 22, 2018

3
Introduced, invasive (harmful) species are a key threat to native species on islands in North America and the Arctic. For many islands in these
regions, conservation action is possible, including the eradication of invasive vertebrates to stop harmful impacts to, and aid recovery of, threatened native spe-cies and habitats. Effective conservation prioritization and planning for such actions is limited by a lack of island-specific data on native and invasive species, as well as interoperability of existing datasets to make existing data uniformly comparable. To improve the knowledge base for well-informed decision-making, Island Conservation was contracted by the National Invasive Species Council (nisc) Secretariat to help advance the 2016–2018 nisc Management Plan Actions 2.5, 2.6, and 3.2. To this end we 1) summarized base-line data available on native and invasive vertebrates on islands in the North American and Arctic regions, identified data gaps and suggested strategies to over-come data limitations (data mobilization campaign), 2) described and applied a prioritization schema to identify potential island conservation action priorities in these regions based on globally threatened species (a prioritization tool), and 3) described a step-wise pro-cess for advancing a prioritized island to eradication, confirming of success, and documenting recovery (a roadmap for action).
For each task, we summarize our main findings and provide recommendations that emerge from the nar-ratives. The recommendations are intended for nisc members and other U. S. island decision-makers intent on guiding strategies and actions for the eradication of invasive species from U. S. islands.
Executive Summary

4
transcribe information from descriptive supporting documents (e.g. technical reports) and consult with experts to fill data gaps.
2) Prioritization Tool Summary: A wide range of resources and case studies are available in the literature to guide prioritization in conservation decision-mak-ing. For North America and the Arctic, an effective prioritization strategy will need to take into consider-ation stakeholder priorities for establishing a problem statement, and data availability and gaps as outlined in Section 2. In applying a simplified version of a priori-tization tool based on data available from the Threat-ened Island Biodiversity Database (tib), we found 40 islands in North America where one or more invasive terrestrial mammals were confirmed or suspected as present and potentially feasible to eradicate given pre-vious eradication successes. These islands were in the U. S. and Mexico, with top priorities identified in the Northern Mariana Islands and Puerto Rico (U. S. terri-tories). Canada’s islands were largely missing from this effort due to the few species in Canada listed as globally threatened by the International Union of the Conserva-tion of Nature (iucn) Red List of Threatened Species. This preliminary effort identifying 40 priority islands can serve as a starting point for enhancing dialogue with stakeholders to 1) define agreed-upon problem statements and 2) establish data-sharing agreements that are appropriate for the U. S. and ultimately a North American scale prioritization of islands for invasive species eradications that will protect island species and ecosystems. Similar steps can be followed to prioritize islands in the Arctic for invasive species eradications. While our preliminary prioritization effort identified five priority islands for invasive vertebrate eradications, they all fell under U. S. jurisdiction: Amak, Kagalaska, Koniuji, Unalga (Aleutians, Alaska) and Naked Island (Prince William Sound, Alaska) and are not represen-tative of the entire Arctic region. Stakeholder engage-ment will be especially critical in this region.
Recommendation: Two of the critical primary data-sets recommended in Section 2 can also be used for priority setting within the United States. Of these datasets, one includes a priority island list established in 2009 by the U. S. Fish and Wildlife Service, which identifies 85 priority islands for protecting nationally threatened species. The second dataset is the tib, from
1) Data Mobilization Summary: We evaluated 95 and 70 resources with data that were applicable to North American and Arctic islands, respectively. Of these, 10 and 9 datasets contained important baseline data on species occurrences and met criteria for ready mobili-zation into an interoperable North America or Arctic data system. In addition to these, we identified 15 and 18 supporting resources which may prove critical to supporting the enhancement of an islands dataset that could be used for conservation decision-making. These resources include invasive species taxonomy, native species threat status, national priorities, and island lo-cations. Within North America, the majority of island occurrence records were available for the west coast and Alaska, with birds being the most common taxon documented. Within the Arctic, the archipelagos of the Aleutian and Bering Sea islands (Alaska, U. S.) and Svalbard (Norway) contained the most island-explic-it occurrence records. Birds were the most common taxon documented, with distribution of common na-tive mammal species also available. Geographic and subject-based data gaps for island explicit occurrences and designations of invasive species presence/absence were evident throughout both regions, but more so in the Arctic. Further, several barriers prevent interop-erability of current datasets, including differences in spatial metadata and core standards (e.g., distinguishing between native and non-native species), which would define common taxonomic and data field definitions.
Recommendation: Effective planning for island res-toration in the U. S. is limited by island specific data available on native and invasive species, and the in-teroperability of existing datasets to make data uni-formly comparable. Next steps and recommendations for nisc members to consider are to help 1) engage appropriate stakeholders first within the U. S., and ul-timately for the North American and Arctic regions, to identify key conservation goals and purposes for any an inter-operable data system; 2) follow a data management schema to guide development of an is-lands dataset and subsequent data portal including the creation of a data management plan, memoranda of understanding (mou) with data providers, dataset and portal structure, and metadata; 3) build interoperabil-ity between those critical datasets identified allowing integration into a central dataset and subsequent data portal, including island characteristic datasets; and, 4)

5
which we were able to identify 31 islands within the U. S. that contained globally threatened species. These lists can serve as springboards for refining priorities and eventually turning the priority-setting activity into eradication action. Next steps and recommendations for nisc members are to 1) help establish a unifying problem statement among key island stakeholders to aid in the development of a U. S. islands dataset and to establish the underlying priorities, which would guide a prioritization effort, 2) help determine which institution is best positioned to develop, house, and maintain these decision-making tools and grant them the mandate and permission to proceed, 3) lead the communications among the groups and stakeholders, and 4) fund the data mobilization and data-based de-cision-making tool development.
3) Roadmap to Action Summary: We present a roadmap for planning and implementing eradication of invasive vertebrates based on four major phases of an island invasive eradication project lifecycle adapted and practiced by Island Conservation and partners. This roadmap outlines common language, principles, and strategies used by island restoration practitioners, including cultural, social, political, economic, and bi-ological considerations for such projects. To illustrate the utility of the roadmap, we provide an example for the eradication of invasive rodents from Kiska Island in the Aleutian Archipelago, an important island rep-resentative to the U. S. and North American and Arctic regions. In the example of Kiska, we make broad pre-sumptions on actions that could be taken to complete each of the phases of the roadmap, yet these are not intended to be the actual steps to reach eradication success. In practice, each phase will require careful con-sideration and shared decision-making by all parties.
Though hundreds of successful eradication and restoration projects have taken place in North Amer-ica, these island conservation interventions are not keeping up with the rate of native species declines that are linked to impacts from invasive species. The scale, scope, and pace of island restoration activities must increase dramatically if we want to secure these achievable conservation outcomes. Here we outline three key barriers to island restoration projects as well as recommendations that nisc members could act on to help overcome barriers to invasive species removal, thereby increasing the scope, scale, and pace of island invasive species eradications in the U. S.
Recommendation: Three main factors limit the scope, scale, and pace of island invasive species eradications in the U. S. 1) Planning is time consuming and entails costly regulatory compliance requirements, 2) there is insufficient funding, and 3) there is insufficient capacity to support increased project throughput.
Given these barriers, we recommend the following steps: 1) pursue equally protective National Environ-mental Policy Act (nepa) (and state equivalent) effi-ciencies through either a Programmatic Environmental Impact Statement (peis) or Categorical Exclusions for common island restoration activities, such as in-vasive rodent eradications, rodent “spills,” feral cat eradications, and invasive ungulate eradications. We also recommend documenting and evaluating other permitting requirements in U. S. and other jurisdictions, identifying those that are duplicative/inefficient and streamlining the most cumbersome, 2) secure increased funding commitments from ngos, philanthropists, business, and government to implement island erad-ication, biosecurity, and restoration activities, and 3) expand and fund government staff dedicated to sup-porting island restoration public-private partnerships at eco-regional, national, and regional scales.

6
Contents1 Introduction 8
2 Data Strategy and Implementation Plan for North America and the Arctic: Data Mobilization Campaign 10
2.1 Summary of the Data Inventory 142.2 Summary of Data Gaps 182.2.1 Data Processing Barriers Limiting Interoperability of Critical Primary Datasets 212.2.2 Data Mobilization Barriers 212.2.3 Geographic-based Knowledge Gaps 222.2.4 Subject-based Gaps 222.3 Strategy for Filling Gaps 232.3.1 Data Management Schema 272.3.2 Mobilization of the Data 272.3.3 Filling Additional Knowledge Gaps: Engagement with Content Experts 322.4 Summary 332.5 Recommendations for U. S. Island Decision-Makers 33
3 A Prioritization Tool for Islands 343.1 Summary of Previous Prioritizations 353.2 Designing a Prioritization Schema 373.3 Potential Problem Statements for North America and the Arctic 373.3.1 North American Islands 393.3.2 Arctic Islands 403.4 Applying the Schema 413.4.1 Methods 413.4.2 Results 423.5 Summary 443.6 Recommendations for U. S. Island Decision-Makers 46
4 Advancing Eradication of Invasive Vertebrates on North American and Arctic Islands: Roadmap for Action 47
4.1 Phase I – Project Identification & Enabling Partnerships 484.2 Phase II – Project Planning 544.3 Simultaneous Project Planning Activities 594.4 Phase III – Project Implementation 634.5 Phase IV – Wrap-up 664.6 Summary 674.7 Recommendations for U. S. Island Decision-Makers 67
5 Acronyms 69
6 Acknowledgements 70
7 References 71

7
AppendicesAppendices are available upon request. Please contact [email protected].
Appendix 1 Strategic Planning Tables and Additional Updates to the Final Report TextAppendix 2 Inventory of Island Resources and MetadataAppendix 3 Trilateral Meeting NotesAppendix 4 Survey for Data Mobilization for North America and Arctic ProjectsAppendix 5 Critical Primary Occurrence DatasetsAppendix 6 Example tib Threatened Island Biodiversity (tib) Data DefinitionsAppendix 7 Prioritization Criteria ConsideredAppendix 8 Prioritization SchemaAppendix 9 Island Area and Human Population Size for Previously Successful, Planned or Underway Invasive
Mammal EradicationsAppendix 10 Islands from the Threatened Island Biodiversity Database Used in the PrioritizationAppendix 11 Island Restoration & Invasive Species Eradication Practitioner ResourcesAppendix 12 Potential Permitting/Compliance requirements for a hypothetical invasive rodent eradication on a
refuge islandMaps Appendix Maps showing examples of data availability, scope, and scale for primary datasets
Glossary*
Alien species With respect to a particular ecosystem, any species, including its seeds, eggs, spores, or other biological material capable of propagating that species, that is not native to that ecosystem (synonymous with non-native species).
Biological invasion The process by which non-native species breach biogeographical barriers and extend their range.
Control Containing, suppressing, or reducing populations of invasive species.
Eradication The removal or destruction of an entire population of invasive species.
Introduction As a result of human activity, the intentional or unintentional escape, release, dissemination, or placement of an organism into an ecosystem in which it is not native.
Invasive species With regard to a particular ecosystem, a non-native organism whose introduction causes or is likely to cause economic or environmental harm, or harm to human, animal, or plant health (synonymous with invasive alien species).
Native species With respect to a particular ecosystem, a species that, other than as a result of an introduction, historically occurred or currently occurs in that ecosystem.
Non-native species See Alien species.
Prevention The action of stopping invasive species from being introduced or spreading into a new ecosystem.
* All terms cited are defined within Executive Order 13751 of December 5, 2016

8
An invasive species is a non-native organism whose introduction causes or is likely to cause economic or environmental harm, or harm
to human, animal, or plant health (National Invasive Species Council 2016). Invasive species are particularly harmful to native species on islands. Invasive species prevention, control, and eradication efforts on islands are, therefore, important management actions (Reaser et al. 2007; Russell et al. 2017). Islands are a major fea-ture of North American and Arctic geographies. Within North America – U. S., Mexico, and Canada – islands are home to significant biodiversity values under threat by invasive species (e.g. Spatz et al. 2017). This has been recognized most notably by Mexico who seeks to make all Mexican islands invasive-mammal free by the year 2025 (Aguirre-Muñoz et al. 2011). Invasive species rep-resent a significant threat to Arctic islands and eco-systems due to projected changes in climate as well as associated anthropogenic developments on the islands, including resource extraction, settlement, and tourism (Reaser et al. in submission).
Eradication of invasive vertebrates, primarily mam-mals, has been undertaken on hundreds of islands worldwide (Veitch et al. 2011), and is proven to be a powerful strategy to protect native species and enable further restoration actions ( Jones et al. 2016). Such actions require a significant commitment of resources and time, hence the importance of prioritizing islands for restoration before any management action is taken (Margules and Pressey 2000). Effective conservation planning has been hampered by a lack of consolidated and consistent island specific information about native species distribution and where they are at risk from invasive vertebrates (Spatz et al. 2017) – data that are necessary to guide conservation actions ( Joppa et al. 2016). The data on native or invasive species that do exist were created to meet different goals and objectives and are disparately distributed among various infor-mation systems, websites, and descriptive documents. Thus, there is a need for a centralized system where data
1. Introduction

9
can be collated and information can be made accessible and comparable for managers requiring support with decision-making (National Invasive Species Council 2018).
Island Conservation was contracted by the National Invasive Species Council (nisc) Secretariat to assist work undertaken at regional scales, including North America and the Arctic. The 2016–2018 nisc Manage-ment Plan (National Invasive Species Council 2016) identifies the following actions:
Action 2.5.3: Further collaborate on addressing in-vasive species in North America. Establish a trilat-eral working group to explore the development of a joint Strategy and Action Plan identifying key areas for collaboration, including under the Commission for Environmental Cooperation (cec), and to ini-tiate a survey of existing transboundary invasive species projects and initiatives.
Action 2.6: Under the auspices of the Arctic Coun-cil’s Conservation of Arctic Flora and Fauna (caff) Invasive Species Working Group, work with inter-national partners to develop a strategy and action plan for the prevention and management of invasive species across the Arctic region.
This report aims to advance these priority actions by addressing the collation and evaluation of data rel-evant to invasive vertebrates on North American and Arctic islands that host threatened native species. The outcomes of this project will be used to inform priori-tization of future work under a North American Invasive Alien Species Strategy and Working Plan and the Arctic Invasive Alien Species (arias) Strategy and Action Plan (caff and pame 2017):
Action 3.2: Actively facilitate the eradication of in-vasive alien species from island ecosystems through-out the Arctic as well as the recovery of native island species and habitats that have been impacted by those invasive alien species.
This report seeks to support current goals to enable government and non-government stakeholders from North American and Arctic countries to work together for the prioritization and protection of island ecosys-tems, economies, and communities of shared concern. Ultimately this could lead to informing bi- lateral and
multilateral government and ngo stakeholder collab-oration in North America and facilitate priority island eradication of invasive vertebrates from islands to aid in the recovery of native island species and habitats. This product should be viewed as a starting point in discussions in North America and the Arctic that will enable government and non-government stakeholders to work together to develop shared priorities to protect island ecosystems, economies, and communities from invasive species.
We use caff’s Arctic administrative boundaries to define this region and include all states and territories within the U. S., Mexico, and Canada for North Amer-ica. Because they are most impactful to native island species, we focus on native terrestrial vertebrates and the tools needed to eradicate invasive terrestrial ver-tebrates, primarily invasive mammals, from islands. North America and Arctic regions have partial geopo-litical overlap, and many of the recommendations and approaches apply to both regions. Finally, we present this report and conclusions under the assumption that pursuing a centralized North American or Arctic is-lands data portal is desirable and likely supported by all stakeholders, particularly national governments.
This report is structured into three sections follow-ing the strategic planning tables found in Appendix 1. First, a Data Strategy and Implementation Plan (a data mobilization campaign), with the objectives of a) sum-marizing available baseline data, b) describing data gaps, and c) identifying a strategy for filling data gaps and producing an interoperable data system to inform conservation decision-making for eradicating invasive mammals on islands. Second, a prioritization tool, with objectives of a) identifying a possible prioritization schema, and b) identification of priority islands based on this schema. Third, recommended next steps for advancing a portfolio of important islands amongst stakeholders (a roadmap for action).
At the end of each section, we summarize our main findings and then follow these with recommendations that emerge from the narrative. The recommendations are directed towards nisc members and U. S. island decision-makers in an effort to guide a strategy, im-plementation, and action plan for the eradication of invasive species from U. S. islands. This framework, plus the content, was defined through consultation with the nisc Secretariat and as reflected in the strategic planning documents provided in Appendix 1.
10
Within this section our goal was to collate and evaluate datasets relevant to native and invasive terrestrial vertebrates
on North American and Arctic islands as well as subse-quent information on threats, and identify the poten-tial for mobilization into a North American or Arctic islands data system.
This dataset could subsequently be formatted into an online data portal for use by stakeholders and the public. Based on this goal, our objectives were to 1) inventory relevant data resources, highlighting occur-rence datasets that meet criteria for ready mobilization (“primary datasets”), which can aid decision-making for investing limited conservation resources in the two regions, 2) describe identifiable knowledge gaps and barriers to interoperability for developing any North American or Arctic islands data system, and 3) describe a strategy for filling the identified data gaps and over-coming barriers. Throughout this section we often refer to the Biodiversity Information Serving Our Nation (bison) database and the tib datasets as examples of how data could be collated and formatted for interop-erability. This effort provides a first pass at informing an islands dataset that can be used for decision-making at the North American or Arctic scale; it is not a final product. Subsequent research (i.e. literature reviews, expert interviews or workshops) will be necessary to uncover resources not highlighted in this report, as well as to fill additional knowledge gaps.
To inventory available data and describe knowledge gaps we sought to describe and characterize all relevant resources with information on native and/or invasive vertebrates on islands in North America or the Arctic. We focused on identifying primary datasets, which contained spatially explicit occurrence information
2. Data Strategy and Implementation Plan for North America and the Arctic: Data Mobilization Campaign
11
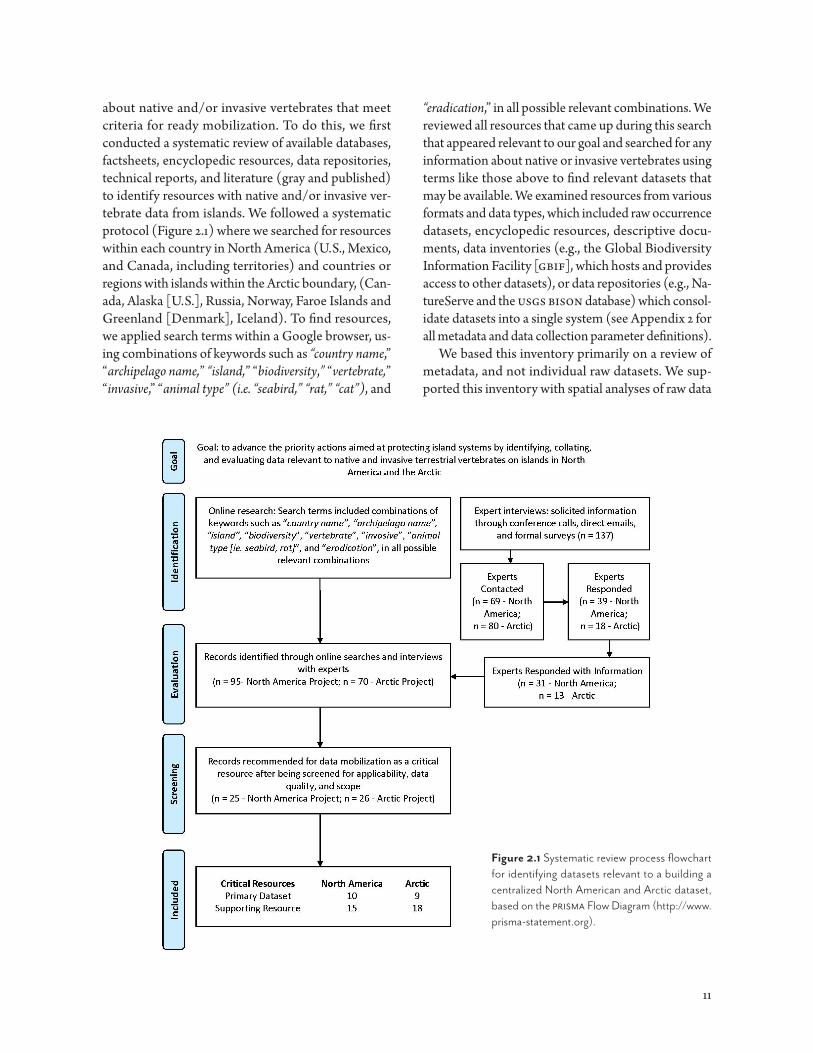
about native and/or invasive vertebrates that meet criteria for ready mobilization. To do this, we first conducted a systematic review of available databases, factsheets, encyclopedic resources, data repositories, technical reports, and literature (gray and published) to identify resources with native and/or invasive ver-tebrate data from islands. We followed a systematic protocol (Figure 2.1) where we searched for resources within each country in North America (U. S., Mexico, and Canada, including territories) and countries or regions with islands within the Arctic boundary, (Can-ada, Alaska [U. S.], Russia, Norway, Faroe Islands and Greenland [Denmark], Iceland). To find resources, we applied search terms within a Google browser, us-ing combinations of keywords such as “country name,” “archipelago name,” “island,” “biodiversity,” “vertebrate,” “invasive,” “animal type” (i.e. “seabird,” “rat,” “cat”), and
“eradication,” in all possible relevant combinations. We reviewed all resources that came up during this search that appeared relevant to our goal and searched for any information about native or invasive vertebrates using terms like those above to find relevant datasets that may be available. We examined resources from various formats and data types, which included raw occurrence datasets, encyclopedic resources, descriptive docu-ments, data inventories (e.g., the Global Biodiversity Information Facility [gbif], which hosts and provides access to other datasets), or data repositories (e.g., Na-tureServe and the usgs bison database) which consol-idate datasets into a single system (see Appendix 2 for all metadata and data collection parameter definitions).
We based this inventory primarily on a review of metadata, and not individual raw datasets. We sup-ported this inventory with spatial analyses of raw data
Figure 2.1 Systematic review process flowchart for identifying datasets relevant to a building a centralized North American and Arctic dataset, based on the prisma Flow Diagram (http://www.prisma-statement.org).

12
Figure 2.2 North American (a) and Arctic (b; next page) islands represented within the Global Islands Database (gid). The Arctic region is defined by the Arctic Council’s Conservation of Arctic Flora and Fauna’s (caff) Arctic administrative boundaries.
when a) data were available for immediate download or via a formal request, and b) data were spatially ex-plicit and where the spatial extent and degree of island coverage could be depicted (see the Map Appendix for all maps). These spatial analyses were achieved by overlaying these data with one of two spatial layers of islands (North America and the Arctic), referencing the Global Islands Database (gid) created by the United Nations Environment Programme and the World Con-servation Monitoring Centre (unep-wcmc) (Figure 2.2). The gid contains over 400,000 island polygons connected to unique spatial identification codes and includes island location, area, and country. We obtained permission from wcmc (Martin pers. comm. 2017) for use in this report. We identified 135,642 island polygons across the three North American countries and terri-tories. Within the Arctic (boundary defined by caff), we identified 88,708 island polygons within seven coun-
tries: Canada, U. S., Russia, Norway, Denmark, Faroe Islands, Greenland, and Iceland. We used these datasets as foundational spatial layers for creating maps of the two regions to produce generalized indications of data availability at an island scale (see section 2.3 for details).
Second, we surveyed experts with knowledge about available datasets. We identified at least one expert to contact per country, and in some cases, per region (i.e. in North America we searched for experts in the U. S. Caribbean islands, and in the Arctic we searched for ex-perts in the Svalbard Islands, Norway). We used three different communication tools to survey experts: 1) conference call (North America only), 2) formal survey posting on listservs (e.g. Aliens-L, where both a North American Islands Survey [https://goo.gl/Ztx8aw] and an Arctic Islands Survey [https://goo.gl/forms/oi5t-Mqp9JQDIchUE2] were posted), and 3) direct emails (including group emails sent by the nisc Secretariat
A.

13
to Arctic region experts), which included a formal sur-vey where appropriate. Communications with experts addressed the following themes surrounding the data mobilization campaign:
1. Data: What data is available and what is missing?2. Vertebrate Eradication Prioritizations: What
priorities have already been established and how were they derived?
We contacted 87 experts directly by email or phone call and received responses from 51 individuals (59% response rate). In addition, the nisc Secretariat sought input from U. S. Arctic Invasive Species Working Group (usaiswg), as well as Arctic Council members.
Once resources were identified through either the systematic review or expert correspondences, for each resource we determined if any of the following catego-
ries were included: invasive vertebrates, native verte-brates, island-specific data, invasive vertebrate manage-ment priorities, or threats by invasive vertebrates. We excluded resources that did not contain information in at least one of these categories. We then documented the metadata for each resource identified, including both background information (e.g. resource name, owner or institution hosting the data, the country and geographic scope), technical/formatting information such as data type (e.g. occurrence points vs descriptive reports), whether raw data was available (i.e. in tabular or spatial format), and whether permissions were need-ed to obtain the data (see Appendix 2 for all metadata and data collection parameter definitions).
Finally, we evaluated each resource for its utility for mobilization into a centralized data system. We consid-ered resources as “critical” for accomplishing this goal if they contained relevant and reliable information with
Figure 2.2 North American (a; previous page) and Arctic (b; next page) islands represented within the Global Islands Database (gid). The Arctic region is defined by the Arctic Council’s Conservation of Arctic Flora and Fauna’s (caff) Arctic administrative boundaries.
B.

14
considerable breadth and depth that could fill imme-diate knowledge gaps and be used to determine where to invest limited conservation resources. We grouped these resources into two main categories:
1. Primary datasets: datasets with spatially explicit occurrence information about native and/or inva-sive vertebrates. These datasets are made available for download online or have mechanisms to re-quest data, are vetted for accuracy and consistency, and contain metadata.
2. Supporting resources: resources that will add value to a dataset of North American or Arctic is-lands and could support decision-making of island invasive species eradication priorities. They con-tain information about taxonomy, native species threat status, island characteristics, and established conservation priorities. These resources fell into the following formats:a. Encyclopedic information – comprehensive
coverage regarding native and/or invasive ver-tebrates that is not spatially explicit and is of-ten in a tabular format. This includes species taxonomy lists, threat status designations, and native/non-native/invasive status.
b. Descriptive information – reports, technical documents, literature (published and unpub-lished), and fact sheets that contain descrip-tive information about native and/or invasive vertebrate distributions and threats (i.e. not in a format for immediate mobilization into a central dataset). For example, the listed species reports or the five-year reviews of listed species by the U. S. Fish and Wildlife Service (usfws).
c. Island characteristics – information that will support prioritization efforts by providing crit-ical island characteristic data. Often this infor-mation is in a raw spatial format (i.e. the gid).
Of note, datasets commonly have terms and condi-tions for access and use, even if made freely available online. For this report, we accessed and used data only for spatial analyses described above, where terms and conditions were consistent with the goals of this study to inventory data and knowledge gaps. We provide no raw data with this report. Should any North American or Arctic islands dataset be developed, and use of any of these primary datasets sought, particularly where mak-
ing datasets publicly available within a data portal, this access would require review of consultation of terms and conditions with data owners and development of possible data-sharing agreements, as is described in section 2.3.
Following an inventory of datasets and a descrip-tion of knowledge gaps, we made recommendations for filling knowledge gaps and overcoming barriers to interoperability among datasets, including key steps and considerations within the context of consolidating various datasets into a central North American or Arc-tic islands data system and considerations for making such data publicly available. These recommendations draw from knowledge generated from the authors’ in-volvement in established collaborative partnerships to produce and maintain databases (i.e. Threatened Island Biodiversity database, Database of Islands and Invasive Species Eradications).
2.1 Summary of the Data Inventory
North AmericaWe identified 95 resources which incorporated infor-mation from Canada (16 resources, 17%), the United States (43 resources, 46%), and Mexico, (6 resources, 6%). Twenty-nine resources (31%) were informative at a multi-national scale, of which 19 were derived by global institutions (e.g. BirdLife International). Out of 69 experts contacted, we received 45 responses, of which 36 contained relevant information informing the project goals. Within the U. S., 13 experts that re-sponded provided information at the state level, which included Alaska, Florida, Maine, Oregon, Puerto Rico, and Washington. Similarly, most of the expertise pro-vided by Canadian experts was at the provincial level, particularly for British Columbia.
Of the 95 resources, 57 (61%) had biodiversity as the main subject. These resources included occurrence data (e.g. bison database, technical reports (such as Mexico’s National Strategy for the Conservation and Sustainable Development of Terrestrial Islands), and taxonomic lists and factsheets of native or threatened species (e.g. Canada’s Committee on the Status of En-dangered Wildlife in Canada (cosewic) Species Risk Public Registry). Most of these biodiversity resources were applicable at the multi-national scale (29 resourc-es). Invasive species represented the main subject for 25 resources (27% of all resources identified). These
15
resources included occurrence data (e.g. the tib data-base), technical reports (e.g. the National Strategy on Invasive Species in Mexico), and taxonomic inventories (e.g. Global Registry of Introduced and Invasive Spe-cies [griis]). Of these, 15 resources discussed invasive species threats and a total of 10 resources addressed invasive species management priorities. Eight resources contained information specifically about island char-acteristics (e.g. the gid) while an additional four re-sources functioned as data inventories, containing in-formation on a variety of different topics (e.g. the North American Environmental Atlas by the Commission for Environmental Cooperation [cec]).
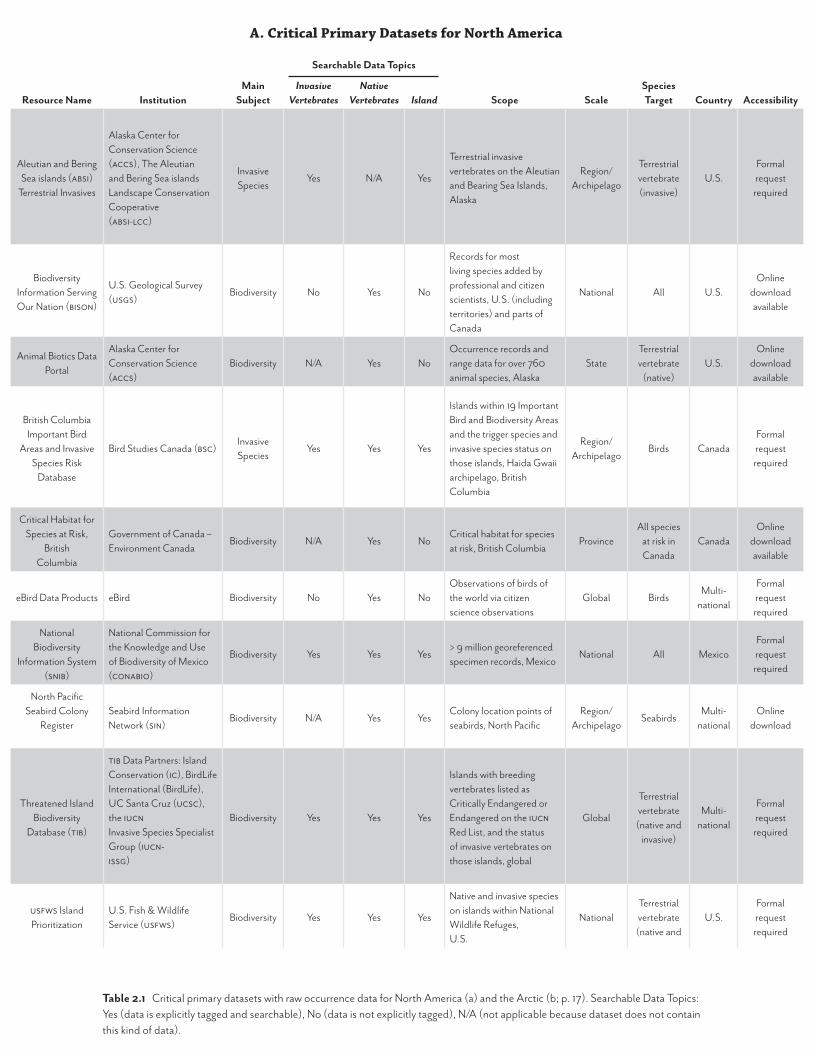
North America: Critical resourcesOf the 95 resources, 10 were considered critical primary datasets, containing raw occurrence data (Table 2.1a). Note that while occurrence data from NatureServe ex-isted, it was not included in these primary datasets due to the financial cost of accessing the data. Of these 10 datasets, six require a formal request to gain access and four are made available for immediate download. We gained access to seven of these critical primary datasets, and where appropriate, undertook preliminary spatial analyses to determine the overlap of data with islands (see Appendix 5, Map Appendix).
Geographically, the critical primary dataset with the most island coverage in the U. S. and Canada is the bi-son database, a repository for hundreds of datasets and millions of species occurrence records on both islands and continents. These species occurrence records do not include specific tagging of islands. However, when overlaid with gid polygons, our preliminary analysis suggests ~1,100 potential islands occur within the data-base for ~73,000 occurrence records. This data should undergo a validation process to identify any spatial or topical errors in the dataset (Appendix 5).
In Mexico, a critical primary dataset is the Nation-al Biodiversity Information System (snib) managed by the National Commission for the Knowledge and Use of Biodiversity of Mexico (conabio). The dataset contains over nine million species occurrence records across Mexico from hundreds of data providers and expert reviewers (conabio 2012; Sarukhán et al. 2015). We did not access the raw database. Unlike any other dataset reviewed of this scope and scale, snib contains island-specific data, including characteristics such as protected area status, and distinguishes between native
and invasive species on those islands. This is a unique data system that has already been used to assemble and prioritize island-based invasive species eradication pri-orities in Mexico (conabio 2012), thus providing an important example that can inform the development of a North American islands data system.
In addition to the critical primary datasets, we iden-tified 15 critical supporting resources likely important for filling additional knowledge gaps on native species and invasive species occurrences on islands, threats, island characteristics, and pre-established invasive spe-cies eradication priorities (Table 2.2a).
These resources included encyclopedic and de-scriptive resources such as the usfws’s Environmen-tal Conservation Online System (ecos), which lists threatened and endangered species in the U. S. and serves as a repository of technical documents, maps, and factsheets about each species listed or the online species factsheets provided by the iucn Red List. Five of the supporting resources were datasets with island characteristic information. For example, the gid provides a unique identification code for each island polygon of the world and can serve as a foundational geographic data layer for mapping at North American and Arctic island scales.
ArcticWe identified 70 resources which incorporated infor-mation from Canada (6 resources, 8%), the United States (12 resources, 16%), Russia (3 resources, 4%), Norway (8 resources, 11%), Iceland (2 resources, 3%), and Denmark (Greenland/Faroe Islands = 2 resources, 3%). Thirty-seven resources (53%) were informative at a multi-national scale, of which 24 resources were infor-mative at the Arctic scale, 1 at the European scale, and 14 at the global scale (e.g. BirdLife). We also reviewed relevant resources identified by Veatch (2017). Eighty individual experts were contacted, and we received 18 responses, of which 13 contained relevant infor-mation to inform the project. Of these experts, three provided information at the archipelago level (Faroe Islands [Denmark], Svalbard Islands [Norway] and the Aleutian and Bering Sea islands [Alaska, U. S.]), while the remaining expertise was provided at a country or multi-national scale.
Of the 70 resources identified, 41 (59%) had biodi-versity as the main subject. These included occurrence data (e.g. the bison database) or taxonomic lists of
Resource Name InstitutionMain
Subject
Searchable Data Topics
Scope ScaleSpeciesTarget Country Accessibility
InvasiveVertebrates
NativeVertebrates Island
Aleutian and Bering Sea islands (absi)
Terrestrial Invasives
Alaska Center for Conservation Science (accs), The Aleutian and Bering Sea islands Landscape ConservationCooperative(absi-lcc)
Invasive Species
Yes N/A Yes
Terrestrial invasive vertebrates on the Aleutian and Bearing Sea Islands, Alaska
Region/ Archipelago
Terrestrialvertebrate(invasive)
U. S.Formal request required
Biodiversity Information Serving Our Nation (bison)
U. S. Geological Survey (usgs)
Biodiversity No Yes No
Records for most living species added by professional and citizen scientists, U. S. (including territories) and parts of Canada
National All U. S.Online
download available
Animal Biotics Data Portal
Alaska Center for Conservation Science (accs)
Biodiversity N/A Yes NoOccurrence records and range data for over 760 animal species, Alaska
StateTerrestrial vertebrate
(native)U. S.
Online download available
British Columbia Important Bird
Areas and Invasive Species Risk
Database
Bird Studies Canada (bsc)Invasive Species
Yes Yes Yes
Islands within 19 Important Bird and Biodiversity Areas and the trigger species and invasive species status on those islands, Haida Gwaii archipelago, BritishColumbia
Region/ Archipelago
Birds CanadaFormal request required
Critical Habitat for Species at Risk,
BritishColumbia
Government of Canada –Environment Canada
Biodiversity N/A Yes NoCritical habitat for species at risk, British Columbia
ProvinceAll species
at risk in Canada
CanadaOnline
download available
eBird Data Products eBird Biodiversity No Yes NoObservations of birds ofthe world via citizen science observations
Global BirdsMulti-
national
Formal request required
National Biodiversity
Information System (snib)
National Commission for the Knowledge and Use of Biodiversity of Mexico (conabio)
Biodiversity Yes Yes Yes> 9 million georeferenced specimen records, Mexico
National All MexicoFormal request required
North Pacific Seabird Colony
RegisterSeabird Information Network (sin)
Biodiversity N/A Yes YesColony location points of seabirds, North Pacific
Region/ Archipelago
SeabirdsMulti-
nationalOnline
download
Threatened Island Biodiversity
Database (tib)
tib Data Partners: Island Conservation (ic), BirdLife International (BirdLife), UC Santa Cruz (ucsc), the iucnInvasive Species Specialist Group (iucn-issg)
Biodiversity Yes Yes Yes
Islands with breeding vertebrates listed as Critically Endangered or Endangered on the iucn Red List, and the status of invasive vertebrates on those islands, global
Global
Terrestrial vertebrate (native and
invasive)
Multi- national
Formal request required
usfws Island Prioritization
U. S. Fish & Wildlife Service (usfws)
Biodiversity Yes Yes Yes
Native and invasive species on islands within National Wildlife Refuges,U. S.
NationalTerrestrial vertebrate (native and
U. S.Formal request required
A. Critical Primary Datasets for North America
Table 2.1 Critical primary datasets with raw occurrence data for North America (a) and the Arctic (b; p. 17). Searchable Data Topics: Yes (data is explicitly tagged and searchable), No (data is not explicitly tagged), N/A (not applicable because dataset does not contain this kind of data).

Resource Name InstitutionMain
Subject
Searchable Data Topics
Scope ScaleSpeciesTarget Country Accessibility
InvasiveVertebrates
NativeVertebrates Island
Aleutian and Bering Sea Islands (absi)
Terrestrial Invasives
Alaska Center for Conservation Science (accs), The Aleutian and Bering Sea Islands Landscape Conservation Cooperative (absi-lcc)
Invasive Species
Yes N/A Yes
Terrestrial invasive vertebrates on the Aleutian and Bearing Sea Islands, Alaska
Region/ Archipelago
Terrestrial vertebrate (invasive)
U.S.Formal request required
Arctic Species Trend Index (asti)
Conservation of Arctic Flora and Fauna (caff), Arctic Biodiversity Data Service (abds)
Biodiversity No Yes NoVertebrate distributions across Arctic
ArcticVertebrates
(native)Multi-
national
Online download available
Biodiversity Information Serving Our Nation (bison)
U.S. Geological Survey (usgs)
Biodiversity No Yes No
Records for most living species added by professional and citizen scientists, U.S. (including territories) and parts of Canada
Multi- national
All U.S.Online
download available
Biotics Animal Data Portal
Alaska Center for Conservation Science (accs)
Biodiversity No Yes NoOccurrence records and range data for over 760 animal species in Alaska
StateTerrestrial vertebrate
(native)U.S.
Online download available
Circumpolar Seabird Data Portal
Seabird Information Network (sin)
Biodiversity No Yes YesColony location points of seabirds, North Pacific
Region/ Archipelago
SeabirdsMulti-
national
Online download available
Circumpolar Seabird Monitoring
Plan
Conservation of Arctic Flora and Fauna (caff)
Biodiversity No Yes YesColony location points of seabirds, North Pacific
Arctic SeabirdsMulti-
national
Online download available
Fauna and Flora Svalbard
Norwegian Polar Institute Biodiversity No Yes YesThe distribution of plants and animals on Svalbard
Region/ Archipelago
Mammals and seabirds
Norway
Online download available/
formal request for
editable spatial data
layers
gbif OccurrencesGlobal Biodiversity Information Facility (gbif)
Biodiversity No Yes NoOccurrences of species across the Arctic from over 10,000 datasets
Arctic AllMulti-
National
Online download available
Threatened Island Biodiversity
Database (tib)
Island Conservation, BirdLife International, UC Santa Cruz, Invasive Species Specialist Group (issg)
Biodiversity Yes Yes Yes
Islands with breeding vertebrates listed as Critically Endangered or Endangered on the Iucn Red List, and the status of invasive vertebrates on those islands, global
Global
Terrestrial vertebrates (native and
invasive)
Multi- national
Formal request required
B. Critical Primary Datasets for the Arctic
Table 2.1 continued

18
native or threatened species (e.g. cosewic). Most of these biodiversity resources were applicable at the multi-national scale (19 resources). Invasive species represented the main subject for only 8 resources (11%), which also included occurrence data (e.g. the tib data-base, Aleutian and Bering Sea islands (absi) Terrestri-al Invasives database) or taxonomic inventories (e.g., griis). Data portals were common for the Arctic; they functioned as either a data repository (collating many datasets into one format) or an inventory of datasets, providing links to additional data products and institu-tions that may be relevant (e.g. the Arctic Data Center, Arctic Science Portal, or the Polar Knowledge Cana-da). Four resources contained information specifically about island characteristics (e.g. the gid).
Only 14 resources addressed threats by invasive ver-tebrates and 17 discussed conservation management of invasives. However, these resources will need further investigation as many are not specific to islands or the Arctic. Similarly, some resources may discuss invasive threats, but are not often specific to invasive vertebrates (invasive plants and insects are the most commonly documented invasives in the Arctic; see the nbic Black List). Thus, these numbers are likely overstatements of what data are available for invasive threats and priority actions on Arctic islands. The one exception was the American mink (Mustela vision), whose introduction has been well cited in Iceland where it is linked to de-clines in birds and mammals (caff 2013).
Arctic: Critical resourcesOf the 94 resources, nine were considered critical pri-mary datasets (Table 2.1b), including the bison and tib databases described in the North American section. Of nine primary datasets, two require a formal request to gain access (e.g. the tib database) and the remaining are made available for immediate download. We gained access to seven of these primary datasets, and where appropriate, undertook preliminary spatial analyses to determine the overlap of data with gid island polygons (see Appendix 5, Map Appendix). For example, we downloaded and examined the Circumpolar Seabird Data Portal, maintained by the Seabird Information Network (sin) and which provides seabird colony, population, and diet records. Our preliminary analysis identified over 17,000 colony records of 50 species on more than 400 islands. Two of the datasets appeared to provide data coverage across much of the Arctic re-gion: these included occurrence records from the gbif
and the Arctic Species Trend Index (asti) hosted by the Arctic Biodiversity Data Service. As with bison, these resources contain thousands to millions of spe-cies occurrence records, yet none explicitly tag invasive species (or islands). Of note, the absi database, created by the Alaska Center for Conservation Science (accs) and the Aleutian and Bering Sea islands Landscape Conservation Cooperative (absi-lcc) documents invasive species presence on islands throughout the region, including the level of threat they pose to native biodiversity (high, medium, or low). Along with the tib database, this is the only other dataset that doc-uments both invasive species occurrences on islands and their threats to native species. Thus a standard data processing effort will be important for extracting this information (see section 2.3).
In addition to the critical primary occurrence datasets, we identified 18 critical supporting resources (Table 2.2b). These resources included encyclopedic resources such as the European Network on Invasive Alien Species (nobanis) alien species database or the griis, which lists invasive species by country. They also included descriptive information, tables, and maps found in technical reports and fact sheets. For exam-ple, the International Breeding Conditions Survey on Arctic Birds (abbcs) websites provides a repository of reports and maps on arctic breeding bird success and rodent abundance since 1988, and the Cruise Hand-book for Svalbard by the Norwegian Polar Institute provides detailed descriptions about the region, in-cluding descriptions on geology, vegetation, wildlife, shipping traffic, culture, and protected areas.
2.2 Summary of Data Gaps
Based on the data inventory and process of collation de-scribed above, we identified major barriers and knowl-edge gaps needing to be addressed in order to have a comprehensive North American or Arctic islands data-set. These include 1) data processing barriers limiting interoperability of critical primary datasets into a single dataset and into a format that can be publicly available through a data portal, 2) data mobilization barriers for descriptive resources and data not in publicly available formats, 3) geographic-based data gaps and 4) sub-ject-based data gaps (native species, invasive species, threats, priorities). See Table 2.3ab for a breakdown of geographic and subject-based data gaps by country.

Resource Name Institution Main Subject Country Data Type Accessibility
Committee on the Status of Endangered Wildlife in Canada (COSEWIC) Species
Risk Public Registry
Government of Canada – Canadian Wildlife Service
Biodiversity CanadaEncyclopedic tables;
descriptive fact sheets; reports
Online download available
Environmental Conservation Online System (ECOS)
U.S. Fish & Wildlife Service (USFWS) Biodiversity U.S.
Encyclopedic tables; descriptive fact sheets; reports;
polygons
Online download available
Estrategia Nacional para la Conservación y el Desarrollo Sustentable del Territorio
Insular Mexicano
National Commission for the Knowledge and Use of Biodiversity of Mexico
(CONABIO)Biodiversity Mexico
Report: descriptive, tables
Online download available
Global Invasive Species Database (GISD)IUCN Invasive Species Specialist Group
(IUCN-ISSG)Invasive Species
Multi- nationalEncyclopedic tables;
descriptive fact sheets
Published online
Global Island Database (GID)United Nations Environmental
Programme and the World Conservation Monitoring Centre (UNEP-WCMC)
Land Characteristics
Multi- national PolygonsFormal request
required
Global Registry of Introduced and Invasive Species (GRIIS)
IUCN Invasive Species Specialist Group (IUCN-ISSG)
Invasive Species
Multi-national TablesOnline download
available
Important Bird and Biodiversity Areas (IBA) in Canada
Bird Studies Canada (BSC), Nature Canada, BirdLife International (BirdLife)
Biodiversity CanadaPolygons; online
descriptive factsheetsFormal request
required
Important Bird and Biodiversity Areas, BirdLife International (IBA-BirdLife)
BirdLife International (BirdLife) Biodiversity Multi- nationalPolygons; online
descriptive factsheetsFormal request
required
IUCN Red ListInternational Union for Conservation of
Nature (IUCN)Biodiversity Multi- national
Encyclopedic tables; online descriptive
factsheets
Published online and online download
(taxonomic data)
North American Environmental AtlasCommission for Environmental
Cooperation (CEC)Multiple Multi-national
Inventory of datasets: polyons, rasters,
points
Online download available
Protected Area Database, U.S. (PADUS) U.S. Fish & Wildlife Service (USFWS)Land
CharacteristicsU.S. Polygons; tables
Online download available
USFWS Island Gazette U.S. Fish & Wildlife Service (USFWS)Land
CharacteristicsU.S. Table; points
Formal request required
World Database on Protected Areas (WDPA)
United Nations Environmental Programme and the World Conservation
Monitoring Centre (UNEP-WCMC), International Union for Conservation of
Nature (IUCN)
Land Characteristics
Multi- national PolygonsOnline download
available
A. Critical Supporting Resources for North America
Table 2.2 Critical supporting resources for North America (a) and the Arctic (b)

Resource Name Institution Main Subject Country Data Type Accessibility
Arctic marine areas of heightened ecological significance (amsaiic)
Conservation of Arctic Flora and Fauna (caff), The Arctic Council’s Arctic
Monitoring and Assessment Programme(amap)
Biodiversity Multi-national PolygonsOnline download
available
Biological Diversity in IcelandMinistry for the Environment, Icelandic
Museum of Natural HistoryBiodiversity Iceland Report
Online download available
Circumpolar Biodiversity Monitoring Program (cbmp) – Terrestrial
Conservation of Arctic Flora and Fauna (caff)
Biodiversity Multi-nationalReport; inventory of
datasetsOnline download
available
Committee on the Status of Endangered Wildlife in Canada (cosewic) Species Risk
Public Registry
Government of Canada – Canadian Wildlife Service
Biodiversity CanadaEncyclopedic tables;
descriptive fact sheets; reports
Online download available
Environmental Conservation Online System (ecos)
U. S. Fish & Wildlife Service (usfws) Biodiversity U. S.
Encyclopedic tables; descriptive fact sheets; reports;
inventory of datasets
Online download available
Global Invasive Species Database (gisd)iucn Invasive Species Specialist Group
(iucn-issg)Invasive Species
Multi-nationalEncyclopedic tables;
descriptive fact sheets
Published online
Global Island Database (gid)United Nations Environmental
Programme and the World Conservation Monitoring Centre (unep-wcmc)
Land Characteristics
Multi-national PolygonsFormal request
required
Global Registry of Introduced and Invasive Species (griis)
iucn Invasive Species Specialist Group (iucn-issg)
Invasive Species
Multi-national TablesOnline download
available
Important Bird and Biodiversity Areas (iba) in Canada
Bird Studies Canada (bsc), Nature Canada, BirdLife International (BirdLife)
Biodiversity CanadaPolygons; online
descriptive factsheetsFormal request
required
Important Bird and Biodiversity Areas, BirdLife International
(iba-BirdLife)BirdLife International (BirdLife) Biodiversity Multi-national
Polygons; online descriptive factsheets
Formal request required
iucn Red ListInternational Union for Conservation of
Nature (iucn)Biodiversity Multi-national
Encyclopedic tables; online descriptive
factsheets
Published online and online download available
(taxonomic data)
Key Biodiversity Areas (kba) BirdLife International (BirdLife) Biodiversity Multi-national PolygonsFormal request
required
nobanis alien species databaseEuropean Network on Invasive Alien
Species (nobanis)Invasive Species
Multi-nationalOnline data/map
portal; online descriptive factsheets
Published online
Norwegian Polar Institute Map Data and Services
Norwegian Polar InstituteLand
CharacteristicsNorway
Data repository – map images,
basemaps, thematic data
Online download available
Svalbard's wildlife – The Cruise Handbook for Svalbard
Norwegian Polar Institute Biodiversity NorwayDescriptive; online
factsheets;Published online
The International Breeding Conditions Survey on Arctic Birds (abbcs)
International Wader Study Group, Wetlands International's Goose and
Swan Specialist GroupsBiodiversity Multi-national
Report; online data/map portal;
Online download available
World Database on Protected areas (wdpa)
United Nations Environmental Programme and the World Conservation
Monitoring Centre (unep-wcmc), International Union for Conservation of
Nature (iucn)
Land Characteristics
Multi-national PolygonsOnline download
available
World Heritage Datasheet
The International Union for Conservation of Nature (iucn) and the UN Environment World Conservation
Monitoring Centre (unep-wcmc)
Biodiversity Multi-nationalOnline descriptive
factsheetsPublished online
B. Critical Supporting Resources for the Arctic

21
2.2.1 Data Processing Barriers Limiting Interoperability of Critical Primary Datasets
For the critical primary datasets, several factors limit interoperability and thus mobilization into any cen-tralized dataset (See Table 2.3ab). This barrier must be addressed before the dataset can be formatted into a publically available interoperable system to be used and accessed publicly.
First, there are a handful of geographic-based bar-riers. These include differences in what the raw data represents, for example, point locations representing an occurrence record, point or polygon locations sum-marizing species presence/absence at the island level, or large-scale polygons representing generalized spe-cies distributions. Spatially, differences among datums, projections, and coordinate systems impact geographic consistency among datasets. Errors in coordinates of occurrence records further complicate the ability to accurately match all occurrences with island polygons (see section 2.3 for further specifications). Finally, some datasets contain occurrence records on islands, but don’t explicitly tag the islands in a searchable format (e.g. bison, the Biotics Animal Data Portal, and Envi-ronment Canada’s Critical Habitat for Species at Risk database).
Second, there are subject-based data barriers. These include different taxonomic standards used for species data. For example, standardized scientific names used in the bison database are supplied by the Integrated Taxonomic Information System (itis 2015) while those in the tib are supplied by the iucn Red List, which ref-erences standards respective of each taxonomic group. A barrier also exists in the identification of invasive species. For example, the bison database collates spe-cies occurrence data but does not identify the native, non-native, or invasive status of those species.
Third, differences in data quality control and vali-dation processes impact spatial accuracy and consis-tency within and among occurrence records. This is most apparent for data registries or portals that collate different datasets or citizen science observations, and thus inherit different inaccuracies associated with the dataset. For example, app-based data collection (such as ebird or iNaturalist, data sources in bison) can contain more errors or inaccuracies than data that are subject to standardized collection and validation. As another example, The Global Island Database (gid), which was identified as a critical secondary resource with island characteristic data, is not subject to a quality
assurance/quality control (qa/qc) process and may contain errors such as incorrectly mapped coastlines.
Fourth, while there are technical steps that will also need to be taken to display the data on an online data portal, the most important gap is the existence of a mou among each of the dataset owners, which will need to be created to ensure transparent data-sharing and use agreements. These agreements should also include committed time by the dataset owners to par-ticipating in a standard data validation process that will enable the datasets to be incorporated into a standard format.
2.2.2 Data Mobilization BarriersWithin the critical supporting resources (Table 2.2ab), a variety of data formats and accessibility barriers lim-it the mobilization of data. These barriers are not re-stricted solely to these resources. First, many resourc-es are formatted as descriptive documents, such as species-based factsheets, technical reports, literature, and dissertations, and are thus not in a raw data format ready for mobilization. Moreover, within these docu-ments, metadata are not often supplied. Metadata are critical for communicating data definitions, such as the taxonomic authority used, or what an occurrence record denotes about a species (if it is breeding, win-tering, migrating, etc.). Metadata are also important for defining the objective of the dataset, as well as the scope, scale, and quality of the records. While metadata were available for the critical primary resources identi-fied, they were not always available for others, creating a knowledge gap in how to make data inter-operable.
Reports in different languages also presented addi-tional challenges for transcription and mobilization. During our search effort we only communicated in English, which likely influenced the responses we ob-tained and resources we could access. This was partic-ularly apparent in the Arctic, where many potentially useful reports and websites were in languages other than English.
Finally, as was also the case for a few critical datasets, when raw data were available within the supporting documents (e.g. island characteristic information from Important Bird and Biodiversity Area [iba] data, the gid) formal permissions were often required to ob-tain the datasets. While this is not considered a major barrier to data mobilization because these datasets are easy to access once requested, in some cases, it may be advisable to adopt data-sharing agreements with the data owners.

22
2.2.3 Geographic-based Knowledge GapsGeographic data gaps reflect differences in scope for each dataset plus uneven raw data collation across geographies. For example, the Circumpolar Seabird Database is the most comprehensive dataset of seabird distributions on islands in the Arctic, yet it depends on individuals and organizations to submit data. Thus, data coverage only reflects where participating parties monitor seabirds and submit data.
While at least one island-specific resource was iden-tified for each country (and U. S. territory), an uneven availability of data exemplified gaps at regional scales. Below we explore these data gaps and identify the re-gions where data gaps should be filled:
North AmericaDataset coverage was largely missing for islands along the Atlantic coast of North America, Canada’s northern archipelagos, and coastal areas in the Gulf of Mexico. At the multi-national scale, the tib database was restrict-ed by the species that were included (it includes only the islands with highly threatened vertebrates on the iucn Red List). The bison database was restricted to the U. S. and Canada and was not island-focused. The eBird dataset contained geographic occurrence data at the multi-national scale, although it was restricted to bird data only. At the country level, only the snib was comprehensive (covering all of Mexico). Five other datasets were geographically restricted by region: U. S. islands within wildlife refuges (usfws), islands within Alaska (absi dataset and the Animal Biotics dataset), and islands in British Columbia with ibas (by Bird Studies Canada) or critical habitat for species at risk (Environment Canada).
ArcticIsland-explicit raw data were largely missing for the Arctic, especially for Greenland, the Faroe Islands, offshore islands of mainland Norway, and for most of Russia. Only three critical primary datasets provided comprehensive and readily accessible island-explicit data: the tib, the absi dataset, and the Norwegian Po-lar Institute’s coverage of Svalbard. Other resources with island data include the bison database and gbif occurrence data (although islands were not explicitly tagged) and the Circumpolar Seabird Databases.
2.2.4 Subject-based GapsGenerally, spatially discrete invasive vertebrate infor-
mation for islands is lacking. This is a clear knowledge gap, of which there are a few broad explanations. First, islands are inherently difficult to access, and thus they are not commonly monitored. Furthermore, when is-lands are accessed, invasive species are not common-ly targeted for monitoring (Stephenson pers. comm. 2018). Instead, information about invasives is often collected incidentally, and is not housed in an easily accessible repository, as is typical for native species. There is also limited understanding of when an inva-sive is absent compared to when the information is simply unknown and an invasive may be presumed absent when it is actually present and causing damage.
Second, despite the well-published definitions of “invasive” (e.g. Executive Order 13751, the Arctic Inva-sive Alien Species (arias) Strategy and Action Plan (2017), nobanis, the Norway Black List, etc.), a de-finitive understanding of which island species are con-sidered invasive remains a critical knowledge gap. This is partly due to the lack of historical data on islands. For example, the islands within the Oregon National Wildlife Refuge are not consistently monitored or ac-cessed, yet it is known that raccoons can occur on some of these islands, threatening seabirds (Stephenson pers. comm. 2018).
However, it is unclear if the raccoons are established on some of the islands and whether they should be considered invasive (swimming is a likely route). When raccoons are eventually documented, it is unclear if they were undetected historically due to limited sur-veys and lack of targeted monitoring, or if they were ab-sent historically. This is an example of how definitions of what constitutes an invasive species on an island may be important on a local scale and how a lack of monitoring can hamper our ability to determine if and what invasive species occur.
Third, island-specific information resources on non-native species threats are disparate (available for some islands and archipelagos, but not others) and can be contradictory; a non-native species may be consid-ered invasive and having an impact on some islands but not on others. For example, non-native cats and rats on islands with seabirds within the Puget Sound, Washington, are not known to pose a threat to seabirds. Meanwhile, rats and other non-native vertebrates in the San Juan Islands, Washington, are designated as invasive and a threat to native diversity (Milner pers. comm. 2018).
Below we explore these data gaps in more detail.
23
North AmericaWithin the critical primary occurrence datasets, inva-sive species data were not often comprehensive. For example, some occurrence datasets contained presence information but not absence information (e.g. snib, ebird) and others contained invasive species informa-tion, but it was not explicitly tagged or searchable (e.g. bison, ebird). Outside of these primary datasets, most invasive species specific occurrence datasets from our inventory had a primary focus on invasive plants or insects; very few resources included invasive vertebrate occurrences (e.g. eddmaps, North American Invasive Species Network (naisn), The National Invasive Spe-cies Information Center (nisic), iMapInvasives, Virgin Islands National Park Environmental Assessment do not focus on vertebrates). Finally, information about invasive species threats on islands was limited, yet most often found within native species-specific technical re-ports and conservation strategies, or in comprehensive management plans on national wildlife refuges. These would need to be transcribed, or original data accessed, to be considered for mobilization.
ArcticDue to limited species richness and a harsh environ-ment in the Arctic, as well as an evolutionary history of mammals within the region, threats by invasive ver-tebrates are a relatively new phenomenon and there is little baseline data on presence and impacts (caff 2013; caff and pame 2017). For example, in Svalbard, Norway, which may be one of the most well-studied archipelagos in the region, it is presumed that “the lack of spatial information on non-native vertebrates is most likely due to the general lack of non-native vertebrates” (Ware pers. comm. 2017). In addition to this, very few terrestrial mammal species exist in Svalbard at all, and attempts to introduce other species such as hares or muskox failed due to habitat conditions. Indeed, the only non-native mammals that have been identified are the sibling vole (Microtus levis) and house mouse (Mus musculus), and their distribution is restricted to mining settlements.
Thus, there is a general lack of information about invasive vertebrates on islands in the Arctic. Table 2.4 presents a summary of the information collated from the 26 critical resources and expert correspondences and is aimed at communicating current knowledge and knowledge gaps about invasive vertebrates on islands in the Arctic.
In summary, two major data gaps exist. First, ad-ditional baseline data on the geographic distribution and status of invasive species on islands are needed. More dedicated monitoring targeted at invasives (e.g. the sibling vole) is needed; presently, any spread or impact (e.g. to nearby seabird colonies) would only be observed incidentally or by chance. griis and noban-is databases identify the house mouse (Mus musculus) as introduced in Greenland and the Faroe Islands, but its invasiveness status is unknown. Second, while a few comprehensive resources provide introduced and in-vasive species lists at the national and multi-nation-al scale (e.g. griis, nobanis, Norway’s Black List), these designations are often not island- specific, and invasiveness may indeed vary between mainland and islands. For example, the griis classifies two rat species (Rattus rattus and R. norvegicus) as invasive in coun-tries such as Iceland, Russia, and Canada, yet the 2013 Arctic Terrestrial Biodiversity Monitoring Plan (caff) states that “While over 100 non-native species have been found in the Arctic, no species is yet considered invasive.” This gap is likely linked to a lack of baseline data and a need for clear definitions of what constitutes an invasive species on islands, as well as how definitions will be adapted in the future as mainland species gain access to islands as a result of climate change (caff and pame 2017).
2.3 Strategy for Filling Gaps
Developing a North American or Arctic islands dataset that will guide important conservation decision-mak-ing requires overcoming barriers and filling knowledge gaps outlined in section 2.2. To guide these actions, we describe a data management schema and a prac-tical strategy for collating and mobilizing data into a centralized dataset. We then use this schema to inform strategies for 1) the mobilization of any primary oc-currence datasets by building in interoperability and translating information from descriptive resources into an integratable data format, which can also be applied to the creation of a publically available data portal and 2) filling knowledge gaps including consultation with experts. Inherent in these recommendations for filling data gaps is the assumption that the database design and utility are supported by stakeholders, and consent from data owners is obtained.

24
CountryGeneral description of data avail-
abilityGeographic data gaps
Subject-based data gaps
Native Species DataInvasive vertebrate
DataInvasive threats
data
Canada
Many data resources but often not country- wide, datasets often organized at the provincial level, Bird Studies Canada’s Important Bird Areas is the most comprehensive dataset of almost 100 islands in British Columbia (Haida Gwaii). Technical reports from the Canadian Wildlife Service and En-vironment Canada could fill knowledge gaps. Birds are best documentedGroup.
Islands off the Atlantic coast, islands in BC other than Haida Gwaii, Canada’s northern archipelagos, no comprehen-sive national repository of occurrence data
Excellent (British Co-lumbia), Poor (all other regions)
Good (Haida Gwaii and islands with ibas), Poor (all other regions)
Poor (disparate information, likely recorded in technical reports)
MexicoComprehensive data on all aspects of biodiversity in Mexico – taxonomy, dis-tribution, threats, and priorities.
None identified Excellent Excellent Excellent
U. S.
usfws has succinct data on the native and invasive vertebrates on islands with National Wildlife Refuges, the Alaska Center for Conservation Science (accs) contains detailed information for Alaska, otherwise data resources are disparate across the country. Birds are the best documented group.
Islands off the Atlantic coast, gulf coast. Various govern-ment and non- governmental programs in Oregon, Wash-ington and California have island-specific data resources but there is no comprehensive national repository of occur-rence data
Excellent (Alaska and National Wildlife Ref-uges), Poor (Atlantic, Gulf Coast islands)
Excellent (Alaska and National Wildlife Ref-uges), Poor (Atlantic, Gulf Coast islands)
Excellent (Alaska and National Wildlife Ref-uges), Poor (all other regions – disparate information, likely recorded in technical reports)
Multi-national
Most global datasets offer a standard data taxonomy that can be used. Avail-able datasets are comprehensive yet are very specific (i.e. lists of invasives by country (griis), threatened species mapped on islands with invasives (tib), areas with birds (BirdLife-iba). Birds and especially seabirdsare the best documented group.
Resolution is often lost at the global scale, and islands are not often explicitly tagged (with the exception of the tib)
Good Poor Poor
Table 2.3a Defining geographic and subject-based data gaps by country in North America (a) and the Arctic (b; next page). Subject-based gaps are ranked into three categories based on data availability: Poor (many gaps), Good (some gaps), Excellent (few, if any gaps).

25
CountryGeneral description of data avail-
abilityGeographic data gaps
Subject-based data gaps
Native Species DataInvasive vertebrate
DataInvasive threats
data
Canada (ArcticArchipelago)
Many data resources but not country-wide nor explicit for arctic islands. bison and circumpolar seabird databases have many data points in the Canadian Arctic. Technical reports from the Canadian Wildlife Service and Environment Canada could fill knowledge gaps. Birds are the best documented group.
Gaps across the Canadi-an Arctic, disparate data available
Good (birds best doc-umented and bison adds non-avian data)
Poor (disparate information where available)
Poor (disparate information where available)
Norway*
Island-explicit data available for Svalbard and Jan Mayen, data generally available through multi-national working groups (e.g. caff) and national datasets (Nor-wegian Polar Institute).
Data for islands off mainland Norway; invasive status and threat of introduced species in Svalbard
Excellent (Svalbard, Jen Mayen), good (all other regions)
Good (taxonomic lists), Poor (occur-rences)
Poor (Black List and nobanis mostly for plants and insects)
Russia†
Data available through multi-national working groups (e.g. caff) and data-sets (e.g. The International Breeding Conditions Survey on Arctic Birds [abbcs], tib, ibas). Geography-specific data available (e.g. Novaya Zemlya, Medusa Bay, Wrangle Island). Birds are the best documented group.
Limited data, large geographic gaps; no explicit geographic resource for islands
Good (birds, but not comprehensive)
Good (taxonomic lists), Poor (occur-rences)
Poor
United States (Aleutian and
Bearing Sea Islands)
A multitude of resources and docu-ments, a handful of critical gap filling data resources through the Alaska Center for Conservation Science (accs), Aleutian and Bearing Sea Islands (abbsi) llc, Alaska department of fish and game (adfg) and usfws. Birds are the best documented group.
Biotics dataset and gap anal-ysis cover islands but are not island-specific;
Excellent Excellent Excellent
Iceland
Data available through multi-national working groups (e.g. caff) and net-works (e.g. nobanis), reports available documenting native species.
National-scale native and invasive biodiversity datasets; islands off mainland Iceland not clearly specified within datasets; definitions of inva-sives on offshore islands
GoodPoor (nobanis, griis available, but mostly plants and insects)
Good (nobanis, but mostly plants and insects)
Denmark (Greenland,
Faroe Islands)
Data available through multi-nation-al working groups (e.g. caff) and networks (e.g. nobanis), reports and expert knowledge contain most of the information.
Data for islands off mainland Greenland including defini-tions of invasives on offshore islands; vertebrate datasets for Faroes
Good (circumpolar seabirds, general species lists within reports), poor (distri-bution of non-avian species)
Good (nobanis, ex-pert knowledge), poor (all other resources)
Good (nobanis, expert knowledge), Poor (no other resources found)
Multi-national
Most global datasets offer a standard data taxonomy that can be used. Avail-able datasets are comprehensive yet are very specific (i.e. lists of invasives by country (griis), threatened species mapped on islands with invasives (tib), areas with birds (BirdLife-iba).
Resolution is often lost at the global scale, and islands are not often explicitly specified (except for the tib and absi- llc)
Good (Birds)Good (griis, nobanis), poor otherwise
Poor
Table 2.3b Defining geographic and subject-based data gaps by country in North America (a) and the Arctic (b; next page). Subject-based gaps are ranked into three categories based on data availability: Poor (many gaps), Good (some gaps), Excellent (few, if any gaps).
* All offshore archipelagos and the northern islands off mainland Norway† Novaya Zemlya, Franz Josef Land, Severnaya Zemlya, Novosibroskiye Ostrova, and Wrangel and Gerald Islands

26
Region CountryIntroduced & potentially invasive
vertebrates present on islandsThreatening
process identified Notes Resource
Canadian Arctic islands
CanadaMammals: rodents (Rattus sp.); other information not found
Unknown
Information based on a download of "Rattus" data on islands in the Canadian Arctic (presumed non-native)
usgs Biodiversity Information Serving Our Nation (bison)
Svalbard & Jen Mayen
ArchipelagosNorway
Mammals: sibling vole (Microtus levis), house mouse (Mus musculus) on Svalbard; None on Jan Mayen
None or Unknown
Vole and mouse found on islands with settlements, no major threats have been identified
Norway Polar Institute; spitzbergen.de; personal communication
Solvær & Røst Archipelagos
Norway Specific information not found
Invasive and other problematic species and genes occurring on 10–49% of the ibas on these archipelagos
BirdLife International iba
Wrangel Island RussiaCaribou (Rangifer tarandus), musk ox(Ovibos moschatus)
Can cause severe overgrazing and nest destruction, particularly of snow geese
Settlers introduced domestic reindeer in the 1950s and Musk Ox from Canada in 1975
unesco World Heritage
Aleutians and Bearing Sea Islands
U. S.
Mammals: foxes (Vulpes sp.), feral sat (Felis cattus), mice (Mus), rats (Rattus), ungulates, rabbits and hares (Lagomorphs), ground squirrel (Sciuridae)
High risk to islands by Arctic fox, Domestic cat, house mouse, rats,
Alaska Center for Conservation Science; Aleutian and Bering Sea islands (absi) Landscape Conservation Cooperative (lcc)
Iceland Iceland
American mink (Neovison vison), mice (Muss p.), reindeer (R. tarandus), rabbit (Lagomorphs), rats (Rattus sp.) and 8 bird species
Predation, especially on seabirds by mammals
Arctic fox is the only mammal species that has colonized without the aid of man; mink imported for fur farming
Biological diversity in Iceland; Global Register of Introduced and Invasive Species (griis); Arctic Biodiversity Assessment 2013; nobanis
Faroe Islands Denmark
Brown rat (R. norvegicus), house mouse (M. musculus), mountain hare (Lepus timidus; Streymoy Island), domestic cat (F. cattus), house sparrow (Passer domesticus), sheep (Ovis aries), common frog (Rana temporaria; (Nólsoy Island), sporadic introductions of European toad (Bufo bufo) and R. temporaria, domestic bird species (geese, ducks, doves)
Predation, over grazing, domestic bird hybridization with native birds
Eleven of the smallest islands are rat- free, three islands remain hare free (Koltur, Stóra Dímun, Lítla Dímun).
Personal communication, nobanis
Greenland Denmark House mouse (M. musculus), Unknown UnknownPersonal communication,nobanis
Table 2.4 Summarized knowledge of introduced and potentially invasive vertebrates on islands in the Arctic based on a systematic review of available literature, databases, reports, and consultation with experts

27
2.3.1 Data Management SchemaHere we describe a simplified process necessary for building a North American or Arctic islands dataset that can be used to inform conservation prioritization decision-making. We provide a table (Table 2.5) ref-erencing data management strategies (e.g., https://www2.usgs.gov/datamanagement/index.php) and draw on the examples and methodologies used in the tib Database and published in Spatz et al. 2017b.
2.3.2 Mobilization of the Data2.3.2.1 The interoperability of occurrence
datasetsWe recommend each of the critical primary datasets listed in Table 2.1ab as baseline datasets for building a North American or Arctic islands dataset. While each of these individual datasets will provide unique information, they are not currently formatted in a consistent framework for integration into a centralized system that can ultimately be made available for stakeholder use and conservation decision-making. To overcome this barrier and enable interoperability, the following generalized steps are necessary. The outline below follows and builds upon Steps 1–3 in the data management schema found in Table 2.5. In addition to this outline, Appendix 5 provides summarized instructions for building interoperability within and among each critical primary dataset.
Steps to Interoperability1. Review the metadata for each dataset, paying at-
tention to:a. The geographic parameters of the dataset
(datum, projection, coordinate system, etc.);b. How source data were checked and made
suitable for use;c. How dataset parameters correlate with final
data structure parameters established.2. Conduct a quality control process for each dataset
a. Develop a set of quality goals and specific cri-teria against which data are evaluated.
b. Validate the data in each dataset for spatial and subject accuracy, consistency, and quality. Follow data management guidelines for how to perform a standard quality control process to detect issues (and potentially repair data issues) and document caveats. This process will be best accomplished by the data man-agers from each dataset.
c. It will be important that each extraction and validation step is recorded to encourage un-derstanding and repeatability.
3. Process and standardize the dataa. Transform data into desired file format (e.g.
points or polygons, shapefiles)b. Subset data based on data requirements
i. Remove records that do not meet data requirements. For example:
• taxonomy (e.g. including only terrestrial vertebrates);
• age of the record (e.g., excluding data older than 50 years old);
• observation type/basis of record (e.g. only include specimen and observation records, exclude fossil records);
• data quality (e.g. “confirmed”).ii. Remove data parameters (columns) that
are not of interest.4. Extract and tag islands
a. Subset island data from non-island explicit occurrence datasets and make it spatially consistent with the gid.i. Define a consistent geographic extent-
consult the metadata for each dataset and cross-check it against the gid.
ii. Spatially display the dataset in its native projection then re-project to match with the gid.
iii. Define spatial distance tolerance to join occurrence records to islands.
• For example, a buffer of about one square km around each island could ensure occurrence points with inaccurate coordinates retained.
• This estimate will require initial examination of the data to understand the degree to which spatial tolerances are needed and to inform an a priori strategy for error-checking, including manual checks of the data.
iv. Conduct a spatial join with the gid where each occurrence record is matched with a unique island identification code from the gid.
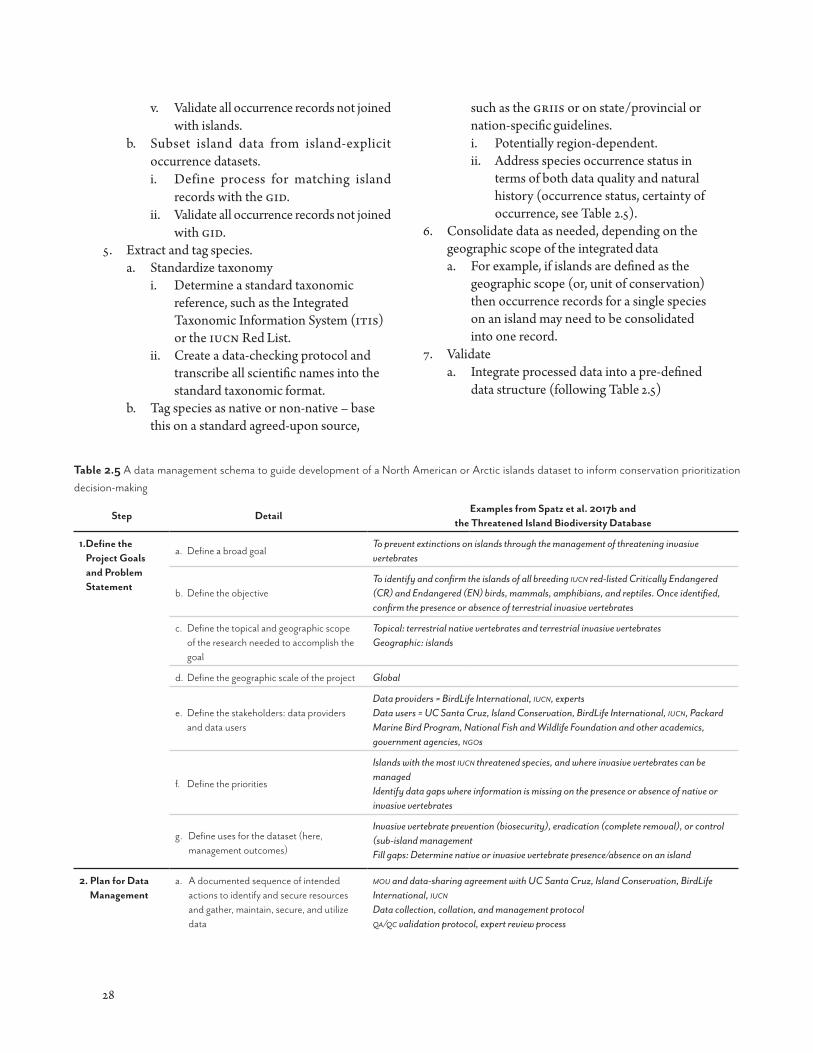
28
v. Validate all occurrence records not joined with islands.
b. Subset island data from island-explicit occurrence datasets.i. Define process for matching island
records with the gid.ii. Validate all occurrence records not joined
with gid.5. Extract and tag species.
a. Standardize taxonomyi. Determine a standard taxonomic
reference, such as the Integrated Taxonomic Information System (itis) or the iucn Red List.
ii. Create a data-checking protocol and transcribe all scientific names into the standard taxonomic format.
b. Tag species as native or non-native – base this on a standard agreed-upon source,
such as the griis or on state/provincial or nation-specific guidelines.i. Potentially region-dependent.ii. Address species occurrence status in
terms of both data quality and natural history (occurrence status, certainty of occurrence, see Table 2.5).
6. Consolidate data as needed, depending on the geographic scope of the integrated dataa. For example, if islands are defined as the
geographic scope (or, unit of conservation) then occurrence records for a single species on an island may need to be consolidated into one record.
7. Validatea. Integrate processed data into a pre-defined
data structure (following Table 2.5)
Table 2.5 A data management schema to guide development of a North American or Arctic islands dataset to inform conservation prioritization decision-making
Step DetailExamples from Spatz et al. 2017b and
the Threatened Island Biodiversity Database
1.Define the Project Goals and Problem Statement
a. Define a broad goalTo prevent extinctions on islands through the management of threatening invasive vertebrates
b. Define the objectiveTo identify and confirm the islands of all breeding iucn red-listed Critically Endangered (CR) and Endangered (EN) birds, mammals, amphibians, and reptiles. Once identified, confirm the presence or absence of terrestrial invasive vertebrates
c. Define the topical and geographic scope of the research needed to accomplish the goal
Topical: terrestrial native vertebrates and terrestrial invasive vertebratesGeographic: islands
d. Define the geographic scale of the project Global
e. Define the stakeholders: data providers and data users
Data providers = BirdLife International, iucn, expertsData users = UC Santa Cruz, Island Conservation, BirdLife International, iucn, Packard Marine Bird Program, National Fish and Wildlife Foundation and other academics, government agencies, ngos
f. Define the priorities
Islands with the most iucn threatened species, and where invasive vertebrates can be managed Identify data gaps where information is missing on the presence or absence of native or invasive vertebrates
g. Define uses for the dataset (here, management outcomes)
Invasive vertebrate prevention (biosecurity), eradication (complete removal), or control (sub-island managementFill gaps: Determine native or invasive vertebrate presence/absence on an island
2. Plan for Data Management
a. A documented sequence of intended actions to identify and secure resources and gather, maintain, secure, and utilize data
mou and data-sharing agreement with uc Santa Cruz, Island Conservation, BirdLife International, iucnData collection, collation, and management protocolqa/qc validation protocol, expert review process

29
Step DetailExamples from Spatz et al. 2017b and
the Threatened Island Biodiversity Database
3. Define data structure and metadata
a. Identify each term(s) and standard(s) that will need to be defined and collected to meet the project goals and undertake a prioritization (see Appendix 6 for examples). Delete any unnecessary fields from the input datasets
Subject Terms to be defined and collected
Native species Unique ID, taxonomy, threat status, island location, occurrence status,* year of observation, data quality,* reference(s)
Invasive species Unique ID, taxonomy, island location, occurrence status,* non-native threat status, data quality,* year of observation, reference(s)
Islands Unique ID, Island name, island location, area, county, human population(s), data quality
b. Define data requirements and parameters, including reference ID numbers, data quality, taxonomy, and occurrence status. Where applicable, refer to standards such as Darwin Core Standards and the definitions used in the Threatened Island Biodiversity Database (Appendix 6)
Term Definition
Occurrence status Breeding, migratory, not established, absent
Occurrence type Observation, specimen collection, fossil record, unknown
Reference type Peer-reviewed literature, database, technical report, personal communication, other
c. Develop data tables and interoperability (relationships) among those tables
Table Definitions and relationships
Native species table A taxonomic list of all native species included in the database where 1 record = 1 species
Invasive species table A taxonomic list of all invasive species included in the database where 1 record = 1 species
Island attribute tables
A list of islands and their attributes (name, coordinates, area, etc.) where 1 record = 1 island
Native species on islands table
A list of species presence on islands. Relates tables 1 and 3, where 1 record = 1 species on an island ("native population")
Invasive species on islands table
A list of invasive presence/absence on islands. Relates tables 1 and 4, where 1 record = 1 invasive on an island ("invasive population")
d. Define data structure file formats Tables: Microsoft access database; Spatial mapping: polygons
e. Define how data quality will be assessed and standardized across all terms and within each record
Data quality examples
Definition
Data quality for an occurrence status
Confirmed, suspected/predicted, unknown
Data quality for a native species on
island record
Good, satisfactory, poor, unknown
Table 2.5 continued

30
Step DetailExamples from Spatz et al. 2017b and
the Threatened Island Biodiversity Database
4. Design the Data Collation and Collection Protocol
a. Define the baseline dataset from which all other datasets will be integrated. Extract relevant information based on the desired terms defined above.
Islands = the Global Island DatabaseSpecies = the iucn Red List/BirdLife InternationalInvasives = BirdLife International
b. Create an inter-operability framework for integrating datasets into the baseline dataset defined in step 4a.
Align island locations: Global Island DatabaseAlign scientific names to a standard taxonomic authority: iucn Red List
c. Define how to fill additional knowledge gaps – Conduct a systematic search within descriptive documents and on the web to fill in the gaps remaining – establish key words to use for on-line and document searches
Keywords in all possible relevant combinations: “species name,” “country name,” “archipelago name,” “island name,” “invasive type [i.e. rat],” “eradication,” “management,” “extinction,” “threatened,” “vertebrateIdentify experts to contact to gather new information. Create a data "ask" template and cover letter, establish data-sharing agreements where needed
d. Document effort (metrics) Meta-analytical standards, such as the prisma design
e. Document all references and associate them with each record
Create a standard way for downloading and saving references, at least one per record
5. Data Validation a. Check the quality and accuracy of the data within the database based on established data quality standards by partners/stakeholders
Define the level of accuracy and detail that is acceptable Actionable example: randomly select ~10% of data from each table and check for accuracy and consistency, update remaining rows where applicable
b. Expert review of the data Export the collected data into region or species-specific categories and send to experts for review
Table 2.5 continued
ii. Define qc process for identifying conflicts within a dataset (i.e. multiple occurrences with differing parameter values per island)
c. Validate integrated datasetsi. Define qc process for identifying
conflicts between datasets (i.e. presence/absence breeding status conflicts)
Each of the steps above will serve as a guide for data integration into any format, including an online data portal. As with any dataset, depending on the intended use, a final quality control process should be conduct-ed to validate the accuracy of the spatial information and the subject-based information. Note that while we suggest all data be spatially joined to the gid, the gid itself will also need to be validated for accuracy. This is because the gid was created as a result of a compu-
tational assessment by Open Street Map data, which itself is based on a 1:75,000 Landsat satellite product from the U. S. National Geospatial-Intelligence Agency, and contains inherent errors such as the presence of false islands or incorrectly mapped coastlines which could bring about error in any spatial analysis. Once an island has been matched with the occurrence data, a gid validation process should be undertaken (Island Conservation 2014).
Building Interoperability:An Example Using the BISON Database
The following is an example of how to build interoper-ability within and among primary datasets. We use the bison database as an example of how to extract island and invasive species data, and we discuss the kinds of processes that would need to be addressed to create alignment between bison and other datasets, such as the tib. The bison database contains a wealth of

31
Figure 2.4. Locations of bison R. rattus occurrence records (dark circles) compared to the Global Island Database (red outlined polygons).
species occurrence data, but is not ready to be mobi-lized because these data are not tagged for any island geographies and the database does not distinguish between invasive and native species. These barriers can be overcome to make ready use of existing data. We took preliminary steps to understand the metadata of bison records and to estimate the occurrence data that may be available for islands, and subsequently, for invasive species, as well as to understand what data validation protocols will be necessary. All mammal occurrence records from coastal states and provinces were extracted from bison and spatially sub- settled to areas of interest by only keeping records within one decimal degree of gid island polygons. This was done to exclude non-coastal (and inherently non-island) occurrence data and to minimize the size of the dataset to be processed. Next, island records were extracted by conducting a spatial join of the occurrence data that intersected with island polygons from the gid. This resulted in over 73,000 records of mammals on 1,137 islands. Next, based on the native distribution of rats (Rattus species), we presumed that all Rattus on islands in the U. S. and Canada (bison’s data scope) were inva-sive. Thus, Rattus species on islands were extracted, re-sulting in 916 records on 76 islands. However, this only represents occurrences that spatially overlapped with the gid, and further validation is required to verify the location of occurrences that do not intersect with gid polygons. Figure 2.4 shows an example of gid island polygons overlaid with R. rattus occurrence records, including three records that do not spatially intersect existing gid island records. A larger spatial tolerance (i.e. a 1km buffer around each island) could be used to match these occurrence records to island polygons. Occurrence records outside of these spatial tolerances would need further quality control and validation.
Once these remaining records are validated, addi-tional parameters derived, and data gaps filled, bison occurrence records will need to be integrated with existing datasets. For example, the tib identifies 56 islands in the United States and Canada that contain Rattus species and very few of these records occur with-in bison. Yet in a handful of cases where there was overlap, the data parameters of the occurrence records will need to be merged with appropriate attribution to the original occurrence records from each dataset (i.e. the appropriate references should be cited).
Spatial location and invasive species tagging are only two of the many data parameters that will need to be
processed for building interoperability between data-sets. Additional processes will consider the inclusion or exclusion of specific data types (such as occurrence record type or year of record), natural history, and data quality, which will undergo similar validation and con-flict resolution processes. Specific to bison, the current (vs. historic) status of native and invasive species will need careful validation, as some datasets, like the tib, represent presence/absence of a species on an island as opposed to continuous occurrence records at various points in time. Furthermore, some occurrence records, particularly for birds, may represent an observation of a species identified on or near an island rather than as a resident breeding individual. It will be important to define and distinguish between these natural history patterns and the type of occurrence data to be main-tained. Finally, the assessment of data quality of each of the records will be important for interoperability as it will allow managers to differentiate between good and bad data. For example, decisions should be made around how to treat records coming from citizen sci-ence groups versus a record that comes from a funded monitoring program conducted by experts.
Integration into an Online Data PortalEach of the steps above contributes to the process necessary for building an interoperable data system

32
that could be hosted online as a data portal and made accessible to stakeholders and the public. Data portals provide access to a variety of data sources and come in a variety of formats. For example, gbif hosts over 38,000 datasets and nearly a billion occurrence records from around the world. Data owners provide open access to their datasets through a Creative Commons license and gbif provides a tool to upload data within a common standards framework that enables occurrence data and metadata to be integrated together into a single system.
Importantly, to create an interoperable data portal out of the critical primary datasets identified in this report requires clear and transparent expectations with data providers regarding data-sharing terms of agree-ment for data users (mous, creative common licenses), common standards for data definitions, quality, valida-tion, and financial support for maintaining and updat-ing the data product as publicly available. Inherent in this system is the underlying assumption that the portal design and utility is supported by stakeholders and that data owners are in agreement with sharing policies, including appropriateness of displaying distributions of rare and extremely sensitive species.
2.3.2.2 Transcribing descriptive information into an analytical format
While the critical primary occurrence datasets will serve as a foundational data layer for a North American or Arctic islands dataset, data gaps in the distribution of native or invasive species will remain. Yet, many of these gaps can be filled with information that has al-ready been assembled. These resources mainly include descriptive documents such as reports, literature, dis-sertations and factsheets. For example, information on native species distributions and place-based threats by invasive species can be found within iucn species factsheets, the Canadian Wildlife Service’s technical report series, and the U. S. Comprehensive Conser-vation Plans for National Wildlife Refuges and 5-year reviews for species listed as Threatened or Endangered by the usfws.
The information contained within these docu-ments should be mobilized from these formats and transcribed into a North American or Arctic islands database. To do this, the island database should already be assembled, and primary occurrence datasets inte-grated and validated; these are the baseline datasets from which all other datasets will be integrated (Table
2.5). Once this is complete, each descriptive resource identified as a critical supporting document should be read through and relevant data should be extracted. Additionally, an inquiry should be sent to the institu-tions or individuals that have managed or written these documents to determine whether raw data is available and to gain permissions for their use.
Finally, an additional search for information within the published and gray literature could be important for identifying resources missed and to keep up with new publications that come out over time.
Examples of the steps for finding these kinds of documents and searching within them are outlined briefly in Figure 2.1 with greater detail in Table 2.5. It is important to emphasize that these kinds of systematic literature reviews, which should also be supported by expert solicitation, are non-trivial. They require time al-lotted to scouring the internet and communicating with experts to find as many documents as possible, extract-ing and translating the information into a standard data system, and then communicating with experts again to validate and confirm the accuracy of the translation. For example, for the tib database, this effort was undertak-en to identify all of the current and historic breeding islands of over 1,200 threatened species as well as the invasive species that occurred on each of these islands. This substantial undertaking resulted in the review of approximately 2,000 documents and communication with more than 600 experts over a 4-year period. Thus, before conducting an additional research effort, it will be important to first create a data management plan (Table 2.5) and interoperable data system framework, populate the system with the critical datasets, and high-light gaps that still need to be filled and which could require an additional systematic review process and expert review to fill these gaps.
2.3.3 Filling Additional Knowledge Gaps: Engagement with Content Experts
As mentioned previously, expert consultation is an in-tegral component of both the data collation and data checking process. Indeed, engagement with content experts is a necessary strategy to fill geographic or subject-based knowledge gaps when few to no dataset can otherwise be found. For example, within North America, and specifically the U. S., consultation with expert working groups, like those managing offshore seabird colonies across New England, Washington, and

33
Oregon, will create opportunities for sharing inciden-tal and observational knowledge that is unpublished, especially on invasive species. Similarly within the Arctic, engagement of experts from the Faroe Islands will enhance opportunities for data collation, since available datasets on species distributions is lacking. When we reached out to a Faroe Islands expert, he informed us that no reliable databases existed for na-tive or invasive vertebrates, yet he provided us with tremendous narrative detail on species distribution and threat information, filling critical data gaps about the region (Table 2.4).
2.4 Summary
We evaluated 95 and 70 resources with data that were applicable to North American and Arctic islands, re-spectively. Of these, 10 and 9 datasets contained im-portant baseline data on species occurrences and also met criteria for ready mobilization into an interopera-ble North America or Arctic data system. In addition to these, we identified 15 and 18 supporting resources which may prove critical to supporting the enhance-ment of an islands dataset or portal that could be used for conservation decision-making. These resources in-clude invasive species taxonomy, native species threat status, national priorities, and island locations. With-in North America, the majority of island occurrence records were available for the west coast and Alaska, with birds being the most common taxon document-ed. Within the Arctic, the archipelagos of the Aleutian and Bearing Sea Islands (Alaska, U. S.) and Svalbard (Norway) contained the most island explicit occur-rence records. Birds were the most common taxon documented, with distribution of common native mammal species also available. Geographic and sub-ject-based data gaps for island explicit occurrences and designations of invasive species presence/absence were evident throughout both regions, but more so in the Arctic. Further, several barriers prevent interoperabil-ity of current datasets, including differences in spatial metadata and core standards (including distinguishing between native and non-native species), that would define common taxonomic and data field definitions.
2.5 Recommendations for U. S. Island Decision-Makers
Effective planning for island restoration in the U. S. is limited by island-specific data available on native and invasive species, and the interoperability of existing datasets to make data uniformly comparable. Next steps and recommendations for nisc members to consider are to help 1) engage appropriate stakeholders within the U. S., and ultimately within the North American and Arctic regions, to identify key conservation goals and purposes for an inter-operable data system, 2) follow a data management schema to guide development of an islands dataset and subsequent data portal includ-ing the creation of a data management plan, mou with data providers, dataset and portal structure, and meta-data, 3) build interoperability between those critical datasets identified, allowing integration into a central dataset and subsequent data portal, including island characteristic datasets, and, 4) transcribe information from descriptive supporting documents (e.g. technical reports) and consult with experts to fill data gaps.
34
Prioritization is necessary for conserva-tion decision-making, requiring identification of where to achieve the most effective allocation
of time or resources to prevent the loss of species and habitats (Leader-Williams et al. 2013). A wide range of resources and case studies are available in the literature guiding application of prioritization decision-making (Carwardine et al. 2012; Jenkins et al. 2013; Wilson et al. 2010; Wilson et al. 2009; Wilson et al. 2006), includ-ing a review of applications for eradication of invasive vertebrates on Arctic islands (Veatch 2017). Within this section our objectives were to 1) recommend a prioriti-zation schema that could serve as a tool for prioritizing islands for eradication projects at the country level (i.e. the United States) and ultimately to aid prioritization of islands across North America and the Arctic regions that will have the greatest ecological impact, and 2) identify a preliminary list of priority islands in North America and the Arctic based on this schema.
To inform this first goal we summarize previous efforts to prioritize vertebrate eradication projects on islands, including a review of criteria utilized. Based on this summary, we provide a basic tool for implementing a prioritization effort that would also maximize the value and utility of the primary occurrence datasets and supporting resources identified in Section 2. To inform the second goal we review potential unifying problem statements for prioritizations at the country-level and ultimately at the North American and Arctic scale. The preliminary list is intended to inform further dis-cussion around how U. S. decision-makers could help contribute to and advance a prioritization that could be undertaken at the larger scales.
3. A Prioritization Tool for Islands

35
3.1 Summary of Previous Prioritizations
To inform a prioritization schema that will serve as a logical framework for prioritizing islands in North America and the Arctic for invasive vertebrate eradica-tions, we summarize ten previous prioritization efforts in Table 3.1. Due to their widespread distribution and known threat to native species, invasive mammals are a common focus of most eradication projects to date. Three of the ten prioritizations overlap with North American geographies: Western Mexico, National Wildlife Refuges on islands managed by the usfws, and British Columbia. Many of these studies and their goals are presented as case studies, and each of these efforts have made advances in prioritization method-ologies, including the scale of potential application (from regional to global), inclusion of cost (Brooke et al. 2007), consideration of post- eradication reinvasion by swimming (Capizzi et al. 2010) or by anthropogenic (human mediated) sources (Harris et al. 2012), poten-tial climate change impacts (Spatz et al. 2017), and the likelihood of anticipating cascading ecological effects (Helmstedt et al. 2016).
Defining a problem statement is a central tenet un-derlying any prioritization process. For the ten efforts focusing on invasive vertebrate eradication on islands in Table 3.1, the minimum information used to gen-erate problem statements include specification of 1) geography to be assessed (both in scope, but also the minimum conservation unit such as islands or archi-pelagos), 2) the native species to benefit (including conservation status of species and how attribution to each island is considered), and 3) invasive vertebrates to be assessed (primarily mammals), thus informing the threat to be alleviated and eradication management actions to be considered (which typically entails asking whether a whole-island eradication operation is feasible based on available techniques).
Across the ten prioritization examples, a range of criteria was applied, all of which were dependent on practical data that can be obtained and rigorous as-sumptions being made by stakeholders. For all projects, the minimum set of criteria needed to address the prob-lem statement included conservation value of the ben-eficiary species, invasive species type and threat, island characteristics, and a measure of technical feasibility. Other criteria considered by individual projects include cost, socio-political feasibility, reinvasion risk, and re-silience to climate change impacts. A full discussion of
these prioritization criteria, including use in previous prioritization exercises, approach for quantification, and applicability for prioritization efforts for a North American and Arctic scale are provided in Appendix 7.
Several different prioritization schemas are evident in Table 3.1 and reflect approaches considered as “rank and sort” or portfolio selection, as discussed by Ve-atch (2017). Hansgate et al. (2008) applied a rank and sort schema relying on a broad set of data parameters, which required land managers in each usfws region to provide responses based on expert opinion and stan-dardized ordinal ranks. Similarly, in Mexico, ranks were used by Latofski et al. (2014) to identify alternative portfolios based on the most important islands for conservation value and most strategic value (taking into account cost, feasibility, and reinvasion). This ex-ercise had a targeted geographic scope and combined a tractable approach of utilizing the same expert opinion for cost, reinvasion risk, and feasibility for all 36 islands assessed, allowing for a comprehensive prioritization schema to be developed specific to that region. Both Helmstedt et al. (2016) and Donlan et al. (2015) ap-plied a schema based on Return on Investment (roi) – how much value can be obtained for a fixed budget or smallest investment – to identify a portfolio of islands. These case studies used a sample size of n=4 and n=42 islands, respectively, and applied rigorously defensi-ble data assumptions given the targeted scope within one political geography. For an Arctic prioritization of invasive vertebrate eradications on islands, Veatch (2017) identified that portfolio approaches, akin to that described by Helmstedt et al. (2016), would offer the greatest conservation benefit.
For each prioritization example in Table 3.1, a trade-off is evident between the precision of information available against the geographic scale of the exercise. Typically, those efforts with localized spatial extents (i.e. within one political area, such as New Caledonia [Harris et al. 2012]) can define more targeted objectives and assumptions, because factors such as cost, regulato-ry environment, and experience with eradications will be held constant. In particular, the prioritization efforts at this scale will be useful in informing country-wide conservation decisions, and will be useful within a U. S. context. In contrast, studies at the global or multi-re-gional scale are less able to make specific assumptions and are inherently assessed at a much coarser scale.
The work developed by Brooke et al. (2007), which was expanded by Dawson et al. (2014) and used in part

36
Study Goal* Scope and Scale
No. of islands
assessed
Number of islands identified
Native resources assessed
Invasive species assessment
Brooke et al. (2007)
Identify global priority islands to undertake invasive mammal eradications and benefit globally threatened birds.
Islands at a global scale
367 270
130 globally threatened birds based on iucn Red List on island
Presence of ungulates (primarily goats), carnivores (primarily cats, dogs, mongooses), rodents, rabbits, birds on each island
Capizzi et al. (2009)
Identify most important and cost-effective Italian islands to undertake ground based black rat eradications and benefit Cory's shearwater and Yelkouan Shearwater
Islands at a country scale (Italy)
58 14
Cory’s shearwater and yelkouan shearwater colonies on island
Black rat presence / absence on each island
Ratcliffe et al. (2009)
Identify priority eradication unit (collections of islands) for eradication of black/brown rats using ground-based methods to benefit three seabird species
Eradication units (based on overlap of potential Brown rat swimming distance) at a country scale (UK)
274 eradication
units
19 eradication
units
European and Leach’s storm petrels, Manx shearwaters presence and habitat on island
Black rat, brown rat presence or absence in eradication units
Harris et al. (2012)
Identify the most important eradication units (collections of islands), that are secure from reinvasion, where rodent eradication can benefit endemic birds and seabirds
Eradication units (based on overlap of rodent swimming distance between islands) at a country scale (New Caledonia)
240 eradication
units
Top 50 eradication
units
Important Bird Areas overlapping with islands
Black/brown/Pacific rat, mouse – presence not assessed but assumed
Dawson et al. (2014)
Identify priority islands in UK Overseas Territories to undertake invasive vertebrate eradications and protect globally threatened birds, mammals, reptiles, amphibians
islands at a global – country scale (globally distributed overseas territories, UK)
2499 191
Presence of breeding distributions of Globally threatened birds, mammals, reptiles, amphibians, plus important seabird colonies on island
Invasive vertebrates (primarily mammals) presence on island (confirmed, suspected, or absent)
Donlan et al. (2014)
Identify the most cost-effective portfolio of islands to undertake invasive mammal eradication for greatest seabird benefit in British Columbia, Canada
islands at a regional scale (British Columbia)
42 25
Breeding numbers of six seabird species with strong evidence of invasive mammals
Presence or absence of black rat, Norway rat, raccoon, and mink on island
Latofski-Robles et al. (2014)
Identify the highest priority islands to undertake invasive mammal eradication to benefit native species on Western Mexico islands, including consideration or reinvasion risk.
islands at a regional scale (Western Mexico)
36 29
Presence of endemic species, important seabird nesting colonies, species on Mexico Endangered species list or iucn Red List, overall species richness on island
Presence / absence of black rat, brown rat, cat, mouse, squirrel, dog, goat, rabbit, deer, donkey, horse on island
Table 3.1 List of prioritization efforts for eradication of invasive mammal eradication on islands. When goals were not specified in the paper they were deduced based on parameters assessed

37
Study Goal* Scope and Scale
No. of islands
assessed
Number of islands identified
Native resources assessed
Invasive species assessment
Helmstedt et al. (2015)
For a fixed budget, identify which invasive mammal species eradications on four islands will lead to the greatest threatened species benefit
islands at a country scale (Australia)
4 4
Based on Australian and Global conservation status (20 bird and mammal species)
Presence / absence of rats, cats, mice, sheep, goats, rabbits on island
usfws (2009), Hansgate et al. 2008
Prioritize usfws islands where invasive species removal (control or eradication) might have significant conservation benefits
islands at a country – regional scale (U. S., National Wildlife Refuges)
62 Islands /archipelagos
62 Islands / archipelagos
Presence of native species (primarily vertebrates) on island
Presence / absence of invasive species, including mammals but also invertebrates (ants) and plants
Spatz et al. (2017)
Identify global priority islands to where invasive mammal eradications, or preventing invasion of invasive mammals, and benefit globally threatened seabirds, and be secure against projected sea level rise
islands at a global scale
713
397 islands for biosecurity
priority, 249 islands for eradication
Presence of CR, EN or VU seabirds breeding on islands
Confirmed, suspected or data deficient presence / absence of Invasive mammals at an island scale
in Spatz et al. (2017a), offers a useful basis for develop-ing a prioritization schema to be applied at the North America and especially the Arctic scale. These examples use globally available information on species conser-vation status and island attributes to inform the prior-itization effort and avoid applying parameters such as cost, which are more accurately assessed at the country or regional level.
Nonetheless, the central tenants from these prior-itizations are applicable for estimating conservation value and need at any geographic scale. Dawson et al. (2014) identified eradication benefit at an island scale by calculating the difference between potential and realistic conservation value. Potential conservation val-ue is the sum of conservation value and impact from all invasive mammals, and realistic conservation value is the same but for only those invasive mammals that can feasibly be removed. The calculated difference be-tween the two offers a way to measure the benefit of any eradication and to compare values between islands to produce a ranked list (see Appendix 8 for a schematic). This simplified approach offers the most flexibility for stakeholders and maximizes the value of the primary occurrence datasets and supporting resources identi-fied in Section 2. This approach is not overly prescrip-tive and can be reviewed by stakeholders for further consideration of feasibility at a regional or individual
island scale. We thus consider this the most appropriate basis for developing a prioritization tool for identifying priority islands for invasive vertebrate eradication at both the country scale (i.e. within the U. S.) and at the larger North American or Arctic scales.
3.2 Designing a Prioritization Schema
Here we provide a prioritization schema that builds on the data management steps provided in Section 2.3, and a starting point for U. S. decision-makers to contextual-ize how to prioritize islands for invasive species eradica-tion. This schema is based on established prioritization methods (e.g. Table 3.1). We provide examples of each of the steps (in italics) based on elements in Dawson et al. 2015 and Spatz et al. 2017a. While these examples draw from datasets and priorities aimed to identify is-lands at a global scale, this process can be adapted for any of the datasets within the data mobilization section and from a country-level perspective.
3.3 Potential Problem Statements for North America and the Arctic
Identifying a well-defined prioritization objective is the first step in developing a possible prioritization sche-ma. In this section, we provide examples of problem
Table 3.1. continued
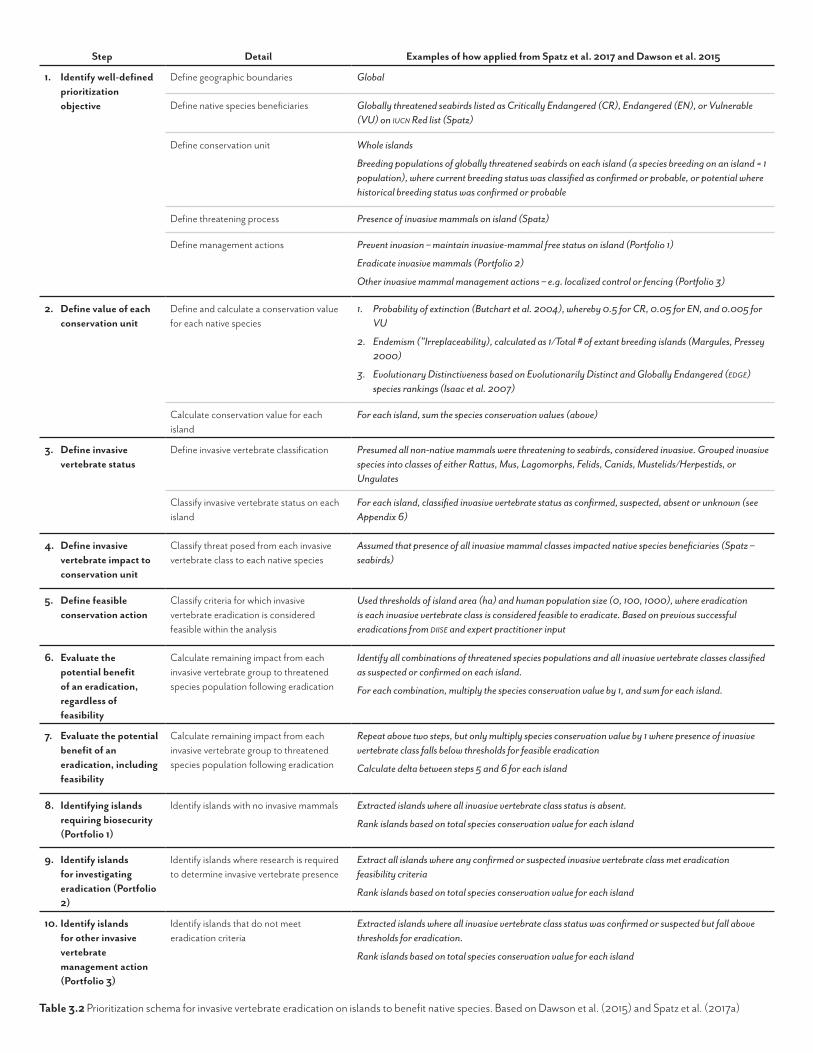
Step Detail Examples of how applied from Spatz et al. 2017 and Dawson et al. 2015
1. Identify well-defined prioritization objective
Define geographic boundaries Global
Define native species beneficiaries Globally threatened seabirds listed as Critically Endangered (CR), Endangered (EN), or Vulnerable (VU) on iucn Red list (Spatz)
Define conservation unit
Whole islands
Breeding populations of globally threatened seabirds on each island (a species breeding on an island = 1 population), where current breeding status was classified as confirmed or probable, or potential where historical breeding status was confirmed or probable
Define threatening process Presence of invasive mammals on island (Spatz)
Define management actions
Prevent invasion – maintain invasive-mammal free status on island (Portfolio 1)
Eradicate invasive mammals (Portfolio 2)
Other invasive mammal management actions – e.g. localized control or fencing (Portfolio 3)
2. Define value of each conservation unit
Define and calculate a conservation value for each native species
1. Probability of extinction (Butchart et al. 2004), whereby 0.5 for CR, 0.05 for EN, and 0.005 for VU
2. Endemism ("Irreplaceability), calculated as 1/Total # of extant breeding islands (Margules, Pressey 2000)
3. Evolutionary Distinctiveness based on Evolutionarily Distinct and Globally Endangered (edge) species rankings (Isaac et al. 2007)
Calculate conservation value for each island
For each island, sum the species conservation values (above)
3. Define invasive vertebrate status
Define invasive vertebrate classification Presumed all non-native mammals were threatening to seabirds, considered invasive. Grouped invasive species into classes of either Rattus, Mus, Lagomorphs, Felids, Canids, Mustelids/Herpestids, or Ungulates
Classify invasive vertebrate status on each island
For each island, classified invasive vertebrate status as confirmed, suspected, absent or unknown (see Appendix 6)
4. Define invasive vertebrate impact to conservation unit
Classify threat posed from each invasive vertebrate class to each native species
Assumed that presence of all invasive mammal classes impacted native species beneficiaries (Spatz – seabirds)
5. Define feasible conservation action
Classify criteria for which invasive vertebrate eradication is considered feasible within the analysis
Used thresholds of island area (ha) and human population size (0, 100, 1000), where eradication is each invasive vertebrate class is considered feasible to eradicate. Based on previous successful eradications from diise and expert practitioner input
6. Evaluate the potential benefit of an eradication, regardless of feasibility
Calculate remaining impact from each invasive vertebrate group to threatened species population following eradication
Identify all combinations of threatened species populations and all invasive vertebrate classes classified as suspected or confirmed on each island.
For each combination, multiply the species conservation value by 1, and sum for each island.
7. Evaluate the potential benefit of an eradication, including feasibility
Calculate remaining impact from each invasive vertebrate group to threatened species population following eradication
Repeat above two steps, but only multiply species conservation value by 1 where presence of invasive vertebrate class falls below thresholds for feasible eradication
Calculate delta between steps 5 and 6 for each island
8. Identifying islands requiring biosecurity (Portfolio 1)
Identify islands with no invasive mammals
Extracted islands where all invasive vertebrate class status is absent.
Rank islands based on total species conservation value for each island
9. Identify islands for investigating eradication (Portfolio 2)
Identify islands where research is required to determine invasive vertebrate presence
Extract all islands where any confirmed or suspected invasive vertebrate class met eradication feasibility criteria
Rank islands based on total species conservation value for each island
10. Identify islands for other invasive vertebrate management action (Portfolio 3)
Identify islands that do not meet eradication criteria
Extracted islands where all invasive vertebrate class status was confirmed or suspected but fall above thresholds for eradication.
Rank islands based on total species conservation value for each island
Table 3.2 Prioritization schema for invasive vertebrate eradication on islands to benefit native species. Based on Dawson et al. (2015) and Spatz et al. (2017a)

39
statements that could be applied to the development of any North American or Arctic islands dataset and subsequent prioritization process.
3.3.1 North American IslandsThe usfws is a signatory to a Letter of Intent in the Subject Matter of Conservation and Restoration of the Insular Ecosystems of the Mexican United States, United States of America, and Canada (Trilateral Committee for Wildlife and Ecosystem Conservation and Management 2014), which established the Trilateral Island Initiative (tii), a project of the Trilateral Committee for Wildlife and Ecosystem Conservation and Management (trilat.org). Two of the four tii goals are: 1) enhance on-the-ground conservation and restoration of islands and their surrounding marine waters, and 2) improve coordination on island-related natural resource issues of mutual interest to the tii. A unique quality of the tii is a focus on resources that are shared across the three countries of North America. Thus, three possible avenues for creating a problem statement shared by the U. S., Mexico, and Canada could focus on 1) globally threatened species, 2), nationally threatened species (e.g. U. S. Listed Endangered Species), and/or 3) shared species (i.e. migratory species such as seabirds). Here we describe the opportunities and challenges of each approach and the availability of data.
3.3.1.1 Globally threatened speciesGlobally threatened species are those assessed by the iucn for the Red List of Threatened Species, with a status of Critically Endangered, Endangered, or Vul-nerable (iucn 2016). Not all species have been assessed by the iucn for conservation status, but terrestrial ver-tebrates are the most comprehensive group. Globally threatened species are present in all three countries of the tii, with 1,192 in Mexico, 1,544 in U. S. and 146 in Canada (based on iucn Red List version 2017). For birds, mammals, reptiles, and amphibians classified as Critically Endangered (CR) or Endangered (EN), as well as, seabirds classified as Vulnerable (VU), there is well-documented and collated evidence of species presence on islands, invasive mammal impacts on those islands, and the threats from these invasive mammals to these highly threatened vertebrates (Spatz et al. 2017). These data are collated in the tib database using a stan-dardized method to allow for consistent assessment for conservation value on each island and the poten-
tial benefit from any eradication of invasive mammal. The tib identifies 170 islands and 105 species present in these three countries.
In general, more highly threatened species are pres-ent in tropical regions (Spatz et al. 2017), meaning we can expect the lower latitude regions of the U. S. (partic-ularly Pacific islands) and Mexico to have more islands and species that would benefit from invasive mammal eradication projects that use a problem statement fo-cusing on these species. Two key disadvantages to a tii problem statement using globally threatened species are: 1) Canada is not well represented because only two globally threatened species occur on islands in Canada, and 2) a global risk conservation status does not necessarily mean a species is recognized as at-risk nationally, which may be an important precursor to providing government support for eradication projects aimed at protecting threatened species. For example, the ashy storm-petrel (Oceanodroma homochroa) is considered endangered at a global scale but is not on the U. S. endangered species list.
A potential problem statement for a tii prioritiza-tion using globally threatened species may look like:
Identify the most important islands within the U. S., Mexico, and Canada where eradication of invasive mammals is feasible and can benefit breeding pop-ulations of globally threatened birds, mammals, reptiles, or amphibians.
3.3.1.2 Nationally threatened speciesThe U. S., Mexico, and Canada have national-scale pol-icies and processes managed by federal agencies for identifying threatened species. In the U. S., these are covered under the Endangered Species Act, of which the usfws is the responsible agency. In Mexico these policies and processes are the Norma Oficial Mexicana nom-059-ecol-2001 and conabio, and in Canada, the Species at Risk Public Registry by cosewic. Each country has a broad range of assessments for verte-brates, invertebrates, and plants, but they are not nec-essarily comprehensive. About 500 species are classified as Threatened or Endangered in Canada (http://www.registrelep- sararegistry.gc.ca/sar/index/default_e.cfm), ~2400 species in the U. S. (https://www.fws.gov/endangered), and >2,000 species in Mexico are classified as Endangered, Threatened, Probably Extinct in the Wild, or Subject to Special Protection (http://

40
www.conabio.gob.mx/conocimiento/ise/fichas/doc-tos/introduccion.html).
Within the U. S. and Canada, data on species dis-tributions are available within national, state, or pro-vincial registries or in technical reports. This includes generalized knowledge of native insular status, however, detailed knowledge of breeding status or presence of threatening invasive mammals is not typically consoli-dated at an island scale, limiting identification of unique islands where species breed and are threatened by in-vasives. An exception to this is the occurrence datasets highlighted in Section 2.1, including conabio’s Na-tional Biodiversity Information System, usfws’ island prioritization project, and Bird Studies Canada’s Bird and Biodiversity Areas and invasive species databases. A potential problem statement for a tii prioritization using nationally threatened species may look like:
Identify the most important islands within the U. S., Mexico, and Canada where eradication of invasive mammals is feasible and can benefit breeding pop-ulations of nationally threatened birds, mammals, reptiles, or amphibians.
3.3.1.3 Shared speciesMany North American species depend on habitat in more than one country, and this may provide a strong basis for crafting a prioritization objective unique to the intent of the tii. Birds would likely feature strongly in this approach, and particularly seabirds and migratory birds. Seabirds present obvious focal species for a tri-lateral prioritization objective. Globally, approximately 346 seabird species have been identified, with almost 100 considered globally threatened; invasive species im-pacts are a primary threat (Croxall et al. 2012). Seabirds are highly dependent on islands for nesting habitat, and commonly evolved in the absence of mammalian predators; thus many seabirds are highly vulnerable to invasive mammals on islands ( Jones et al. 2008). Seabirds breeding on very small islands may present the most promising candidates for protection through invasive mammal eradication (Spatz et al. 2014). These species respond well to invasive mammal eradication (Brooke et al. 2017; Jones et al. 2016). The U. S., Mex-ico, and Canada feature among the top 20 countries that support the highest diversity of seabirds within terrestrial or marine habitat, with Mexico having 110 species (28 as Critically Endangered (CR), Endangered
(EN), Vulnerable (VU), or Near Threatened (NT), Canada having 101 (24 as EN, VU, or NT) and the U. S. having 147 (42 as EN, VU, or NT) (BirdLife Interna-tional 2018).
Data are available for shared species on a multi-na-tional scale within the tib (threatened species only), as detailed above. For other species not considered globally threatened, several regionalized or state scale databases are available that record seabird distribu-tions on an island-scale, however, not consistently, and often with different standards for recording presence on islands. For example, the presence of threatening invasive mammals is documented in some databas-es (e.g. conabio) and not others (see Appendix 5a). Nonetheless, an example of a seabird species that would be considered within a shared species portfolio is the Cassin’s auklet (Ptychoramphus aleuticus) which breeds and forages within all three countries. Species like the black-vented shearwater (Puffinus opisthomelas) could also be considered, because they breed only in Mexico, but non-breeders occupy the California current. The Laysan albatross (Phoebastria immutabilis) is another example, with breeding in Mexico and the U. S. and whose foraging is known to extend into Canadian wa-ters. A potential problem statement for a tii prioriti-zation using shared species may look like:
Identify the most important islands within the U. S., Mexico, and Canada where eradication of invasive mammals is feasible and can benefit species with major life histories that overlap with two or more of the three North American countries.
3.3.2 Arctic IslandsOne of the three goals of the Arctic Invasive Alien Species Strategy and Action plan is to improve the knowledge base for well-informed conservation ac-tions. Here, a problem statement could also focus on resources that are shared across Arctic countries, as op-posed to resources that are unique to only one country. Two possible avenues for creating a problem statement shared by Arctic nations are a) shared species and b) BirdLife International’s Important Bird Areas. Here we describe the opportunities and challenges present in each approach and the availability of data.
3.3.2.1 Shared speciesMany species depend on habitat shared by multiple
41
countries in the Arctic, and this may provide a strong basis for crafting a unique Arctic prioritization objec-tive. The two native terrestrial vertebrate groups with the most available distribution information are mam-mals and birds. The Arctic Biodiversity Data Services (abds) website, hosted by caff and Norway’s Polar Institute, provide the most consistent information available for Arctic mammals, particularly for caribou (Rangifer tarandus), the most common arctic-wide species. Birds would likely feature strongly in this ap-proach, particularly seabirds and migratory birds. As across the North American regions, seabirds present obvious focal species for an Arctic prioritization objec-tive. Many pan-Arctic and or country-scale databases detail distribution of seabirds on an island-scale (e.g. The International Breeding Conditions Survey on Arc-tic Birds dataset, Circumpolar Seabird Databases; see Appendix 5b).
Information on the presence of invasive mammals on Arctic islands that house nationally shared species and on the relative impact of invasive mammals to na-tive species is severely lacking. This lack of information represents one of the greatest limitations for developing a tractable prioritization goal at present. However, with that data gap filled (see Section 2.3), an effective pri-oritization objective could be developed. An example of such an approach may be quantifying the diversity of seabird species on an island or the relative value of colonies based on colony size plus invasive mammal impact. A potential objective for an Arctic prioritization using shared species may be stated as such:
Identify the most important islands within the Arctic where eradication of invasive mammals is feasible and can benefit the greatest diversity of seabird spe-cies and/or the largest colonies.
3.3.2.2 Important Bird Areasibas represent a standardized classification system to marine, terrestrial, and freshwater ecosystems around the globe. Approximately 12,000 ibas have been identified and offer users a robust prioritization tool to discern where conservation can benefit glob-ally threatened species, important habitat, and large congregations of birds (BirdLife International 2018). For conservation in the Arctic, ibas offer a first step approach to focus a prioritization objective towards bi-ologically critical areas and relevant portfolio of islands
and archipelagos. This approach has the advantage of using universal criteria that would be applicable to all stakeholders in the Arctic.
As with the shared species approach, and the lack of invasive species information is one of the greatest lim-itations for developing a tractable prioritization goal, even with a focused iba lens. Once the gap is filled, an example of a prioritization approach may be ranking the value of ibas based on the relative conservation value and impact from invasive species. A potential objective for an Arctic prioritization using shared spe-cies may look like:
Identify the most important islands and archipela-gos within the Arctic where eradication of invasive mammals is feasible and can benefit ibas.
3.4 Applying the Schema
Within this section, we apply a simplified version of the prioritization schema outlined in section 3.2 to identify priority islands for invasive vertebrate eradication with-in North America and the Arctic, which serves as an example of how to implement a prioritization. We iden-tified a problem statement focusing on globally threat-ened species as beneficiaries as outlined in Section 3.3. The data used for this prioritization come from the tib, which offered the most comprehensive and available data on native and invasive vertebrate occurrences and island attributes, which could inform a prioritization effort. Despite potential challenges in focusing on glob-ally threatened species (e.g. very few of these species occur in the Arctic, limiting this approach), this exercise and subsequent outputs provide a unique perspective on potential island priorities for North America and the Arctic. The resulting short-list of islands can be used to guide further discussion around priorities and to stim-ulate the sharing of additional data that would inform a more robust and broad-scale prioritization of islands to meet conservation needs.
3.4.1 MethodsOur goal was to identify islands with the most breeding populations of globally threatened species where inva-sive mammal prevention of eradication could provide conservation benefit. Our primary data source was the tib. Our scope was breeding populations of terrestrial amphibians, reptiles, mammals, and birds with a status

42
of Critically Endangered (CR) or Endangered (EN) based upon iucn Red List assessments from 2014, plus seabirds with a status of Vulnerable (VU) based on Red List assessments from 2017. Our geographic boundaries were for North American islands (including territories) and Arctic islands that fell within the caff boundaries (Fig. 2.1). Our unit of conservation was a single island, whereby each threatened breeding vertebrate species was considered a single population even if multiple col-onies existed. We only included islands where current breeding status was classified as confirmed, probable, or potential (see Appendix 6) and where historical breed-ing status was confirmed or probable (Spatz et al. 2017). We included island-level assessments that identified whether major invasive mammal groups of rodents (Rattus, Mus), cats, dogs, herpestids or mustelids, ungulates, or lagomorphs were confirmed as absent, confirmed present, suspected present, or subject to ongoing eradication (Appendix 6). We presumed any invasive mammal threatened a native island vertebrate, either directly through predation or indirectly through habitat modification. We accept that this approach may lead to potential false positives, whereby we assume an impact when one is not present. However, we consider this a conservative approach consistent with a desk-top-scale study. We also assumed it necessary to erad-icate all invasive mammals present on the island. This approach is consistent with previous studies, which apply this strategy to avoid unwanted effects (Dawson et al. 2015), such as meso-predator release (Courchamp et al. 2003). We also flagged islands that had reptiles and were less than 100 ha in size. We considered these to be sensitive locations not to be made public to limit potential wildlife trafficking, as advised by the iucn Iguana Specialist Group.
To identify a list of priority islands where invasive mammal eradication may be important, we undertook the following steps: We calculated conservation value by taking the sum of species on islands and considered islands with more populations of threatened species to have higher conservation value. To identify a suite of islands where eradication may be technically feasible, we used two sets of coarse-scale yet commonly used thresholds: 1) island area of 15,000 ha and 100 people, reflecting the largest approximate size of a successful ro-dent eradication to date and a conservative assessment of what may be achievable for human inhabited islands, and 2) 30,000 ha and 1,000 people, which represent the
largest island areas and human populations sizes for rodent eradications currently underway (Appendix 9).
We generated four lists identifying where globally threatened species occur in North America:
• Currently invasive-mammal free islands where biosecurity is a priority
• Islands where invasive mammal eradication may be feasible
• Islands where invasive mammal eradication is currently ongoing
• Islands where invasive mammal status is un-known or incomplete
For the Arctic we produce only one list based on the limited number of Arctic records in the tib.
3.4.2 Results3.4.2.1 North AmericaWe identified 170 islands in the tib: 2 from Canada, 50 from Mexico, and 118 from the U. S. and overseas terri-tories. A total of 314 globally threatened populations of 106 species were identified on these islands. Approxi-mately 42% of species were birds. Islands ranged in size from 0.1 ha (Willows Anchorage Rock in the Channel Islands) to 3,178,500 ha (Vancouver Island). A total of 142 of the 170 islands had <1000 people and 108 were identified as uninhabited. Fourteen islands were iden-tified as sensitive locations based on island size and presence of globally threatened reptiles.
3.4.2.1.1 Invasive-mammal free islands where biosecurity is a priority
We identified 64 islands where rodents (Rattus, Mus), cats, dogs, herpestids or mustelids, ungulates or lag-omorphs were absent. Mexico had 31 islands and the U. S. had 33. The largest island with mammals was Santa Cruz Island in the U. S. Channel Islands (25,000 ha). The highest number of threatened populations on any island was three (i.e. three breeding threatened spe-cies). The top 25 islands are featured in Table 3.3.
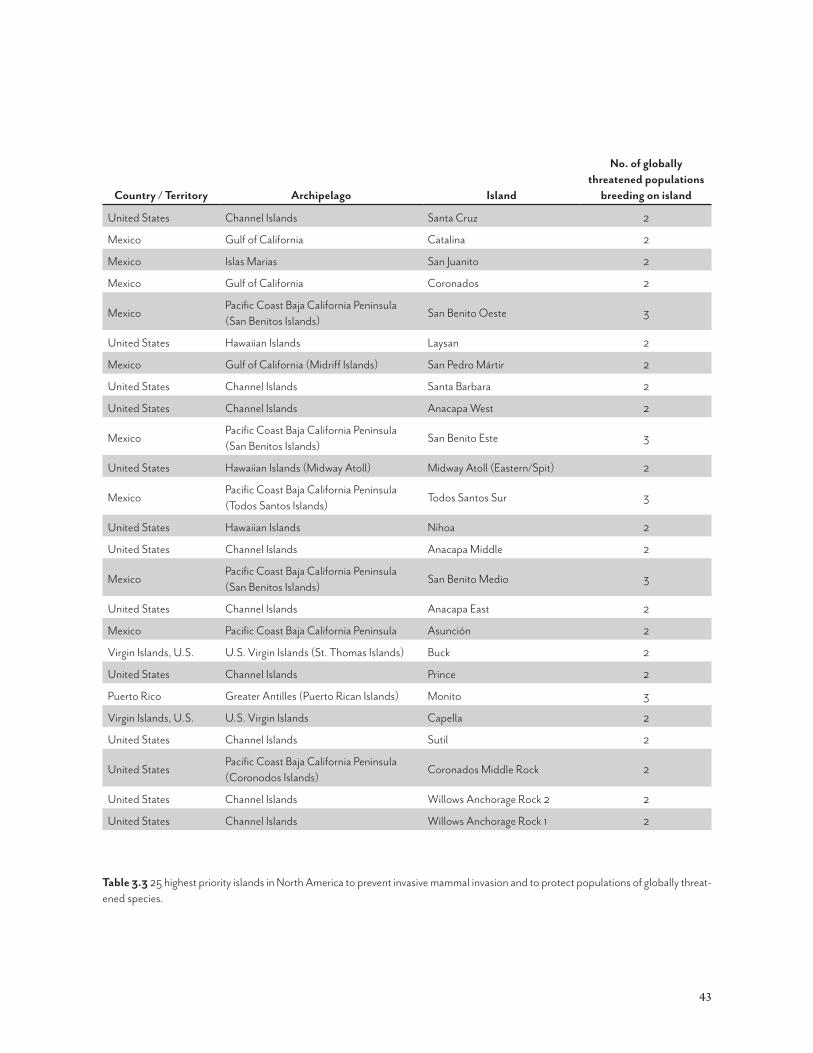
43
Country / Territory Archipelago Island
No. of globally threatened populations
breeding on island
United States Channel Islands Santa Cruz 2
Mexico Gulf of California Catalina 2
Mexico Islas Marias San Juanito 2
Mexico Gulf of California Coronados 2
MexicoPacific Coast Baja California Peninsula (San Benitos Islands)
San Benito Oeste 3
United States Hawaiian Islands Laysan 2
Mexico Gulf of California (Midriff Islands) San Pedro Mártir 2
United States Channel Islands Santa Barbara 2
United States Channel Islands Anacapa West 2
MexicoPacific Coast Baja California Peninsula (San Benitos Islands)
San Benito Este 3
United States Hawaiian Islands (Midway Atoll) Midway Atoll (Eastern/Spit) 2
MexicoPacific Coast Baja California Peninsula (Todos Santos Islands)
Todos Santos Sur 3
United States Hawaiian Islands Nihoa 2
United States Channel Islands Anacapa Middle 2
MexicoPacific Coast Baja California Peninsula (San Benitos Islands)
San Benito Medio 3
United States Channel Islands Anacapa East 2
Mexico Pacific Coast Baja California Peninsula Asunción 2
Virgin Islands, U. S. U. S. Virgin Islands (St. Thomas Islands) Buck 2
United States Channel Islands Prince 2
Puerto Rico Greater Antilles (Puerto Rican Islands) Monito 3
Virgin Islands, U. S. U. S. Virgin Islands Capella 2
United States Channel Islands Sutil 2
United StatesPacific Coast Baja California Peninsula (Coronodos Islands)
Coronados Middle Rock 2
United States Channel Islands Willows Anchorage Rock 2 2
United States Channel Islands Willows Anchorage Rock 1 2
Table 3.3 25 highest priority islands in North America to prevent invasive mammal invasion and to protect populations of globally threat-ened species.

44
3.4.2.1.2 Islands potentially feasible for invasive mammal eradication
Using a conservative threshold criterion of 15,000 ha and <100 people for identifying potentially feasible islands for invasive mammal eradication produced a list of 40 islands where one or more of rodents (Rattus, Mus), cats, dogs, herpestids or mustelids, ungulates or lagomorphs were confirmed or suspected as present. This island portfolio will be particularly useful in guid-ing U. S.-based priorities as 31 (78%) of the priorities were on U. S.-owned islands. The remaining 9 islands were in Mexico. The largest islands were Kagalaska and Kahoʻolawe at ~11,500 ha. The 40 islands host 75 populations of 34 species of globally threatened verte-brates. A total of 18 islands had more than 1 population of globally threatened species, with a maximum of 6 populations, which are listed in Table 3.4.
3.4.2.1.3 Islands where eradications are being planned or are under way
We identified five islands where invasive mammal eradication is being planned (Guadalupe, Midway [Sand]) or underway (Socorro, Green Cay [U. S. Vir-gin Islands] and Anatahan [Commonwealth of the Northern Mariana Islands]) on islands with globally threatened species. While three of these islands fell above thresholds used in this analysis for identifying feasible islands (Midway [Sand] and Socorro >100 people, and Guadalupe >15,000 ha) these are clearly important priorities for North America, and the U. S. in particular, because of globally threatened species present and because both technical and socio-political feasibility are evidently met.
3.4.2.1.4 Islands where invasive mammal status is unknown or incomplete
We identified 13 islands with globally threatened spe-cies where invasive mammal status was unknown or incomplete, limiting any eradication feasibility assess-ment (Table 3.5). All but 1 island was in the U. S., and represent 13 populations of 3 species, including the ashy storm-petrel (Hydrobates homochroa). These islands are relatively small rock stacks, and while they are unlikely to have large invasive mammal species, it will be im-portant to confirm the presence or absence of rodents.
3.4.2.2 ArcticUsing the tib, we identified 25 islands in the Arctic that had populations of globally threatened species,
all in the Aleutian Archipelago, with 4 in Russia and 21 in the U. S. These islands hosted 26 populations of 3 species – 11 populations of marbled murrelet (EN), 14 populations of red- legged kittiwake (Rissa brevirostris) (VU) and 1 population of the Pribilof Island shrew (Sorex pribilofensis) (EN).
Seven islands were identified as invasive-mammal free and warrant prioritizing biosecurity; these included Arij Kamen, Mednyi, and Toporkov (Commander Islands) and Buldir, Middle and Outer Rock (both adjacent to Buldir), and East Amatuli (Kodiak Archipelago). Six islands support populations of red- legged kittiwake, and one island supports a marbled murrelet (Brachyramphus marmoratus) population.
Three islands were identified as having unknown or incomplete invasive mammal status: Nord (Kodiak), Fire, and Bogoslof (Bogoslof group). All of these islands support populations of red-legged kittiwakes and warrant efforts to collate existing knowledge of these locations or visit the islands to confirm invasive mammal presence, particularly inconspicuous species like rodents.
We identified five islands that fell below thresholds of 15,000 ha and 100 human inhabitants and warrant further consideration of eradication of invasive mammals to protect populations of globally threatened species: Amak, Kagalaska, Koniuji, Unalga (Aleutians), and Naked in the Prince William Sound. These islands included five threatened populations of two species (marbled murrelet and red-legged kittiwake) and invasive mammals including rodents.
3.5 Summary
A wide range of resources and case studies are available in the literature to guide prioritization in conservation decision-making. For North America and the Arctic, an effective prioritization strategy will need to take into consideration stakeholder priorities for establishing a problem statement, and data availability and gaps as outlined in Section 2. In applying a simplified version of a prioritization tool (Section 3.2) based on data avail-able from the Threatened Island Biodiversity Database, we found 40 islands in North America where one or more invasive terrestrial mammals were confirmed or suspected as present and potentially feasible to eradicate given previous eradication successes. These islands were in the U. S. and Mexico, with top prior-
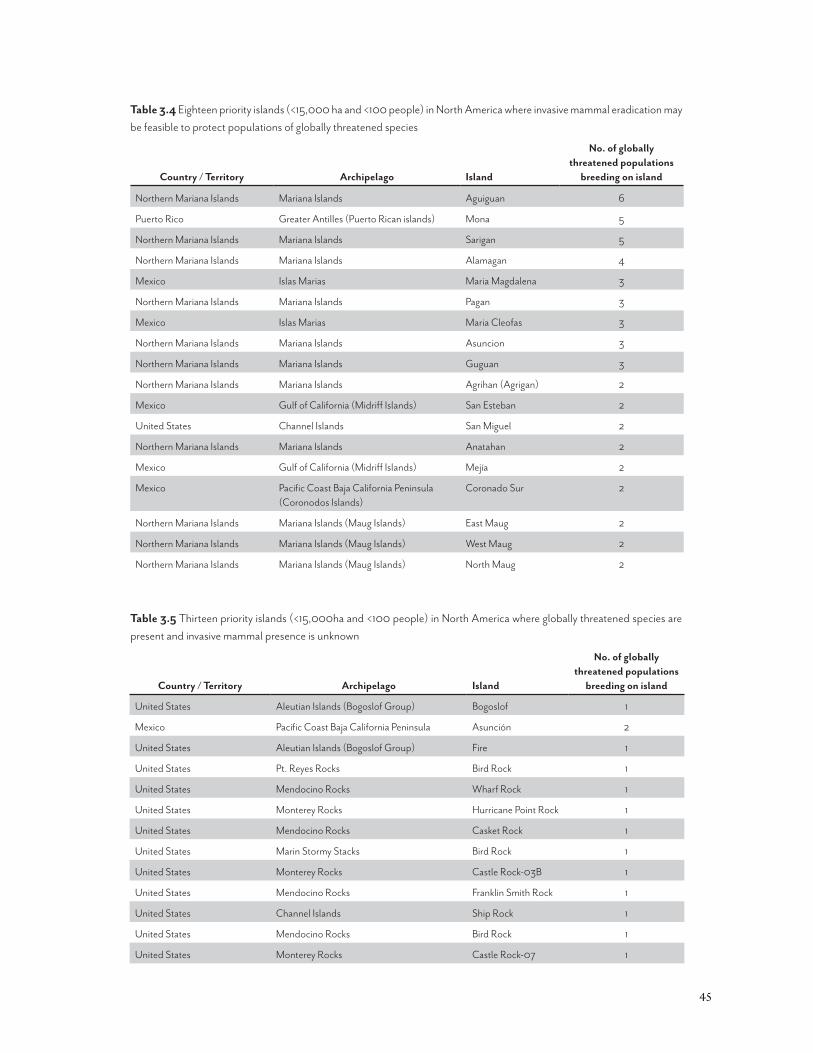
45
Table 3.4 Eighteen priority islands (<15,000 ha and <100 people) in North America where invasive mammal eradication may be feasible to protect populations of globally threatened species
Country / Territory Archipelago Island
No. of globally threatened populations
breeding on island
Northern Mariana Islands Mariana Islands Aguiguan 6
Puerto Rico Greater Antilles (Puerto Rican islands) Mona 5
Northern Mariana Islands Mariana Islands Sarigan 5
Northern Mariana Islands Mariana Islands Alamagan 4
Mexico Islas Marias Maria Magdalena 3
Northern Mariana Islands Mariana Islands Pagan 3
Mexico Islas Marias Maria Cleofas 3
Northern Mariana Islands Mariana Islands Asuncion 3
Northern Mariana Islands Mariana Islands Guguan 3
Northern Mariana Islands Mariana Islands Agrihan (Agrigan) 2
Mexico Gulf of California (Midriff Islands) San Esteban 2
United States Channel Islands San Miguel 2
Northern Mariana Islands Mariana Islands Anatahan 2
Mexico Gulf of California (Midriff Islands) Mejía 2
Mexico Pacific Coast Baja California Peninsula (Coronodos Islands)
Coronado Sur 2
Northern Mariana Islands Mariana Islands (Maug Islands) East Maug 2
Northern Mariana Islands Mariana Islands (Maug Islands) West Maug 2
Northern Mariana Islands Mariana Islands (Maug Islands) North Maug 2
Table 3.5 Thirteen priority islands (<15,000ha and <100 people) in North America where globally threatened species are present and invasive mammal presence is unknown
Country / Territory Archipelago Island
No. of globally threatened populations
breeding on island
United States Aleutian Islands (Bogoslof Group) Bogoslof 1
Mexico Pacific Coast Baja California Peninsula Asunción 2
United States Aleutian Islands (Bogoslof Group) Fire 1
United States Pt. Reyes Rocks Bird Rock 1
United States Mendocino Rocks Wharf Rock 1
United States Monterey Rocks Hurricane Point Rock 1
United States Mendocino Rocks Casket Rock 1
United States Marin Stormy Stacks Bird Rock 1
United States Monterey Rocks Castle Rock-03B 1
United States Mendocino Rocks Franklin Smith Rock 1
United States Channel Islands Ship Rock 1
United States Mendocino Rocks Bird Rock 1
United States Monterey Rocks Castle Rock-07 1

46
ities identified in the Northern Mariana Islands and Puerto Rico (U. S. territories). Canada’s islands were largely missing from this effort due to the few species in Canada listed as globally threatened by the iucn Red List. Therefore, the prioritization method and the 40 priority islands identified serve as a starting point for enhancing dialogue with stakeholders to 1) define agreed-upon problem statements and 2) establish da-ta-sharing agreements that are appropriate for the U. S. and ultimately a North American scale prioritization of islands for invasive species eradications that will pro-tect island species and ecosystems. Similar steps can be followed to prioritize islands in the Arctic for invasive species eradications. While our prioritization effort identified five priority islands for invasive vertebrate eradication, they all fell under U. S. jurisdiction (Amak, Kagalaska, Koniuji, Unalga [Aleutians, Alaska] and Na-ked Island [Prince William Sound, Alaska]) and are not representative of the entire Arctic region. Stakeholder engagement will be especially critical in this region.
3.6 Recommendations for U. S. Island Decision-Makers
Two of the critical primary datasets recommended in Section 2 can also be used for priority setting within the United States. Of these datasets, one includes a priority island list established in 2009 by the
U. S. Fish and Wildlife Service, which identifies 85 priority islands for protecting nationally threatened species. The second dataset is the Threatened Island Biodiversity Database (tib), from which we were able to identify 13 islands within the U. S. that contained globally threatened species. These lists can serve as springboards for refining priorities and eventually turning the priority-setting activity into eradication action. Next steps and recommendations for nisc members are to 1) help establish a unifying problem statement among key island stakeholders to aid in the development of a U. S. islands dataset and to establish the underlying priorities, which would guide a priori-tization effort, 2) help determine which institution is best positioned to develop, house, and maintain these decision-making tools and grant them mandate and permission to proceed, 3) lead the communications among the groups and stakeholders, and 4) fund the data mobilization and data-based decision-making tool development.
47
Within this section we described a road-map for planning and implementing erad-ication of invasive mammals, confirming
outcome of the operation, and if successful, document recovery. This roadmap is based on four major phases of an island invasive eradication project lifecycle adapted and practiced by Island Conservation and its partners. The lifecycle phases can guide conservationists from establishing island conservation priorities described in Section 3 of this report to implementing action and documenting results. This section is built on the expe-rience of Island Conservation and the organization’s internal Island Restoration Planning Process Guide, as well as on guidelines by New Zealand Department of Conservation and the Pacific Invasives Initiative’s Re-source Kit for Rodent and Cat Eradication (http://www.pacificinvasivesinitiative.org/rce/index.html).
To help illustrate the utility of the guidelines, we provide a cursory example for the eradication of inva-sive rodents from an island in the United States: Kiska Island in the Aleutian Archipelago, an important island representative to both North American and Arctic re-gions. While Kiska does not have globally threatened species (and thus did not feature in the output of Section 3.4 in this report), we expect this island to be identified as a priority for either region given a problem statement centering on the importance of the island for seabirds (akin to the problem statement described in Section 3.3). Using Kiska as an example also allows for initial discussions of the social, cultural, ecologi-cal, political, and regulatory landscapes and jurisdic-tions necessary to navigate for any invasive vertebrate eradication. This example is clearly unique to the U. S. However, the principles are common to other regions of interest. Furthermore, the Kiska example is an en-tirely hypothetical thought exercise to help illustrate how this guide might be implemented.
4. Advancing Eradication of Invasive Vertebrates on North American and Arctic Islands: Roadmap for Action

48
Visualizing the RoadmapThe graphic in Figure 4.1 illustrates the major phases of a project’s lifecycle, and Figure 4.2 provides additional detail for the phases of Planning and Implementation. Underpinning the four major phases are ongoing foun-dations of sustained community engagement, com-munications, risk-management, biosecurity, project management, and fundraising. An important requisite to any invasive vertebrate island eradication success is a strong, trusting partnership to carry out the project lifecycle. As with projects subject to nepa, if a project is initiated without such a partnership and appropriate social engagement, the process itself will quickly illu-minate the need to do so.
4.1 Phase I – Project Identification and Enabling Partnerships
Step 1 – Project Identification(and Prioritization)
Before planning can commence, a potential project needs to be identified and established as a priority by a core partnership. From our observations and experi-ences working with governments, ngos, and commu-nities in dozens of countries on five continents, island restoration prioritization pipelines are most practical to implement (and palatable to land managers/stakehold-
Figure 4.1. Island Conservation’s Project Planning lifecycle for invasive vertebrate eradication on islands (adapted from http://www.pacificinvasivesinitiative.org/rce/intro/The_Project_Process_Overview.html).
ers) when the evaluation criteria are used to establish a single threshold to identify sites that are “in” (priori-ties) or “out” (not priorities/feasible). There is further utility in databases that can support comparisons of certain project elements relative to one another for specific sites. We advise against any attempts to create a sequentially prioritized island list (i.e. this island is priority number 1, this island is priority number 2) as it is politically impractical and unnecessary. The en-abling conditions (funding, political will, management decisions, community engagement, etc.) typically lead to the sequence in which islands are selected for con-servation activities. Further, it is highly likely (and de-sirable) that any invasive mammal eradication project on an island will be nested within a larger set of island restoration objectives (e.g. maintaining invasive rodent biosecurity across the Channel Islands).
Step 2 – Enabling Partnerships EstablishedStep 2a – Enable partnerships Projects cannot succeed without adequate leadership, engagement, support, and/or tolerance by local communities, their govern-ments, ngos, and businesses. With few exceptions, every significant island intervention success has in-volved alignment of stakeholder support. Community alignment, or lack thereof, will make or break a project. Historically, social engagement and public-private part-nerships were not necessarily a standardized resource management tool. As such, some natural resource

49
Box 4.1 Considering Kiska Island, Alaska
This is an Island in the Aleutian archipelago, which is closer to Russia than Anchorage, Alas-ka. It is an island rich in natural and cultural re-sources as well as warfare history. The island sup-ports the largest seabird colony in the northern hemisphere with two species of auklets (Aethia sp.) numbering in the multi-millions. However, these birds are threatened with extirpation due to presence of introduced, invasive (harmful) rats. Rats were introduced to the Aleutian archipelago in the late 1700s, likely with Russian fur traders, and introductions continue today with periodic shipwrecks. Rats were likely introduced to Kis-ka during World War II when Japanese military initially landed followed by U. S. military. The eradication of rats is a key activity to protecting the millions of seabirds that could quickly dis-appear otherwise.
Figure 4.2 Sequential flow of activities for the Planning and Implementation phases identified in Figure 4.1
managers will be embarking on a learning-by-doing exercise. To get these projects off the ground, a level of understanding and analysis is required across many actors. Everyone typically understands, a priori, the potential benefits of a proposed island invasives erad-ication. However, once decision-makers are actively engaged in project development, which is a “process of discovery,” they quickly become aware of the inherent challenges for such projects, which can include but are not limited to:
• Social intolerance (e.g. animal rights or anti-pes-ticide-based opposition)
• Conservation methods’ risks to non-target or con-servation target species
• Methods or tool limitations• Negative food web interactions or other trophic
cascades triggered by removing invasive species
Step 2b – Engage experts, decision-makers, and community and opinion leaders Productive dialogue for advancing projects begins with strategic conversations with key

50
Box 4.2 Sample questions for engagement
Did you know…• There are invasive rats on Kiska Island, Alaska?• Invasive rats are the leading threats to millions of
Kiska’s seabirds?• We may be able to do something about it?• Rat Island was renamed Hawadax (original Aleut
name) after a partnership eradicated the rats?• We could try the same on Kiska?
actors around the potential benefits of an eradication. An engagement will entail open-ended discussion questions (see Box 4.2) that facilitate conversation, re-veal core values and beliefs, and help concerned parties determine whether they think a Kiska rat eradication is worthy of consideration.
Project proponents may already know or intuit who the key actors are and how to start these conversations. If not, resources exist to guide proponents through an exercise to map key influencers/actors (Crandall et al. 2018). Essentially, one must ask:
• Who needs to be part of the stepwise series of de-cisions and adaptations necessary to advance this project? Who has done this before?
• Who has the expertise that we currently lack?• Who will make key decisions along the way?• Who are the key communities and who are their
trusted leaders who represent their values, needs, and concerns?
• Who can convey confidence to their communities when reporting back on the leadership group’s pro-cess of discovery and decision-making?
• Who can help with effective stakeholder engage-ment (see Simultaneous Planning Activities, Steps P&S [found after step 9] below)?
The more engagement at this stage, the smoother stakeholder outreach and communication is likely to be later in the process, increasing the likelihood of ad-equate social acceptance for the intervention.
Know your Audience – Find Common ValuesThe project proponents’ missions, mandates, and per-missions may stem solely from the desire to protect a resource, restore an ecosystem, or protecting an endan-gered species. However, the partners that will ensure success may not care equally about these outcomes in the same way. Despite the possibility for variation in aspirations, there will most certainly be common ground for the discussion based on shared values and overlapping interests and objectives. This is the first lesson in the circuitous path to successful island res-toration projects – establishing common cause as the foundation of a project partnership. Proponents may need to consider infrastructure protection, economic development (e.g. nature tourism), food security, na-tional security, or other stakeholders’ objectives that will help to align partners around common causes that also line up with project proponents’ conservation ob-jectives.
Together, this alignment of needs with the conserva-tion action ultimately makes a more compelling case for the eradication. The partnership can articulate multiple problems addressed by conservation action and the di-verse resulting benefits, broadening appeal to a greater set of values embedded within a large stakeholder base.
Develop Cultural CompetencyEngaging in authentic ways with local and native com-munities is critically important in many of the islands in North America and the Arctic. Ensuring the capacity to support cultural competency is essential. And, when it is done well, and if the project proponents do not already have a respected working relationship with the local peoples, they should become well-versed in the
Box 4.3 Considering Kiska’s stakeholder groups
Kiska Island is part of the Alaska Maritime Na-tional Wildlife Refuge (amnwr), managed by the usfws. As such, they would be the lead management agency, project proponent, and regulatory compliance lead. However, many stakeholders have an interest in the Aleutian Islands. Some of the most obvious include the native Aleut people, the State of Alaska, seabird conservation community, the fishing industry, U. S. Coast Guard, U. S. Air Force, and the Na-tional Park Service, given that Kiska is a protected historical battleground. Each group might con-sider supporting an eradication intervention for different reasons. Establishing this “common cause” is central in the art of forming powerful partnerships.
51
cultural values and norms before initiating contact. One of the most efficient and effective ways to develop cultural competency is to recruit a community liaison who can coach the team in respectfully and appropri-ately engaging the local community. In the end, strong cultural competency and sincere engagement make for a stronger partnership, increased likelihood of efficacy, and lasting, sustainable outcomes.
Step 2c Critical mass and collective cause: formalizing partnerships As outlined in Figure 4.1 and discussed in previous sections, engagement is a foundational activity that must be sustained throughout the proj-ect planning lifecycle. At some point in the process it will be necessary to evolve the dialogue to the point of reaching at least an informal agreement to investigate the feasibility and suitability of an invasive vertebrate eradication on the island. At some point in the matu-ration of the process of the public-private partnership, it will become necessary to formalize relationships and define roles and responsibilities. This process can take many forms and happen at various inflection points. Typically, the sooner the partnership is formalized, the better. However, sometimes this is better carried out during Phase II (Project Planning). The formal partnership vehicles employed most often and with greatest success include one or more of the following:
• Contracts or Cooperative Agreements• Memorandum of Understanding/Agreements• Advisory/Steering Committees• Project Management Teams (using Incident Com-
mand Structure [ics])
Box 4.4 Considering Kiska in Context
In 2008, the usfws, Island Conservation, The Nature Conservancy, and other partners, in consultation with the native peoples, removed invasive rats from Hawadax (Rat Island) in the Aleutians. The U. S. Board of Geographic Names approved a proposal brought forward by the na-tive Aleut peoples in 2012 to change the name of the Island back to Hawadax Island (pronounced “how ah thaa”). This return to the original Aleut name is acknowledgement of the absence of rats and a return to the island’s ecological state prior to European/Japanese contact. This is import-ant cultural context for a Kiska Partnership to consider when consulting native peoples about a potential project.
Box 4.5 Establish Appropriate Partnerships To Help Advance:
• Technical, biological, social, and financial assessment of options
• Project financing• Environmental compliance• Appropriate sociopolitical engagement• Necessary technical research• Implementation of the eradication• Monitoring efficacy and ecological change
Step 3 – Define Project andProcess of Discovery
Step 3a – Partners define the purpose and need One of the best ways to formalize the partnership is by defining and adopting a consensus view of the purpose and need of the project. The partnership’s mission is predicated on the purpose and need, which should define the goals and boundaries of the project. It should explicitly define all the details needed for the project, including when the project is expected to start and end. Use the steps in this roadmap as your signposts for that discussion.
Step 3b – Define the process of discovery The partner-ship should explicitly understand that together they are embarking on a phased sequence of steps outlined in broad brushstrokes here, and that each step of the way is a check-point and involves revisiting the assumptions the partnership has about feasibility. With every step the partnership should be asking themselves: • What does this additional information tell us?• What does it change about our assumptions?• How should we adapt our process of discovery?• How should we adapt our formal feasibility assess-
ment?• What do we do next?• Are we still comfortable moving forward?
Process of Discovery is Anchoredin the Feasibility Assessment
The partnership should understand the sequence of steps in this roadmap and use them to define their pro-cess. In so doing, they should acknowledge the critical importance of the Feasibility Assessment (Step 6). The

52
Box 4.7 Considering the Purpose and Need for Kiska
A clear purpose and need for Kiska Island might be to “pursue the eradication of rats to benefit seabird restoration and protection.” These tend to be more verbose in today’s nepa compliance documents such as the March 21, 2018 DraftEnvironmental Assessment for the Midway Seabird Protection Project,* which has the following stated purpose accompanied by a two page need statement:
1.2 purpose of the actionThe purpose of the proposed action is to implement Strategy as-4 from the pmmp and completely eradicate the invasive house mouse from Sand Island within the manwr and to maintain its rodent- free status in perpetuity. To eradicate invasive mice, a lethal dose of rodenticide would be delivered to every rodent on the island in a manner that minimizes harm to island residents and the ecosystem while still maintaining a high probability of successful eradication…Within 1 year of project implementation, non-native mice will be eradicated (population= 0) from Sand Island on Midway Atoll National Wildlife Refuge for the benefit and protection of nesting albatross species (e.g., Laysan, short- tailed, and black-footed), other nesting seabirds (e.g., Bonin Petrel), and their habitats.
* https://www.fws.gov/uploadedFiles/Region_1/NWRS/Zone_1/Midway_Atoll/Sections/W hat_We_Do/Resouce_Management/Midway_Seabird_EA_Public_Draft.pdf
Box 4.6 Considering Kiska Partnerships
In this case, the usfws would serve as the lead agency under the amnwr. Historically, the model applied to most Refuge projects includes a partership agreement to formalize the partner-ship with clearly defined roles and responsibili-ties. All activities fall under the jurisdiction of the usfws Refuge System, which serves as the lead partner. However, the partnership agreement can define who else is at the table to help steer the project, inform the dialogue, and evolve the prescription of the activities. The project might benefit from a core team of conservation prac-titioners, and a higher-level stakeholder-based steering committee to help inform the technical, leadership team’s project planning development.
feasibility assessment serves as the partnership’s base-line and will incorporate their assumptions. This is the anchor for the partnership and its process of discovery. Once a feasibility assessment is completed, it becomes the core to which the partnership ties any significant new data or information and adapt management of the assessment, the assumptions, and the project itself. The partnership should revisit and adapt the feasibility assessment as they discover new facts and test their assumptions in assessment.
Eradication PrinciplesWith or without a formal agreement, the partnership should agree to and understand that they are em-barking, together, on this process-of-discovery road to explore the feasibility and suitability of an eradica-tion project. To succeed, the partnership will need to apply an eradication ethic guided by the principles of eradication (Box 4.8). Thus, in a feasibility assessment and subsequent investigations, the partners should be looking for reasons that these principles cannot be ap-plied. This testing of assumptions against the princi-ples, frames the entire project implementation strategy – from maximizing efficacy to minimizing risks. The importance of the feasibility cannot be overstated. It depends heavily on the partnership’s study design and the biological, logistical, sociopolitical, and regulato-ry assumptions and context. See Step 6 for additional guidance.
Step 3c – Desktop Island Assessment Desktop Island Assessment (dia) is an economical first cut at assessing feasibility. This brief document is designed to provide a general overview of potential benefits and challenges of a project opportunity. Aspects may include: inva-sive threat(s), conservation target(s), Natural Resource management information, partnerships, stakeholder audiences, regulatory requirements, and more.

53
Step 4 – Start Administrative RecordAt this point, the lead implementing agency should establish an administrative record. This is critical for public agency transparency and necessary to comply with most regulatory and permitting processes. The lead agency is typically a state, federal, or tribal land management agency responsible for proposing the project to various agencies responsible for reviewing, conditioning, and approving or denying the proposal consistent with regulatory processes within their ju-risdiction.
Avoid Pre-decisionIf a partnership has come together to explore a poten-tial eradication project, that does not necessarily mean that there is going to be an eradication attempt. The common values and goals of the project and the part-nerships will evolve as the project portfolio becomes more detailed and specific as they move through the process of discovery. The administrative record grows over time and the probability of the partners choosing to pursue the operation increases. However, along the way there may be hurdles that are insurmountable, and the partners may decide “no” or “not now,” taking an “off ramp” to leave this roadmap.
Be Explicit in Making DecisionsBe conscientious and transparent in understanding that each step along the process involves a decision. The partnership must acknowledge this at each step by discussing challenges, limitations, or barriers. Partners must decide together if there is a potential path to ad-dress that limitation. If there is, adapt your feasibility assessment to document and reflect this learning and decision. Then partners are ready to move on to the next challenge. Remember, there is little cost to dia-logue, theorizing, and thought experiments. These are important tools in the process of discovery and should be utilized to inform decision-making and actions to validate assumptions and hypotheses.
Go or No-Go Decisions – Risks/Costs vs. Benefits
The “go/no-go” decisions are always based on the part-nership’s evaluations of potential costs or risks weighed against expected benefits. The long-term anticipated benefits should always justify and outweigh the short- term risks or costs. Projects may be put on ice for any number of limitations that cannot be overcome at pres-ent. Common examples of risks or costs that could out-
Box 4.8 Considering Eradication Principles for Kiska
All eradications, regardless of the target species, are grounded in three fundamental principles (Bomford and O’Brien 1995; caff 2013; Cromarty et al. 2002):1. Every individual must be put at risk with the proposed removal technique(s).2. The technique(s) must remove individuals at a rate faster than they can replace themselves (i.e. breed). 3. Immigration must be zero, or effectively be managed to zero (i.e. Identify and respond effectively to
eliminate reintroduction).
Eradication Principles Applied in Rat and Mouse EradicationsFor rodent eradications, these principles have been further defined (Howald et al. 2007), and developed into recommended Best Practice Guidelines to maximize the probability of successfully removing rodents from temperate islands in New Zealand and from tropical islands (Broome et al. 2014; Keitt et al. 2015). Key elements include:1. Potential impacts to non-target wildlife should be evaluated. Where identified they need to be avoided,
minimized or mitigated wherever possible. The operation should only proceed if benefits outweigh costs.2. Deliver a highly palatable bait containing a toxic rodenticide into every potential rodent territory.3. Ensure bait is available for long enough that every rodent has access to a lethal dose.4. Time the baiting operation to when the rodent population is most likely to consume the bait.5. Biosecurity procedures must be in place to prevent an incursion during and after the operation, with
measures in place to detect and respond to incursions.

54
Box 4.11 An Administrative Record for Kiska
The usfws, amnwr would be the lead agency and ultimately be responsible for starting and maintaining the administrative record for the project and the partnership.
Box 4.9 Considering a Kiska Restoration Partnership
The hypothetical Kiska Restoration Partner-ship is advised to align its membership around this process of discovery, acknowledging that eradication of rats from Kiska is an enormous undertaking but possible as evidenced by past successes. Some useful guiding questions to be considered include: While there are many op-tions for removal, what options are reasonable to be considered at this time? What is this going to cost? What are the risks? Who could physically do the project? How does the prospect of a Kiska rat eradication fit in the context of what has been achieved globally? Are there any deal breakers that can be identified at this point? What research questions (ecology, toxicology, food web, etc.) or other mechanisms need to be applied before moving forward?
Box 4.10 Considering a Kiska Process of Discovery
If the partners ask themselves: Can we success-fully eradicate rats using rodenticide? And, you assume, yes; then it is incumbent upon them to test the associated assumption with baiting trials. If the trials provide new information that chal-lenge or invalidate assumptions, then the partner-ship must go back to the beginning and revise the feasibility assessment and assumptions.
weigh the anticipated benefits and cause a partnership to make a “no-go” or not-now” decision include:
• Lack of political will• Insufficient funding or capacity• Social intolerance (e.g. litigation in most extreme
cases)• Non-target risks are too great or too difficult to
mitigate• Reputational risks are too great• Regulatory restrictions (e.g. brodifacoum is re-
stricted in Hawaii)• Technical/methodological limitations
4.2 Phase II – Project Planning
In the Project Planning phase, project leads help the partnership* develop the documents necessary to guide all project aspects associated with assessing feasibility, making decisions, adapting management strategies,
* The term “partnership” is used generally throughout this document. At any given step, specific context will help the reader determine if it should refer to a Project Lead, Project Team, Steering/Advisory Committee, or even a broader partnership with the community.
and designing and implementing an eradication. As a rule, eradication operations are complex and difficult. Careful and strategic planning is crucial to maximizing project efficacy.
There are many prerequisite activities for any eradi-cation operation. Examples include partner and stake-holder engagement, fundraising, feasibility assessment, field trials, regulatory compliance, equipment procure-ment, training and logistics, planning biosecurity, mon-itoring, and much more.
Some of these activities take place in sequential steps. Others have already been initiated, or should begin at this point, and should be sustained for the life of the project. Completing the Project Planning Phase ensures that all required tasks are considered and completed in a timely fashion. Project Planning:
• Is comprehensive• Facilitates meaningful internal and external review• Prepares the Project Lead and Team for Imple-
mentation• Maximizes probability of success• Minimizes risks
The technical steps to accomplishing this phase will be lengthy and largely project-specific. Thus, the key

55
Box 4.12 Roles & Responsibilities
It is helpful to identify key players in the planning process with clearly defined roles and responsi-bilities. We recommend:
• Project Lead: Lead staff from lead agency/organization prepares the Operational Plan, Biosecurity Plan and Monitoring and Evalu-ation Plan.
• Project Team: Lead implementing organiza-tions provide input as required by the Project Lead.
• Project Partners: May refer to the above or the broader set of proponents as consulted through steering/advisory committee by project lead/team on key decisions.
• Stakeholders: Consulted during the planning process to address concerns and advised of the final plan.
• Implementation Advisor: Eradication practi-tioner expert who reviews the Operational Plan, Biosecurity Plan and Monitoring and Evaluation Plan. Provides expertise as re-quired by Project Manager.
Box 4.13 Go/no-go-decisions on Kiska
For projects lead by a federal agency, such as usf-ws amnwr, a key inflection ”go/no-go” decision point for that project lead is their legal determi-nation following their compliance with nepa. A ”go” determination under an Environmental Assessment is a Finding of No Significant Impact (fonsi) or in the case of issuing a Final Environ-mental Impact Statement (feis) with a Record of Decision. In either case, the lead agency has decided to proceed, pending all remaining per-mits and authorizations. And, despite that, the partnership might learn something in its process of discovery that would lead the team to decide the project is a “no-go.”
here is to recruit experts who have a successful history in project planning and implementation. This includes finding qualified practitioners or colleagues to assist you in obtaining existing resources from past successes to help flesh out the tasks for each of the needed steps (see Appendix 11).
Step 5 – Project Scoping ReportThe objective in this step is to develop a detailed re-port that explicitly articulates expectations and future planning activities. It should determine and document a specific project, goals, deliverables, tasks, costs, and timelines.
Here, the team will perform in-depth consultations with those partners and actors most knowledgeable about the island resources, habitats, conservation targets, food-web relationships, regulatory require-ments, stakeholder perspectives, and implementing eradications with similar conditions, and will continue to refine biological analysis of conservation benefits, potential risks, and stakeholder aspects. At this stage, the project team will determine whether adequate information is available through published literature,
gray literature, expert witnesses, remote meetings, and whether a field site visit is required to develop the Fea-sibility Assessment. Engage the team to assess funding needs and develop a plan for addressing them. Note: the funding conversation will have likely begun in Phase I and will be a sustained, underlying activity for the lifetime of the project partnership.
Step 6 – Feasibility AssessmentBuilding from the guidance feasibility assessment out-lined in Phase 1, Step 3c, the Project Team collaborates with partners on the development of a detailed assess-ment that evaluates project feasibility. The assessment should identify knowledge gaps and how the project team intends to address them. The document should reflect the scope of the project, summarize known information, identify partners’ assumptions, high-light knowledge gaps, define ways to close gaps, and test assumptions. This is the Project Team’s process anchor for assessing the feasibility of the project and considering potential alternatives to achieve the project objective. The assessment should identify timing for necessary field trials (trials are frequently necessary to test assumptions, assess eradication feasibility, or to in-form the operational plan – for example, calculating ro-dent bait application rates). The feasibility assessment should include development of a detailed budget with estimates of all project-related costs including planning, trials, engagement, communications, permitting, im-plementation, and monitoring expenses.
A variety of roles needs to be assigned and carried out among project staff. The project’s Implementation Advisor should assist with the document’s design and

56
Box 4.14 Recommendations for Project Scoping Report
• Use the Desktop Island Assessment as the initial resource relevant literature source.
• Develop a Gantt chart that can be adapted as the project progresses into operational phases;
• Consider submission of report to broader partners for peer review.
• Where possible, identify the scale and scope of future reviews (e.g. external review, etc.).
Box 4.15 Recommendations for Feasibility Assessment (1)
Conduct a literature review for relevant back-ground information.• Identify assumptions, knowledge gaps and
questions that need to be answered through-out the process.
• Utilize the partnership’s scientists, communi-cations, and external affairs professionals to advise on restoration monitoring and com-munications and outreach needs respectively.
recommended content. The assessment should out-line risks and risk-management processes. The Proj-ect Team and Leads should gather the perspectives and expertise from the Steering/Advisory Committee and Implementation Advisor to develop this draft, and arrange for a peer-review of draft assessment before finalizing and distributing the document.
The feasibility process should include evaluation of related experiences in as great detail as possible. Me-ticulous analysis informs what options are considered for eradication as well as recommended approaches, including mitigation strategies to avoid, minimize, or mitigate toxicological or disturbance risks wherever possible.
Managing the Feasibility AssessmentThe feasibility assessment is the Project Team’s high-level, cursory overview of a project consistent with the principles of eradication. It includes a series of assumptions about current eradication knowledge.
Some of these assumptions will be well supported by evidence, and some will require validation with trials, research, field-tests, or other forms of ground-truthing. This sets the project on a pathway by which assump-tions are adjusted and validated to the point where they become proven as facts or identified as misperceptions and revised or discarded.
During the development of a project, as assump-tions are tested and determined to be false, the im-pact on efficacy and/or risks need to be reassessed, and modifications need to be made. Essentially, the foundation of the feasibility needs to be tested and re-evaluated throughout the process of development. This is illustrated in Figure 4.3, a feedback flow chart. This is generally an adaptive management approach by which the project is designed a priori, and as the levels of complexity are added and modifications are made, the impact of those modifications are evaluated for their impact on efficacy and risks. Changes should be made as appropriate, and the feedback cycle repeats itself. This is a process of constantly checking assump-tions. If any of the assumptions are challenged or test negatively, then the partnership must go back to the feasibility drawing board and evaluate the impacts of those changes on efficacy and risks. Fortunately, the more knowledge the partnership has going in to the feasibility development in the first place, the less signif-icant the impact of any changes that need to be made in the future. Local knowledge and biological/logistical understanding will also enhance this effort significantly.
Box 4.16 Recommendations for Field Trials
• The “who, what, when, where, why, and how” can be highly variable across projects. Field trials should refer to questions that need to be answered within the feasibility assessment, for conservation monitoring needs, and for operational planning.
• Some trials may be large or complex enough to be considered their own project and will benefit from additional guidance and subse-quent steps found within this project planning resource.
• Submit trial plans to peer review prior to im-plementing.
• Revisit feasibility Assessment after trials–“go/no- go” decisions.

57
Box 4.17 Considering Kiska Research Needs
In the case of the imagined Kiska project, one of the primary research needs we identified in the hypothetical feasibility assessment is confirmation of native species present, and rat ecology in and around active fuma-roles (volcanic openings in the ground). The native species need to be inventoried and assessed for their status, which will inform the non-target mitigation strategy. While risk avoidance and minimization should be implemented wherever possible, not all risks can be managed to zero. Persistent risks to an endemic spe-cies or threatened species will require more aggressive mitigation strategies than for native species likely to recolonize naturally post-eradication.
The rats’ use of the fumaroles has been subject of inconclusive historical debate. Simple behavioral and natural history studies must be undertaken to assess the significance of this habitat. These studies should be evaluated to determine whether bait can effectively be delivered into all potential rat territories. If it can, what changes need to be made to the general baiting strategy to ensure this? Further, are there additional sites that requiring a different baiting strategy?
Lastly, considering the scale and scope of Kiska (~10x bigger than Hawadax Island), what trials could be undertaken to inform the likelihood of success on Kiska? Should there be small scale biomarker trials? Would they be adequate? Is the Hawadax Island experience adequate learning to inform Kiska? Should there be an intermediate eradication on another, smaller, less costly Aleutian Island with additional monitoring to inform/validate the Kiska strategy? What are the costs or risks to implementing on Kiska based solely on what we know from Hawadax Island?
Figure 4.3 Managing risk in an adaptive management framework, including key inflection points in the project planning cycle and how they should relate to each other sequentially (black arrows). The red arrows represent feedback loops that provide the partnership opportunities to reassess assumptions and adapt management by updating feasibility assessments.
© island conservation

58
Box 4.18 Considering Kiska Feasibility Assessment
Kiska Island is large, 30,000 ha, actively volcanic island that creates its own weather near the summit. The island is pocked with creeks, shallow lakes, a historical battleground, and access to specific locations is very difficult. The remote island is in the far western end of the Aleutian Islands Chain, with extreme weather and limited adjacent safe harbors. Logistical access will be extremely challenging and requires thorough planning and assessment.
Experiences on Hawadax (Rat) Island in 2008 laid a foundation for what may be expected from a similar approach on Kiska. Hawadax tells us that the method of aerially applied bait with rodenticide is feasible – both in terms of efficacy (it can work) and risks (to birds and other wildlife). However, there is a likely risk of exposure to some native wildlife including gulls, eagles, shorebirds, and land birds. We know that effective mitigation strategies to minimize disturbance to Steller sea lions (Eumetopias jubatus) were used on Hawadax. We expect the ecosystem to recover from the absence of rats and secondary impacts from the rodenticide relatively quickly after the eradication. However, we also recognize from the Hawadax experiences that Kiska feasibility requires more effective strategies to avoid, minimize, and mitigate risks to eagles.
Yet, as with every project, there will be uncertainty. In the case of Kiska, uncertainty exists in terms of ecosystem understanding, and this uncertainty cannot be dispelled by knowledge gleaned from the globa history of eradications. The Leadership Team’s job in the process of discovery is to minimize that uncertain-ty. For example, are rats living underground near or in the fumaroles at the base of the volcano, an active seabird colony site? Some have suggested this and that the rats there may never come to the surface to feed.Assuming this is the case, can it be confirmed? If it is confirmed, how can the team deliver bait into every potential rat territory on the island?
The island supports numerous native species, potentially endemic subspecies of land birds, and rumors of fish-bearing streams supporting salmon and possibly endemic trout. What are the risks to the fish populations on the island, if they even exist? Are they endemic, seasonal, or present year-round? Can bait be effectively applied to the island without any bait drift into the freshwater lakes or ponds or streams? Is the approach even permitted under current regulations? Are there ways to overcome legal barriers, either technically or through policy updates?
This is the line of questioning that begins to define the Feasibility Assessment’s articulation of the needs for site visits, baseline monitoring, and trials.
Step 7 – Field Trials and ResearchIn this step the goal is to effectively fill knowledge gaps with facts, data, defensible methods, analyses, and re-sults. Standard Operating Procedures include: deter-mining the scope and scale of field trials with clearly defined objectives, assessing the best timing for the trial – particularly based on the project timeline and poten-tial operational windows to test assumptions and limit variables, and implementing peer review to assess trial design and any associated risks. Prior to implementing field trials, it will be important to set up appropriate safety and biosecurity measures with land managers and safety officers.
Step 8 – Conservation Measures(Monitoring) Plan
The objective in Step 8 is to develop a plan that guides monitoring of species expected to benefit from the
invasive species eradication. Conservation Measures refer to that pre- and post-project monitoring, as well as documenting, analyzing and reporting such re-sponses. Such planning ensures that the partnership agrees on the restoration action hypothesis, enabling collection and/or collation of baseline data prior to conservation action. The partnership’s biologists and ecologists should be engaged to support development of a Conservation Measures Plan that identifies eco-logical monitoring targets and outlines the monitoring strategy. Measures of improvements for aspects such as social, economic, and cultural benefits should be built into the monitoring planswhere applicable. Conserva-tion Measure’s efforts often extend beyond eradication confirmation and may be managed external to the erad-ication partnership and project itself.

59
Box 4.19 Recommendations for Monitoring
• Identify other overlapping agency/funder/ stakeholder monitoring goals that may be present, e.g. funding interest may be seabirds.
• Identify existing datasets, researchers, and history of research on the island that may pro-vide opportunities to fulfill monitoring needs.
• Align scientists with communications pro-fessionals to identify and budget for recov-ery-story communication opportunities and strategies.
4.3 Simultaneous Project Planning Activities
Figure 4.1 (The Project Planning Process) visualizes a “rainbow” of ongoing activities that are foundational to all four phases of project planning. These processes could be well under way at this point in the 15-step planning process. Some relate back to the activities rec-ommended in previous steps. However, if at this point in the process any of these cross-cutting planning ac-tivities are not yet under way, the Project Team should initiate them immediately. They are also described in Figure 4.2 (Project Planning Sequenced Steps) as Si-multaneous Project Planning Activities.
Simultaneous Activity P –Partner and Stakeholder Analysis
The purpose of this step is to take stakeholder thinking as deeply as the partnership Steering/Advisory Com-mittee can. Develop a stakeholder resource guide (e.g. graphic or narrative) that identifies and evaluates key players, values, relationships, potential conflicts, and other relevant information. Stakeholder engagement is an underlying, sustained activity and began with the initial inquiry with potential partners and assembling of key conservation and opinion leaders to the partner-ship in Phase I, Step 2. Engage in in-depth consultation with all project partners to assist with the analysis. Ex-pand identification and evaluation of partners, stake-holders, and associated relationships.
Simultaneous Activity S –Stakeholder Engagement Plan
Next the team should develop a stakeholder engage-ment plan based on the comprehensive partner and stakeholder analysis. Establish leadership roles and responsibilities, spokespersons, outreach leads, key
Box 4.20 Recommendations for Activity P
• Anticipate stakeholders’ concerns and address them proactively.
• Consider cultural practices, levels of conflict, organization’s missions.
• Consider organizing and hosting a conflict transformation seminar.
Box 4.24 What is a Stakeholder?
A stakeholder is an interested party to the project. They are people or organizations that may be impacted by the project, contribute in some way to the project, or simply have an interest or concern about the project. Each stakeholder will each have their own needs and should be engaged in appropriate ways throughout the project lifecycle.
Examples of Stakeholders: Communities living on the island or using the island for food and resources; island visitors, e.g. tourists, fisherman, research scientists, island land owners, implementing agencies, technical assistance providers, funders, government departments, local government/administration departments.
Community groups are key stakeholders in eradication projects. Their close connection to and dependency on the island may mean that they will be highly impacted by the effects of invasive species and may be major benefactors of the eradication project. Being so closely associated with the location, communities will also represent a key source of information for the project. Community support and involvement are vital to most eradication projects.

60
Box 4.21 Recommendations for Activity S
• Define roles and responsibilities from com-munications and external affairs profession-als to assist with stakeholder engagement. Consider a conflict transformation seminar to strategize and troubleshoot stakeholder scenarios.
• Revisit Feasibility Assessment with detailed understanding of stakeholder views/toler-ance. Do you need to adapt your plans?
messages, and communication tools. Consider prior-itizing outreach to those stakeholders most affected or potentially concerned about the project. Do not forget to engage the supportive base of local leaders who might be advocates for the project and who could help to quell misperceptions about the project when equipped with facts and communication tools.
Submit to appropriate experts within the partner-ship and the Steering/Advisory Committee for review to ensure the plan is in line with existing engagement strategies and is adapted from past experiences and learnings. This is an appropriate time to engage the partnerships’ public relations, external affairs, social scientists, and communications professionals to assist in developing strategies to inform, educate, and con-sult stakeholders to secure sufficient public support or acceptance for the operation.
Simultaneous Activity C – Communications PlanAt this point, formalize the partnership’s communi-cations team and develop a public (external) com-munications plan to support the project partnership, stakeholder outreach, public transparency needs, and regulatory compliance efforts.
Communications planning focuses on the partner-ship’s external communications, including identifying points of contact, developing key public messaging for outreach and media engagements, and being prepared for incident responses. Achieve an agreement with part-ners on what and when communications are needed and who will conduct what activities. Coordinate with the external affairs, communications, and stakeholder outreach professionals throughout the process to iden-tify and assess communications risks and to support one another with interactions aimed at securing partner and stakeholder acceptance for the project.
Box 4.22 Recommendations for Activity C
• Initiate communication planning early – par-ticularly during Feasibility Assessment devel-opment.
• Where possible, add external communica-tions clauses to partnership mou’s, contracts, project agreements.
• Technical internal communications (e.g. com-mand structure, radio communications, etc.) are part of the project’s Operational Plan but should link to external communications for transparency / media engagement / crisis communications needs.
Box 4.23 Recommendations for Step N
• Consider using specialist consultants for de-veloping risk assessments and management plans.
• Integrate partners and community into iden-tifying concerns – and managing perceptions versus real risks.
• Expect the unexpected; Consider conse-quences of “getting it wrong” and build in additional measures as appropriate.
• Food web analyses can be useful in pathway (toxin exposure) analysis. Consider presence and duration of risk.
• For risk management, use criteria (e.g. bait availability), not artificial, fixed-time periods.
• Revisit Feasibility Assessment after trials are completed; go/no-go?
Simultaneous Activity N –Non-target Risk Assessment
and Management PlanThe objective in this critical step is to develop a single or suite of non-target risk assessments and management plans that support the feasibility assessment feedback loops for adaptive management, planning documents, and risk management. Develop a draft diagram that proposes a process to address non-target risk manage-ment. Seek external peer review of assessments and plans prior to finalizing drafts (see Box 4.32, p. 63)
61
Box 4.25 Considering Kiska’s Outreach Strategy
While there may be no communities that rely directly on Kiska today, the historical use by the Aleut people must be acknowledged and honored. Local fishing groups and the Aleut community that use or have used the surrounding waters or the island should be consulted, their input considered, and questions addressed by the partnership. While the Project Team may know the likelihood of any impacts are low or can be effectively mitigated, the concerns and perceptions of the risks may be more significant to some constituents. Thus, consultation is needed to explain the project. Proactive outreach is the best strategy and can preempt active opposition often instigated during public engagement processes required in permitting processes.
What is Risk Management?• To the greatest extent possible, develop an under-
standing of significant project risks and associated decisions so that those risks can be accepted or managed (i.e. avoided, minimized, or mitigated).
Why is Risk Management Important?• Provides transparency of risk assessments and
decisions.• Identifies and approves risk management process-
es and track roles and responsibility over time.• Ensures decision-making is carried out at appro-
priate level.
How Do You Carry out Risk Management?• Identify what constitutes significant project risks.• Note that “significant” can have different implica-
tions (e.g. legally under nepa vs a stakeholder’s opinion).
• Evaluate the “likelihood,” “impact,” and “certainty” of significant project risks.
• Make recommendations/decisions about risk at appropriate level.
• Communicate the “likelihood,” “impact,” and “cer-tainty” of identified risks.
• Track risk throughout project lifecycle.
Simultaneous Activity O – Operational PlanThe previous assessments and documentation become the basis for collaborating within the partnership to de-velop the Operational Plan. The Operational Plan is the document that will guide staff through the preparation, mobilization, implementation, confirmation, moni-toring, and wrap-up of the eradication intervention. At this time the partnership determines the preferred alternative for eradication and develops a plan detailing the tools, steps, strategies, logistics, staffing, and time-frame necessary to achieve the highest probability of project success. At this stage the budget can be outlined
in greater detail to more accurately reflect more realistic project expenses. Consider at this stage inviting broader partner peer review to strengthen the plan.
Embracing Regulatory CompliancePublic policies, laws, rules, regulations, and their relat-ed processes are designed by governments to protect and engage local communities in decisions that may affect their interests. The project partnership should begin very early by developing and mapping the regu-lations, permits, authorizations, and public processes required of a project like this. This is a key overlay on the roadmap to success and should be viewed as an integrated aspect of planning, stakeholder mapping and engagement, and public outreach and communi-cations. The partnership can take these opportunities and inflection points as steps along the way to test and adapt their assumptions about community acceptance. If the partnership has reached this point in the process without doing so, initiate regulatory compliance efforts at this time.
Simultaneous Activity S2 – Safety PlanRisks to people are inherent in the conservation field. Considerations of public/staff safety are paramount and must be taken seriously. Conservation, while im-portant and significant, is never worth serious injury or death to actors. Human health and safety are para-mount for these operations, which can be logistically challenging and pose many risks. Thus, the design of the project must always take into consideration the potential impact to and safety of personnel, from the feasibility study, to implementation, to monitoring. Safety is paramount.
The objective here is to develop a Safety Plan that outlines the safety risks, actions necessary to minimize risks, and protocols to address emergencies if they are encountered. Be sure to explain how the health and safety of the operational team, stakeholders, and oth-

62
Box 4.27 Recommendations for Activity O
• Include field trials necessary to fill knowledge gaps identified within the Feasibility Assess-ment.
• Consider contracting out aspects of the plan to relevant experts if necessary.
• Include auxiliary plans or sections regarding non-target mitigation, biosecurity, safety, field communications, efficacy monitoring, etc. as warranted by project scope and complexity.
• Plan for regular After Action Reviews to capture lessons and take corrective action if necessary.
Box 4.26 Considering Kiska’s Regulatory Compliance
Recognizing that this is a U. S.-centric case study, one of the most resource- and time-consuming regulatory processes the lead agency will have to pursue is compliance with the National Envi-ronmental Policy Act (nepa) (see step 4 – Avoid Pre-decision). This will require an Environmen-tal Assessment and a public comment period, but it is only one of dozens of the compliance, permitting, and authorizations needed to “Go.” The usfws Refuge System staff documented at least 21 federal and state permits/authorizations required for an invasive rodent eradication (see Appendix 12). Many of these have overlapping requirements and time frames, but some of them are sequential and cumulative. A quick scan of the timelines articulated for each demonstrates that compliance efforts can take years. Mapping this at the outset can support downstream effi-ciencies.
Box 4.28 Recommendations for Activity S2
• Review the Operational Plan to identify risks to the health and safety of the operational team, residents, and visitors to the site (ex-pected and unexpected).
• The project’s staffing (incident command) structure should identify a safety officer with clear roles and responsibilities – i.e. leading safety plan development.
• Establish evacuation and medical services available for staff. These services must be no-tified in advance of departing to the field.
• Develop key safety materials/resources (emergency actions, emergency contact sheets) in multiple languages, as needed.
ers exposed to the project will be protected during the eradication operation. Plan in detail how each signif-icant risk will be managed. Include clear protocols in the event of an emergency that set the expectation for the eradication team and serve as a readily available reference throughout the project. Submit the plan to the Project Team for review to ensure it is in line with regional strategy.
Simultaneous Activity B – Biosecurity PlanIsland biosecurity refers to the policies, protocols, and practices designed to protect island ecosystems from the threat of non-native species introductions and in-cursions. Effective biosecurity stops non-native species from establishing populations by preventing, detecting, and responding to introductions.
The partnership and the long-term land managers need to develop a Biosecurity Plan that outlines the risk to island biosecurity, mitigations necessary to minimize risks, and biosecurity protocols and practices to apply during and after the project. Either within the Oper-ational Plan or as a separate document, detailing the biosecurity risks identified both short term (e.g. during an eradication project) and long term for the island
(both the threats and potential pathways). Include clear biosecurity protocols (prevention measures) which set the expectation for the eradication team and serve as a reference throughout the project. Submit to project partnership for review to ensure the plan is in line with local and regional strategies. All parties with connec-tions to the island play a role in biosecurity.
Biosecurity can be segmented into two parts, each having a different lead:
a. Project biosecurity – Biosecurity during project-re-lated work will often be led by contracted eradi-cation practitioners. This may or may not reflect

63
Box 4.29 Considering Kiska Safety Plan
Consider the specific risks that working on this project poses and design strategies to ensure the health and safety of the crew. Questions along these lines will be helpful: How will land crews access the island? How can they be kept safe? What happens in the event of a volcanic event? Who will be the safety officer? Who will provide evacuation and remote/on-site medical services?
Box 4.30 Recommendations for Activity B
• Use the Early Detection and Rapid Response (edrr) lines of defense: Prevention, Detec-tion (Surveillance), and Response.
• Incorporate community involvement.• Identify a team member to serve as a bios-
ecurity officer, and clearly outline roles and responsibilities.
• New information may become available that should be incorporated into the biosecurity plan. The plan should be a living document with periodic review.
• Work closely with partners to determine re-alistic protocol.
• Long term success will rely on the local part-ners having the resources (financial, human, and materials) and motivation to sustain bi-osecurity.
biosecurity protocols for public visitors because formal plans may not yet be in place.
b. General biosecurity – This refers to the overall bios-ecurity protocol put in place to protect the island and will typically be led and implemented by the land manager, a biosecurity entity, or some other entity with formal authority. The plan might be put in place before, during, or after an eradication proj-ect. Establishing a plan to be implemented after the eradication is a critical step before eradication occurs.
4.4 Phase III – Project Implementation
The Project Implementation Phase is divided into three stages:1. Pre-operational2. Implementation3. Post-operational
Pre-operational StageDuring the Pre-operational stage, final preparations for the eradication are undertaken. The Operational Plan contains what needs to be done, and in this phase, preparation activities are carried out. These include activities such as:
• Training the team• Completing any trials• Sourcing all equipment and consents• Field testing new or unproven equipment• Completing readiness checks• Pre-Operation monitoring to est. baseline for the
indicators prior to eradication• Implementing the prevention components of the
Biosecurity Plan
Box 4.31 Considering Kiska Biosecurity Plan
This is an isolated, unpopulated island, but it of-fers one of the few remaining safe anchorages to ships, fishing vessels, and visits from cruise ships in the Western part of the archipelago. The actual use of the islands by vessels other than the usfws R/V Tiglax is currently undocumented and must be considered in the feasibility assessment and bi-osecurity planning. Ultimately, if the eradication of rats from Kiska is feasible, the re-introduction of rats to the island would nullify the investment in the project. Therefore, if biosecurity cannot be effectively managed and ensured, the project should not proceed.
Box 4.32 Considering Kiska Non-targets
The native wildlife, including shorebirds, land birds, freshwater fish, and predators such as bald eagles, sea lions all need to be considered for potential impacts and risk avoidance, minimization, and mitigation management strategies, as outlined above.

64
Step 9 – Implement Biosecurity ProceduresIsland biosecurity measures must be in place before the Operational Phase to prevent new invasive species being introduced by the operation staff and activities.Biosecurity should be implemented as outlined within the Biosecurity Plan to minimize the risk of uninten-tional non- native species introductions.
Prevention activities can begin as soon as the Biose-curity Plan is approved. The partnership should work to ensure planning elements are realistic and sustainable over the long term.
Step 10 – Coordinate the Operational TeamSuccessful, large eradication projects require an organi-zational structure that has been staffed with the appro-priate personnel. The Operational Plan should include an incident command structure that clearly outlines roles, responsibilities, authorities, and expectations of personnel. This highly structured system evolved out of years of disaster management and minimizes confusion in complex field environments.
The Operational Team is expected to read, review, and understand the Feasibility Assessment, Opera-tional Plan, and other associated plans (e.g. biosecurity plan, communication plan, non-target mitigation plan, monitoring plan, etc.). Ensure the team members se-lected for each role have sufficient stills and training to perform in their position. Staff members and their supervisors share responsibility to work with project leads to identify skill gaps and participate in training. Confirm team member availability and secure home organizations’/supervisors’ approval of time with as much notice in advance as possible.
Step 11 – Finalize ContractsAt this point, all contracted personnel, equipment and supplies are made available, mobilized, and are on hand. Incident Commander and others with designated responsibilities for equipment, supplies, or contractors should all review the Operational Plan and other as-sociated plans (e.g. biosecurity plan, communication plan, non-target mitigation plan, monitoring plan, etc.) to determine what services, equipment, and supplies are necessary to complete all aspects of the operation. Readiness checks should be completed and reported to the Incident Commander.
Step 12 – Pre-operational MonitoringBefore implementing the operation to remove the invasive species, baseline monitoring results must be gathered and recorded. Perform monitoring as outlined within the various project plans, which may include: Assess conditions that may impact go/no-go decision
Box 4.33 Recommendations for Biosecurity
• Be prepared to address areas of the plan that are not proceeding/implemented as expected.
• Be willing to scale the biosecurity plan and expectations to meet realities of the island.
• Push for the best feasible level of biosecurity, but be realistic; the need is to reduce risk to an acceptable level, not achieve the imposs ible (i.e. zero-risk).
Box 4.34 Considering Kiska Biosecurity Procedures
All partners, staff, volunteers, contractors, op-erators, and potential evacuation and medical service providers should read and sign off on the biosecurity plan before the operation com-mences. Much of the protocols will require honor system adherence by project participants.
Box 4.35 Recommendations for the Team
• Ensure staff serving in multiple roles can re-alistically perform each one at the capacity required.
• Operational team / managers should antici-pate operational window shifts due to unex-pected circumstances (permit delays, weather events).
Box 4.36 Considering the Kiska Team
In remote settings like Kiska Island, many staff will need to be briefed and trained in their home duty-stations to avoid costs of on-site training. Weather and other logistical variables beyond the Management Team’s control can cause delays; anticipate those and have staff on-site, commit-ted to a period of time for implementation that factors in unpredictable variables.

65
to proceed with the eradication by revising feasibility assessments and assumptions, operational plans, and especially non-target risk assessments and mitigation strategies. Are there new or unexpected conditions (species types, numbers, or locations) that warrant plan revision? Are there assumptions that have been challenged?
At this stage, the implementation team can also es-tablish bait availability monitoring transects and bait degradation plots or other operational monitoring grids as required for operational efficacy monitoring. Similarly, pre-implementation non-target surveys and carcass searches can be conducted at this point if ap-propriate. Complete any remaining pre-operational ac-tions required to prepare for the eradication operation, biosecurity, and communications with stakeholders.
Implementation StageDuring the Implementation Stage, activities to remove the target species from the project site are implement-ed. This phase will be different for each type of eradica-tion project and for each target species. Although each project is unique, common practices and principles are shared and, by this phase, should have a:
• Plan that serves as a thorough guide for imple-mentation staff;
• Team of motivated, capable people with reliable support throughout the project.
The Operational Plan describes the details of the operation and should be followed closely. Remember when doing the field work to abide by the agreed-upon terms and procedures:
• Unplanned changes may increase the risk of failure.• If a situation necessitates a change, take time to
think through, discuss, and document significant deviations from the original plan.
• Where possible, have experienced people on site
Box 4.37 Recommendations for Contracts
• Anticipate significant time investment for this milestone.
• Source critical equipment and supplies (e.g. helicopter, rodent bait) as early as possible; resources unavailable as planned may result in significant project delays.
• Some contracts can be completed in advance of the project while others may carry a significant financial investment and should be finalized strategically (e.g. in relation to go/no-go trigger points that may result in project delays).
• Remain aware of potential conflicts of interest and sole sourcing.
• Double-check supplies and equipment for compatibility before leaving for the field.
Box 4.38 Recommendations for Pre-Operational Monitoring
• Consider this as an opportunity to provide staff training.
• For remote or difficult-to-reach islands, the pre- operational monitoring and the prepara-tion of the project site may occur during a Fea-sibility Assessment site visit or as part of the visit to the island to conduct the operation.
• Remember this is a roadmap, but that the se-quence of some steps can be adjusted to meet project contexts.
Box 4.39 Considering Kiska Pre-operational Monitoring
Due to remoteness, the Kiska Project Team could have a comprehensive understanding of this roadmap and related tasks from the outset. One advantage of this would be saving money and streamlining steps by integrating pre-operational monitoring steps with a scoping and feasibility assessment site visits that may have happened months or years prior to the actual eradication.

66
for discussions that support the Project Manager’s decision-making – those present at the site are best able to judge local conditions.
Step 13 – Implement EradicationSafely and effectively remove the target species from the project site. Follow the operational plan and oth-er planning documents (e.g. stakeholder engagement plan, safety plan, communications plan, biosecurity plan, etc.) to implement the project. Adjust the pro-tocol defined in the operational plan (e.g. within a project management group, using an incident com-mand structure, etc.). Keep a record of adjustments and associated justifications that resulted in changes to the operational plan.
Have several weather-proof binders on hand with all the plans, supporting documents, permits and au-thorizations so they can be referenced in the field by the Incident Commander and other key players in the system.
Post-operational StageThe Post-operational stage involves follow-up monitor-ing for bait uptake, methods efficacy, and confirmation. After the operation, several post-operation activities must be completed, e.g. remove unused bait, and take down public warning signs. The Project Lead will or-ganize an After Action Review (aar) to debrief how the eradication operation went with the Project Team. For some projects, Confirmation Monitoring will occur soon after the eradication operation. For other proj-ects it may be several months, a year or even two years before Confirmation Monitoring begins. Dedicating enough time and resources to the preparation signifi-cantly increase the chances of success of the Operation-al Phase. Anticipated benefits of the eradication will have been defined during the Feasibility Assessment and Project Planning.
Step 14 – Confirmation monitoringConfirm the eradication by conducting confirmation monitoring as outlined in operational planning doc-uments. Follow the communications plan to inform partners, stakeholders, and the public regarding the results of the project.This might happen months after the operation. In tropical settings, confirming of zero rodents present can be done within a year. In more temperate climates, confirmation monitoring is typically carried out after two full breeding cycles (calendar years). Confirmation monitoring varies by project. Consult the experts and the literature to learn more.
If your confirmation monitoring reveals that invasive
Box 4.40 Recommendations for Implementation
• Utilize support staff including an implemen-tation advisor to help address changes to the plan, and to offer guidance where necessary.
• Conduct regular aars with staff throughout implementation to identify opportunities for improvement.
• Verify that each activity and task associated with the operational plan has been completed. Offer updates to home and partner organiza-tions abreast of project progress.
Box 4.41 Considering Kiska Implementation
An eradication in a remote environment and at a large scale on Kiska will require a closely choreographed team of people and machinery working together to implement the eradication safely, effectively, and with a clear goal of deliv-ering bait into every potential rat territory on the island. Implementation is more likely to succeed if it is carried out under an Incident Command Structure (ics) which is a system designed for managing and choreographing projects of this nature. ics is well used in Forestry and conser-vation the world over; ample training resources and support networks are available.
individuals remain or a small population of invasive targets are left on the island, the Management Team will need to consider elements built into the Oper-ational Plan to remove the remaining individuals. If such efforts are deemed unsuccessful, the team should seek an external review to evaluate what factors likely contributed to the failure so that future plans can be adapted to increase likelihood of success.
4.5 Phase IV – Wrap-up
Step 15 – Post-project ReviewDevelop an Operational Report, indicate planning de-viations, document lessons learned, share and file for

67
Box 4.43 Recommendations for Confirmation
• Secure and maintain genetic samples beyond confirmation, have dna extracted, and placed in to long-term storage.
• This helps to determine if invasives found during confirmation are from source popu-lation or a reintroduction.
future reference. Compile an Operational Report that outlines the outcome of planning and implementation activities, and indicate deviations from the Operational Plan. Complete a final aar with project staff. Consider opportunities to publish lessons learned so the island restoration community can benefit.
Consider having pilots, contractors, etc. provide post-project reports to capture alternative views of the operation and supplement the Operational Report. Create a safe and comfortable environment for staff during an aar that fosters open discussion of all project aspects. During an aar, consider using a facilitator and note-taker that did not participate in the project so all project staff (including the Project Lead) can participate.
Step 16 – Celebrate and InformOf course, the project partnership will want to celebrate and share the successful conservation experience. An eradication project from start to end is a long process, and recognizing the achievements made all along the way is important. Now, the partners can celebrate the successful completion of the operation, and (once con-firmed) the conservation gains expected and recorded over time. For many, the entire purpose of the project was to protect the at-risk species and environments that can now begin to recover. For some, the primary cel-ebration may focus on benefits to culture, agriculture, economy, or another aspect of island life. Recognize, celebrate, and publicize the benefits to all stakeholders. Look to the communications partnerships to support the celebration through media and social media and look to practitioners to support through peer-reviewed literature.
4.6 Summary
We presented a roadmap for planning and implement-ing eradication of invasive vertebrates based on four major phases of an island invasive eradication project lifecycle adapted and practiced by Island Conserva-tion and partners. This roadmap represents common language, principles, and strategies used by island res-toration practitioners, and includes cultural, social, political, economic, and biological considerations for such projects. To illustrate the utility of the roadmap, we provide an example for the eradication of invasive rodents from Kiska Island in the Aleutian Archipela-go, an important island representative to the U. S., the North American, and Arctic regions.
Box 4.42 Considering Kiska Confirmation Monitoring
Consider the island size and types of sampling needed to confirm zero. Multiple types of de-vices including direct and indirect monitoring tools will likely need to be used, and in multiple locations across the island. Sampling for rodents should be targeted in prime habitats (typically shoreline in Elymus grass dominated habitat), and as widely distributed as possible with an emphasis on the uncertain habitats (e.g. fumer-ols) that were researched or identified a priori. In this temperate/Arctic climate, confirmation monitoring needs to wait two full breeding cycles (calendar years) to detect any remaining rodents back up to a detectable level.
Box 4.44 Recommendations for Communicating Success
• Openly recognize your team, partners, staff support behind-the-scenes, stakeholders, and conservation benefits to come.
• Publishing results is a versatile way to dissemi-nate the accomplishment and lessons learned.
4.7 Recomendations for U. S. Island Decision-Makers
We recommend implementing the roadmap once is-land priorities are established. Yet, to achieve eradica-tion success on all priority islands within the timeframe needed to prevent native population contractions and

68
species extinctions, the scale, scope, and pace of eradi-cation activity must accelerate significantly.
A 2009 usfws priority island restoration list identi-fies Kiska Island, among 85 island priorities for invasive species eradication in the U. S. alone. Though hundreds of successful eradication and restoration projects have taken place in North America, the current scale, scope, and pace of major island conservation interventions is insufficient to reach even the 85 priority islands in a generation. At the current rate of one major project every ~2/3 years in the U. S., it would take ~200 years to restore those 85 islands. Island restoration activity must increase dramatically if we want to secure these achievable conservation outcomes. Here we outline three key barriers or limitations and recommendations that nisc members could act on to help overcome, thereby increasing the scope, scale, and pace of island invasive species eradications in the U. S.
Time consuming and costly regulatory compliance require-ments – We showed that more than 22 permits or au-thorizations may be required before planning an erad-ication event. Securing these can be time consuming, and extends the total time and costs of a project. For example, National Environmental Policy Act (nepa) compliance processes and documents have ballooned beyond their original legislative intent. Today, nepa processes tend to engage the public in complex doc-uments that give them opportunities to second-guess planning details designed by some of the world’s lead-ing technical, toxicological, and ecological experts. These processes can take more than three years in some cases, even though they often include science repeated from previous Environmental Assessments (ea) with Findings of No Significant Impact (fonsi). These du-plicative processes can protract project timelines and drive costs up tens or hundreds of thousands of dollars.
Recommendations – Support and secure decisions in the United States to:a. Pursue equally protective nepa (and state equiv-
alent) efficiencies through either a Programmatic Environmental Impact Statement (peis), or Cate-gorical Exclusions for common island restoration activities, such as invasive rodent eradications, ro-dent “spills,” feral cat eradications, and invasive ungulate eradications.
b. Document and evaluate other permitting require-ments in U. S. and other jurisdictions, identify the most duplicative/inefficient, and pursue stream-lining the most cumbersome.
Insufficient funding – Typical island invasive species eradication projects cost between $3M and $5M; some cost more than $10M. In the U. S., the Fish and Wildlife Service Refuge System administers an appropriated annual competitive $1M Large Invasives Allocation. Projects often require private matches of 400% or more, which can take years to raise. Given that the island restoration rate needs to increase five-fold to restore 85 islands in 30 years, public and private funding and mobilization will need to match.
Recommendations – secure increased funding com-mitments from ngos, philanthropists, business, and government to implement island eradications, biose-curity, and restoration.
Insufficient capacity to support increased project through-put – While there are some federal agency staff and programs that are highly dedicated to advancing island restoration, the time and resources available to focus on this issue pales in comparison to scale and scope of the conservation problem and opportunity.
Recommendations – Expand and fund government staff dedicated to supporting island restoration pub-lic-private partnerships at eco-regional, national, and regional scales.
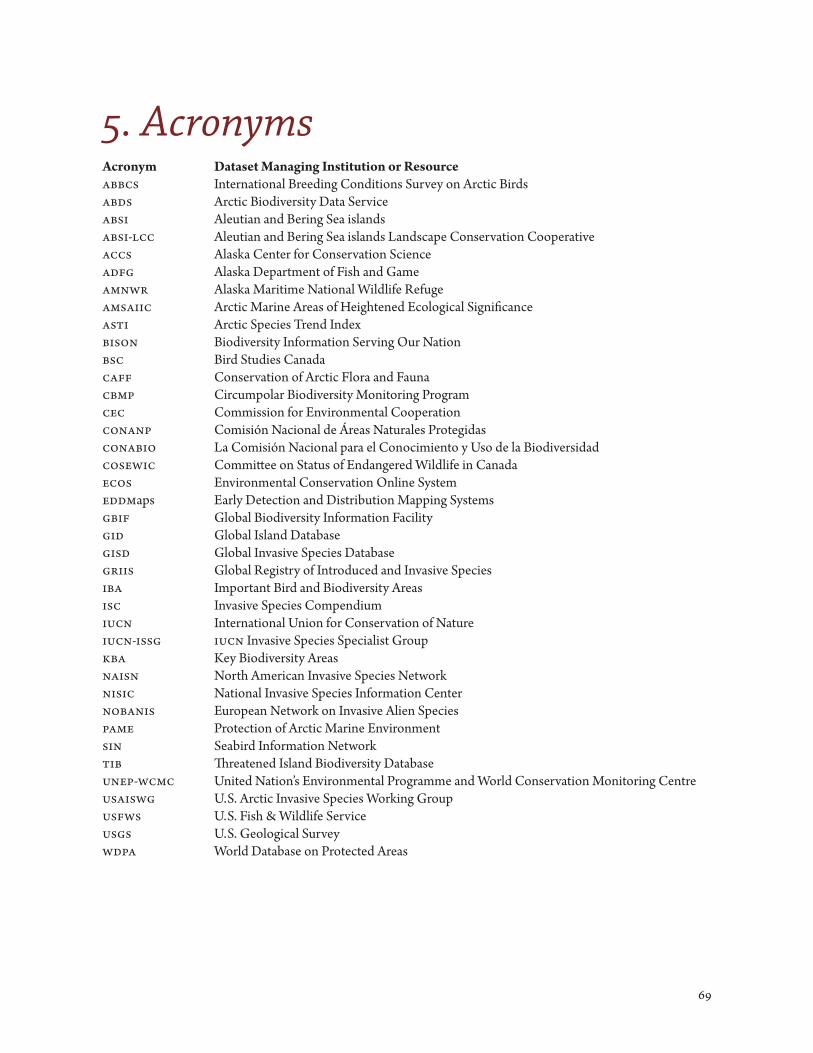
69
5. AcronymsAcronym Dataset Managing Institution or Resourceabbcs International Breeding Conditions Survey on Arctic Birdsabds Arctic Biodiversity Data Serviceabsi Aleutian and Bering Sea islandsabsi-lcc Aleutian and Bering Sea islands Landscape Conservation Cooperativeaccs Alaska Center for Conservation Scienceadfg Alaska Department of Fish and Gameamnwr Alaska Maritime National Wildlife Refugeamsaiic Arctic Marine Areas of Heightened Ecological Significanceasti Arctic Species Trend Indexbison Biodiversity Information Serving Our Nationbsc Bird Studies Canadacaff Conservation of Arctic Flora and Faunacbmp Circumpolar Biodiversity Monitoring Programcec Commission for Environmental Cooperationconanp Comisión Nacional de Áreas Naturales Protegidasconabio La Comisión Nacional para el Conocimiento y Uso de la Biodiversidadcosewic Committee on Status of Endangered Wildlife in Canadaecos Environmental Conservation Online Systemeddmaps Early Detection and Distribution Mapping Systemsgbif Global Biodiversity Information Facilitygid Global Island Databasegisd Global Invasive Species Databasegriis Global Registry of Introduced and Invasive Speciesiba Important Bird and Biodiversity Areasisc Invasive Species Compendiumiucn International Union for Conservation of Natureiucn-issg iucn Invasive Species Specialist Groupkba Key Biodiversity Areasnaisn North American Invasive Species Networknisic National Invasive Species Information Centernobanis European Network on Invasive Alien Speciespame Protection of Arctic Marine Environmentsin Seabird Information Networktib Threatened Island Biodiversity Databaseunep-wcmc United Nation’s Environmental Programme and World Conservation Monitoring Centreusaiswg U. S. Arctic Invasive Species Working Groupusfws U. S. Fish & Wildlife Serviceusgs U. S. Geological Surveywdpa World Database on Protected Areas

70
6. AcknowledgementsThis report was written by Island Conservation staff in consultation with the nisc Secretariat. We thank all those that participated in the formation and implementation of the report, including Island Conservation staff members D. Will (gis support), and E. Haber (contract support). We are grateful to all the individuals who provided exper-tise and data to inform Section 2, and are particularly thankful to the staff from the usgs Biodiversity Information Serving our Nation (bison) program, the U. S. Fish and Wildlife Service, the Alaska Science Center, NatureServe, Bird Studies Canada, Parks Canada, the National Commission for the Knowledge and Use of Biodiversity, the Grupo de Ecología y Conservación de Islas, and BirdLife International who played an involved role in this process. Finally, thank you to the many organizations/individuals who pioneered island restoration planning and invasive species eradication methods. While there are too many to name, we must acknowledge the New Zealand Department of Conservation and the Pacific Invasives Initiative, which were instrumental in our drafting of Section 4.

71
7. ReferencesAguirre-Muñoz A et al. (2011) Eradications of inva-
sive mammals on islands in Mexico: the roles of hisory and the collaboration between government agencies, local communities and a non-government organization. In: Veitch CR, Clout MN, Towns D (eds) Island Invasives: eradication and management. iucn, Gland, Switzerland, pp 386–393
BirdLife International (2018) Country profiles: U. S., Canada and Mexico Available from http://www.birdlife.org/datazone. Accessed 3 Feb 2018
Bomford M, O’Brien P (1995) Eradication or Control for Vertebrate Pests? Wildlife Society Bulletin (1973- 2006) 23:249–255
Brooke MdL et al. (2017) Seabird population changes following mammal eradications on islands Anim Conserv 21:3–12 doi:10.1111/acv.12344
Brooke MdL, Hilton GM, Martins TLF (2007) Priori-tizing the world’s islands for vertebrate-eradication programmes Anim Conserv 10:380–390 doi:10.1111/j.1469–1795.2007.00123.x
Broome K, Cox A, Golding C, Cromarty P, Bell P, McClelland P (2014) Rat eradication using aerial baiting.
Current agreed best practice used in New Zealand (Ver-sion 3.0). New Zealand Department of Conserva-tion internal document, Wellington, New Zealand
Butchart SHM et al. (2004) Measuring Global Trends in the Status of Biodiversity: Red List Indi-ces for Birds plos Biol 2:e383 doi:10.1371/journal.pbio.0020383
caff (2013) Arctic Biodiversity Assessment. Status and trends in Arctic biodiversity. Conservation of Arctic Flora and Fauna, Akureyri.
caff and pame (2017) Arctic Invasive Alien Species: Strategy and Action Plan, Conservation of Arctic Flora and Fauna and Protection of the Arctic Marine Environment Akureyri, Iceland.
Capizzi D, Baccetti N, Sposimo P (2010) Prioritizing rat eradication on islands by cost and effectiveness to protect nesting seabirds Biol Conserv 143:1716–1727 doi:10.1016/j.biocon.2010.04.020
Carwardine J, O’Connor T, Legge S, Mackey B, Possingham HP, Martin TG (2012) Prioritizing threat management for biodiversity conservation
Conservation Letters 5:196–204 doi:10.1111/j.1755- 263X.2012.00228.x
conabio (2012) conabio: Two Decades of History, 1992–2012 : Synthesis. Comisión Nacional para el Conocimiento y Uso de la Biodiversidad,
Courchamp F, Chapuis J-L, Pascal M (2003) Mam-mal invaders on islands: impact, control and control impact Biological Reviews 78:347–383 doi:10.1017/s1464793102006061
Crandall SG et al. (2018) Best practices: social research methods to inform biological conservation Aus-tralasian Journal of Environmental Management 25:6–23 doi:10.1080/14486563.2017.1420499
Cromarty P, Broome K, Cox A, Empson RA, Hutchin-son WM, McFadden I Eradication planning for in-vasive alien species on islands – the approach de-veloped by the New Zealand Department of Con-servation. In: Veitch CR, Clout MN (eds) Turning the tide: the eradication of invasive species, 2002. iucn ssc Invasive Species Specialist Group. iucn, Gland, Switzerland and Cambridge, UK., pp 85–91
Croxall JP, Butchart SHM, Lascelles B, Stattersfield AJ, Sullivan B, Symes A, Taylor P (2012) Seabird conservation status, threats and priority actions: a global assessment Bird Conservation International 22:1–34 doi:10.1017/s0959270912000020
Dawson J et al. (2015) Prioritizing Islands for the Erad-ication of Invasive Vertebrates in the United King-dom Overseas Territories Conserv Biol 29:143–153 doi:10.1111/cobi.12347
Hansgate A, Richards R, Schapiro B, Valencia ID (2008) Developing U. S. Fish and Wildlife Service Priorities for Addressing Invasive Species on Islands. Island Prioritization for Invasive Species Manage-ment – User’s Guide December 2008. University of Maryland Graduate Program in Sustainable De-velopment & Conservation Biology, College Park, Maryland
Harris DB, Gregory SD, Bull LS, Courchamp F (2012) Island prioritization for invasive rodent eradications with an emphasis on reinvasion risk Biol Invasions 14:1251–1263 doi:10.1007/s10530-011-0153- 1
Helmstedt KJ, Shaw JD, Bode M, Terauds A, Springer K, Robinson SA, Possingham HP (2016) Prioritizing
72
eradication actions on islands: it’s not all or nothing J Appl Ecol 53:733–741 doi:10.1111/1365-2664.12599
Howald G et al. (2007) Invasive rodent eradication on islands Conserv Biol 21:1258–1268 doi:10.1111/j.1523-1739.2007.00755.x
Isaac NJB, Turvey ST, Collen B, Waterman C, Baillie JEM (2007) Mammals on the edge: Conservation Priorities Based on Threat and Phylogeny plos one 2:e296 doi:10.1371/journal.pone.0000296
iucn (2016) The iucn Red List of Threatened Spe-cies Version 2016.2. http://www.iucnredlist.org.Accessed November 2016
Island Conservation (2014) A Process for Validating the Global Island Database. Unpublished report
Jenkins CN, Pimm SL, Joppa LN (2013) Global patterns of terrestrial vertebrate diversity and conservation Proceedings of the National Academy of Sciences of the United States of America 110:E2602-E2610 doi:10.1073/pnas.1302251110
Jones HP et al. (2016) Invasive mammal eradication on islands results in substantial conservation gains Proceedings of the National Academy of Sciences 113:4033–4038 doi:10.1073/pnas.1521179113
Jones HP, Tershy BR, Zavaleta ES, Croll DA, Keitt BS, Finkelstein ME, Howald GR (2008) Severity of the effects of invasive rats on seabirds: A glob-al review Conserv Biol 22:16–26 doi:10.1111/j.1523- 1739.2007.00859.x
Joppa LN et al. (2016) Filling in biodiversity threat gaps Science 352:416–418 doi:10.1126/science.aaf3565
Keitt B et al. (2015) Best practice guidelines for rat erad-ication on tropical islands Biol Conserv 185:17–26 doi:http://dx.doi.org/10.1016/j.biocon.2014.10.014
Leader-Williams N, Adams W, Smith R (eds) (2013) Trade-offs in Conservation: Deciding what to save.Wiley-Blackwell, Oxford
Margules CR, Pressey RL (2000) Systematic conserva-tion planning Nature 405:243 doi:10.1038/35012251
National Invasive Species Council (2016) Management Plan: 2016–2018. Washington, DC
National Invasive Species Council (2018) Enabling decisions that make a difference. Guidance for im-proving access to and analysis of invasive species information. Washington, DC
Reaser JK, Howald G, Veatch SD, Castellanos G (in submission) A Plan for the Eradication of Invasive Alien Species from Arctic islands Island Invasives Conference 2017
Reaser JK et al. (2007) Ecological and socioeconom-ic impacts of invasive alien species in island eco-systems Environ Conserv 34:98–111 doi:10.1017/S0376892907003815
Russell JC, Meyer J-Y, Holmes ND, Pagad S (2017) In-vasive alien species on islands: impacts, distribution, interactions and management Environ Conserv:1–12 doi:10.1017/S0376892917000297
Sarukhán J et al. (2015) Strategic Actions to Value, Con-serve, and Restore the Natural Capital of Megadi-versity Countries: The Case of Mexico Bioscience 65:164–173 doi:10.1093/biosci/biu195
Spatz DR, Newton KM, Heinz R, Tershy B, Holmes ND, Butchart SH, Croll DA (2014) The biogeogra-phy of globally threatened seabirds and island con-servation opportunities Conserv Biol 28:1282–1290 doi:10.1111/cobi.12279
Spatz DR et al. (2017) Globally threatened vertebrates on islands with invasive species Science Advances 3:e1603080
Trilateral Committee for Wildlife and Ecosystem Con-servation and Management (2014) Letter of intent in the subject matter of conservation and restoration of the insular ecosystems of the Mexican United States, United States of America, and Canada. https://www.trilat.org/index.php?view=down-load&alias=325-2014-loi-english&category_slug=2014-%20annual-meeting&option=com_doc-man&Itemid=254. Accessed 2 May 2018.
Veatch SD (2017) A primer: Developing an eradication prioritization schema for invasive alien vertebrate species on Arctic Islands. American University, School of International Service,
Veitch CR, Clout MN, Towns DR, (eds) (2011) Island Invasives: Eradication and Management. Proceed-ings of the International Conference on Island In-vasives. iucn, Gland, Switzerland and Auckland, New Zealand

National Invasive Species Council (nisc) SecretariatU. S. Department of the InteriorOffice of the Secretary1849 C Street NWWashington, DC 20240
Email: [email protected]: www.invasivespecies.gov
CONTR ACTOR’SR EPORT