data logger and software operating manual · into the user’s working environment. ... if the data...
TRANSCRIPT

Data Logger and SoftwareOperating Manual
August 2008
[email protected] • www.dwyer-inst.com • (219) 879-8000
PO Box 373 • 102 Indiana Hwy. 212, Michigan City, IN 46361
Phone: (219) 879-8000 • Fax: (219) 872-9057www.dwyer-inst.com • [email protected]

Data Logger Software
Page �
Table of Contents
Revised 8/22/08
Introduction ..............................................................................................2
Warranty............................................................................................2
Battery Warning .................................................................................3
Battery Replacement ..........................................................................3
Hardware ..................................................................................................4
Packaging Inspection.........................................................................4
System Requirements ........................................................................4
Software Installation .................................................................................5
Installing from CD ROM ....................................................................5
Install Dwyer 2.00.72 ........................................................................6
Install USB Interface Drivers ...............................................................9
Running the Software .............................................................................10
Getting Started ...............................................................................�0
Quick Start Guide ............................................................................��
Interface cable Installation ...............................................................�2
The File Menu .................................................................................�3
The Edit Menu.................................................................................23
The View Menu ...............................................................................23
The Communications Menu ............................................................40
The Device Menu ............................................................................44
The Graph Menu .............................................................................76
The Right Click Pop-Up Menu .........................................................93
The Window Menu ..........................................................................98
The Help Menu ...............................................................................99
Contact Information .............................................................................101
Terms and Conditions ...........................................................................102
Index .....................................................................................................104

Page 2
Dwyer Operating Manual
IntroductionSmall, simple and affordable, Dwyer data loggers can measure and record data at specified intervals. Dwyer’ Data Recording Software requires no programming skills, and enables the user to effortlessly select reading rate, specify the user’s ID, and initiate the start of data collection. For immediate use of the data logger refer to the Quick Start Guide on page ��.
In addition, all data can be saved in a format easily read by spreadsheet applications such as “Microsoft Excel®” or “Lotus �-2-3®”. It is our goal to bring you accurate, low-cost, easy-to-use data loggers that integrate easily into the user’s working environment. To better understand your needs and to better serve you, we welcome and appreciate your feedback.
Thank you for choosing Dwyer for your data logging requirements.
WarrantyProducts manufactured by Dwyer Instruments, Inc., are warranted against defective material and workmanship for a period of one year, starting from the date of shipment. In the event that a Dwyer product is found to be defective, Dwyer will repair or replace the product at its sole discretion. Such repair or replacement shall be the sole remedy of this warranty.
This warranty extends only to the original purchasing customer and does not apply to any unit, which in our sole judgment, has been subjected to:
a) Operating or environmental conditions in excess of our written specifications or recommendations;
b) Customer damage, misuse or neglect; c) Improper installation, repair or alteration.
This warranty excludes batteries.Except as to title, this is our only warranty for the products. Dwyer
Instruments, Inc. expressly disclaims all other warranties, guarantees or remedies—whether expressed or implied or statutory—including any implied warranty of merchantability or fitness for a particular purpose. We also disclaim any implied warranty arising out of trade usage or out of a course dealing or course of performance. We do not guarantee the integrity of data or warranty that the products will operate uninterrupted or error-free.
Dwyer data loggers and their associated software have been thoroughly tested and the documentation reviewed. However, Dwyer does not warrant the performance of its products, or that the products or their associated software will operate as described in this manual.
Please see page 102 for a more descriptive explanation of our warranty.

Data Logger Software
Page 3
Battery WarningMany Dwyer data loggers contain a lithium battery. Do not cut the battery open, incinerate, or recharge. Do not heat lithium batteries above the specified operating temperature.* Dispose of the battery in accordance with local regulations.
Battery ReplacementMost Dwyer miniature data loggers contain a user-replaceable 3.6 volt or 3.0 volt lithium battery. Replacement batteries may be purchased from the factory. Before attempting to replace a battery, contact Dwyer to ensure the device has a user-replaceable battery. If the device does not have a user-replaceable battery, or the customer simply does not wish to replace the battery themselves, the device may be returned to the factory for service. In this case, the customer should contact the company from which the unit was purchased for an Return Goods Authorization (RGA) number and return the product as instructed by customer service. Dwyer will replace the battery and return the data logger promptly.

Page 4
Dwyer Operating Manual
HardwarePackage Inspection
Verify that the data logger(s) was not damaged in transit by carefully unpacking all items in the shipping carton and looking for obvious signs of physical damage. If the data logger is damaged, repack it in its original container and contact Dwyer Customer Service at (2�9) 879-8000. Any damage noted upon receipt must be documented to file a claim against the carrier.
System Requirements
Dwyer Data Recording software requires an IBM or compatible PC with the following:
•- Pentium or higher processor
• Windows 95/98/2000/XP/NT/VISTA
• �28 MB RAM
• Color 800 X 600 monitor
• 30 MB free disk space
• 3.5” disk drive or CD-ROM
• Available 9 pin male serial (COM) port or USB port
NOTE: Although the software is designed to work with the Windows operating systems listed above, Dwyer cannot guarantee operation on OS’s no longer supported by Microsoft Support Life Cycle Policy.

Data Logger Software
Page 5
Software Installation
Installing from CD ROM
Insert the CD ROM labeled Dwyer Data Recording Software into the host computer’s CD ROM drive. If the CD does not run automatically, from the Windows Start Menu, choose the Run command and type d:\autorun.exe into the Open field and click OK, it will bring the installation menu window Dwyer CD Contents as shown below.
If the host computer’s CD ROM Drive is not the D: drive, use the correct letter for the instructions above.
Click Install Dwyer 2.0072.

Page 6
Dwyer Operating Manual
Install Dwyer 2.00.72
The selected language will be displayed on the installation windows.
The following screens are examples of the installation windows.

Data Logger Software
Page 7

Page 8
Dwyer Operating Manual

Data Logger Software
Page 9
Install USB Interface Drivers (For Use with DL700) The USB interface drivers can be installed when the host computer has USB drivers. After the installation the data logger will communicate with the PC through USB port. The host computer must have USB drivers to install the USB interface drivers.
Select the Install button to install USB interface drivers.
Note: A pop up box may appear stating, “This software may impair or destabilize the operation of your system, either immediately or in the future.” Do not worry about this message. The drivers have been tested and will not interfere with the operation of the host computer. Select “continue” to proceed with the installation.

Page �0
Dwyer Operating Manual
Running the Software
Getting Started
For simplicity and ease of use all Dwyer data loggers operate similarly. The Dwyer data logger software automatically configures itself specifically for each class of logger by reading the device type. Each class of logger has a unique device type and identifies itself when queried by the host computer. This has been implemented to minimize confusion and to eliminate the need to learn different software packages. Therefore, only one software package and only one manual is required for all Dwyer Data Loggers. In certain instances where differences occur, an attempt is made in this manual to bring clarification and avoid confusion. Most examples used in this manual are for the HTDL-�0, but can be extended to all devices.
Run the software by selecting the Dwyer icon in the Dwyer Software program group. The software will open and is immediately ready for starting a device or downloading data. The tool bar and menu items will appear as shown below. All tool bar commands are also menu commands.
Note: Throughout this manual, when a menu command has a corresponding tool bar command, the tool bar icon is included with the description of the menu command.

Data Logger Software
Page ��
Quick Start GuideFor immediate use of the data logger, follow these six simple steps:
�. Install the software (see Software Installation page 5, if help is needed with this step).
Attach the logger:
�a. If using the TDL-SC, attach the logger to the host computer using the interface cable.
�b. If using the DL700, install the USB drivers first, then attach the logger to the host computer using the interface cable, as shown in the diagram on the next page.
2. From the Communication Menu, select Auto Configure Port.
3. From the Device Menu, select Start Device.
4. Select the Reading Rate to be used. Leave all other settings alone.
5. Click on Start Device.
After a brief pause while the software communicates with the device, the user will see the message Device Started. The device is now running and taking measurements. Place it in the elected environment to perform its measurements. When the user is ready to view the measurements, simply connect it to the computer and select Read Device Data from the Device Menu.

Page �2
Dwyer Operating Manual
Interface Cable Installation
�. Fully insert the male connector of the DL700 interface cable into the female receptacle of the data logger. Fully insert the female USB connector into the USB.

Data Logger Software
Page �3
File Menu
The File Menu will appear as follows:
File Menu: New
Select this command to create a new graph window. It will not discard any information that is already on the screen or in existing windows. Multiple windows may be created and displayed simultaneously, and may be manipulated using the Window Menu, page 98.
File Menu: Open
Select this command to open previously saved data files, loading them into the current window. If no windows are open, a new one will be created. Data in the current window is not discarded, new data is added as an additional data set. Multiple windows may be created and displayed simultaneously, and manipulated using the Window Menu, page 98.
Page �4
Dwyer Operating Manual
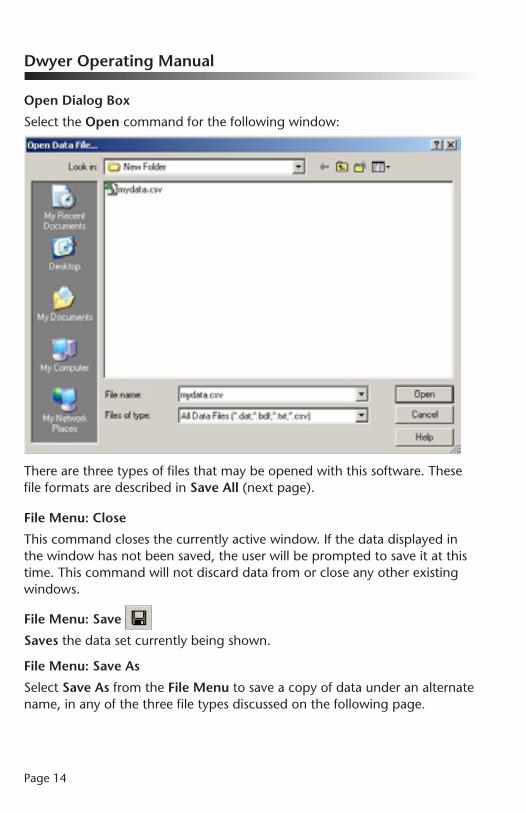
Open Dialog Box
Select the Open command for the following window:
There are three types of files that may be opened with this software. These file formats are described in Save All (next page).
File Menu: Close
This command closes the currently active window. If the data displayed in the window has not been saved, the user will be prompted to save it at this time. This command will not discard data from or close any other existing windows.
File Menu: Save
Saves the data set currently being shown.
File Menu: Save As
Select Save As from the File Menu to save a copy of data under an alternate name, in any of the three file types discussed on the following page.

Data Logger Software
Page �5
File Menu: Save All
Select Save or Save All from the File Menu to display the window as shown below:
Data may be saved as one of three types of files. These files are as follows:
*.dat
This is our own internal ASCII data format. This format can be viewed by most text editing or word processing software.
*.txt
Files stored in this format contain tab delimited text and can be viewed by most word processing and spreadsheet programs.
*.csv
Files stored in this format contain comma separated values and are directly readable by Microsoft Excel® and other spreadsheet programs.
Note: In order to save a data set, it must be displayed in the graph or data tab.Note: To read data in an external program use the Export Data command.

Page �6
Dwyer Operating Manual
File Menu: Save All As
Select Save All As from the File Menu to save all copies of data sets under alternate names, in any of the three file types discussed.
Note: The user will be prompted to save each individual data set as a different file. The software does not open/save multiple data sets in a single file; they are required to be uploaded individually.
File Menu: Export Data
Select Export Data from the File Menu to export a copy of the data in a format that is designed for easy import into programs such as Excel®. Data can be read in the same units displayed on the screen. The three file types are the same as those provided with the Save command, except data which is specific to the software, such as graph colors, is stripped out. Use Export to open the file in another program.
File Menu: Example Data
Select the Example Data command from the File Menu to load and display sample data. Example data can be given for Temperature, Humidity, Pressure, Voltage, Current, and Level Data Recorders. Simply enter in the part number of a data logger and click O.K.
File Menu: Save Memory Dump
Select Save Memory Dump from the File Menu to download the entire memory contents of the attached device and save it in binary format. This command is useful to the factory for troubleshooting problems in the field and recovering data from a malfunctioning device. The user will typically not use this command unless directed to do so by our tech support department.
File Menu: Page Setup
Select Page Setup from the File Menu to bring up the window on the next page. This window allows the user to select the printer and printing options. The options will vary according to the particular printer and network. Con-sult the printer manufacturer for details about the printer’s options.

Data Logger Software
Page �7
File Menu: Print Summary
Select Print Summary from the File Menu to print the statistics for currently selected device.
File Menu: Print Graph
Select Print Graph from the File Menu to print the currently selected graph to the host printer. The single data set file can be printed by viewing the Graph tab. Printing out the composite graph can be achieved through the Composite Graph tab.

Page �8
Dwyer Operating Manual
Print Dialog Box
Select Print Summary or Print Graph from the File Menu to bring up the Print Dialog Box:
File Menu: Print Data
Select Print Data from the File Menu to print tabular data. The Data Table Report allows the user to customize their tabular data for general or reporting purposes. The amount of data will vary depending upon the selected data sets and the reading ranges that selected by the user.
Preview Report (See Print Preview)
The window to the right is the sample of the report preview:

Data Logger Software
Page �9
Single Graph Data File
To make a report for a single file, select the Graph Tab. Select Print Preview from the File Menu. There will be a check mark next to the Print Preview option. Select Print Data from the File Menu. The following form will appear:

Page 20
Dwyer Operating Manual
List View (top of the form)
- The user can select or unselect the channels by clicking the cell of the Status column Report Header - The user can change the report title - The user can change the font size for the report - The user can setup the report page by clicking the Page Setup button (see Page Setup, page �6). Select Channel Title - The user can select the channel title by using predefined or customized options Report Fields - The Minimum, Maximum and Delta values are not available for the single graph report Channel Selection - The user can select which channels to display - The Unit Type and Unit fields are available if the user selects the Select Unit Type option button Preview button - Click the Preview button to preview the report of the single graph.
Composite Graph Data File
List View (top of the form) - The user can select or unselect the channels by clicking the cell of the Status column. The Setup button will appear if the file is selected.

Data Logger Software
Page 2�
Click the Setup button, the Channel list view appears (the channels list of the file will be displayed with a Back button).
Click the Back button to back to the file list view. Report Header - The user can change the report title. - The user can change the font size for the report. - The user can setup the report page by clicking the Page Setup button (see Page Setup, page �6). Select File Title - The user can select the file title by using predefined or customized options File Selection - The user can use the Select All Files check box to select all files - The unit field is available if the user selects a specific unit type from the Unit Type field Report Fields - The Minimum, Maximum and Delta are not available if All Units is selected as the Unit Type. Preview Button - Click the Preview button to preview the report of the composite graph.
Print Report
�) Print the report without the preview (uncheck the Print Preview option

Page 22
Dwyer Operating Manual
from the File Menu)Click Print Data and the form Data Table Report appears as below.Click the Print button and the Print dialog box appears.
2) Print the report from the preview
Click the Print button on the tool bar of the report preview window
File Menu: Print Device Configuration
Select Print Device Configuration from the File Menu to print information that relates to the data set file currently displayed on the screen.
Note: The message unable to print device configuration will inform the user if there is no data set file open.
File Menu: Print Preview
Select Print Preview from the File Menu to place a check mark next to it. When this menu item is checked, the result of Print Graph, Print Data, Print Summary and Print Device Configuration will display on the screen, rather than on the host printer. This allows a preview of the data to be printed. To uncheck this menu item select Print Preview again.
File Menu: Exit
Select Exit from the File Menu to close all open files and exit the program. There will be a prompt to save all files that have been changed

Data Logger Software
Page 23
Edit MenuThe Edit Menu will appear as follows:
Edit Menu: Cut, Copy & Paste
The Edit Menu tool bar is currently disabled. The Cut, Copy and Paste functions are not available for use.
View MenuThe View Menu will appear as shown:
View Menu: Tool barThe Tool bar option is used to show or hide the tool bar located at the top of the screen. Hiding the tool bar allows more room for the graph being displayed.
View Menu: Status Bar
The Status Bar option is used to show or hide the status bar located at the bottom of the screen. Hiding the status bar allows more room for the graph being displayed.

Page 24
Dwyer Operating Manual
Select Preferences to display the window shown below.
The following six tabs are found in this window: File, Communications, Display, Data, Graph, and Calculations. Each tab provides the ability to set preferences for a part of the program.
File TabSelect the File tab from Preferences Form, to set the default file locations.
Default Log File Location
The Default Log File Location from the Preferences Form refers to the log files that are created while the software is running. Not all data loggers create a log file. The software appends a log file for each wireless transmitter when it receives a transmission. Through this option the user can change the default location where the log files are saved.
Data Logger Software
Page 25
Default INI File Location
Select the Default INI File Location from the Preferences Form to refer to the initial settings the software will apply when it starts up. For those without read/write privileges, the INI File Location can be changed to a public folder for multiple users.
Default Data File Type
Select the Default File Type to choose from the list of file types in the drop down menu . The type can be changed when the file is saved, it is simply convenience setting. When checked, the data will be automatically be saved to the default file location that was selected in the file tab.
Note: This is limited to the data that was downloaded from the device to the computer (see Read Device Data, page 57).
Default Data File Location
Select the Default Data File Location from the Preferences Form to refer to the folder that the data sets are saved to. When the user Saves a file (page �4), the chosen directory will be the default save location. This can be changed when the user saves the file, it’s simply a convenience setting.

Page 26
Dwyer Operating Manual
Communications TabThis tab sets various Communications preferences.
Auto configure Comm Port
Check this option to automatically configure the correct COM port in use to the host computer’s . Leave this item checked unless the software is having trouble identifying the host computer’s COM port (this happens rarely, usually only on older PCs). If this item is unchecked, the user must configure the Comm settings manually. See Select Comm Port, page 40.
Autoconfigure Baud Rate
Check this option to automatically configure the correct communications speed. Leave this item checked unless the software is having trouble identifying the host computer’s COM port (this happens rarely, usually only on older PCs). If this item is unchecked, the baud rate must be configured manually. See Select Baud Rate, page 40.

Data Logger Software
Page 27
Communications Redundancy
This refers to the number of times the PC will try to communicate with the logger. Setting the tab closer to the left will decrease the number of times it will try to communicate and setting the tab further to the right will increase the number of times it will try to communicate with the logger.
Communications Timeout
This refers to the length of time the PC will wait for the response from the data logger. Setting the tab closer to the left will decrease the amount of time the PC waits for a response, while setting the tab further to the right will increase the length of time the PC will wait. This setting is used when the user is has a device that takes a longer time to respond to the PC.
Page 28
Dwyer Operating Manual
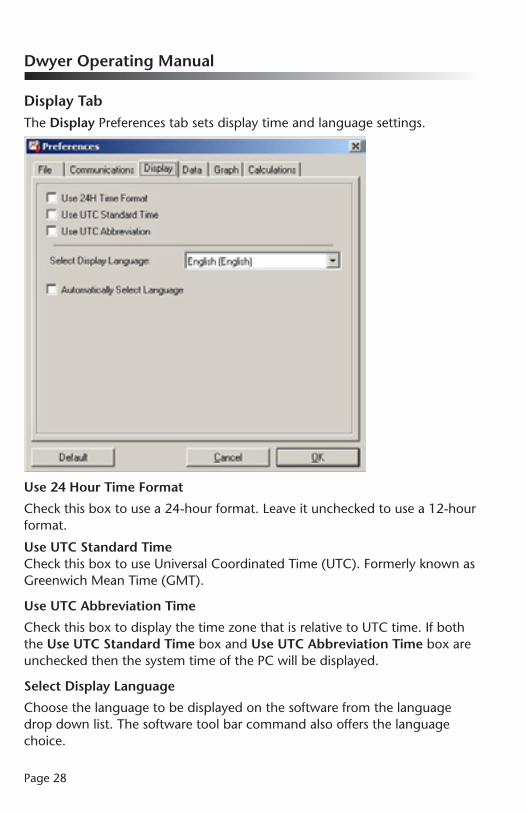
Display TabThe Display Preferences tab sets display time and language settings.
Use 24 Hour Time Format
Check this box to use a 24-hour format. Leave it unchecked to use a �2-hour format.
Use UTC Standard TimeCheck this box to use Universal Coordinated Time (UTC). Formerly known as Greenwich Mean Time (GMT).
Use UTC Abbreviation Time
Check this box to display the time zone that is relative to UTC time. If both the Use UTC Standard Time box and Use UTC Abbreviation Time box are unchecked then the system time of the PC will be displayed.
Select Display Language
Choose the language to be displayed on the software from the language drop down list. The software tool bar command also offers the language choice.

Data Logger Software
Page 29
Automatically Select Language
Check the Automatically Select Language box (see screen previous page) to choose the restarted software language as the computer system language and ignore the selected language. Unchecked the restarted software language is always the selected language.
Data Tab
The Data Preferences tab can set various data preferences.
Title Preferences
The Title Preferences settings determine which items appear in the Title of the data set. If all boxes are unchecked untitled data set will appear as the title name. The Device Type, Device Serial Number, Device ID, Down-load Date, and Download Time can be selected or unselected . Check the Prompt for Title box to prompt for a title each time, rather than generating its own title. These features must be enabled prior to downloading the data for them to apply.

Page 30
Dwyer Operating Manual
Units Preferences The Units Preferences settings determine the units used for the various types of measurements. In Select Unit Type, select the type of measurement from the drop down list, then Select Preferred Units to use from the second drop down list. The high point and low point range can be defined on the graph. This defines the Preferred Scale. See Set Graph to Preferred Scale, page 83.
Clear Unit Preferences
Select the Clear Unit Preferences button to set all unit preferences to the [No Preference] setting.
Automatically update units
Check the Automatically Update Units option to allow preferred units to change when the corresponding units are changed on the screen.
Apply units to all open data
Check the Apply units to all open data option to trigger all corresponding units to change data sets on the screen. From this tab the graph preferences can be selected.

Data Logger Software
Page 3�
Graph TabIn the Graph Preferences tab the graph preferences can be selected.
Autoscale Graph Check the Autoscale Graph option to automatically optimize the vertical scale of the graph to match the minimum and maximum data points shown on the graph. This provides maximum resolution for viewing the graph.
Note: The Composite Graph will have the Autoscale Graph option applied if there are multiple data sets that have the Autoscale Graph option applied and un-applied.
Smart Autoscale
Check the Smart Autoscale option to round the vertical and horizontal scales to a tenth of a decimal point providing a slightly wider scaled range. If the option is off then the horizontal and vertical scales will be rounded to the thousandth.
Note: The Composite Graph will have the Smart Autoscale option applied if there are multiple data sets that have the Smart Autoscale option applied and un-applied.

Page 32
Dwyer Operating Manual
Buffer Vertical Scale
Check Buffer Vertical Scale option to add an extra �0 measurements to the beginning and end ranges of the vertical scale, making the plotted lines centered in the graph.
Autoscale on Zoom
Check Autoscale on Zoom option to automatically scale the graph when zooming in using the horizontal zoom tool only.
Synchronize Time
Check Synchronize Time option to view multiple graphs which only affects the composite graph tab. When checked, multiple data sets will be shown over a scaled period of time through the composite graph. When unchecked the multiple data sets will instead overlap each other and the time shown is directly related to which graph the cursor has selected.
Synchronize Vertical Scale
Check Synchronize Vertical Scale option to view multiple graphs which only affects the composite graph tab. When checked multiple data sets are shown with scaled vertical ranges, meaning each parameter (temperature, humidity, etc.) will have one default set range for each parameter. When the option is unchecked each plotted graph will have its own individual scaled vertical range.
Annotate Graph
Check Annotate Graph option to permit all annotations be viewed on the computer screen, this option is beneficial when printing the annotations. When this option in unchecked, the data can still be annotated, yet it is not visible on the screen unless that data point has been clicked, whereas the annotation appears in the top left hand corner of the graph.
Animate Graph
Check the Animate Graph option to create blinking maximum and minimum alarm setting lines on the screen.

Data Logger Software
Page 33
Calculations TabIn the Calculations Preferences tab various calculations preferences can be set.
Edit Calculation
Select the Edit Calculation button, the following window will appear:
F0
Select the F0 button to display the settings for F0, a common unit of sterilization.
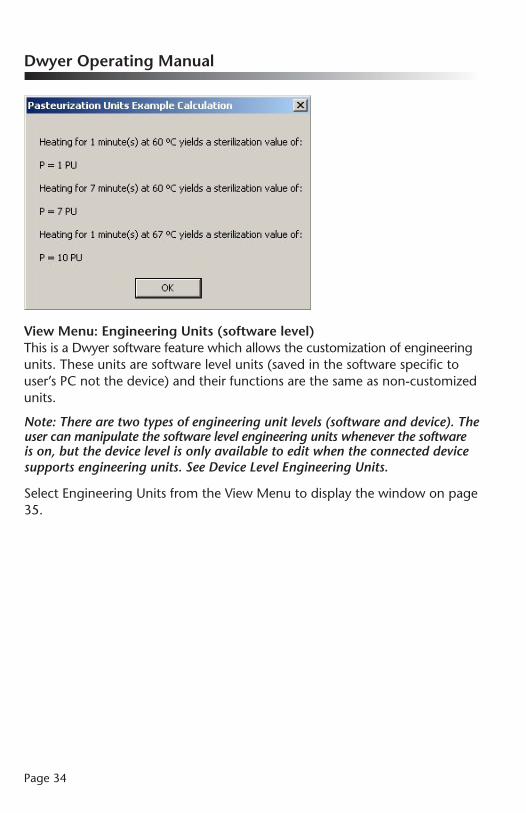
PU
Select the PU button to display the settings for pasteurization units. Select the Example button to show the user and example. The window will appear as follows on the next page.
Page 34
Dwyer Operating Manual
View Menu: Engineering Units (software level)This is a Dwyer software feature which allows the customization of engineering units. These units are software level units (saved in the software specific to user’s PC not the device) and their functions are the same as non-customized units.
Note: There are two types of engineering unit levels (software and device). The user can manipulate the software level engineering units whenever the software is on, but the device level is only available to edit when the connected device supports engineering units. See Device Level Engineering Units.
Select Engineering Units from the View Menu to display the window on page 35.

Data Logger Software
Page 35
Create Engineering Units by using the Engineering Units Wizard button (see above) or Create a new unit button on bar, below.

Page 36
Dwyer Operating Manual
Engineering Units Wizard
Select the Engineering Units Wizard button to bring up the Engineering Units Wizard window in the following screen.
The wizard will calculate the engineering unit based on the input.
Edit Engineering UnitsIf the box below is enabled, the engineering units can be edited directly. Otherwise, choose the Create a new unit button (see previous page) or highlight a record from the Engineering Units list to enable this section.
Definition Graph The Definition Graph compares Recorder Units and Scaled Engineering Units when data is input for the engineering units.

Data Logger Software
Page 37
Recorder Units
Select a Recorder Unit must be selected based on the type of parameter being converted. Input the low/high reference values. When no specific unit is displayed the Select a Recorder Unit dropdown list (Fig. �) will contain all available units, otherwise, it will only contain the unit that relates to the displayed unit (Fig. 2) as shown below.
Fig. 1
Fig. 2

Page 38
Dwyer Operating Manual
Scaled Engineering Units
The Scaled Engineering Units (see screen shot page 36) requests the description, label, and low/high unit values of the engineering unit.
The description field allows the full name of the parameter to be displayed in the software. Examples of this are Volts, Milliamps, pH, Gallons, etc. This name is displayed on the graph and data table as the description of the data.
The label field allows the label of the parameter to be displayed in the software. Examples are V, mA, pH, G, etc.
The gain and offset fields are the equivalent of the “m” and the “b” respectively in the “Y = m * X + b” equation. X is the raw data from the device and Y is the data displayed by the software.
Choose the Scaled Engineering Units dropdown list to select the unit ID. If Use Next Available Unit ID is set as the default, the software will assign the next available unit ID to the created unit.
If the checkbox Save these units when program closes, screen shot bottom of Edit Engineering Units, is checked when the program closes, the created unit will be saved in the software after the software is closed. Otherwise, the created unit will be lost after the software closes. Edit a unit and uncheck this box to remove the unit from the list.
Engineering Units List
The Engineering Units List tab will display all the customized engineering units. To edit a record, highlight it. The information will be displayed in the Edit Engineering Unit’s Recorder Units section (see previous page).

Data Logger Software
Page 39
Note: The Show all units checkbox defines the status of both Engineering Units List tab and Use Next Available Unit ID dropdown list box. If checked, all available unit ID’s will be displayed on both fields. The unit ID range is 0-255.
Standard Units List
The Standard Units List tab will display all the available unit type(s) that can be used to make customized engineering units.

Page 40
Dwyer Operating Manual
Communication MenuThe Communication Menu displayed below
Communication Menu: Auto Configure Port
Select Auto Configure Port from the Communication Menu to automatically indicate which COM/USB port the device is attached and which baud rate the device uses to communicate. This command operates only when an interface cable is connected to an available COM/USB port and a functioning data logger. If this command fails to find the device, then the device is not functioning properly or the interface cable is not properly connected. Once the software has identified the COM/USB port and the proper baud rate, the information will be stored in the configuration file. This command only needs to be activated once. If a different COM/USB port is later used, or if a device with a different baud rate is used, then re-select the command.
Communication Menu: Select Comm Port
Select the Comm Port to manually set/choose the communication/USB port in which to connect the data logger. The correct COM/USB port must be selected or the software will not to communicate with the data logger. To automatically configure this option, refer to Auto Configure Port, above.
Communication Menu: Select Baud Rate
Select the Baud Rate from the Communication Menu to manually set the speed to use to communicate with the data logger. The correct baud rate must be selected, to allow the software to communicate with the data logger. To automatically configure this option, refer to Auto Configure Port, above.

Data Logger Software
Page 4�
Communication Menu: Accept Palm Input
Select Accept Palm Input from the Communication Menu to allow the software to download data from a PDA. A specific interface cable is required for this feature to work. Contact the factory for more information.
Communication Menu: Accept Real Time Wireless Input
Selecting Accept Real Time Wireless Input from the Communication Menu enables the software to accept real time readings from wireless transmitting devices. To accept these readings, the computer must have an a specific interface cable connected to an available COM port and the transmitter must be enabled to transmit. Contact the factory for more information.
Communication Menu: Wireless Modem Setup
Select Wireless Modem Setup from the Communication Menu to activate the following window:
Page 42
Dwyer Operating Manual
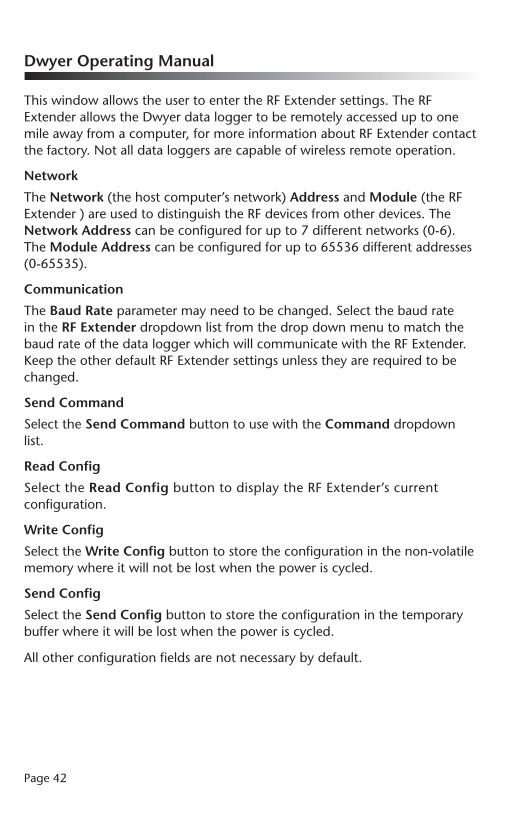
This window allows the user to enter the RF Extender settings. The RF Extender allows the Dwyer data logger to be remotely accessed up to one mile away from a computer, for more information about RF Extender contact the factory. Not all data loggers are capable of wireless remote operation.
Network
The Network (the host computer’s network) Address and Module (the RF Extender ) are used to distinguish the RF devices from other devices. The Network Address can be configured for up to 7 different networks (0-6). The Module Address can be configured for up to 65536 different addresses (0-65535).
Communication
The Baud Rate parameter may need to be changed. Select the baud rate in the RF Extender dropdown list from the drop down menu to match the baud rate of the data logger which will communicate with the RF Extender. Keep the other default RF Extender settings unless they are required to be changed.
Send Command
Select the Send Command button to use with the Command dropdown list.
Read Config
Select the Read Config button to display the RF Extender’s current configuration.
Write Config
Select the Write Config button to store the configuration in the non-volatile memory where it will not be lost when the power is cycled.
Send Config
Select the Send Config button to store the configuration in the temporary buffer where it will be lost when the power is cycled.
All other configuration fields are not necessary by default.
Data Logger Software
Page 43
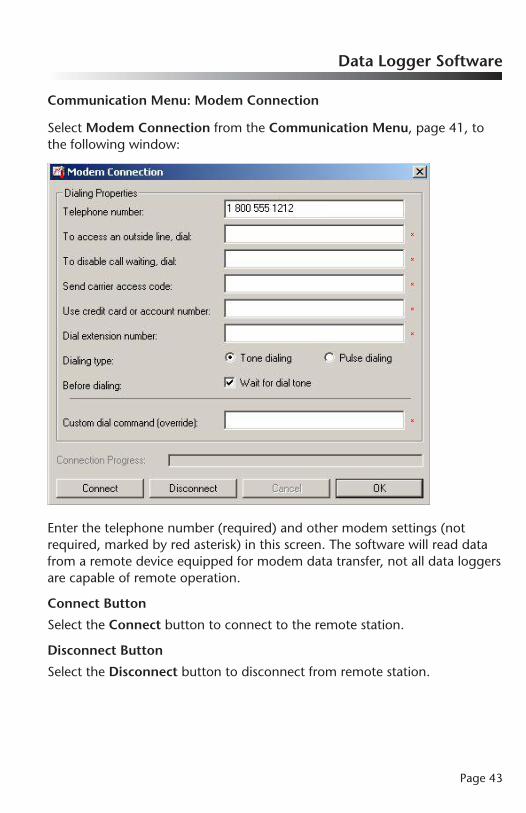
Communication Menu: Modem Connection
Select Modem Connection from the Communication Menu, page 4�, to the following window:
Enter the telephone number (required) and other modem settings (not required, marked by red asterisk) in this screen. The software will read data from a remote device equipped for modem data transfer, not all data loggers are capable of remote operation.
Connect Button
Select the Connect button to connect to the remote station.
Disconnect Button
Select the Disconnect button to disconnect from remote station.

Page 44
Dwyer Operating Manual
Device MenuThe Device Menu will appear as shown:
Device Menu: Identify Device and Read Status
Select Identify Device and Read Status from the Device Menu to allow software to communicate with the attached data logger and display a window similar to this one:
Data Logger Software
Page 45
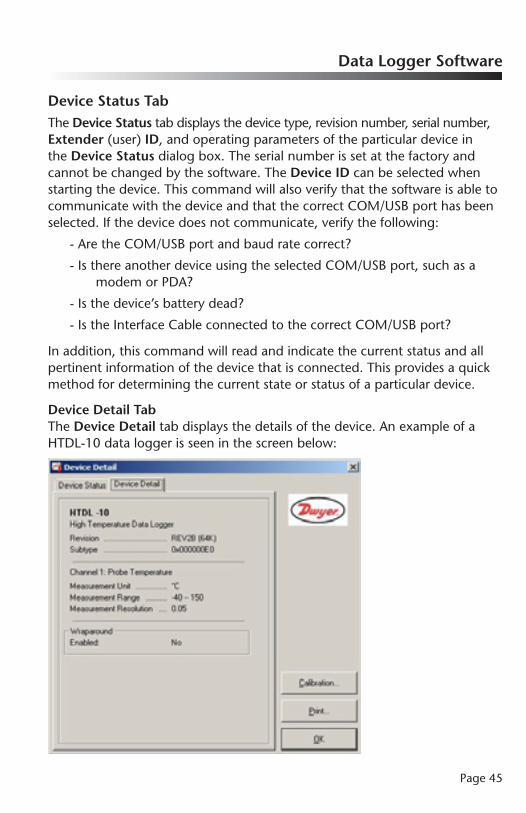
Device Status TabThe Device Status tab displays the device type, revision number, serial number, Extender (user) ID, and operating parameters of the particular device in the Device Status dialog box. The serial number is set at the factory and cannot be changed by the software. The Device ID can be selected when starting the device. This command will also verify that the software is able to communicate with the device and that the correct COM/USB port has been selected. If the device does not communicate, verify the following:
- Are the COM/USB port and baud rate correct?
- Is there another device using the selected COM/USB port, such as a modem or PDA?
- Is the device’s battery dead?
- Is the Interface Cable connected to the correct COM/USB port?
In addition, this command will read and indicate the current status and all pertinent information of the device that is connected. This provides a quick method for determining the current state or status of a particular device.
Device Detail TabThe Device Detail tab displays the details of the device. An example of a HTDL-�0 data logger is seen in the screen below:

Page 46
Dwyer Operating Manual
The details include device type (device name as heading), revision number, subtype, and channel information. Information about Alarm Setting, Thermocouple Type, Engineering Units, Trigger Settings, Wireless Configuration, Wrap Around and Calibration will be displayed when the device supports these features.
Note: When these features exist, a corresponding button will be displayed on the lower right side of the screen. An Alarm Settings & Calibration button are displayed in the example on the screen above.
The following details are described as follows:
Alarm Settings
Select Alarm Settings to display an alarm setting screen that will permit the alarm range to be changed. See page 74 for full operating instructions.
Set Password
Click Set Password to password protect the device.
The software will remember the device password after it has been set. The password will be asked next time when the user analyzes the device data.
Password doesn’t exist.
Password exists.

Data Logger Software
Page 47
Thermocouple Type
Select Thermocouple Type to display a thermocouple type window to request the input of the thermocouple type being used. This command is only available for devices that use thermocouples as the sensing element. The device will configure itself appropriately for the chosen type of thermocouple. The device requires this information to properly make temperature measurements and automatically perform the thermocouple cold junction compensation. Upon activation of this command, the software communicates with the device to determine if it has a programmable thermocouple attached. If it does, the following window appears:
To change the thermocouple type, select the Change button. To commit the change, select Save to store the thermocouple type in the device. After selecting the thermocouple type, the temperature range for the chosen thermocouple is automatically displayed.
Engineering Units (device/software level)
The Engineering Units command is only available when a data recorder with this feature is connected to the host computer. Multiple engineering units can then be defined into multi-channel recorders.
Note: If the software level engineering units does not have the record of device engineering unit, a new software level record of device engineering unit with an unique unit ID will be created when Identify Device and Read Status are performed.

Page 48
Dwyer Operating Manual
1. Device Units
The Device Units tab contain the engineering unit(s) of the device con-nected to the host PC. The Device Units Wizard button (�) will automati-cally edit the device’s engineering units or it can be done manually using the Change device settings button (2). Save the changes into the device select the Save changes to device button (3).
(1) (2)
(3)

Data Logger Software
Page 49
A. Device Units WizardThe Device Units Wizard will calculate the device unit(s) based on the user’s inputs.
B. Edit Device Units
When Edit Device Units is enabled, the engineering units of the device can be edited directly. Otherwise the user needs to select the Change device settings button (see buttons on previous page) to enable this part first.
Note: The Use portable units on this device checkbox defines the status of two dropdown list in the Device Units field. If it is checked, both of the dropdown lists will show all channels and portable units.

Page 50
Dwyer Operating Manual
Enable Engineering Units
The Enable engineering units on this device option indicates if the units programmed into the device should be displayed when data is downloaded.
Prompt for unit selections on download
The Prompt for unit selections on download option allows the stored information to be edited each time the data is uploaded.
Portable Units
The Portable Units tab contains description, label, gain, and offset fields.
The description field is used to enter the full name of the parameter to be displayed in the software. Examples of this are Volts, Milliamps, pH, Gallons, etc. This name is displayed on the graph and data table as the description of the data.
The label field is used to enter the label of the parameter that is to be displayed in the software. Examples are V, mA, pH, G, etc. The gain and offset fields are the equivalent of the “m” and the “b” respectively in the “Y = m * X + b” equation. X is the raw data from the device and Y is the data displayed by the software.

Data Logger Software
Page 5�
Device Units List
The Device Units List tab shows all channels and their corresponding unit.
Note: To assign the engineering unit to the specific channel, select the channel and choose the record from Engineering Units List (see below). If the unit assigned to the channel is a software level (not device level) engineering unit then the Use portable units on this device option in Portable Units will be unchecked.
Engineering Units List
Unit Description Unit Label
Speed m/s (meter/scale)
Concentration PPM
Pressure PSI
Metering Watts, gallons
Level Inches
pH pH
Page 52
Dwyer Operating Manual
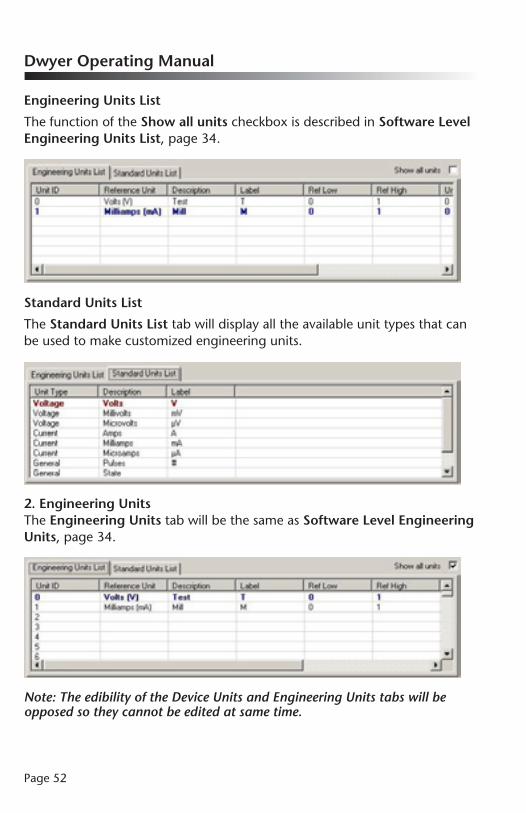
Engineering Units List
The function of the Show all units checkbox is described in Software Level Engineering Units List, page 34.
Standard Units List
The Standard Units List tab will display all the available unit types that can be used to make customized engineering units.
2. Engineering UnitsThe Engineering Units tab will be the same as Software Level Engineering Units, page 34.
Note: The edibility of the Device Units and Engineering Units tabs will be opposed so they cannot be edited at same time.

Data Logger Software
Page 53
Trigger Settings
Select Trigger Settings from the Device Menu: Start Device or Identify Device and Read Status. This command is only available when the data recorder has the Trigger feature. The trigger screens offered depend on the type of data recorder connected to the host computer. Trigger screen samples are shown below.
Device has one triggered channel
Trigger formats with one mode of operation fall into two types: With or Without settable sample count.
Trigger Form 2:Without sample count

Page 54
Dwyer Operating Manual
To edit trigger values, click the Change button. The values can be typed in directly, or changed using the slider control.
NOTE: The high and low triggers cannot be disabled simultaneously.
The values for the high or low trigger points can be set. Enable the high trigger to allow the acquisition of data to begin if the point is greater than the high set point. Enable the low trigger to allow the acquisition of data to begin if the trigger level is less than the low set point. The trigger sample can be set up to count by;
�. Typing in their readings count number or
2. Select Fill Memory on First Trigger option to get the maximum reading counts on a single event.
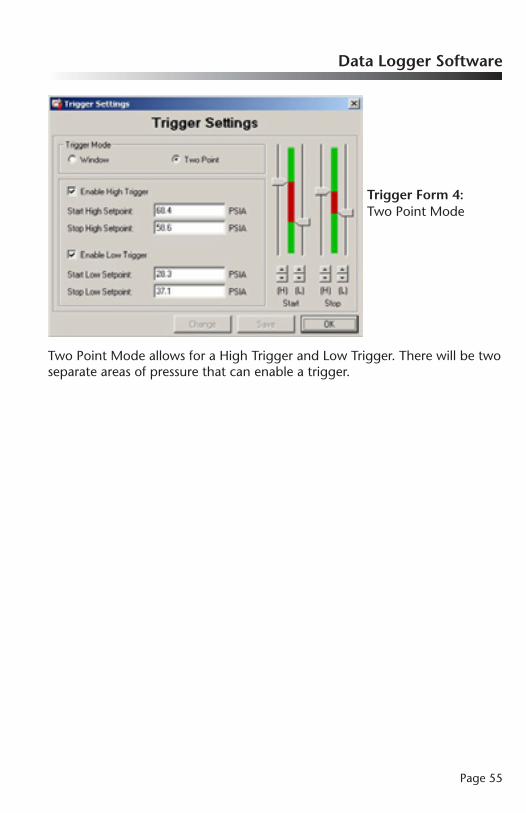
Trigger formats with two trigger mode options fall into two types: Window and Two Point.
Trigger Form 3:Window, the function of this form is similar to Trigger Form �
Data Logger Software
Page 55
Two Point Mode allows for a High Trigger and Low Trigger. There will be two separate areas of pressure that can enable a trigger.
Trigger Form 4:Two Point Mode

Page 56
Dwyer Operating Manual
Device has three triggered channels
To edit trigger values, click the Change button. The values can be typed in directly, or changed using the slider control.
NOTE: At least one axis must be selected.
Calibration
Select Calibration to display a calibration screen that will permit the device to be calibrated. See page 72 for full operating instructions.

Data Logger Software
Page 57
Device Menu: Read Device Data
To download the data from the device to the computer, select Read Device Data from the Device Menu. This command automatically downloads all the stored data from the device and displays it in both graphical and tabular format. The standard HTDL-�0 will download data at approximately �20 readings per second. A progress bar located near the bottom of the screen gives a visual indication of how long the download will take.
Note: The data logger continues to record after the data has been downloaded. Use Stop Device, page 62, to stop the data logger from taking readings.
Device Menu: Quick Start
Select Quick Start from the Device Menu to start the device without asking for any settings. It will use the previously set user ID and reading rate. This is useful for saving time, especially when programming multiple devices with the same parameters.

Page 58
Dwyer Operating Manual
Device Menu: Batch Start
Select Batch Start from the Device Menu to display the following window:
Device Parameters Tab
The Device Parameters tab has similar functions to Start Device (page 60). The availability of Device ID field, Extended ID field, Reading Rate, and Wrap Around field (option available depending on device) depends on the selections in the Configuration tab. If the device has the alarm setting feature then a corresponding button will be displayed on the screen. An Alarm Settings button is displayed on the screen above.
Data Logger Software
Page 59
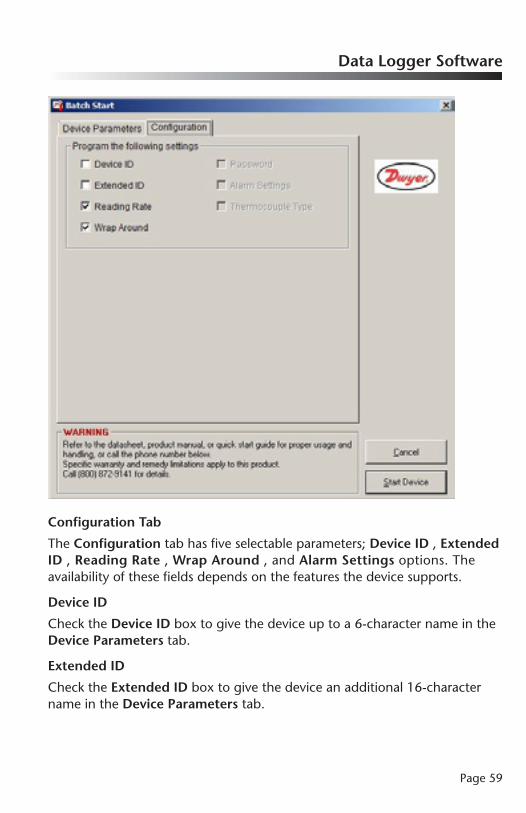
Configuration Tab
The Configuration tab has five selectable parameters; Device ID , Extended ID , Reading Rate , Wrap Around , and Alarm Settings options. The availability of these fields depends on the features the device supports.
Device ID
Check the Device ID box to give the device up to a 6-character name in the Device Parameters tab.
Extended ID
Check the Extended ID box to give the device an additional �6-character name in the Device Parameters tab.

Page 60
Dwyer Operating Manual
Password
If the device has the Password feature then the Password box is enabled and a password button appears on the right side of the screen which allows editing Device Password.
Alarm Settings
Check the Alarm Settings box to enable the alarm setting feature from the Device Parameters tab (see page 58).
Reading Rate
Check the Reading Rate box to choose the reading rate from the Device Parameters tab.
Wrap Around
Check the Wrap Around box to choose the wrap around memory feature from the Device Parameters tab.
Device Menu: Start Device
Select Start Device from the Device Menu to display the following window:

Data Logger Software
Page 6�
Note: Starting the device will erase all readings currently stored in its memory.
The Start Device window allows the start time and reading rate to be set. The Start Method setting may be used, along with the Start Now radio button, to start the data logger immediately. Alternatively, the user can select the Delay Start option to delay the start of data collection. The start time may be delayed up to six months from the current time. The Pushbutton Start option can be selected to start the data logger by pushing the push-button on the device. The push button must be pushed down and held for at least 3 seconds.
When the device has a feature such as alarm setting, thermocouple type, trigger settings, wireless configuration and engineering units then a corre-sponding button will be displayed on the screen. An Alarm Settings button is displayed in the example below in the lower right hand portion of the screen.
For some types of data loggers, the following window may appear:

Page 62
Dwyer Operating Manual
Manual Stop (default option for logger operation)
The device will continue to record data until the memory is full, or until the device is stopped manually using the Dwyer software.
Stop on Date
The user can specify a time at which the device will stop taking readings to memory. A stop date can be specified up to a year in advance.
Note: If the Wrap Around feature is activated a stop date will not be possible to set.
Stop after Readings
The user can specify the number of readings the device will take. Any number of readings can be specified up to the maximum number of readings supported by the device.
Note: If the Wrap Around feature is activated a stop date will not be possible to set.
Device ID
A Device ID may be entered in the space provided in any combination of six letters and/or numbers. The Device ID is written to the device and will appear in graphs or reports when the device is read later. Use it for identification of the device or personnel linked to the device, etc.
When all parameters/settings are set, press Start Device to program and begin recording data.
Device Menu: Stop Device
Select Stop Device from the Device Menu permits the software to communicate with the data logger and stop it from taking additional measurements. The data logger will enter a low power state to conserve battery life and when the memory is full. When full, the data recorder will stop recording additional readings and place itself into a low power state to maximize battery life automatically, this is simply a convenient way to extend the life of the battery. This mode is obvious to the user because the device will immediately wake up when the host computer communicates with the logger. When the device will not be used for a long period of time, stopping the device from collecting more data will conserve power to extend battery life. Stopping the device has no effect on the data in memory, the data is always retained.

Data Logger Software
Page 63
Device Menu: Reset Device
Select Reset Device from the Device Menu to permit the software to communicate with the data logger device, and stop it from taking further measurements. This will also erase all readings currently stored in memory. Resetting the device will cause the data logger to enter a low power state to conserve battery life.
Device Menu: Real Time Chart Recording
The Real Time Chart Recording command provides a graphical method for acquiring and viewing data in real time. Choose the Real Time Chart Recording command to select the menu items and toolbar to appear as shown below:
A logger must be connected to the interface cable to select and use the following features: reading rate, setup real time recording parameters, and start and stop the real time graphing.
Note: Data is not stored internally in the data logger while in Real Time Recording mode.
Start Recording
Select the Start Recording button to take a reading from the logger and update the screen at the selected reading rate.
Done Recording
Select the Done Recording button to discontinue recording from the logger.

Page 64
Dwyer Operating Manual
An example of a real-time graph, using a HTDL-10 temperature logger:
Note: The pink area is the warning area for high alarm setting of the data logger, the light blue area is the warning area for low alarm setting of the data logger if it has alarm the setting feature.
When the data has been accumulated in real time it can be saved and viewed in the same method as data that has been downloaded from a device. The data can also be viewed in tabular format while in the real time mode. Switching back and forth from a graphical to a tabular format is easily done. While in the real time recording mode, access to most software commands is restricted to eliminate interference with data collection. All windows except for the current window are inactive during data collection.

Data Logger Software
Page 65
Real Time Setup
From the Real Time Chart Recording on the Device Menu, select the Recording Setup Button. This will display the following window:
Recording Parameters Tab
The Recording Parameters tab allows for set up of the recording start and end time.
Start Method: Start Now or Delay Start
Select Start Now to begin recording immediately or select Delay Start to delay the recording.

Page 66
Dwyer Operating Manual
End Method: Manual or Select Time
There are two methods to end Real Time Recording:
�) manually
2) automatically
To end Real Time Recording manually select the Done Recording button on the Real Time Chart Recording Tool bar, page 63. To end automatically choose select time from the Real Time Setup screen, previous page.
Reading Rate
Select the Reading Rate from the dropdown list. To setup the Real Time Recording rate click the Start Recording button to start real time recording. Alarm Settings Tab (software level)
The Alarm Settings tab selected in the screen below, allows the user to set up and receive alarm notification in three different ways. There are three steps to activate the alarm settings.
Data Logger Software
Page 67
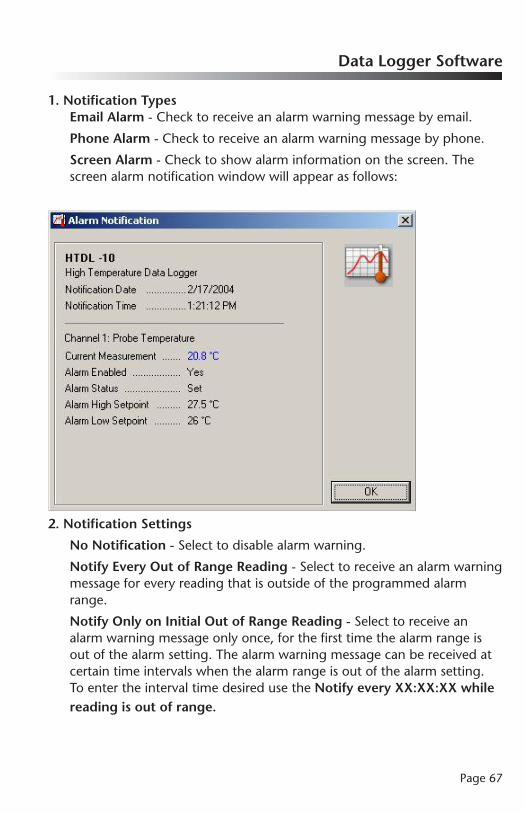
1. Notification TypesEmail Alarm - Check to receive an alarm warning message by email.
Phone Alarm - Check to receive an alarm warning message by phone.
Screen Alarm - Check to show alarm information on the screen. The screen alarm notification window will appear as follows:
2. Notification Settings
No Notification - Select to disable alarm warning.
Notify Every Out of Range Reading - Select to receive an alarm warning message for every reading that is outside of the programmed alarm range.
Notify Only on Initial Out of Range Reading - Select to receive an alarm warning message only once, for the first time the alarm range is out of the alarm setting. The alarm warning message can be received at certain time intervals when the alarm range is out of the alarm setting. To enter the interval time desired use the Notify every XX:XX:XX while reading is out of range.

Page 68
Dwyer Operating Manual
3. Channel Settings
Select the unit for a channel that has an alarm setting on it by clicking the unit dropdown list box. It will affect the graph’s unit on the screen, but not the unit preferences. Check the “Enable” option to enable the alarm warning setting. This feature allows the user to setup alarm warning on multiple channels. Enter the high setting value and the low setting value for a particular channel.
Email Information Tab
Use the Email Information tab to set up email information. Fill in required fields with the correct information. Select the Test Account Settings button to confirm the settings work correctly.
Message Options
The Long Text Format and Short Text Format permit alarm notification by email. The Short Text Format is typically used for text messaging systems such as PDA or Cell Phone.

Data Logger Software
Page 69
The Use Proportional Font option relates to the font output of the data. When checked, fonts will be sent in a proportional font, e.g. Times New Ro-man. When unchecked, fonts will be sent in a fixed width font, e.g. Courier.
Note: An internet connection must be enabled on the host computer for this feature to work. Please refer to the host computers Windows Operating Manual for specifications.
Phone Information Tab
The Phone Information tab allows the user to set up the phone dialing information. Fill in all the fields with the correct information. Select the Test Phone Setup button to confirm that the settings work correctly.
Note: A modem with a working phone line must be connected to the host computer for this feature to work. Please refer to the host computers Windows Operating Manual for specifications.

Page 70
Dwyer Operating Manual
File Settings Tab
The File Settings tab is to manage files.
Data Save
The Data Save option allows data to be saved automatically and sets a save location for the Real Time Recording Data. See page �5 for Save file types.
Data Export
The Data Export option allows data to be exported automatically and sets an export location for the Real Time Recording Data.
Data Logger Software
Page 7�
Preferences
The Preferences option allows the save and export features to occur automatically at set time intervals (see screen on previous page)..

Page 72
Dwyer Operating Manual
Device Menu: Calibration
Select Calibration from the Device Menu. All data logger devices can be calibrated through the software. This eliminates the need for opening the device or adjusting potentiometers. Calibration parameters, as well as the last calibration date, are stored within the device itself in non-volatile memory. This can be accessed through the software. It also allows the device to maintain calibration while being used on any computer. Most data loggers can be effectively calibrated using a single point to correct an offset. In some cases, two points may used to correct for gain and offset errors. The HTDL-�0 uses a single point calibration. The calibration offset is defined as the value the device reads at zero. Thus, if the HTDL-�0 reads 0.5 ºC when the correct value is 0 ºC, the user would enter 0.5 ºC for the calibration offset. The 0.5 ºC would then be subtracted from each reading downloaded from the device, and the data would be correct without any further manipulation. The HTDL-�0 Calibration window, shown below, is displayed when the Calibration command is selected, and a HTDL-�0 is connected to the interface cable. To edit the calibration values, click on the Calibrate button. The Default button may be used to return all values to their default settings (0.000 for offset values, and �.000 for gain values.)
Sample Calibration Screen

Data Logger Software
Page 73
For convenience, a Wizard button is available. Select this button to display the Calibration Wizard, a series of screens with fields can be fill in regarding the behavior of the uncalibrated (all values set to the default) device. The wizard performs the calculations for the offset and/or gain values and puts them into the correct fields in the calibration window. To commit to any changes, select Save to store the calibration information in the device. The calibration is then saved, and the new calibration values are displayed.
The Calibration Wizard
The Calibration Wizard displays information which correlates to the type of device attached. The following screen is an example of a Temperature Gain/Offset calibration on the Temperature channel of a HTDL-�0 device. To calibrate the device select the Next button, complete the required fields for each channel of the device, and select the Next button again until the Wizard highlights the finished button. Select the Finish button and the calculations are made and the correct values are placed into the Calibration windows. Select Save to save these values into the device.

Page 74
Dwyer Operating Manual
Device Menu: Alarm Settings
From the Device Menu, choose Alarm Settings. This command is only available when a data logger with this feature is connected.This command allows the high and low temperature points to be set, also high and low warn temperature points can be set if the device has this fea-ture, a visual alarm (flashing LED, the RED one indicates the exceed range of high and low alarm and the YELLOW one indicates the exceed range of high and low alarm warn) will be triggered. If the device has the time delay fea-ture, the time delay can be set to trigger a visual alarm. These points should be set in the units indicated.
Without Alarm Delay
Without Alarm Warn
With Alarm Delay
Without Alarm Warn

Data Logger Software
Page 75
To edit these alarm values, select the Change button, as shown in the windows above.
By default, the Clear alarm status when setting reading marker check box is unchecked. If it is checked, the user can press the push button of device to set the reading mark and clear alarm status (high and low alarm, high and low warn, and alarm delay) during the reading period.
Select Save to store the values into the device. When the alarm values are stored into the device, they are rounded to the nearest alarm set point for that device. Once the alarm has been tripped (e.g. the temperature has gone outside the set limits), the LED will flash at a one second reading rate until the device is reset or the alarm is deactivated by the Alarm Settings Disable command. It is important to remember that the device only takes readings at its programmed reading rate.
NOTE: If a temperature travels outside the set limits between readings, it will be missed by the device and the alarm will not become active.
With Alarm Delay
With Alarm Warn

Page 76
Dwyer Operating Manual
Graph MenuThe Graph Menu appears like this:
Graph Menu: Show Summary
Select the Show Summary command from the Graph Menu to display the Summary tab, which will appear as follows on the next page:
Data Logger Software
Page 77
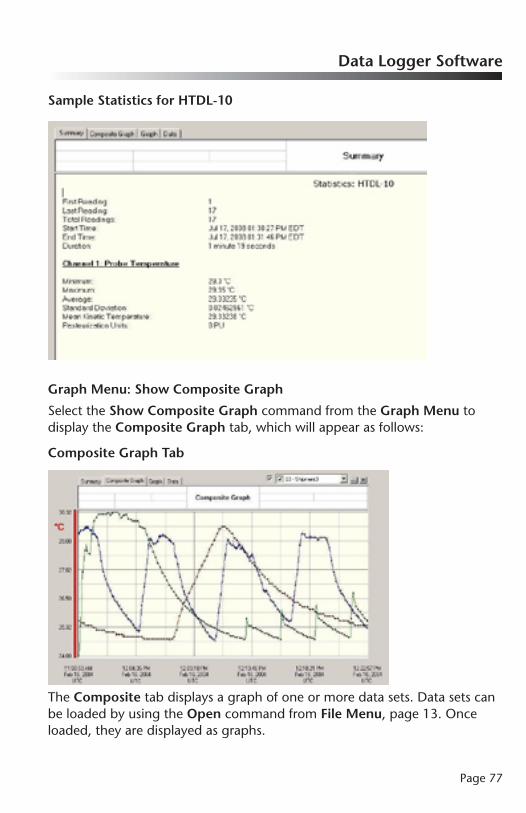
Sample Statistics for HTDL-10
Graph Menu: Show Composite Graph
Select the Show Composite Graph command from the Graph Menu to display the Composite Graph tab, which will appear as follows:
Composite Graph Tab
The Composite tab displays a graph of one or more data sets. Data sets can be loaded by using the Open command from File Menu, page �3. Once loaded, they are displayed as graphs.

Page 78
Dwyer Operating Manual
To display the data set(s) select one from the dropdown list at the top-right corner of the composite graph (see below). Select the checkbox next to the list to select or deselect the data set(s) for display. Deselecting the data set(s) does not unload it , it remains in memory and can be reselected at any time.
To unload a data set from the memory, select it from the dropdown list at the top-right corner of the composite graph. Select the X button on the right to unload the data set (see below). Once a data set is unloaded, it cannot be redisplayed without reloading it using the Open command from File Menu.
To manipulate multiple data sets simultaneously, select the ellipses (…) button in the middle to open Graph Configuration form (see next page).
Deselect Data set
To deselect data set(s) for display on the composite graph, uncheck them.

Data Logger Software
Page 79
Unload Data set
Highlight data set(s) and press the Remove button to unload them from memory.
Unload Data Set into Temporary Buffer
Select the Remove button to place the unloaded data set(s) in the temporary buffer, rather than unloading them permanently. They can be restored or reset. After selecting the Apply button or the OK button, the unloaded data set(s) cannot be redisplayed without reloading them using the Open command from File Menu.
Graph Menu: Show Graph
Select the Show Graph command from the Graph Menu to display the Graph tab. This tab is similar to the Composite Graph except that only one data set can be displayed at a time.Note: In order to save a data set, it must be displayed in the Graph or Data tab.
Graph Menu: Show Data Table
Select the Show Data Table command from the Graph Menu to direct the software to display the Data tab as shown in the window on the following page.

Page 80
Dwyer Operating Manual
Data Tab
The Data tab displays data in table format, to easily determine the exact value of each data point.
Graph Menu: Select Graph Tool
Select the Select Graph Tool command from the Graph Menu to enable the cursor mode which the mouse will assume when it is pointed and clicked over the graph. Several cursor modes are available, each with a specific function as follows:
Cursor
When the cursor mode is selected:
�. Click on a data point of the graph to indicate the value.
2. Click on or near a data point on the graph to indicate the value of the data point.
The data point selected can be changed by navigating the cursor or;
A. Use clicking method.
B. Click and drag the mouse horizontally in the graph.
C. Use the arrow keys (left, right) on the keyboard.

Data Logger Software
Page 8�
Time Cursor
When this cursor mode is selected, choose one of the following methods;
�. Click and drag the mouse horizontally over the graph area or
2. Use the arrow keys (left, right) on the keyboard, to indicate the time and value of each data point the cursor passes over.
Scroll
Select the cursor mode to scroll the graph in any direction to view a particular section. To scroll the graph, click and hold the mouse button, then drag the mouse in the direction desired. When dragging the cursor a line with an arrow is drawn to indicate the direction and amount of the scrolling operation. When the mouse button is released, the graph is then scrolled in the direction and by the amount specified.
Zoom In
When this cursor mode is selected, click on the graph to zoom in for a close-up view of a particular area of the graph. Multiple zooms may be performed to obtain best view. The software can only zoom in to a limited extent. If the zoom limit is reached, the following message will be displayed.
Zoom Out
When this cursor mode is selected, click on the graph to zoom out for an overall view of a particular area of the graph. Multiple zooms may be per-formed to obtain the best view. The software can only zoom out to a limited extent. If the zoom limit is reached, the following message will be displayed.
Message Box 1: Warning for Zoom In
Message Box 2: Warning for Zoom Out

Page 82
Dwyer Operating Manual
Box Zoom
Select the cursor mode, then click and drag on the graph to draw a rectangle. When the mouse button, is released the graph will zoom in to obtain a close-up view of that area of the graph.
Horizontal Zoom
Select the cursor mode, then click and drag on the graph to draw a horizontal rectangle. When the mouse button is released, the graph will zoom in to get a close-up view of that area of the graph.
Vertical Zoom
Select the cursor mode, then click and drag on the graph will draw a vertical rectangle. When the user releases the mouse button, the graph will zoom in to get a close-up view of that area of the graph.
Cancel Zoom
Select Cancel Zoom to cancel any zoom modes. The graph will be redrawn in its default state.
Graph Menu: Title GraphThis feature will be disabled when no data set is displayed on the screen. Otherwise, there are two ways to modify the title graph.
�. The title graph can be modified by selecting Title Graph from the Graph Menu (page 82) or The Right Click Pop-Up Menu (page 93).
The following screen will appear:
2. Double click the graph title area, to highlight and modify it.

Data Logger Software
Page 83
Graph Menu: Annotate Data
This feature will be disabled if there is no channel selected. Otherwise, there are two ways to annotate data.
�. Select Annotate Data from the Graph Menu or right click the Pop-Up Menu. The following screen will appear:
2. Double click the annotate data area on the heading of the graph. Type the annotation in the box as shown below:
Graph Menu: Autoscale Graph
Select the Autoscale Graph command from the Graph Menu to optimize the vertical scale of the graph to match the minimum and maximum data points shown on the graph. This provides maximum resolution for viewing the graph.
Graph Menu: Set Graph to Preferred Scale
Select the Set Graph to Preferred Scale command from the Graph Menu to set the graph to the preferred scale.
If no preferences are set, the graph will show on the vertical scale, the measurement range of the device (this may differ from the rated operating range shown on the label of the device). The time scale will begin when the first reading was taken, and end when last reading was taken.
Graph Menu: Synchronize Graph Scale
Select the Synchronize Graph Scale command from the Graph Menu to synchronize the time and value axes of the graph.

Page 84
Dwyer Operating Manual
Graph Menu: Select Graph Units
Select the Select Graph Units command from the Graph Menu to select the units to be used when displaying the graph. The available units will vary depending on the type of data logger used. For example, the HTDL-�0 reads temperature and provides units of degrees Celsius (ºC), Fahrenheit (ºF), Rankin (ºR) or Kelvin (K). The ISDL-R�0 records temperature and humidity and has available °C, °F, °R, and K for the temperature reading, and %RH, Dew Point and Water Vapor Concentration for the humidity reading.
Graph Menu: Set Graph Scale
Select the Set Graph Scale command from the Graph Menu to manually change and specify the values of the vertical and horizontal axis. The following three screens are shown for each of the tabs:
Time Tab

Data Logger Software
Page 85
Scale Tab
Note: In order to enter the low value or the high value of the unit a unit from the Select Units dropdown list box must be selected first. There is no unit selected if the value of the Select Units dropdown list box is No Units Selected.
Axis Tab
Different data recorders will show a slightly different window depending on the number of channels and the parameters being recorded. Scaling of the horizontal axis is controlled by the Select Time Range section. To set the end points of the horizontal axis, select the specified endpoints from the dropdown date and time selectors. The vertical axis is set using the Vertical Scale tab.
Page 86
Dwyer Operating Manual
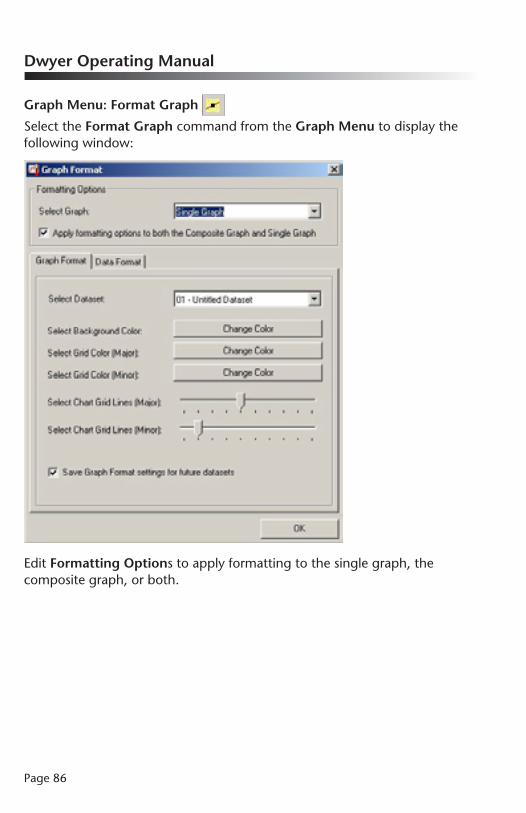
Graph Menu: Format Graph
Select the Format Graph command from the Graph Menu to display the following window:
Edit Formatting Options to apply formatting to the single graph, the composite graph, or both.

Data Logger Software
Page 87
Graph Format TabSelect the Graph Format tab to set the background color for the entire graph, as well as the color and number of the major and minor grid lines. Changes are applied to the data set selected at the top of the frame.
The Data Format looks like this:
Data Format TabThis window allows the user to customize the look of the graphical data for each data set. First, select the data set to customize from the dropdown list. Choose the channel from the second dropdown list (some devices have multiple channels). Then, select the thickness of the line, line color, symbol style, and symbol color from the remaining dropdown lists. Finally, select the symbol size and frequency (see Manipulate Plotting Symbol, next page) and whether the channel should be visible or not (see Hide Selected Chan-nel and Show Hidden Channels, next page).

Page 88
Dwyer Operating Manual
Manipulate Plotting Symbol
The Select Symbol Size slider and the Select Symbol Frequency slider are used to manipulate the plotting symbols. The zero setting removes all plot-ting symbols, and higher settings will approximately double the number of symbols on the graph as the slider is moved up one notch.
Hide Selected Channel
Uncheck the Channel Visible option to hide the selected channel or choose The Right Click Pop-Up Menu (page 93) to hide the selected channel.
Show Hidden Channels
Check the Channel Visible option to show the hidden channel. Click OK, the graph will be immediately redrawn with the option chosen. Choose the Right Click Pop-Up Menu to show the hidden channel also.
Graph Menu: Copy Data To Excel®
Select Copy Data To Excel® to allow the software to launch the Microsoft Excel® spreadsheet program, and copy the current data set to an Excel® worksheet. This command will only work with a compatible version of Excel® properly installed on the host computer.
Graph Menu: Device Detail
Select the Device Detail command to display the device details of the selected data set. This will include device type, revision number, subtype, and channel information. Information about alarm setting, thermocouple type, wireless configuration, wrap around and engineering units may also be displayed if the device supports those features. The window is similar to Identify Device and Read Status features, page 44.

Data Logger Software
Page 89
Select the Alarm Setting button from the Device Detail tab to display a read-only alarm setting screen to show the alarm range. This command is only available when the selected data set is generated from a device that has this feature.
Select Thermocouple Type button from the Device Detail tab to display a read-only thermocouple type screen. This command is only available when the selected data set is generated from a device that has this feature.

Page 90
Dwyer Operating Manual
Select Calibration button from the Device Detail tab to display a read-only calibration form that shows the user the device of the selected data set cali-bration information.
Select the Engineering Units button from the Device Detail tab to display a read-only engineering units screen. This command is only available when the selected data set is generated from a device that has this feature.

Data Logger Software
Page 9�
Trigger Settings
Select Trigger Settings to display a read only trigger setting screen. See page 53 for full operating instructions.
Graph Menu: Statistics
Select the Statistics command to calculate some basic statistics for data on each individual channel. A typical screen for some calculated statistics for the temperature channel of a HTDL-�0 might appear as follows:
For data recorders with more than one channel, the Next and Previous buttons will be available. This allows the user to quickly view the statistics on each channel. In the example for the ISDL-R�0, activating the Next button will update the dialog box with the statistics for the humidity channel.

Page 92
Dwyer Operating Manual
Graph Menu: Set Cooling FlagsSelect the Set Cooling Flags command to allow the user to set the cooling flags on the temperature channel of the selected data set.
A typical screen for setting the cooling flags for the temperature channel of a HTDL-�0 might appear as follows:
NOTE: In order to set the cooling flags, the selected data set must be dis-played in the Graph tab and have at least one visible temperature channel.

Data Logger Software
Page 93
The Right Click Pop-Up MenuThe Right Click Pop-Up Menu incorporates menus from the Graph Menu. It provides a convenient way to manipulate the graph. It will show different pop-up menus depending on the position of the mouse on the screen.
The Right Click Pop-up Menu will appear one of two ways (see page 97).
Window #1:

Page 94
Dwyer Operating Manual
Submenu AClick the Title Graph submenu to modify the title graph. See Title Graph, page 82.
Click the Annotate Data submenu to modify the Annotate Data. See Annotate Data, page 83.
Click the Show Summary, Show Composite Graph, Show Graph, and Show Data options to bring up the Summary, Composite Graph, Graph, and Data tabs, respectively.
Submenu B
Highlight Select Graph Tool to change the cursor mode. See Select Graph Tool, page 80.
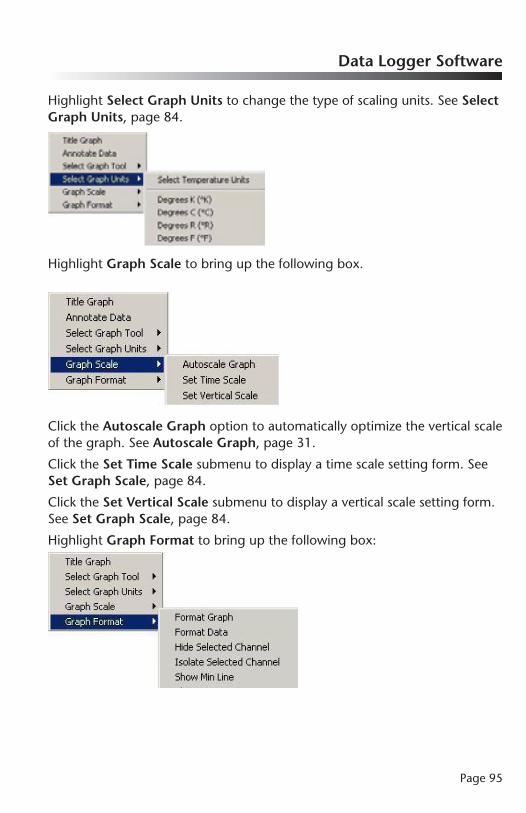
Data Logger Software
Page 95
Highlight Select Graph Units to change the type of scaling units. See Select Graph Units, page 84.
Highlight Graph Scale to bring up the following box.
Click the Autoscale Graph option to automatically optimize the vertical scale of the graph. See Autoscale Graph, page 3�.
Click the Set Time Scale submenu to display a time scale setting form. See Set Graph Scale, page 84.
Click the Set Vertical Scale submenu to display a vertical scale setting form. See Set Graph Scale, page 84.
Highlight Graph Format to bring up the following box:

Page 96
Dwyer Operating Manual
Click Format Graph to display a graphic format setting form . See Format Graph, page 86.
Click Format Data to display a data format setting form .
Click Show Hidden Channels to show all hidden channels in the graph.
The Hide Selected Channel is available when there is a channel selected on the screen. The Hide Selected Channel function, page 88 in the Format Graph menu, page 86 to hide the selected channel.
Submenu C
Click Select Axis Labels to bring up the Set Graph Scale box, under the Axis Labels tab. The user can choose which vertical labels are shown and whether they will be shown on the left or right sides.
Use 24 Hour Time Format, Use UTC Standard Time, or Use UTC Abbrevi-ation to change the way the time is viewed. See Display Preferences, page 28.

Data Logger Software
Page 97
Window #2
The Right Click Pop-up Menu will appear below if there is no channel selected on the screen by the user.
Here the Right Click Pop-up Menu is similar to Window #� with two differ-ences:
�. The submenu Annotate Data is not available.
2. The submenu Hide Selected Channel is not available in Graph For-mat menu.

Dwyer Operating Manual
Page 98
Window MenuThe Window menu looks like this:
Window Menu: Stack
Choose Stack from the Window Menu to resize all the open graph windows to take up the whole main window and are to stack (overlay) on top of each other.
Window Menu: Cascade
Select Cascade from the Window Menu to resize all the open graph windows to a medium size, and then positions them in a staggered layer, one on top of the other, to maintain the title bars are visible.
Window Menu: Tile Horizontal
Select Tile Horizontal from the Window Menu to rearrange the open graph windows, to make fully visible and to align horizontally next to each other with no overlapping.
Window Menu: Tile Vertical
Select Tile Vertical from the Window Menu to rearrange the open graphs windows to make fully visible and to align vertically next to each other with no overlapping.
Window Menu: Selected File
When only one graph menu with multiple data sets is open, the line will show the selected tab that is open in the graph menu.
When multiple open graph menus are open with different data set(s) in each one, all the file names will be listed under this option. This method allows a desired graph to be viewed.

Data Logger Software
Page 99
Help MenuThe Help Menu looks like this:
Help Menu: Contents
Select Contents from the Help Menu to bring up the Help window and display the Table of Contents for the online manual.
Help Menu: About
Select About from the Help Menu to bring up the About window and display information about the company and the software version. This screen includes the Dwyer Instruments, Inc. address, phone number for technical information, e-mail address and web site. It also includes the full revision number of the software and the date of release.

Page �00
Dwyer Operating Manual
Help Menu: Dwyer WebsiteSelect Dwyer Website from the Help Menu to bring up the Dwyer Website for additional information.
Note: For this feature an internet connection and browser must be enabled on the host computer.

Data Logger Software
Page �0�
Contact InformationFor further information described in this manual, please contact:
Dwyer Instruments, Inc.P.O. Box 373, �02 Indiana Hwy. 2�2Michigan City, IN 4636� USA
Telephone: 2�9/879-8000Fax: 2�9/872-9057
Email: [email protected]: http://www.dwyer-inst.com/

Page �02
Dwyer Operating Manual
Terms and Conditions
�. Prices and Specifications are subject to change without notice.
2. Shipping dates are approximate. They are dependent upon credit approval and subject to delays beyond our control.
3. Terms: Net 30 days to companies with established credit rating. In the event Buyer fails to fulfill previous terms of payment, or in case Seller shall have any doubt at any time as to Buyer’s financial responsibility, Seller may decline to make further deliveries except upon receipt of cash in advance or other special arrangements.
4. Liability Point and Title: All material is sold F.O.B. Factory (Domestic)/FCA Free Carrier (International). Title to all material sold shall pass to buyer upon delivery by Seller to carrier at shipping point.
5. State and Local Taxes: Any taxes which the Seller may be required to pay or collect upon or with respect to the sale, purchase, delivery, use or consumption of any of the material covered hereby shall be for the account of the Buyer and shall be added to the purchase price.
6. Special tooling, dies, silk screens and molds acquired specially to produce goods for Buyer remain the property of Dwyer Instruments, Inc., and may not be removed. They will be maintained in good condition for a minimum period of three years from the date of the original purchase order.
7. Export Orders: Terms, discounts and conditions of sale for purchase orders originating or for shipment to final destinations outside the U.S.A. will be furnished upon request.
8. Limited Warranty: The Seller warrants all Dwyer instruments and equipment to be free from defects in workmanship or material under normal use and service for a period of one year from date of shipment. Liability under this warranty is limited to repair or replacement F.O.B. Factory (Domestic)/FCA Free Carrier (International) of any parts which prove to be defective within that time or repayment of the purchase price at the Seller’s option provided the instruments have been returned,

Data Logger Software
Page �03
transportation prepaid, within one year from date of purchase. All technical advice, recommendations and services are based on technical data and information which the Seller believes to be reliable and are intended for use by persons having skill and knowledge of the business, at their own discretion. In no case is Seller liable beyond replacement of equipment F.O.B. Factory (Domestic)/FCA Free Carrier (International) or the full purchase price. This warranty does not apply if the maximum ratings label is removed or if the instrument or equipment is abused, altered, used at ratings above the maximum specified, or otherwise misused in any way.
THIS EXPRESS LIMITED WARRANTY IS IN LIEU OF AND EXCLUDES ALL OTHER REPRESENTATIONS MADE BY ADVERTISEMENTS OR BY AGENTS AND ALL OTHER WARRANTIES, BOTH EXPRESS AND IMPLIED. THERE ARE NO IMPLIED WARRANTIES OF MERCHANTABILITY OR OF FITNESS FOR A PARTICULAR PURPOSE FOR GOODS COVERED HEREUNDER.
9. Buyer’s Remedies: THE BUYER’S EXCLUSIVE AND SOLE REMEDY ON ACCOUNT OF OR IN RESPECT TO THE FURNISHING OF NON-CONFORMING OR DEFECTIVE MATERIAL SHALL BE TO SECURE REPLACEMENT THEREOF AS AFORESAID. THE SELLER SHALL NOT IN ANY EVENT BE LIABLE FOR THE COST OF ANY LABOR EXPENDED ON ANY SUCH MATERIAL OR FOR ANY SPECIAL, DIRECT, INDIRECT, CONSEQUENTIAL OR INCIDENTAL DAMAGES TO ANYONE BY REASON OF THE FACT THAT IT SHALL HAVEBEEN NON-CONFORMING OR DEFECTIVE.
�0. Acceptance: All orders shall be subject to the terms and conditions contained or referred in the Seller’s quotation, acknowledgement, and to those listed here and to no others whatsoever. No waiver, alteration or modification of these terms and conditions shall be binding unless in writing and signed by an executive officer of the Seller. All orders are subject to written acceptance by Dwyer Instruments, Inc., Michigan City, Indiana, U.S.A.
Prices are exclusive of any taxes and should be considered as an estimate. Contact Dwyer Instruments, Inc. for a written quotation. Cancelled orders are subject to cancellation charges. Our standard Terms and Conditions of sale apply as stated in our catalog.
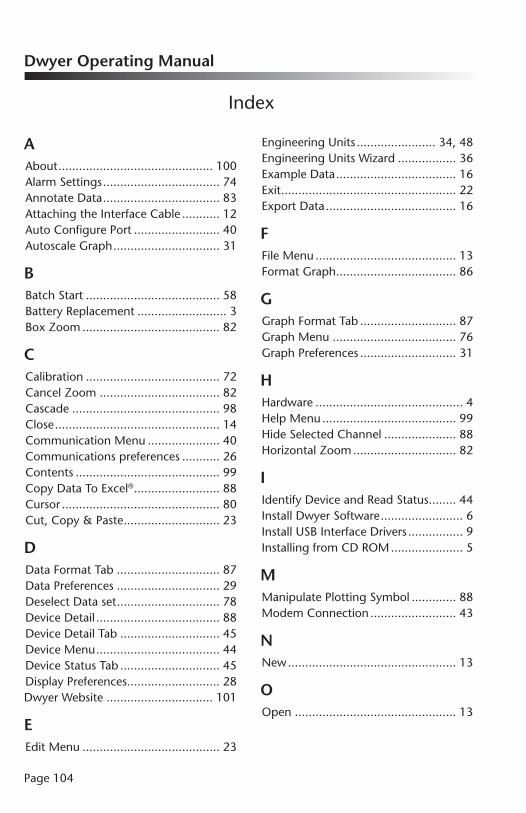
Page �04
Dwyer Operating Manual
AAbout ............................................. �00Alarm Settings .................................. 74Annotate Data .................................. 83 Attaching the Interface Cable ........... �2Auto Configure Port ......................... 40Autoscale Graph ............................... 3�
BBatch Start ....................................... 58Battery Replacement .......................... 3Box Zoom ........................................ 82
CCalibration ....................................... 72Cancel Zoom ................................... 82Cascade ........................................... 98Close ................................................ �4Communication Menu ..................... 40Communications preferences ........... 26Contents .......................................... 99Copy Data To Excel® ......................... 88Cursor .............................................. 80Cut, Copy & Paste ............................ 23
DData Format Tab .............................. 87Data Preferences .............................. 29Deselect Data set .............................. 78Device Detail .................................... 88Device Detail Tab ............................. 45Device Menu .................................... 44Device Status Tab ............................. 45Display Preferences ........................... 28Dwyer Website ............................... �0�
EEdit Menu ........................................ 23
Engineering Units ....................... 34, 48Engineering Units Wizard ................. 36Example Data ................................... �6Exit ................................................... 22Export Data ...................................... �6
FFile Menu ......................................... �3Format Graph ................................... 86
GGraph Format Tab ............................ 87Graph Menu .................................... 76Graph Preferences ............................ 3�
HHardware ........................................... 4Help Menu ....................................... 99Hide Selected Channel ..................... 88Horizontal Zoom .............................. 82
IIdentify Device and Read Status ........ 44Install Dwyer Software ........................ 6Install USB Interface Drivers ................ 9Installing from CD ROM ..................... 5
MManipulate Plotting Symbol ............. 88Modem Connection ......................... 43
NNew ................................................. �3
OOpen ............................................... �3
Index

Data Logger Software
Page �05
PPackage Inspection ............................. 4Page Setup ....................................... �6Preferences ....................................... 24Print Data ......................................... �8Print Device Configuration ............... 22Print Graph ...................................... �7Print Preview .................................... 22Print Summary ................................. �7
QQuick Start ....................................... 57Quick Start Guide ............................. ��
RRead Device Data ............................. 57Real Time Chart Recording ............... 63Real Time Setup ............................... 65Reset Device ..................................... 63Running the Software ....................... �0
SSave ................................................. �4Save All ............................................ �5Save All As ........................................ �6Save As ............................................. �4Save Memory Dump ........................ �6Scroll ................................................ 8�Select Baud Rate ............................... 40Select Comm Port ............................ 40Select Graph Tool ............................. 80Select Graph Units ............................ 84Selected File ..................................... 98Set Cooling Flags .............................. 92Set Graph Scale ................................ 84Set Graph to Preferred Scale ............. 83Show Composite Graph ................... 77Show Data Table .............................. 79Show Graph ..................................... 79Show Hidden Channels .................... 88Show Summary ................................ 76
Software Installation ........................... 5Stack ................................................ 98Start Device ...................................... 60Statistics ........................................... 9�Status Bar ......................................... 23Stop Device ...................................... 62Synchronize Graph Scale .................. 83System Requirements ......................... 4
TTerms and Conditions .................... �02The Calibration Wizard ..................... 73The Right Click Pop-Up Menu .......... 93Thermocouple Type ......................... 47Tile Horizontal .................................. 98Tile Vertical ....................................... 98Time Cursor ..................................... 8�Title Graph ....................................... 82Title Preferences ............................... 29Tool bar ............................................ 23Trigger Settings ................................ 53
UUnload Data Set into Temp. Buffer ... 79Unload Data set ............................... 79
VVertical Zoom ................................... 82View Menu ....................................... 23
WWarranty ............................................ 2Window Menu ................................. 98
ZZoom in ........................................... 8�Zoom Out ........................................ 8�

Data Logger and SoftwareOperating Manual
August 2008
[email protected] • www.dwyer-inst.com • (219) 879-8000
PO Box 373 • 102 Indiana Hwy. 212, Michigan City, IN 46361
Phone: (219) 879-8000 • Fax: (219) 872-9057www.dwyer-inst.com • [email protected]