data fusion of security logs to measure critical security …
TRANSCRIPT

The Pennsylvania State University
The Graduate School
College of Information Sciences and Technology
DATA FUSION OF SECURITY LOGS TO MEASURE
CRITICAL SECURITY CONTROLS TO INCREASE SITUATION AWARENESS
A Thesis in
Information Sciences and Technology
by
Matthew Kennedy
2018 Matthew Kennedy
Submitted in Partial Fulfillment of the Requirements
for the Degree of
Master of Science
May 2018

ii
The thesis of Matthew Kennedy was reviewed and approved* by the following:
Nicklaus A. Giacobe Assistant Teaching Professor of Information Sciences and Technology Thesis Advisor
Peter Forster Associate Teaching Professor of Information Sciences and Technology
Don Shemanski Professor of Practice of Information Sciences and Technology Andrea Tapia Head of the Graduate Programs
*Signatures are on file in the Graduate School

iii
ABSTRACT
In Jan. 2018, a NIST draft to the Cybersecurity Framework called for the development of
cybersecurity metrics, saying such work would be a “major advancement and contribution to the
cybersecurity community (National Institute of Standards and Technology, 2017b).”
Unfortunately, organizations and researchers continue to make little progress at measuring
security. Along with this, research around measuring security fails to present detailed guides on
how to implement security metrics collection and reporting in an organization.
This research seeks to explore how measuring the CIS (formally SANS) Critical Security
Controls, through data fusion of security logs, has the potential to increase situation awareness to
strategic decision makers, and systems administrators. Metrics are built for each of the sub
controls for Critical Security Control 8: Malware Defenses.
Along with the development of these metrics, a proof of concept is implemented in a
computer network designed to mimic a small business that is using Symantec Endpoint Protection
and Splunk. A Splunk dashboard is created to monitor, in real time, the status of Critical Security
Control 8.1 and 8.2. A discussion on the actionable information and value provided by these
dashboards occurs.
This work contributes to the industry’s need for cybersecurity metrics through the
development of six metrics. Along with this, a detailed implementation guide is provided for
security practitioners looking to implement metrics for Critical Security Controls 8.1 and 8.2 in
an organization.

iv
TABLE OF CONTENTS
List of Figures .......................................................................................................................... v
List of Tables ........................................................................................................................... vi
List of Equations ...................................................................................................................... vi
Acknowledgements .................................................................................................................. vii
Introduction ............................................................................................................. 1
A Need to Measure Security ............................................................................................ 1 Why Measuring Security is Hard ..................................................................................... 2
A Lack of Consensus................................................................................................ 2 The Need for a Standard Measurement Taxonomy .................................................. 3 Lack of Implementation Guides ............................................................................... 3 Past Qualitative Measurement Techniques .............................................................. 4 Visibility into Systems ............................................................................................. 5 Changing Tactic, Techniques, and Procedures of Attackers .................................... 6 Research Questions .................................................................................................. 7 The Structure of this Work ....................................................................................... 7
Literature Review .................................................................................................... 9
Security Metrics ............................................................................................................... 9 Defining Security Metrics ........................................................................................ 9 Types of Metrics....................................................................................................... 10 What Makes a Metric Good ..................................................................................... 11
CIS Critical Security Controls for Effective Cyber Defense ........................................... 14 Core Tenets of CSCs ................................................................................................ 16 Benefits of Metrics ................................................................................................... 17 Other Examples of Cyber Metrics ............................................................................ 18
Situational Awareness ...................................................................................................... 19 Level 1: Perception................................................................................................... 20 Level 2: Comprehension .......................................................................................... 20 Level 3: Projection ................................................................................................... 20
Cyber Situational Awareness ........................................................................................... 21 JDL Data Fusion Process Model ...................................................................................... 22
Sensors ..................................................................................................................... 23 Level 0/1: Object Refinement .................................................................................. 24 Level 2: Situation Awareness ................................................................................... 25 Level 3: Threat Refinement ...................................................................................... 26 Level 4: Process Refinement .................................................................................... 28 Level 5: User Refinement ........................................................................................ 29 The Gap .................................................................................................................... 29
Conclusion ....................................................................................................................... 30
v
Metric Design and Development ............................................................................. 31
Critical Security Control 8 Overview .............................................................................. 31 Critical Security Control 8.1 Metric ................................................................................. 32
CSC 8.1 Metric Numerator ...................................................................................... 33 CSC 8.1 Metric Denominator ................................................................................... 33 Alternative Options for Denominator....................................................................... 34
Critical Security Control 8.2 Metric ................................................................................. 35 CSC 8.2 Metric Numerator ...................................................................................... 35 CSC 8.2 Metric Denominator ................................................................................... 36
Critical Security Control 8.3 Metric ................................................................................. 36 Critical Security Control 8.4 Metric ................................................................................. 38 Critical Security Control 8.5 Metric ................................................................................. 39 Critical Security Control 8.6 Metric ................................................................................. 40
Metric Implementation ............................................................................................ 41
Implementing Critical Security Control 8.1 ..................................................................... 45 Numerator Measurement of Anti-Virus/Anti-Malware Scan Logs .......................... 45 Denominator Measurement of ARP Cache .............................................................. 47 CSC 8.1 Metric Result ............................................................................................. 48 Splunk Dashboard .................................................................................................... 49 Fused Data Table ...................................................................................................... 50 Dashboard Value to Stakeholder .............................................................................. 51
Implementing Critical Security Control 8.2 ..................................................................... 52 Numerator Measurement of Anti-Virus/Anti-Malware Update Logs ...................... 52 Denominator Measurement of ARP Cache .............................................................. 54 CSC 8.2 Metric Result ............................................................................................. 54 Splunk Dashboard .................................................................................................... 54 Fused Data Table ...................................................................................................... 55 Dashboard Value to Stakeholder .............................................................................. 57
Metric Use Case Examples .............................................................................................. 57 Authorized & Unauthorized Machines..................................................................... 57 Network Outage ....................................................................................................... 58
Discussion and Conclusion ..................................................................................... 59
Discussion ........................................................................................................................ 59 Why Data Fusion is Important ................................................................................. 60 Potential to Increase Situation Awareness ............................................................... 61 A Guide to Help Implement Measurement .............................................................. 62
Contributions .................................................................................................................... 62 Limitations ....................................................................................................................... 63 Future Work ..................................................................................................................... 64
Conclusion ............................................................................................................................... 65
References ................................................................................................................................ 67

vi
Appendix: Source Code for Splunk Dashboards ..................................................................... 75
Critical Security Control 8.1 Dashboard Source Code .................................................... 75 Critical Security Control 8.2 Dashboard Source Code .................................................... 78

vii
LIST OF FIGURES
Figure 1: A Model for Situation Awareness from (Endsley, 1995) ......................................... 19
Figure 2: The JDL Data Fusion Process Model for Cybersecurity (Giacobe, 2010) .............. 23
Figure 3: Level 2 - Situation Awareness Model (Giacobe, 2010) ........................................... 26
Figure 4: Level 3 - Fusion for Projection (Giacobe, 2010) ...................................................... 28
Figure 5: Symantec Endpoint Protection Features (Symantec, 2017) ..................................... 43
Figure 6: A Sample Symantec Endpoint Protection Client Log Entry .................................... 45
Figure 7: Splunk Query to Produce Table 9 ............................................................................ 46
Figure 8: Splunk Query to Determine Numerator Total .......................................................... 47
Figure 9: Retrieving the ARP Cache........................................................................................ 47
Figure 10: Splunk Query to Determine Denominator Total .................................................... 48
Figure 11: Splunk Query to Determine Top Level Measurement ............................................ 49
Figure 12: CSC 8.1 Splunk Dashboard .................................................................................... 50
Figure 13: CSC 8.1 Data Correlation Query ............................................................................ 51
Figure 14: A Sample Symantec Endpoint Protection Client Update Log Entry ...................... 52
Figure 15: Splunk Query to Produce........................................................................................ 53
Figure 16: Splunk Query to Determine Numerator Total ........................................................ 53
Figure 17: Splunk Query to Determine Top Level Measurement ............................................ 54
Figure 18: CSC 8.2 Splunk Dashboard .................................................................................... 55
Figure 19: CSC 8.2 Data Correlation Query ............................................................................ 56
Figure 20: Noncompliant Network Assets Query .................................................................... 58
Figure 21: Splunk Dashboard during a Network Outage ......................................................... 58
Figure 22: All Twenty of the Critical Security Controls ......................................................... 64

viii
LIST OF TABLES
Table 1: Critical Security Controls’ Partners and Developers (“CIS Critical Security Controls: A Brief History,” n.d.) ...................................................................................... 15
Table 2: 5 Core Tenets of CSC's (“CIS Critical Security Controls: Guidelines,” n.d.) ........... 16
Table 3: Critical Security Control 8 (Center for Internet Security, 2015) ............................... 32
Table 4: CSC 8.3 Measurements ............................................................................................. 38
Table 5: DataExecutionPrevention_SupportPolicy Response Codes (“How to determine that hardware DEP is available and configured on your computer,” n.d.) ....................... 38
Table 6: ABC.local Workstations ............................................................................................ 42
Table 7: ABC.local Servers ..................................................................................................... 43
Table 8: Field Extractions for Symantec Endpoint Protection Client Scan Logs .................... 46
Table 9: Numerator Table for CSC 8.1 .................................................................................... 46
Table 10: ARP Cache from Local Network ............................................................................. 48
Table 11: Field Extractions for ARP Cache ............................................................................. 48
Table 12: CSC 8.1 Fused Data Table ....................................................................................... 51
Table 13: Field Extractions for Symantec Endpoint Protection Client Update Logs .............. 52
Table 14: Numerator Table for CSC 8.2 .................................................................................. 53
Table 15: CSC 8.2 Fused Data Table ....................................................................................... 56
Table 16: Noncompliant Network Assets ................................................................................ 58

ix
LIST OF EQUATIONS
Equation 1: Measuring CSC 8.1 .............................................................................................. 34
Equation 2: Measuring CSC 8.2 .............................................................................................. 35
Equation 3: Measuring CSC 8.4 .............................................................................................. 39
Equation 4: Measuring CSC 8.5 .............................................................................................. 40
Equation 5: Measuring CSC 8. ................................................................................................ 40
Equation 6: Metric Result from Implementation of CSC 8.1 .................................................. 49
Equation 7: Metric Result from Implementation of CSC 8.2 .................................................. 54

x
ACKNOWLEDGEMENTS
Since the beginning, God gave man and woman the task of ordering creation so that
greater abundance might flow from it. This work is a two year journey of seeking to bring order
to cybersecurity thorough the strengths and knowledge that the Lord has given me.
Over the past two years, there was many of times I wanted to give up. I can’t celebrate
the completion of this work without acknowledging the people that helped me across the finish
line.
I am the man I am today because of you, Mom and Dad. Thank you for all the sacrifices
you have made and continue to make for me. I don’t know how I got so blessed to have you both.
Kyle and Dana, thank you for the countless laughs we have experienced together. You both make
the sibling relationship so fun and life-giving.
I owe great thanks to my thesis advisor and professional mentor, Dr. Nick Giacobe. Nick,
you have been an anchor to my experience in grad school, through all the ups and downs over
two years. I truly would not be where I am professionally if it were not for you.
Thank you Dr. Forster and Don Shemanski, for your support and efforts on my thesis
committee. Thank you to my teammate Ryan Kohler. I hope we are remembered as the IST IUG
troublemakers that constantly required policy changes. Thank you Sammie, and Jaime. You were
the best Ph. D “mom and dad” I could know. The investment and wisdom you shared with me
was invaluable.
Thank you to the people that I could write a book about describing my gratitude, The
Penn State Navigators community. You will all forever be cemented on my heart.

1
Introduction
A Need to Measure Security
In April 2017, the Chamber of Commerce praised the National Institute of Standards and
Technology (NIST) for its cybersecurity measurement (Beauchesne, 2017). The first draft of
version 1.1 of the NIST Cybersecurity Framework included a new section titled “Measuring and
Demonstrating Cybersecurity.” This new section expressed “this is an under-developed topic,
one in which there is not even a standard taxonomy for terms such as ‘measurement’ and
‘metrics.’” The development of reliable ways to measure risk and effectiveness would be a major
advancement and contribution to the cybersecurity community (National Institute of Standards
and Technology, 2017b).”
A second letter to NIST from the Chamber of Commerce in January 2018 reads “The
Chamber agrees with NIST that utilizing measurement data can improve the security of multiple
business networks and information systems while providing consistent, reasonably complete, and
flexible data to a range of stakeholders (Beauchesne, 2018).”
Draft 2 of the Cybersecurity Framework Version 1.1 moved key measurement content
into the NIST Roadmap for Improving Critical Infrastructure Cybersecurity Version 1.1 after
industry suggested “that cybersecurity risk measurement was so critical to successful risk
management that a separate effort was needed to ensure measurement received adequate attention
(National Institute of Standards and Technology, 2017a).”
If measuring cybersecurity is so important to an organization’s risk management, why
has there been so little advancement to support this effort?

2
Why Measuring Security is Hard
There are a number of reason for the lack of advancement made in measuring security,
including a lack of consensus in defining security or the utilization of a standard taxonomy.
Along with this, the lack of implementation guides, qualitative assessments, and a lack of
visibility into systems makes implementing measurement in an organization difficult. Finally, the
changing nature of attacker’s tactics, techniques, and procedures (TTPs) play a role in the
challenge to measure cybersecurity.
A Lack of Consensus
One of the reasons that little advancement has occurred is because measuring security is a
difficult task. A major challenge of measuring security is a lack of consensus around what
security is (Krautsevich, Martinelli, & Yautsiukhin, 2010; C. Wang & Wulf, 1997) and how we
should measure it. Many of the definitions of security are ambiguous and contradictory (J. A.
Wang, Wang, Guo, & Xia, 2009). This presents a significant problem because without a shared
lexicon, we lack a core foundation across the domain.
As Wang and Wulf (1997) express “we tend to know approximately, what we mean by
‘security” and what we want it to do, but we seldom clearly state what security really means to us
and how secure is “secure enough.” Most works on metrics present their own understanding of
what security is and what it means to be more secure. Unfortunately, little of the work in this
domain proves that these definitions of security or security metric(s) indicates a change in the
current state of security (Krautsevich et al., 2010).
Often there is two strategies for metrics. General metrics which seek to assess the overall
status of security, such as attack surface metrics, or metrics that seek to be narrowly focused on

3
measuring components of a security system, often a requirement of a larger security framework
(J. A. Wang et al., 2009). J. A. Wang et al express that often these two strategies are “are either
too broad without precise definitions, or too narrow to be generalized to cover a great variety of
security situations (2009).”
The Need for a Standard Measurement Taxonomy
Furthermore, security researchers and practitioners lack an agreement on a security
taxonomy or model to build metrics from. If a taxonomy or model is present in research, multiple
taxonomies are often used simultaneously (Krautsevich et al., 2010). Researchers even disagree
on the need for a taxonomy or model. Rathbun (2009) argues that researchers should avoid using
a taxonomy as a framework for a metrics program because it could create subjective metrics.
While this can be true, researchers argue that security requirements from a security taxonomy or
model inform a metrics program (A. J. A. Wang, 2005; Mellado, Fernandez-Medina, & Piattini,
2010; Jansen, 2009; Savola, 2007; Luna, Ghani, Germanus, & Suri, 2011; National Institute of
Standards and Technology, 2017b; National Institute of Standards and Technology, 2017c;
Beauchesne, 2018).
Lack of Implementation Guides
Another challenge in measuring security is that much of its research fails to present
detailed instructions on how to implement security metrics collection and reporting (Vaarandi &
Pihelgas, 2014). While ample work has gone into the development of standards and taxonomies
for security, little work has gone into coupling these documents with detailed recommendations
on measuring the requirements put forth (Narang & Mehrotra, 2010).

4
Implementing cybersecurity metrics can be a difficult task to undertake for some
organizations. Metrics are often most effective when incrementally improved as an organization
grows its monitoring and collection capabilities. Beres, Mont, Griffin, & Shiu (2009) claim “often
the metrics that end up being collected across organizations are low-level, operational metrics,
which are amassed without contextualizing them to the overall security processes.” This strategy
is very dangerous because metrics inform macro level analysis of an organization’s security
policy and budget. If metrics are not properly contextualized, patterns drawn from these metrics
to aid in predictive decisions, could negatively impact an organization because they are incorrect
and uninformed (Black, Scarfone, & Souppaya, 2008).
A further difficulty related to this task is how to apply metrics to be indicative of
“unmitigated risk and security control gaps (Beres et al., 2009)” in order to offer strategic
decision makers insight into areas in need of mitigation. The best metrics “provide indications of
trends and longer-term phenomena and enable the long-term assessment of security processes
(Beres et al., 2009),” for strategic decision makers (Beres et al., 2009).
Past Qualitative Measurement Techniques
Past efforts relied on qualitative metrics that lacked a foundation for replication. Jansen
explains “qualitative measures that reflect reasoned estimates of security by an evaluator are the
norm. That is, measures of information system security properties are often based on an
evaluator’s expertise, intuition, and insight to induce an ordering, which is then quantified
(2009).” For many years, a qualitative evaluation resulted in a designation of a product’s security
level. This process was qualitative because of the difficulty of quantifying an evaluator’s
experience, evidence and evaluation criterion (Narang & Mehrotra, 2010).

5
Another common strategy for evaluating security involves subjective measurements
through a process known as the Delphi Technique. The Delphi Technique allows a group of
individuals to anonymously submit opinions until a consensus is formed through a funneling
system (A. J. A. Wang, 2005; Linstone & Turoff, 2002). This research defines a metric as a
quantitative measurement (C. Wang & Wulf, 1997; A. J. A. Wang, 2005; J. A. Wang et al., 2009;
Chew et al., 2008).
Visibility into Systems
To measure cybersecurity efficiently and effectively, one must have visibility into
systems. Visibility into computer networks and systems has traditionally occurred through
security logs. Security logs are the logging of actions that a system or component undertakes.
Most aspects of modern day computing and networking support logging functionality.
Security logs provide one of the best ways to collect and produce quantitative security
measures. Security logs are ideal because they are a rich data source that can be coupled with
automation. This rich data source provides the visibility to understand what is occurring on a
system or network from the operating system to the network perimeter, and every protocol in
between.
While security logs are ideal, security researchers have avoided them because of their
large size and difficulty to parse (Vaarandi & Pihelgas, 2014). These challenges have kept
researchers from pursuing security logs as a viable data source for metrics. While researchers
have avoided security logs, industry practitioners have long relied on security logs as the
foundation for visibility into their systems. The challenge that an organization often faces is
visibility gaps. To effectively monitor every aspect of a computing infrastructure, numerous
network sensors are needed. These sensors log information and store these logs in a centralized

6
logging environment. This infrastructure and management of it can be a significant overhead to
an organization.
Because of this significant overhead, organizations make risk decisions around which
sources to log, according to their risk appetite. Often times tradeoffs are made. Full packet
capture at network gateways is an excellent logging source. The drawback to this approach is the
vast amount of data to process and retain. PCAPs are also difficult to parse and maneuver. An
alternative to full packet capture includes logging netflow data. Netflow is a less intensive capture
that make it attractive to organizations. The drawback to this approach is valuable information is
lost compared to full packet capture. The ability to determine what was communicated between
network hosts can be critical in a security incident.
Along with choosing which systems to log, an organization has to determine how long to
retain each data source. An organization that chooses to retain full packet capture for 30 days,
will need terabytes, if not petabytes, to store the resulting PCAP files. This can be a significant
overhead cost to an organization resulting in a need to reduce how long data is retained.
Changing Tactic, Techniques, and Procedures of Attackers
Another reason why measuring security is difficult is because of the shifting nature of
attacker’s tactics, techniques, and procedures (TTPs). An attacker is always seeking to exploit a
systems vulnerabilities or visibility gaps. As an organization continually seeks to improve its
network security, new security technologies and logging capabilities will likely be deployed.
Because of this, attackers shift their TTP’s to be successful. This cat and mouse game is not a
new reality in security.
An example of this reality is the rise of DNS exfiltration over the last five years.
Attackers became aware that many organizations do not monitor or filter their DNS traffic. This

7
visibility gap allowed attackers to develop techniques for the exfiltration of data over DNS.
Because of this, organization have begun deploying a relatively new technology known as DNS
firewalling.
Research Questions
A lack of consensus, the need for a standard taxonomy, a lack of implementation guides,
past qualitative techniques, poor visibility into systems, and changing TTPs of attackers make
measuring security a difficult task. Greater research and development is needed in these areas to
move forward in NIST’s push to drive organizations to measure security. This research hopes to
play a role in that push.
This research will pursue two research questions. The first research question is: “How
does data fusion of security logs help measure Critical Security Controls?” It is hypothesized that
data fusion of security logs can provide an organization an automated, real time measurement of
their compliance with Critical Security Controls. The second research question is “How do
metrics contribute to stakeholder’s situation awareness?” It is hypothesized that metrics will
contribute to a CISO’s situation awareness, as well as, a systems administrator.
The Structure of this Work
This thesis contains five chapters that lay out the problem through this research’s
contribution to solving the problem. This chapter has covered the need for measurement in
cybersecurity and the difficulty associated with that proposition. Along with this, two research
questions and two hypotheses are described.

8
Chapter two discusses the literature that has come before this research. This research is
built off of the foundations of literature from three primary domains. These three domains include
security metrics, situation awareness, and data fusion. These three domains and their literature are
covered to provide context and others attempts at defining or solving this research’s question.
Chapter three discusses the design and development of six metrics. These six metrics are
sub controls to Critical Security Control 8: Malware Defenses. This CSC is briefly covered from
a macro level including the role it plays in the larger group of 20 CSCs. Each sub control is
described and how this research developed a metric to measure its recommendation. Most of the
metrics developed are in the form of a percentage, derived from the division of a numerator
measurement and a denominator measurement.
Chapter four discusses the implementation of two of the developed metrics. Metrics for
CSC 8.1 and 8.2 are implemented to provide a proof of concept and context for feasibility.
Accomplishing an implementation of metrics provides this research the ability to offer an
implementation guide for organizations looking to implement CSC 8.1 and 8.2. This action
pushes the metrics research domain to be practical and technical, a current shortfall.
Chapter five discusses why data fusion is important in measuring security and how
metrics can contribute to a stakeholder’s situation awareness. After this, this research’s
contributions, limitations and future work is described.

9
Literature Review
This review considers three domains: security metrics, situation awareness, particularly
of the cyber subject area, and multisensor data fusion and the JDL Data Fusion Process Model.
These three domains and their foundational literature are reviewed in isolation to evaluate their
contributions to their respective fields.
Security Metrics
An organization cannot improve what it does not measure. This statement is true for
policy, culture, processes, and projects. For an organization to measure success, it needs
measurements on a continual basis with a clear conceptual definition of success (Narang &
Mehrotra, 2010). This reality is no different in the security domain (Mellado et al., 2010; A. J. A.
Wang, 2005). Security metrics are measurements of the performance of an organizational policy.
The topic of security metrics is often described using the similar terms of security
measures, security performance indicators, and information assurance metrics. For this research,
cybersecurity metrics is used, as well as, the broader term of security metrics.
Defining Security Metrics
As discussed last chapter, there are a number of challenges in defining security and
security metrics. Beres et al. (2009) define security metrics as “meaningful measures that can be
collected and reported to show whether security controls are working effectively or where risk is

10
emerging.” A 2003 report, published by the National Institute of Standards and Technology
(NIST), defines security metrics as “tools designed to facilitate decision making and improve
performance and accountability through collection, analysis, and reporting of relevant
performance-related data (Brown & Robinson, 2003).” Wang defines software security metrics
as “the quantitative measurements of trust indicating how well a system meets the security
requirements (2005).” Chew et al. adds that security metrics “monitor the accomplishment of
goals and objectives by quantifying the implementation, efficiency, and effectiveness of security
controls (2008).”
While each definition differs, a common thread exists which considers a metric as a
measurement collected to reveal insights into the state of a strategic goal for clarity in decision
making and security requirements.
Types of Metrics
Keeney, outlines three different types of metrics including natural metrics, constructed
metrics, and proxy metrics. A natural metric is a metric that is general in nature and has a
common interpretation. These metrics are typically able to be physically measured or counted. An
example of a natural metric is a reduction in cost (1992).
A proxy metric is similar, but does not directly measure the objective. A proxy metric can
also be physically measured or counted, but is less informative because it is not the direct natural
measurement. Keeney, uses the example of measuring the number of returns of a product in
hopes of measuring the quality of a product (1992). These metrics are typically used when it is
difficult to measure the natural metric (Keeney, 1992).
Constructed metrics are metrics that are created when it is impossible to measure an
objective in a natural or proxy metric. Constructed metrics often involve a scale to quantify a

11
measurement. An example of a metric using a scale is measuring the fear in a local community
around the development of a nuclear waste sight. Since it is impossible to measure fear of every
individual and correctly measure the variance between individuals. Because of this challenge, a
constructed scale or metric is created to bring some form of consistency across multiple measures
(Keeney, 1992).
While Keeney offered these types of metrics, Chew et al. (2008), proposes three types of
measurements: implementation metrics, effectiveness/efficiency metrics, and impact metrics.
Implementation metrics measure implementation progress of a particular initiative or project. An
example of such is the number of accounts that have been transitioned to multifactor
authentication under a new security policy. Effectiveness metrics measure if an implemented
control accomplishes what it set out to do. An example includes a metric providing evidence that
a new email filter reduced spam by 50%. Efficiency metrics measure the amount of time it takes
to accomplish a task or process. An example includes a metric providing evidence for the average
number of days it takes for an organization to implement a vulnerability patch on all
workstations. Impact metrics seek to capture the impact that information security has had on the
larger business (Chew et al., 2008).
Jansen (2009) agrees with effectiveness measures but argues for the second component
being correctness measures. Correctness measures are based on the assurance of the security
mechanisms having been rightly implemented.
What Makes a Metric Good
Previous literature has outlined a number of characteristics of good metrics. Keeney &
Gregory (2005), outline five desired properties of an attribute, or metric as defined here,
suggesting that a metric be unambiguous, direct, operational, understandable, and comprehensive.

12
Unambiguous metrics possess a clear relationship to the consequences of an action and express a
predefined purpose (Vaarandi & Pihelgas, 2014); they are not vague or imprecise. Direct metrics
are clear and directly address the objective at hand. Operational metrics are “logistically and
analytically achievable with available resources and capability (McKay, Linkov, Fischenich,
Miller, & Valverde, 2012).” Understandable metrics can be grasped by anyone interested in the
analysis (Keeney & Gregory, 2005). Comprehensive metrics cover a spectrum of possibilities of
consequences.
McKay et al. add “relevant” as a criterion to Keeney and Gregory’s list. Relevant metrics
measure “specified objectives and priorities of decision makers at appropriate spatial and
temporal scales and resolution (McKay et al., 2012).”
A good metric is actionable (Marr, 2010). A metric is not simply a gathering of
information without a purpose, but rather a measurement that aims to address a problem or key
component of a system. Along with being actionable, a good metric should be aligned with
organization’s strategic goals (Chew et al., 2008; Marr, 2010; Rathbun, 2009; Payne, 2006).
Vaarandi & Pihelgas (2014) describe a metric as being tailored to a specific audience. A
senior level executive and a systems administrator would be interested in different types of
metrics. In developing metrics practitioners should consider the intended audience in order to
answer the right questions for the right audience (Rathbun, 2009). Within the CIS Critical
Security Controls (Center for Internet Security, 2015), CIS classifies three types of metrics for
their expected audience. Technical metrics are for security practitioners and management while
operational metrics are designed for various levels of administration or executives.
For organizations that possess the requisite capabilities, a metrics dashboard should
provide the ability to drill down in a metric (Vaarandi & Pihelgas, 2014; Black et al., 2008).
Having the ability to drill down into the data that makes up a metric provides the ability to
quickly find anomalous data; it also yields a metric that can be tailored to particular timeframes or

13
axis measures. A metric should not be cost intensive and should be able to be collected and
maintained automatically through automation (Vaarandi & Pihelgas, 2014; J. A. Wang et al.
2009; Rathbun, 2009; Chew et al., 2008; Patriciu & Nicolaescu, 2006).
A good metric has a purpose and answers the question asked. If compliance is not the
purpose, a metric should be tied to a particular business process where business impact is
measured; an example is cost per incident (CPI) of a security incident. While this measurement is
not a part of many compliance standards, it provides valuable insight into the business cost of a
security incident. If measuring compliance is a requirement of a security metrics program, it
needs to be tied to a larger taxonomy or model where compliance can be measured (A. J. A.
Wang, 2005; Mellado et al., 2010; Jansen, 2009; Savola, 2007; Luna et al., 2011). These
taxonomies or models need to be validated and verified before building a metrics program based
on its requirements (A. J. A. Wang, 2005). A number of cybersecurity taxonomies/models exist
today, most of which require measurement of requirements for compliance (Fidelis
Cybersecurity, 2017).
In 2009, ISO/IEC 27001 required an organization hoping for certification to “measure the
effectiveness of controls to verify that security requirements have been met” (International
Organization for Standardization, 2013). This standard was criticized for its broad requirements
that lacked guidance on how to accomplish the measurement it requires (“ISO 27004 -
Information Security Metrics,” n.d.). In response, ISO 27004 was developed and it “provides
guidelines intended to assist organizations in evaluating the information security performance and
the effectiveness of an information security management system in order to fulfil the
requirements of ISO/IEC 27001:2013” (International Organization for Standardization, 2016).
Along with ISO 27000 series, NIST SP 800 series provides numerous documents related
to compliance and measurement of controls. NIST Special Publication 800-53 identifies
information security controls for government systems (Joint Task Force Transformation

14
Initiative, 2013). NIST Special Publication 800-53A covers the “assessment methods and
procedures for a minimum level due diligence for organizations assessing the security controls in
their information systems (Savola, 2007) (Joint Task Force Transformation Initiative, 2014).”
NIST Special Publication 800-55 covers the use of metrics for measuring security controls (Chew
et al., 2008).
Beginning in 2018, the United States government requires any system containing
Controlled Unclassified Information (CUI) “operated by contractors of federal agencies or other
organizations on behalf of those agencies” to meet specific information safeguard criterion (Ross,
Dempsey, Viscuso, Riddle, & Guissanie, 2015). Measurement of criterion is required to show
compliance as described in NIST SP 800-171.
PCI DSS, the Payment Card Industry Data Security Standard, states that “organizations
should quantify their ability to sustain security practices and PCI DSS compliance by developing
a set of metrics that summarize the performance of their security controls and security program”
(PCI DSS, 2014).
These taxonomies provide a valuable resource to organization looking for guidelines
around security best practices. The challenge with these taxonomies is the lack of detailed
guidance on how to carry out measurement of compliance. This problem is not well defined in
any of the existing cybersecurity taxonomies today. Although this shortcoming is present, this
research believes that a good metric is aligned to a security taxonomy. This research builds its
metrics around the CIS Critical Security Controls.
CIS Critical Security Controls for Effective Cyber Defense
The Center for Internet Security (CIS) is a non-profit entity that seeks to “identify,
develop, validate, promote, and sustain best practice solutions for cyber defense.” Its programs
15
include the CIS Critical Security Controls and CIS Benchmarks. These programs outline global
standards for best practices in cyber defense.
The CIS Critical Controls for Effective Cyber Defense are a list of twenty controls that
provide the foundation for security in computer networks. Beginning in 2008, the Department of
Defense asked the National Security Agency (NSA) to assist in the prioritization of security
controls for combatting increasing cyber attacks. NSA played a key role in development because
the consensus for this list was the belief that “offense must drive defense” (“CIS Critical Security
Controls: Guidelines,” n.d.). The mandate from the State Department and the White House
required that controls only be listed if they were effective at preventing or mitigating known
attacks. This process and knowledge was not new to NSA.
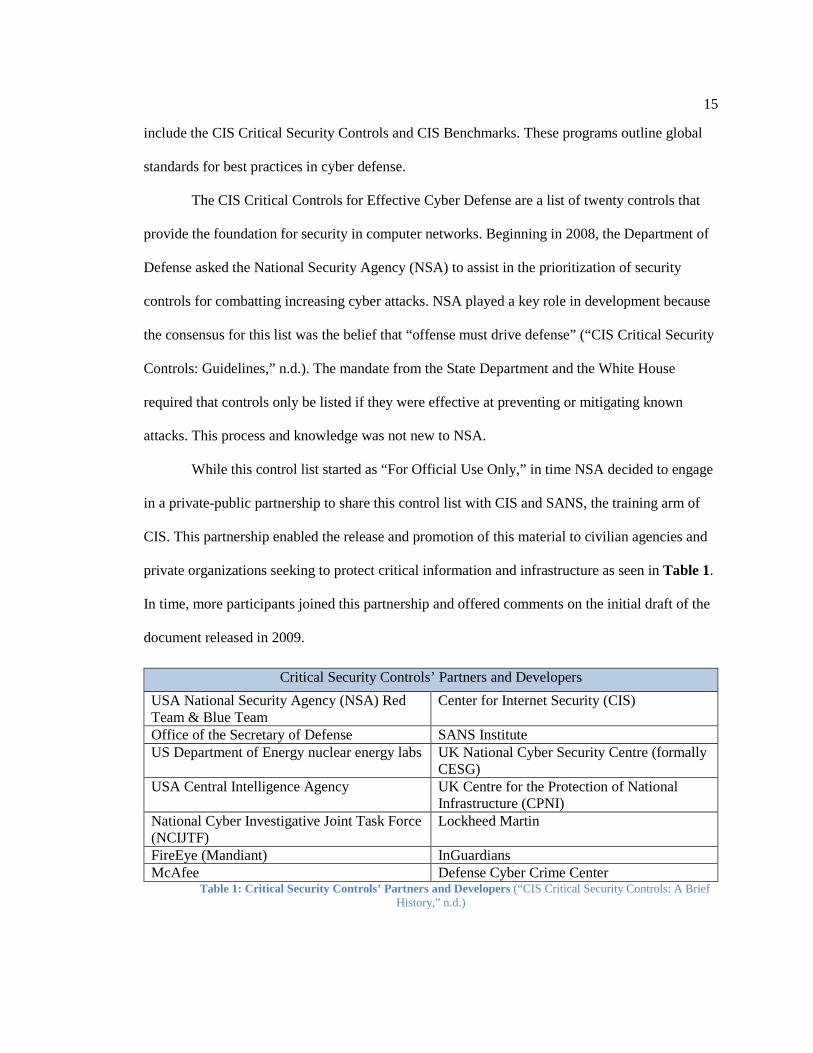
While this control list started as “For Official Use Only,” in time NSA decided to engage
in a private-public partnership to share this control list with CIS and SANS, the training arm of
CIS. This partnership enabled the release and promotion of this material to civilian agencies and
private organizations seeking to protect critical information and infrastructure as seen in Table 1.
In time, more participants joined this partnership and offered comments on the initial draft of the
document released in 2009.
Table 1: Critical Security Controls’ Partners and Developers (“CIS Critical Security Controls: A Brief History,” n.d.)
Critical Security Controls’ Partners and Developers USA National Security Agency (NSA) Red Team & Blue Team
Center for Internet Security (CIS)
Office of the Secretary of Defense SANS Institute US Department of Energy nuclear energy labs UK National Cyber Security Centre (formally
CESG) USA Central Intelligence Agency UK Centre for the Protection of National
Infrastructure (CPNI) National Cyber Investigative Joint Task Force (NCIJTF)
Lockheed Martin
FireEye (Mandiant) InGuardians McAfee Defense Cyber Crime Center

16
The implementation of these controls at the State Department led to an 88% reduction in
“vulnerability based risk (“CIS Critical Security Controls: A Brief History,” n.d.)” across their
systems. Because of this, the State Department became a model for large organizations. In
December 2011, the United Kingdom’s Centre for the Protection of National Infrastructure
(CPNI) adopted the CIS Critical Security Controls as the framework for all government agencies
and industries moving forward. The CIS Critical Security Controls for Effective Cyber Defense
have become a leading example of the benefits of public-private partnership (“CIS Critical
Security Controls: A Brief History,” n.d.).
Core Tenets of CSCs
There are five critical tenets that are at the foundation of each of the Critical Security
Controls. These five tenets, as seen in Table 2, include 1) Offense Informs Defense 2)
Prioritization 3) Metrics 4) Continuous Monitoring 5) Automation.
Five tenets Offense informs defense
Use knowledge of actual attacks that have compromised systems to provide the foundation to build effective, practical defenses. Include only those controls that can be shown to stop known real-world attacks.
Prioritization Invest first in controls that will provide the greatest risk reduction and protection against the most dangerous threat actors, and that can be feasibly implemented in your computing environment.
Metrics Establish common metrics to provide a shared language for executives, IT specialists, auditors, and security officials to measure the effectiveness of security measures within an organization so that required adjustments can be identified and implemented quickly.
Continuous monitoring Carry out continuous monitoring to test and validate the effectiveness of current security measures.
Automation Automate defenses so that organizations can achieve reliable, scalable, and continuous measurements of their adherence to the controls and related metrics
Table 2: 5 Core Tenets of CSC's (“CIS Critical Security Controls: Guidelines,” n.d.)
To effectively carry out the Critical Security Controls, a metrics program is a necessity.
Continuous monitoring and automation are also keys that play a large role in accurate and

17
efficient metrics. However, little research has been done in developing metrics to measure each of
the Critical Security Controls.
Benefits of Metrics
There are many benefits to using metrics. To determine success or make improvements to
any process or policy, a measurement has to be at its foundation. Metrics are immensely valuable
to an organization if configured properly and with sufficient data (Krautsevich et al., 2010).
Metrics provide an organization quantifiable determinants of the strength of their security (A. J.
A. Wang, 2005). As Narang & Mehrotra explain, “there is a need to measure this security to
justify the performance of the system (2010).” It is extremely useful to compare and contrast
system security across an organization or across industry (C. Wang & Wulf, 1997). Metrics can
help identify vulnerabilities in a system and provide data to assist in the priority of corrective
action based on risk mitigation techniques.
Along with these benefits, Wang highlights that metrics can raise the security awareness
in an organization (A. J. A. Wang, 2005; J. A. Wang et al., 2009). Senior level management
should utilize metrics as a way to spot trends within their organization and to predict potential
new risk areas (Chew et al., 2008). The threat environment is constantly changing, as such a
successful metric should have the ability to adapt as the environment changes (Beres et al., 2009).
Chew et al. (2008) also offer a list of positive benefits of metrics which include the ability to:
increase accountability, improve information security effectiveness, demonstrate compliance, and
provide quantifiable inputs for resource allocation decisions. Rathbun (2009) highlights five more
positive impacts of metrics: Security metrics can be used to facilitate benchmark comparisons;
they will help you communicate performance; they will help drive performance improvement;
they can help to diagnose problems; and they provide effective decision-making support.

18
Other Examples of Cyber Metrics
A number of publications in the past few years have sought to identify how to measure
security in particular domains. In cloud security Luna et al (2011) discuss the challenges and
importance of metrics in the cloud environment. Along with this, they offer a security metrics
framework for cloud provider assessments. Jain & Ingle (2011) conduct a review of software
development metrics. They conclude that of the developed metrics, there exists a greater need for
quantitative metrics to assess the loopholes identified in the security life cycle.
In cybersecurity, Sandoval & Hassell (2010) offer metrics to assess systems and
architectures for their dynamic solutions in network defense. This approach differs from the
“defense in depth” mantra traditionally held in information security. Langweg (2006) offers
metrics to measure the resistance of applications and systems to malware. L. Wang, Jajodia,
Singhal, Cheng, & Noel (2014) develop a metric to measure applications for unknown zero day
vulnerabilities. This metric seeks to quantify product security by providing a measure to the
number of zero day attacks that would need to be accomplished to compromise network assets.
Vaarandi & Pihelgas (2014) develop metrics derived from security logs of common log types.
Along with this, an open source framework for collecting and reporting cybersecurity metrics is
presented. Much of this research is built off of the work of Vaarandi and Pihelgas.
Numerous work have examined cybersecurity risk posture by seeking to measure cyber
resiliency and cyber robustness. Cybenko (2018) develops a quantifiable metric to examine the
cyber resiliency across an organization. This metric offer the ability to be tailored to an
organization’s context and needs. Baiardi, Tonelli, Bertolini, & Montecucco (2016) propose three
metrics to measure cyber robustness. This metric seeks to quantify the probability an attacker
accomplishes their attack in a predetermined time window.

19
Situational Awareness
In its simplest definition, situation awareness (SA) “is knowing what is going on around
you” (Endsley & Garland, 2000). It’s defined in operational terms relative to what is important.
In a more thorough definition, Endsley (1988) defines SA as “the perception of the elements in
the environment within a volume of time and space, the comprehension of their meaning and the
projection of their status in the near future.” SA is gathered from various sources of information
available to a human at any given time. This gathering can be subtle, overt, or subconscious cues
that can be received through “visual, aural, tactile, olfactory, or taste receptors” (Endsley &
Garland, 2000).
Endsley’s proposed theoretical model of situational awareness for dynamic human
decision making has become a standard for the domain (Endsley, 1995). This model involves
three levels of situation awareness as seen in Figure 1.
Figure 1: A Model for Situation Awareness from (Endsley, 1995)

20
Level 1: Perception
The first level of situation awareness involves the perception of cues. An understanding
of important information involved in a situation is needed to form an image of the situation.
Without proper understandings of what is important, damaging decisions can occur. Jones and
Endsley (1996) found that 76% of errors from aircraft pilots developed from problems in
perceiving the information necessary for their situations.
Level 2: Comprehension
Level 2 builds on perception with the fusion of multiple streams of information to
determine relevance. Furthermore, it “encompasses how people combine, interpret, store, and
retain information (Endsley & Garland, 2000).” Meaning and significance are the primary end
goal of this level of SA. According to Jones and Endsley (1996), 20% of aircraft pilot errors came
from errors involving comprehension of their perceptions.
Level 3: Projection
Level 3 builds on comprehension with the ability to make projections of what will happen
in the future based on the comprehension of perceptions. According to Endsley and Garland
(2000), this is “the mark of a skilled expert.” Understanding the current state of reality and having
the ability to make future projections is valuable and gives experts the upper hand against an
adversary.

21
Cyber Situational Awareness
While adversaries have attacked computer networks since their inception, the need for
situation awareness in cyberspace was made apparent with a rapid increase in computer network
attacks against targets ranging from military operations, infrastructure, and private businesses
(Ballora, Giacobe, McNeese, & Hall, 2011). In response to the emergence of advanced persistent
threats (APT) security practitioners recognized the need for cyber situation awareness. Much of
the literature in this subdomain was built off the foundational work by Endsley (Franke &
Brynielsson, 2014). Cyber situation awareness has similar foundations to that of Endsley’s work
(1995), but adapts the model to cyber environments. Cyber situation awareness changes at a rate
much faster than that of the physical world, with alerts, logs, and intelligence being the only
insight an analyst has into their environment (Tyworth, Giacobe, Mancuso, & Dancy, 2012). Like
Endsley’s work, cyber situation awareness is a cognitive process primarily viewed as a mental
state that an analyst possesses (Franke & Brynielsson, 2014; D’Amico, Whitley, Tesone,
O’Brien, & Roth, 2005; Mancuso, Minotra, Giacobe, McNeese, & Tyworth, 2012). Cybersecurity
analysts need to attain and maintain situation awareness through data from network sensors to
defend a network (Giacobe, 2013). Along with network sensors, an analyst needs to understand
the techniques, tactics, and procedures (TTPs) of adversaries (Ballora et al., 2011). Cyber
situation awareness is not to be taken in isolation, but rather viewed as an aspect of overall
situation awareness (Franke & Brynielsson, 2014).
Measuring situation awareness is difficult; this is no different in the cyber domain. Visual
interfaces have been shown to be more effective than text interfaces at conveying situation
awareness to an analyst (Giacobe, 2013).

22
Cyber situation awareness at its core is “compiling, processing, and fusing data” (Franke
& Brynielsson, 2014). Data fusion is a primary function carried out to achieve cyber situation
awareness.
JDL Data Fusion Process Model
Data fusion is a subject area that is not new but has received significant attention in the
past 25 years with the information age. Simply put, “data fusion techniques combine data from
multiple sensors” (D. L. Hall & Llinas, 1997). These processes “ultimately serve to help a
decision-maker gain and further develop a high degree of situation awareness (Franke &
Brynielsson, 2014).”
The JDL Data Fusion Process Model was developed in 1991 and describes the process of
fusing multiple steams of data together to gain better situational awareness (Kessler et al., 1991).
The model includes five levels of data fusion, in which the objective is to understand the current
environment and future courses of action. The model was revised in 1999 and then again in 2002
to include a fifth level of HCI (Steinberg, Bowman, & White, 1999; Blasch & Plano, 2002).
In 2010, Giacobe evaluated the effectiveness of visual analytics in situational awareness
scenarios. Along with this research, he reviewed the JDL Data Fusion Process Model and it’s
impact on situation awareness within cybersecurity scenarios. His work can be seen in Figures 2,
3, and 4. Giacobe mapped the JDL Data Fusion Process Model to the cybersecurity domain. This
work included evaluating tools and processes used in the cybersecurity field to determine where
these tools and processes fall into the existing model, if at all. This section covers his work to
provide a foundation of understanding for this research to build off of. His contribution has the
potential to be foundational research in developing data fusion systems to protect systems ranging
from critical infrastructure to organizational networks. According to Giacobe (2010), “it is

23
important to understand the relationship of the basic components of the fusion process in
cybersecurity terms” before one can understand the cybersecurity functions and value of each
level.
Figure 2: The JDL Data Fusion Process Model for Cybersecurity (Giacobe, 2010)
Sensors
The first component of the model includes sensors. Sensors are devices that report on the
network system’s security. Classic examples include firewalls, Network based Intrusion
Detection Systems (NIDS), vulnerability scanners, and other network monitoring tools. All of
these tools produce data. This data is in the form of firewall logs, NIDS alerts, vulnerability
assessments, and other IT maintenance data. This sensor data feeds into the start of the fusion
process. Many organizations have troves of sensor data that do not get analyzed because of the
volume of data and the amount of work required to analyze it. This highlights the value and need
for data fusion systems that can handle large amounts of different kinds of data. A common
approach in information security has been to approach focus on adding cybersecurity tools where

24
perceived risk exists. These tools produce data to help prevent, combat, and respond to attacks on
a network. The downfall to this approach is that these isolation, these tools produce a mountain of
sensor data that adds no value to gaining a holistic understanding of what is occurring on a
network (Rathbun, 2009). Methods to interpret the data from these sensors have been proposed
but first they must be processed (Giacobe, 2012).
Level 0/1: Object Refinement
Level 0 is where source pre-processing occurs. In this low fusion level, data from
different sources is synchronized. An example of this is the aligning of data to a common
timestamp across different time zones. Level 1 is a continuation of Level 0 but focuses on
outputting entities and their properties. To do this outputting, algorithms combine the Level 0
synchronized data from across the network. NIDS alerts report the source and destination IP
address that can be synchronized with data from vulnerability assessments of the destination IP
address. Firewall logs report the IP address, traffic type, and port numbers for each process.
Server security logs provide information on successful and failed authentications that have
occurred. The logs include the hostname and username that sought authentication. Synchronizing
this data with IP address based data is the most common synchronization process in this level.
The major challenge in this level is to synchronize data that does not necessarily share a
common timestamp or identifier. If the sensor data does not include some form of common
identifier, the data can end up providing little value because it cannot be fused. Level 0/1 fusion
research has largely focused on the fusion of data from IDS systems that have different detection
capabilities (Giacobe, 2010).
Since then, Cerullo et al (2016) worked to enable the convergence of physical and logical
security logs through event correlation. This Level 1 fusion aims to provide organizations an

25
integrated solution to monitor security holistically. A simulated environment is developed around
protecting critical infrastructure. This simulation examines different attack patterns and how
detection occurs through their converged correlation system.
Level 2: Situation Awareness
Level 2 fusion is focused on the development of situation awareness on the current state
of a network. The main process is aggregating Level 1 entities to gain a holistic understanding of
the current state. When a baseline understanding of normal network operations has been
developed, an analyst is able to spot anomalies and/or prompt an investigation. Understanding the
current posture of a network is half of the function in Level 2. Combining an understanding of a
network’s current state with the capabilities of attackers provides a true level of understanding
and awareness.
Recent work by Timonen, Lääperi, Rummukainen, Puuska, & Vankka, (2014) has sought
to develop a common operating picture for critical infrastructure. This has been approached by
combing the JDL Data Fusion Process Model, with an agent-based brokered architecture. This
system can improve situation awareness of the interdependencies within critical infrastructure
networks.

26
Figure 3: Level 2 - Situation Awareness Model (Giacobe, 2010)
Level 3: Threat Refinement
Level 3 fusion is focused on threat refinement in an effort to predict possible future
courses of action by attackers. When the current state of the network is combined with possible
vulnerabilities that an attacker can exploit, an analyst can be proactive in cybersecurity defense. A
prime component of this level, as mapped by Giacobe, could include the CVE Database which
provides information about current vulnerabilities that an attacker can use (Giacobe, 2010). The
CVE database includes over 100,000 entries dating back to 1999.
Since knowing the current landscape of vulnerabilities is a laborious task for an analyst,
the necessity creates a need for the development of automated tasks and algorithms that can
harness Level 2 data in an ever-changing vulnerability landscape. Having an understanding of the
tools to which an attacker has access to is another piece of valuable information that can aid an
analyst in engaging in proactive behavior. Another important consideration regards knowledge
about which data is at risk. Data science and data mining are emerging as promising subject areas

27
in relation to this concern (Bass, 2000). Buczak & Guven, (2016) conducted a systematic
literature review of machine learning and data mining methods for cybersecurity. This review
offers numerous methods for using machine learning to drive threat prediction within a network.
Understanding the location of data and the shared infrastructure on which data sits
informs decisions about controls in certain locations to prevent exploitation that allows for lateral
movement on shared infrastructure. When the value of particular data is known, risk assessments
can be used to determine which attacks an organization needs to mitigate, avoid, transfer, or
accept according to the defined risk appetite of the organization. Accepting certain attacks occurs
when the impact from the loss of that particular low value data is not worth the cost of protecting
it. In evaluating the risk of a distributed denial of service (DDoS) attack, many organizations
choose to transfer this risk to the internet service provider. It is these types of business decisions
that Level 3 threat refinement offers an organization.
When an analyst is able to understand the current state of his or her network, the
attacker’s capabilities, and the location and value in the data that an organization possesses, the
analyst is able to guide policy and be proactive, not merely reactive, in combating cyber attacks.
This research believes that achieving this level of fusion provides the best possibility of
combating an APT actor with long-term resources.

28
Figure 4: Level 3 - Fusion for Projection (Giacobe, 2010)
Level 4: Process Refinement
Level 4 fusion aims to step back, look at the fusion process, and examine the system as it
takes input from outside sources. Updating and selecting the right sensors and tools in one’s
fusion system is necessary for long term success. In Blasch and Plano’s proposed modification of
JDL, Level 4 is divided into two levels - one level for machine process refinement and another
level for user refinement. Blasch and Plano (2002) explain that the limitation of having both
processes in the same level is the lack of purpose conveyed. Machine process refinement includes
updating tools like NIDS for the latest capabilities and patch management such as anti-virus
definitions. Much of the data fusion research deals with machine process refinement (Blasch &
Plano, 2002).

29
Level 5: User Refinement
Blasch & Plano (2002) label sensor fusion as incomplete without user refinement. Level
5 fusion is focuses on human computer interaction (HCI) and cognitive refinement (Blasch &
Plano, 2002). The goal of Level 5 is to provide the analyst with a visual understanding of each
level of the fusion system. The challenging aspect that has plagued many cybersecurity analysts is
the vast amount of data provided to the analyst with high false positive rates (Giacobe, 2010).
This amount of data can be overwhelming to an analyst. Another challenge of this level is the
lack of a mental model. Giacobe (2010) discusses the challenge of not having a common
understanding of a cyber terrain. Cyber terrain is the “physical and logical infrastructure and
mission data” (Bodeau, Graubart, & Heinbockel, 2013). Often, the knowledge of cyber terrain is
different for analysts and the designers of cybersecurity fusion systems. It is unlikely that one
common “terrain” will be developed (Giacobe, 2010).
D. L. Hall, McMullen, & Hall, (2015) conducted a review of the advances to Level 5
information fusion. This research offers numerous advances in technology that have affected this
level of fusion including new sensing technologies, increased computing capabilities, increased
bandwidth and connectivity, and intelligent interconnections.
The Gap
As this literature outlines, cyber situation awareness is “compiling, processing, and fusing
data” (Franke & Brynielsson, 2014). There are many different sources of data used for gaining
situation awareness, including firewall logs, server logs, or patch management data. The literature
of cybersecurity metrics has highlighted the value of gathering this same data while also creating
metrics to track over time.

30
Many authors take these data sources and move directly to situation awareness. This
work suggests these authors are underestimating the value of a layer in between data sources and
cyber situation awareness. This layer that is being underestimated is cybersecurity metrics.
Currently, the literature does not explore how cybersecurity metrics can help increase situation
awareness.
On top of this, much of cybersecurity metrics work is isolated to one data stream. Data
fusion of multiple, cross functional metrics provides an opportunity to increase situation
awareness compared to metrics focused on one data stream because of the scope of data
collection in an environment. This layer 2 JDL fusion can help assist cybersecurity analysts
develop a fuller, more streamlined view of situation awareness in their cyber environments.
Gaining greater situation awareness will likely produce analysts who can mitigate and defend
networks from attacks with greater effectiveness and aid in developing Level 3 Prediction. This is
of great value as cyber campaigns continue to increase with a growing number of nation states
and rogue actors participating.
Conclusion
This section has outlined the current literature on security metrics, data fusion, and
situation awareness. Along with reviewing this literature, the current deficiencies are outlined and
how these domains present an opportunity to complement each other with a rationale for why the
subject area needs more research and how this research could help solve the deficiencies that are
present in the current state of the research.

31
Metric Design and Development
This research seeks to develop measurements for Critical Security Control 8: Malware
Defenses. This section covers an overview of CSC 8 and briefly describes each sub control, as
well as, measurements for the six sub CSC’s.
Critical Security Control 8 Overview
CSC 8: Malware Defenses has a total of six sub controls aimed at controlling the
“installation, spread, and execution of malicious code (Center for Internet Security, 2015).” Of all
twenty CSC’s, this research is pursuing developing measurements for this CSC to start for a
number of reasons. One of these reasons includes the enterprise readiness to measure anti-
virus/malware, through tools such as Symantec Endpoint Protection or McAfee Endpoint
Security. Most all organizations deploy some form of anti-virus protection for their workstations;
along with this, most organizations maintain log data related to these systems. These two
characteristics make CSC 8 attractive as a starting spot for developing a metrics program.
Another reason for pursuing this CSC is the stable and consistent threat malware has posed to the
cybersecurity domain for over two decades. An organization must have security controls to
defend against malware infections. Table 3 lists the six sub controls of CSC 8: Malware
Defenses. In this research, an asset is defined as a known and managed network host. A host is
used to denote a system that is not managed or known but resides on a network.

32
Family Control Control Description
System 8.1 Employ automated tools to continuously monitor workstations, servers, and mobile devices with anti-virus, anti-spyware, personal firewalls, and host-based IPS functionality. All malware detection events should be sent to enterprise anti-malware administration tools and event log servers.
System 8.2 Employ anti-malware software that offers a centralized infrastructure that compiles information on file reputations or have administrators manually push updates to all machines. After applying an update, automated systems should verify that each system has received its signature update.
System 8.3 Limit use of external devices to those with an approved, documented business need. Monitor for use and attempted use of external devices. Configure laptops, workstations, and servers so that they will not auto-run content from removable media, like USB tokens (i.e., “thumb drives”), USB hard drives, CDs/DVDs, FireWire devices, external serial advanced technology attachment devices, and mounted network shares. Configure systems so that they automatically conduct an anti-malware scan of removable media when inserted.
System 8.4 Enable anti-exploitation features such as Data Execution Prevention (DEP), Address Space Layout Randomization (ASLR), virtualization/containerization, etc. For increased protection, deploy capabilities such as Enhanced Mitigation Experience Toolkit (EMET) that can be configured to apply these protections to a broader set of applications and executables.
System 8.5 Use network-based anti-malware tools to identify executables in all network traffic and use techniques other than signature-based detection to identify and filter out malicious content before it arrives at the endpoint.
System 8.6 Enable domain name system (DNS) query logging to detect hostname lookup for known malicious C2 domains.
Table 3: Critical Security Control 8 (Center for Internet Security, 2015)
Critical Security Control 8.1 Metric
Critical Security Control 8.1 requires systems to possess an endpoint security tool where
centralized logging occurs. To measure this control, a percentage based metric was created. A
percentage based metric is determined through the division of a numerator and denominator in a
fraction. This metric quantifies the number of assets that are sending logging information to the
centralized logging manager as the numerator. The denominator is the total number of assets on a
network. The division of these two number, over a specified time period, provide a metric to
measure CSC 8.1, as seen in Equation 1. Two measurements make up this metric with a
percentage measurement as the desired outcome of measuring CSC 8.1 and CSC 8.2. This
percentage will denote the percentage of network assets that possess the control description vs
those not in compliance.

33
This metric is an effectiveness measure as it seeks to quantify if a specified policy is
accomplishing what it set out to do. That policy would be a requirement that all organizational
assets possess an anti-malware tool. This metric is designed with a strategic level leader or
executive in mind. This metric presents a high level picture of the saturation of anti-malware tools
that exist on an organizations network. The intended audience for this metric is a strategic level
executive as a resource to monitor overall network saturation of anti-virus/anti-malware tools.
This metric offers a broad stroke in quantifying a part of network security, across an organization.
CSC 8.1 Metric Numerator
The measurement for the numerator is based on the logging from the centralized logging
server that collects all logs for the enterprise host based suite. Automated indexing of these logs
allows for the ability to quickly determine the number of unique hosts that are communicating
with the centralized management and logging server. The number of unique hosts is the
numerator in the measurement of this control.
CSC 8.1 Metric Denominator
The measurement for the denominator is drawn from the number of unique clients that
are operating on the network. Because of this, measurement for the denominator is best drawn
from the physical layer on layer one of the OSI model. An ARP (Address Resolution Protocol)
cache is the ideal location to look for the number of clients communicating on layer one. The
ARP cache is a list that maintains when an IP address is correlated to a physical network address.
For this to be automated, a tool would need to be deployed to monitor the ARP Cache
and record changes. An example of this includes arpwatch which was developed by the Lawrence

34
Berkeley National Laboratory (Leres, n.d.). For this research, an ARP cache was exported to a
text file and then uploaded to Splunk.
𝐴𝐴𝐴𝐴𝐴𝐴𝐴𝐴𝐴𝐴𝐴𝐴 𝑅𝑅𝐴𝐴𝑅𝑅𝑅𝑅𝑅𝑅𝐴𝐴𝑅𝑅𝑅𝑅𝑅𝑅 𝑎𝑎 𝑆𝑆𝑆𝑆𝑎𝑎𝑅𝑅𝑇𝑇𝑅𝑅𝐴𝐴𝑎𝑎𝑇𝑇 # 𝑅𝑅𝑜𝑜 𝑁𝑁𝐴𝐴𝐴𝐴𝑁𝑁𝑅𝑅𝑅𝑅𝑁𝑁 𝐻𝐻𝑅𝑅𝐴𝐴𝐴𝐴𝐴𝐴
∗ 100 = 𝑇𝑇𝑅𝑅𝑅𝑅 𝐿𝐿𝐴𝐴𝐿𝐿𝐴𝐴𝑇𝑇 𝑀𝑀𝐴𝐴𝐴𝐴𝑅𝑅𝑅𝑅𝑆𝑆 𝑃𝑃𝐴𝐴𝑅𝑅𝑆𝑆𝐴𝐴𝑅𝑅𝐴𝐴𝑎𝑎𝑅𝑅𝐴𝐴
Equation 1: Measuring CSC 8.1
Alternative Options for Denominator
There are a number of other potential logging sources that could be used to determine the
number of clients on a network. Logging of DNS would provide the number of hosts that have
contacted the internal DNS server for domain name resolution. The drawback to this approach is
the failure to capture a node that is seeking to traverse straight to an IP address, bypassing DNS
entirely. A similar drawback is present in using DHCP as the data source to the denominator. A
host that manually sets a static IP address will not communicate with DHCP. Another possible
data source includes the extraction of indicators from netflow data. The challenge with netflow is
that not all environments possess the needed proprietary equipment to capture netflow data.
While these logging sources are network based determinants, this does not necessarily
have to be the case. Organizations can choose to use a denominator that is based on their systems
inventory. There are a number of drawbacks to this type of implementation. There is often a
challenge to keep an organizations inventory up to date. Along with being difficult to maintain,
not every asset that is inventoried is an active network asset. Using a retentively static data source
can mislead measurements.

35
Critical Security Control 8.2 Metric
Critical Security Control 8.2 outlines the need for systems to receive anti-virus/anti-
malware updates and an automated way to ensure that a system has received updates. Symantec
Endpoint Protection currently provides the ability to automatically or manually push anti-
malware update, or definitions, to all clients connected to the manager. To measure this control, a
percentage based metric was created to show the number of assets that received the most recent
update divided by the total number of assets on a network over a specified time period. Two
measurements make up this metric, as seen in Equation 2.
This metric is an effectiveness measure as it seeks to measure if a specified policy is
accomplishing what it set out to do. That policy would be a requirement that all organizational
assets receive regular anti-malware updates. This metric is designed with a systems administrator
in mind. This metric presents the ability for an administrator to determine which systems did not
receive an update as it should have. Regular anti-malware updates occurring when an anti-
malware tool is installed is synonymous to most strategic level executives.
CSC 8.2 Metric Numerator
The measurement for the numerator is based on the logging from the centralized logging
server that collects all logs for the enterprise host based suite. Automated indexing of these logs
allows for the ability to quickly determine the number of unique hosts that have reported an
update being received.
𝐴𝐴𝐴𝐴𝐴𝐴𝐴𝐴𝐴𝐴𝐴𝐴 𝑅𝑅𝐴𝐴𝑅𝑅𝑅𝑅𝑅𝑅𝐴𝐴𝑅𝑅𝑅𝑅𝑅𝑅 𝑎𝑎𝑅𝑅 𝑈𝑈𝑅𝑅𝑈𝑈𝑎𝑎𝐴𝐴𝐴𝐴𝑇𝑇𝑅𝑅𝐴𝐴𝑎𝑎𝑇𝑇 # 𝑅𝑅𝑜𝑜 𝑁𝑁𝐴𝐴𝐴𝐴𝑁𝑁𝑅𝑅𝑅𝑅𝑁𝑁 𝐻𝐻𝑅𝑅𝐴𝐴𝐴𝐴𝐴𝐴
∗ 100 = 𝑇𝑇𝑅𝑅𝑅𝑅 𝐿𝐿𝐴𝐴𝐿𝐿𝐴𝐴𝑇𝑇 𝑀𝑀𝐴𝐴𝐴𝐴𝑅𝑅𝑅𝑅𝑆𝑆 𝑃𝑃𝐴𝐴𝑅𝑅𝑆𝑆𝐴𝐴𝑅𝑅𝐴𝐴𝑎𝑎𝑅𝑅𝐴𝐴
Equation 2: Measuring CSC 8.2

36
CSC 8.2 Metric Denominator
CSC 8.2 utilizes the same measurement technique outlined in CSC 8.1 metric
denominator.
Critical Security Control 8.3 Metric
Critical Security Control 8.3 outlines four main controls, as seen in Table 4. The first part
of the control recommends limiting the use of external devices to those that have a documented
business need and then monitoring for rogue external devices, such as removable media. The
second part of the control recommends configuring hosts to prevent auto running of content from
removable media and then conducting an anti-virus/anti-malware scan when such drives are
inserted into a host.
This group of metrics are effectiveness and implementation measures as it seeks to
measure if policies around removable media are implemented and effective in attaining their
desired result. These metrics are designed with a systems administrator in mind. This metric
presents the ability for an administrator to investigate systems that are non-compliant with
organizational policy.
Limiting the use of removable media to those with a documented business need is a
foundational control within CSC 8.3. Windows Active Directory provides the ability to
implement group policy objects, such as denying all USB removable storage access. In any
organization, business need exceptions will be required. These exceptions can be documented in a
database that maintains systems information of systems where the policy has not been
implemented.

37
When a removable storage device is connected to a Windows operating machine, event
codes are generated in the Windows Event Logs. These event ID codes include 2003, 2004, 2005,
2010, 2100, 2105 (Hale, 2014). Monitoring these logs allows for an organization to determine
who is attempting to use removable storage devices. A list of systems where a removable storage
Event ID was found can be compared to the database of systems with a documented business
need. This strategy can be messy, but provides a starting spot if no other tools are available. Most
anti-virus vendors provide the ability to monitor for removable storage devices in their endpoint
tool suite.
Another feature present in some endpoint tools, such as Symantec Endpoint Protection,
includes the ability to monitor the registry. Systems can be prevented from auto running content
by changing a registry value of NoDriveAutoRun to 0x00000005 in HKEY_LOCAL_MACHINE
\Software\Microsoft\Windows\CurrentVersion\Policies\Explorer\ (“Enabling and Disabling
AutoRun,” n.d.). An endpoint tool suite could then monitor this registry value for any changes.
The final recommendation in CSC 8.3 is to configure systems to automatically conduct
an anti-virus/anti-malware scan upon insertion of a removable storage device. Several endpoint
tools provide this functionality. These scan logs can be correlated to a systems event logs,
providing the ability to measure the effectiveness of conducting an anti-virus/anti-malware scan
when a USB removable storage device is inserted. Another source of correlation is the business
use case database. This correlation could highlight systems that are conducting scans that do not
have a business use case for removable media.

38
Control Measurement Limit use of external devices to those with an approved, documented business need.
Database of documented business needs
Monitor for use and attempted use of external devices. Windows Event Codes Configure laptops, workstations, and servers so that they will not auto-run content from removable media
Anti Virus tools and registry editing can prevent auto-run. They can also monitor the registry for the disabled auto-run key.
Configure systems so that they automatically conduct an anti-malware scan of removable media when inserted.
Anti Virus scan logs compared to the Windows Event logs
Table 4: CSC 8.3 Measurements
Critical Security Control 8.4 Metric
Critical Security Control 8.4 recommends the enabling of anti-exploitation systems level
security features such as Data Execution Prevention (DEP), Address Space Layout
Randomization (ASLR) or virtualization/containerization. There are a number of automated ways
to determine if these security features are enabled on a system. Windows Management
Instrumentation (WMI) allows for the ability to run tasks on remote hosts. The WMI object,
DataExecutionPrevention_SupportPolicy, can be executed on a machine to determine if DEP is
enabled. The result will be a value from zero to three as referenced in Table 5. The total number
of responses for each code returned is the CSC 8.4 Top Level Metric, as seen in Equation 3.
Response Code
Policy Level Description
2 OptIn (default configuration) Only Windows system components and services have DEP applied
3 OptOut DEP is enabled for all processes. Administrators can manually create a list of specific applications which do not have DEP applied
1 AlwaysOn DEP is enabled for all processes 0 AlwaysOff DEP is not enabled for any processes
Table 5: DataExecutionPrevention_SupportPolicy Response Codes (“How to determine that hardware DEP is available and configured on your computer,” n.d.)

39
𝐶𝐶𝑆𝑆𝐶𝐶 8.3 𝑇𝑇𝑅𝑅𝑅𝑅 𝐿𝐿𝐴𝐴𝐿𝐿𝐴𝐴𝑇𝑇 𝑀𝑀𝐴𝐴𝐴𝐴𝑅𝑅𝑅𝑅𝑆𝑆 = �𝑆𝑆𝑆𝑆𝐴𝐴𝐴𝐴𝐴𝐴𝑆𝑆 𝑁𝑁𝑅𝑅𝐴𝐴ℎ 𝐷𝐷𝐷𝐷𝑃𝑃𝑅𝑅𝑅𝑅𝐴𝐴 𝐴𝐴𝑅𝑅𝑎𝑎𝑒𝑒𝑇𝑇𝐴𝐴𝑈𝑈
𝑛𝑛
𝑘𝑘=0
Equation 3: Measuring CSC 8.4
This metric is an implementation measure as it seeks to measure if a policy requiring
DEP to be enable has been implemented on each system in an organization. This metrics is
designed for a manager or project lead to determine if the success of implementation of a
particular security feature.
Critical Security Control 8.5 Metric
Critical Security Control 8.5 recommends the use of network based tools to identify
executables in traffic. Traditional signature based detection and anomaly behavioral detection are
the two most common network tool detection types. This focus of this control and metric is
towards ensuring the presence of these tools on a network, rather than their accuracy. This focus
makes an uptime metric ideal, as seen in Equation 4. An uptime metric measures the percentage
of time that these tools were operating and actively carrying out their intended purpose.
Snort and Laika BOSS™ are two network based tools that use signature based detection.
Snort is a network based intrusion detection and prevention system (Roesch, 1999). Laika
BOSS™ is a “file-centric intrusion detection system and malware analysis platform,” developed
by the Lockheed Martin Computer Incident Response Team who also released the seminal
whitepaper known as the Cyber Kill Chain (Arnao, Smutz, Zollman, Richardson, & Hutchins,
2015) (Hutchins, Cloppert, & Amin, 2011). Bro is an intrusion detection system with anomaly
detection capabilities (Sommer, 2003).

40
A systems administrator who is monitoring a network’s security tool health would be the
ideal candidate for this effectiveness measure. This measure provides the ability to monitor
network tool health and functionality over a period of time.
𝑆𝑆𝐴𝐴𝑅𝑅𝐴𝐴𝑅𝑅𝑅𝑅 𝑢𝑢𝑅𝑅𝐴𝐴𝑅𝑅𝑆𝑆𝐴𝐴𝑇𝑇𝑅𝑅𝐴𝐴𝑎𝑎𝑇𝑇 𝐴𝐴𝑅𝑅𝑆𝑆𝐴𝐴
∗ 100 = 𝑇𝑇𝑅𝑅𝑅𝑅 𝐿𝐿𝐴𝐴𝐿𝐿𝐴𝐴𝑇𝑇 𝑀𝑀𝐴𝐴𝐴𝐴𝑅𝑅𝑅𝑅𝑆𝑆 𝑃𝑃𝐴𝐴𝑅𝑅𝑆𝑆𝐴𝐴𝑅𝑅𝐴𝐴𝑎𝑎𝑅𝑅𝐴𝐴
Equation 4: Measuring CSC 8.5
Critical Security Control 8.6 Metric
Critical Security Control 8.6 recommends logging all domain name system (DNS)
queries to detect known malicious C2 domains. For a device to connect to the Internet, it needs a
DNS host to convert top level domains into IP addresses. This lookup process can be logged,
allowing for monitoring and measurement. In mature environments, DNS firewalls provide the
ability to detect and mitigate against known malicious domains. In less mature environments that
lack DNS mitigation capability, logging DNS queries allows for the ability to retroactively
respond to visiting of known malicious C2 domains.
Regardless of the maturity of an organizations DNS capabilities, meaningful
measurements can be developed and implemented. To measure this control, traffic to known
malicious domains is divided by total traffic, as seen in Equation 5. This effectiveness
measurement yields a percent that can be tracked over time. This measurement allows for
strategic decision makers to be informed in security resource allocation and security control
purchasing.
𝑀𝑀𝑎𝑎𝑇𝑇𝑅𝑅𝑆𝑆𝑅𝑅𝑅𝑅𝑢𝑢𝐴𝐴 𝐶𝐶2 𝑇𝑇𝑅𝑅𝑎𝑎𝑜𝑜𝑜𝑜𝑅𝑅𝑆𝑆𝑇𝑇𝑅𝑅𝐴𝐴𝑎𝑎𝑇𝑇 𝑇𝑇𝑅𝑅𝑎𝑎𝑜𝑜𝑜𝑜𝑅𝑅𝑆𝑆
∗ 100 = 𝑇𝑇𝑅𝑅𝑅𝑅 𝐿𝐿𝐴𝐴𝐿𝐿𝐴𝐴𝑇𝑇 𝑀𝑀𝐴𝐴𝐴𝐴𝑅𝑅𝑅𝑅𝑆𝑆 𝑃𝑃𝐴𝐴𝑅𝑅𝑆𝑆𝐴𝐴𝑅𝑅𝐴𝐴𝑎𝑎𝑅𝑅𝐴𝐴
Equation 5: Measuring CSC 8.

41
Metric Implementation
The following section discusses the results of implementing CSC 8.1 and 8.2 in the
simulated network setup and the benefits that are present in the current implementation. A
simulated and scaled computer network was developed to provide a proof of concept for two of
the metrics that this research developed. Along with being a proof of concept, implementing these
measurements allows for the creation of detailed guidelines on how to implement measurement in
an organization.
This network and its associated tools were used for data creation. The data was created,
and fused together to create metrics. This scaled environment was designed to reflect current
industry trends in network defense best practices, including cutting edge tools. This scaled
environment was intended to be reflective of a small business with approximately a dozen
employees. While the size of the network is scaled, the design of the metrics allow for scaling up
to a global enterprise network of hundreds of thousands of network assets.
Implementation of CSC 8.1 and 8.2 were scope for this research, while CSC 8.3-8.6 are
out of scope because of the limitation to the network infrastructure and accompanying capabilities
as the system currently exists.
For this scale world environment, a fictitious company was used to simulate the network
naming structure and provide a sense of legitimacy. ABC Company is a small paper sales
company with 12 employees in different departments. Each of these employees received a
workstation and individual network account on the domain “ABC.local” to accomplish their
duties. Table 6 references the employees below.

42
Name Network Logon Computer Name Company division
James Halpert james.halpert Workstation 1 Sales Pam Beesly pam.beesly Workstation 2 Administrative Dwight Schrute dwight.schrute Workstation 3 Sales Michael Scott michael.scott Workstation 4 Management Stanley Hudson stanley.hudson Workstation 5 Sales Andy Bernard andy.bernard Workstation 6 Sales Phyliss Vance phyliss.vance Workstation 7 Sales Creed Braton creed.bratton Workstation 8 Quality Control Meredith Palmer meredith.palmer Workstation 9 Supplier Relations Kevin Malone kevin.malone Workstation 10 Accounting Toby Flenderson toby.flenderson Workstation 11 Human Resources Darryl Philbin darryl.philbin Workstation 12 Distribution
Table 6: ABC.local Workstations
The scaled world was hosted on a Dell PowerEdge R900 using virtualization. The R900
ran Windows Server 2012 and Microsoft Hyper-V. Hyper-V operated a virtual network switch
and managed all virtualization for the environment. A total of 12 workstations that ran Windows
10 were deployed in Hyper V and acted as employee workstations. Two servers running
Windows Server 2012 were also deployed. The first server acted as the domain controller and the
second as an anti-virus enterprise manager.
Symantec Endpoint Protection is an endpoint security suite of tools developed by
Symantec. Symantec Endpoint Protection currently provides a suite of anti-virus, anti-spyware,
personal firewalls, and host‐based IPS functionality to workstations, servers, and mobile devices,
along with other cutting edge endpoint technologies as referenced in Figure 5 (Symantec, 2017).
According to Gartner’s 2017 Endpoint Protection Platform review, Symantec Endpoint Protection
possesses the largest market share and revenue of any endpoint protection vendor (Gartner,
Ouellet, McShane, & Litan, 2017).

43
Figure 5: Symantec Endpoint Protection Features (Symantec, 2017)
Each of the 12 deployed employee workstation on “ABC.local” ran Windows 10
Education and had Symantec Endpoint Protection client installed. Symantec Endpoint Protection
would run daily antivirus scans and log the findings. The log files for each workstation would be
sent to the local client manager known as Symantec Endpoint Protection Manager that was hosted
on the second server on the network.
The first server, known as server1 and as seen in Table 7, acted as the domain controller
and managed Active Directory. The second server, known as server2, housed Symantec Endpoint
Protection Manager. Each of the servers have an instance of Splunk Universal Forwarder
installed. This forwarder monitored log dump locations and uploaded logs into Splunk Cloud.
Server Name Server OS Server Role
server1 Windows Server 2012 Domain Controller, Active Directory
server2 Windows Server 2012 Symantec Endpoint Protection Manager
Table 7: ABC.local Servers
Splunk acted a log aggregator and SEIM for this network. Splunk is a software tool for
managing machine event logs and indexing them for easy access to searching and manipulation
for visualizations. Once logs were created on the local servers, SplunkCloud would receive the

44
log files from the Universal Forwarder. Once the log files were received, Splunk would index the
log for easy searching and manipulation. Within Splunk, Symantec log files had field extraction
applied manually because of a bug within the Splunk-Symantec Log add on. An ARP Cache from
the network was imported into a log file and uploaded to the Splunk manually.
Symantec Endpoint Protection Manager allows for the customization of policies for
assets that the Manager oversees. A standard policy was implemented to ensure that every
managed asset would automatically run an anti-virus/anti-malware scan every 24 hours. This
typically occurred in the early morning each day. This policy seeks to accomplish what Critical
Security Control 8.1 outlines.
Another implemented policy required assets to check for system definitions or updates
from the Manager or the external Symantec LiveUpdate server. This action is a routine process
and allows the client to be up to date with the most recent malware detections that the vendor has
encountered. This policy seeks to accomplish what Critical Security Control 8.2 outlines.
The actions related to both of these policies were logged on each of the clients and sent to
the centralized Manager. Each client would forward their logs to the Manager. The Manager was
configured to continually dump all logs to a local file directory. This local file directory was
monitored for any new file dumps by the Splunk Universal Forwarder. When this local directory
had a change, the Universal Forwarder would upload the log entries to an instance of Splunk
Cloud. Splunk Cloud provides for drill down ability to examine the data that is underlying the
metric. This allows a systems administrator to investigate network assets that do not possess any
anti-malware tools.

45
Implementing Critical Security Control 8.1
To implement Critical Security Control 8.1 two data sources were needed. The first was
SEPM which provided the log data for the anti-virus/anti-malware scan activity. The second data
source was a created by a manual process of exporting the local network’s ARP cache to a text
file and then uploading it to Splunk Cloud where it could be indexed.
Numerator Measurement of Anti-Virus/Anti-Malware Scan Logs
Every scan that was conducted by the client software was logged. These logs provided a
number of valuable fields that could be measured. The fields primarily used for identification and
correlation were the user fields, the IP Address, and the computer name. A sample log depicting a
completed anti-virus/anti-malware scan is seen in Figure 6.
Figure 6: A Sample Symantec Endpoint Protection Client Log Entry
Manual field extraction occurred on the log agt_scan.tmp. Typically vendors or Splunk
provide an add on to Splunk that automatically handles field extraction. This is typically the case
for Symantec Endpoint Protection but a bug within Splunk Cloud currently exists preventing the
add on from being installed. Table 8 lists each indexed field and the correlating identifier in the
raw log.
Indexed Field Name Raw Log Field
computer_name Computer
description (event message not titled in raw log)
2018-02-20 16:36:04,Scan ID: 1518991661,Begin: 2018-02-20 15:20:54,End: 2018-02-20 16:31:54,Completed,Duration
(seconds): 4260,User1: james.halpert,User2: james.halpert,'Scan started on all drives and all extensions.','Scan Complete: Risks: 0
Scanned: 166225 Files/Folders/Drives Omitted: 0 Trusted Files Skipped: 41377',Command: Not a command scan (),Threats:
0,Infected: 0,Total files: 166225,Omitted: 0,Computer: Computer1,IP Address: 192.168.1.11,Domain: Default,Group: My
Company\Default Group,Server: Server2

46
src_ip IP Address
status (event status not titled in raw log)
scan_id Scan ID
user1 User1
user2 User2
Table 8: Field Extractions for Symantec Endpoint Protection Client Scan Logs
Once these logs were ingested and indexed, searching and dashboard development was
able to take place. A table was built to easily showcase the information relevant for situation
awareness. The default timeframe chosen was 7 days with deduplication. This was chosen
because of the high fidelity results for this implementation. Ideally, a timeframe closer to 24
hours is ideal. Attempts to reduce the timeframe highlighted bugs in the logging or failed activity
that should have occurred, as described later. The following query in Figure 7 was built in
Splunk to produce the results shown in Table 9.
index=arp type=dynamic | table src_ip, MAC_addr | join src_ip [search index=sepm
source="C:\\Program Files (x86)\\Symantec\\Symantec Endpoint Protection
Manager\\data\\dump\\agt_scan.tmp" AND status="Completed" | dedup src_ip | table src_ip, status,
scan_id, user2,computer_name] | sort src_ip | rename user2 AS "User", computer_name AS "Computer
Name", scan_id AS "Scan ID", src_ip AS "Source IP", status as "Status" Figure 7: Splunk Query to Produce Table 9
Source IP Scan ID Status User Computer Name
192.168.1.11 1518991657 Completed james.halpert Computer1
192.168.1.12 1518924041 Completed pam.beesly Computer2
192.168.1.13 1518918507 Completed dwight.schrute Computer3
192.168.1.14 1518915930 Completed michael.scott Computer4
192.168.1.15 1519017388 Completed stanley.hudson Computer5
192.168.1.16 1519046028 Completed andy.bernard Computer6
192.168.1.17 1518907704 Completed phyllis.vance Computer7
192.168.1.18 1519046205 Completed creed.bratton Computer8
192.168.1.19 1518818787 Completed meredith.palmer Computer9
192.168.1.20 1518923753 Completed kevin.malone Computer10 Table 9: Numerator Table for CSC 8.1

47
After development of Table 9, a total count of hosts reporting a scan could be totaled.
This total would be the integer for the numerator of CSC 8.1 metric. Figure 8 lists the query in
Splunk to determine the total count.
(index=sepm source="C:\\Program Files (x86)\\Symantec\\Symantec Endpoint Protection Manager\\data\\dump\\agt_scan.tmp") OR (index=main) | dedup src_ip| stats dc(src_ip) | rename dc(src_ip) AS "Total number of hosts with a completed scan"
Figure 8: Splunk Query to Determine Numerator Total
Denominator Measurement of ARP Cache
An ARP Cache is a “collection of ARP entries (mostly dynamic) that are created when a
hostname is resolved to an IP address and then an IP address is resolved to a MAC address
(Wallen, 2011).” Arpwatch is an automated open source tool developed by Craig Leres, of the
Lawrence Berkeley National Laboratory Network Research Group, which keeps track of the ARP
Cache by monitoring a .pcap for ARP calls (Leres, n.d.).
Figure 9: Retrieving the ARP Cache
For this implementation, a manual process was used for simplicity. An ARP cache was
exported to a text file using the command seen in
Figure 9. Dynamic type entries in the text file can be seen in Table 10.
IP Address MAC Address Type 192.168.1.1 00-06-25-78-e3-fd dynamic 192.168.1.6 00-15-5d-ef-cd-0d dynamic 192.168.1.7 00-15-5d-ef-cd-0e dynamic 192.168.1.11 00-15-5d-ef-cd-02 dynamic 192.168.1.12 00-15-5d-ef-cd-03 dynamic 192.168.1.13 00-15-5d-ef-cd-04 dynamic 192.168.1.14 00-15-5d-ef-cd-05 dynamic 192.168.1.15 00-15-5d-ef-cd-08 dynamic 192.168.1.16 00-15-5d-ef-cd-07 dynamic 192.168.1.17 00-15-5d-ef-cd-09 dynamic
C:\Users\Administrator> arp –a > ARP_output.txt

48
192.168.1.18 00-15-5d-ef-cd-0a dynamic 192.168.1.19 00-15-5d-ef-cd-0b dynamic 192.168.1.20 00-15-5d-ef-cd-0c dynamic 192.168.1.70 5c-f9-dd-6e-31-0f dynamic
Table 10: ARP Cache from Local Network
Once this text file was uploaded into Splunk Cloud, manual field extraction occurred.
Each entry contains three fields that were indexed as seen in Table 11.
ARP Cache Raw Log Field Indexed Field
Internet Address src_ip
Physical Address MAC_addr
Type type
Table 11: Field Extractions for ARP Cache
Once the ARP cache log was indexed, the integer for the denominator could be
determined. The denominator is the total number of dynamic network src_ip’s in the ARP Cache.
The “dc” function is a distinct or unique count on all the source IPs, as seen in Figure 10.
index=arp type=dynamic | stats dc(src_ip) | rename dc(src_ip) AS "Total Number of Network Assets" Figure 10: Splunk Query to Determine Denominator Total
CSC 8.1 Metric Result
Once the integers of the numerator and denominator had been determined, the percentage
of clients on the network that conducted an antivirus scan could be measured, as seen in Figure
11. The numerator data provided the total number of hosts having conducted an anti-virus/anti-
malware scan. The denominator provided us with a total number of assets on the network. The
division of these two integers provides the percentage, or the top level metric to measure Critical
Security Control 8.1, as seen in Equation 6.

49
index=arp type=dynamic | stats dc(src_ip) AS total_denominator | table total_denominator | table total_numerator, total_denominator | join src_ip [search (index=sepm source="C:\\Program Files (x86)\\Symantec\\Symantec Endpoint Protection Manager\\data\\dump\\agt_scan.tmp") OR (index=main) | dedup src_ip | stats dc(src_ip) AS total_numerator | table total_numerator] | eval metric_percentage=total_numerator / total_denominator | eval metric_percentage =round(metric_percentage*100) | table metric_percentage | rename metric_percentage AS "8.1 Metric"
Figure 11: Splunk Query to Determine Top Level Measurement
𝐻𝐻𝑅𝑅𝐴𝐴𝐴𝐴𝐴𝐴 𝑅𝑅𝐴𝐴𝑅𝑅𝑅𝑅𝑅𝑅𝐴𝐴𝑅𝑅𝑅𝑅𝑅𝑅 𝑎𝑎𝑅𝑅 𝑈𝑈𝑅𝑅𝑈𝑈𝑎𝑎𝐴𝐴𝐴𝐴𝑇𝑇𝑅𝑅𝐴𝐴𝑎𝑎𝑇𝑇 # 𝑅𝑅𝑜𝑜 𝑁𝑁𝐴𝐴𝐴𝐴𝑁𝑁𝑅𝑅𝑅𝑅𝑁𝑁 𝐴𝐴𝐴𝐴𝐴𝐴𝐴𝐴𝐴𝐴𝐴𝐴
∗ 100 = 𝑇𝑇𝑅𝑅𝑅𝑅 𝐿𝐿𝐴𝐴𝐿𝐿𝐴𝐴𝑇𝑇 𝑀𝑀𝐴𝐴𝐴𝐴𝑅𝑅𝑅𝑅𝑆𝑆 𝑃𝑃𝐴𝐴𝑅𝑅𝑆𝑆𝐴𝐴𝑅𝑅𝐴𝐴𝑎𝑎𝑅𝑅𝐴𝐴
1114
∗ 100 = 79%
Equation 6: Metric Result from Implementation of CSC 8.1
Splunk Dashboard
One of the benefits of Splunk is the ability to create customizable dashboards. In this
instance, a dashboard provided quick access to the data and the accompanying measurements, as
seen in Figure 12. Each panel in the dashboard provides that ability to drill down into the data
that makes up the panel, which features a time picker for queries. This functionality provides the
ability to change the time on each of the panels. The dashboard features three panels across the
top with the numerator metric, the denominator metric, and the top level percentage
measurement. Below that table is a fused table of the metric numerator and denominator data.
Below that table are the individual tables of each metric’s numerator or denominator’s data.
These tables are not fused. The Appendix features source code for each dashboard.

50
Figure 12: CSC 8.1 Splunk Dashboard
Fused Data Table
One challenge in data fusion is correlating unrelated data sources. In cybersecurity, this
correlation often happens on the IP address or MAC Address of an asset. These identifiers are
commonly found in logs, making them ideal correlation fields. MAC Address offers better
correlation reliability because of its static nature. IP Addresses frequently change if an
organization is utilizing DHCP. Nevertheless, IP address correlation can exist if the timestamps
of the log events are relative in their proximity. For this dashboard, the fused data table, shown in
Table 12, is correlated based on IP address in Figure 13. Because the MAC Address is present in
the ARP table, data fusion techniques provide the ability to include that information with the SEP
log data. The result is a data table that includes data from two sources correlated on a unified
identifier.

51
index=arp type=dynamic | table src_ip, MAC_addr | join src_ip [search index=sepm source="C:\\Program Files (x86)\\Symantec\\Symantec Endpoint Protection Manager\\data\\dump\\agt_scan.tmp" AND status="Completed" | dedup src_ip | table src_ip, status, scan_id, user2,computer_name] | sort src_ip | rename user2 AS "User", computer_name AS "Computer Name", scan_id AS "Scan ID", src_ip AS "Source IP", status AS "Status"
Figure 13: CSC 8.1 Data Correlation Query
Source IP MAC Address Scan ID Status User Computer Name
192.168.1.11 00-15-5d-ef-cd-02 1518991657 Completed james.halpert Computer1
192.168.1.12 00-15-5d-ef-cd-03 1518924041 Completed pam.beesly Computer2
192.168.1.13 00-15-5d-ef-cd-04 1518918507 Completed dwight.schrute Computer3
192.168.1.14 00-15-5d-ef-cd-05 1518915930 Completed michael.scott Computer4
192.168.1.15 00-15-5d-ef-cd-08 1519017388 Completed stanley.hudson Computer5
192.168.1.16 00-15-5d-ef-cd-07 1519046028 Completed andy.bernard Computer6
192.168.1.17 00-15-5d-ef-cd-09 1518907704 Completed phyllis.vance Computer7
192.168.1.18 00-15-5d-ef-cd-0a 1519046205 Completed creed.bratton Computer8
192.168.1.19 00-15-5d-ef-cd-0b 1518818787 Completed meredith.palmer Computer9
192.168.1.20 00-15-5d-ef-cd-0c 1518923753 Completed kevin.malone Computer10
Table 12: CSC 8.1 Fused Data Table
Dashboard Value to Stakeholder
As discussed, this dashboard is built to offer a high level overview of anti-virus/anti-
malware policy effectiveness. The primary banner in the dashboard covers the integers that make
up the numerator and the denominator, while providing the top level percentage measurement.
This would provide an executive or a manager the ability to quickly monitor the continued
effectiveness of a policy. Having this knowledge, a strategic decision maker is better informed to
make risk decisions. These decisions shape the technologies and resources invested into
information security. While this dashboard intended for at a strategic decision maker, it is not
without value to a systems administrator. A fused data table is also present in a panel. This

52
provides a systems administrator greater situation awareness into his or her assets because a MAC
address is not present in anti-virus/anti-malware logs.
Implementing Critical Security Control 8.2
To implement Critical Security Control 8.2 two primary data sources were needed,
identical to Critical Security Control 8.1. The first was SEPM which provided the log data for the
anti-virus/anti-malware update activity. The second data source was the local network’s ARP
cache.
Numerator Measurement of Anti-Virus/Anti-Malware Update Logs
When the client software looks for a malware definitions update, that activity is logged.
These logs provided a number of valuable fields that could be measured. The computer name was
the primary field used for identification and correlation. A sample log depicting a completed
anti-virus/anti-malware update is seen in Figure 14.
Figure 14: A Sample Symantec Endpoint Protection Client Update Log Entry
Manual field extraction occurred on the log agt_system.tmp. Table 13 lists each indexed
field and the correlating identifier in the raw log.
Indexed Field Name Raw Log Field
computer_name (event host name not titled in log)
description (log message not titled in raw log)
category Category
Table 13: Field Extractions for Symantec Endpoint Protection Client Update Logs
2018-02-20 21:59:13,Info,Computer1,Category: 2,LiveUpdate Manager,An update for Virus and Spyware Definitions SDS Win32
(Reduced) was successfully installed. The new sequence number is 180220009.

53
Once these logs were ingested and indexed, searching and dashboard development was
able to take place. A table was built to easily showcase the information relevant for situation
awareness. The following query in Figure 15 was built in Splunk to produce the results shown in
Table 14. Table 14 is only a portion of the table, the remainder of the table is very similar for the
other hosts.
index=sepm source="C:\\Program Files (x86)\\Symantec\\Symantec Endpoint Protection Manager\\data\\dump\\agt_system.tmp" | table computer_name, description | stats values(description) AS Updates BY computer_name | sort computer_name
Figure 15: Splunk Query to Produce
Computer Name Updates
Computer1 "Symantec Endpoint Protection Manager is available to provide updates, so the scheduled LiveUpdate was skipped A LiveUpdate session ran successfully An update for Intrusion Prevention Signatures was An update for Revocation Data from LiveUpdate An update for Revocation Data was successfully An update for SONAR Definitions was successfully An update for Virus and Spyware Definitions Downloaded new content update from the management server successfully.
Computer10 "Symantec Endpoint Protection Manager is available to provide updates, so the scheduled LiveUpdate was skipped A LiveUpdate session ran successfully An update for Intrusion Prevention Signatures was An update for Revocation Data from LiveUpdate An update for Revocation Data was successfully An update for SONAR Definitions from LiveUpdate An update for SONAR Definitions was successfully An update for Virus and Spyware Definitions Downloaded new content update from the management server successfully.
Table 14: Numerator Table for CSC 8.2
After development of Table 14, a total count of hosts reporting a scan could be totaled.
This total would be the integer for the numerator of CSC 8.1 metric. Figure 16 lists the query in
Splunk to determine the total count.
(index=sepm source="C:\\Program Files (x86)\\Symantec\\Symantec Endpoint Protection Manager\\data\\dump\\agt_scan.tmp") OR (index=main) | dedup src_ip| stats dc(src_ip) | rename dc(src_ip) AS "Total number of hosts with a completed scan"
Figure 16: Splunk Query to Determine Numerator Total

54
Denominator Measurement of ARP Cache
The measurement for the denominator of CSC 8.2 is identical to that of CSC 8.1
denominator.
CSC 8.2 Metric Result
Similarly to the CSC 8.1 metric, the percentage of clients on the network that conducted
an antivirus definition update could be measured, as seen in Figure 17. The numerator data
provided us with a total number of hosts having conducted an anti-virus/anti-malware definitions
update. The denominator provided us with a total number of assets on the network. The division
of these two integers provides the percentage, or the top level metric to measure Critical Security
Control 8.2, as seen in Equation 7.
index=sepm source="C:\\Program Files (x86)\\Symantec\\Symantec Endpoint Protection Manager\\data\\dump\\agt_system.tmp" | stats dc(computer_name) AS total_numerator | appendcols [search index=arp type=dynamic | stats dc(src_ip) AS total_denominator] | eval metric_percentage=total_numerator / total_denominator | eval metric_percentage =round(metric_percentage*100) | table metric_percentage | rename metric_percentage AS "8.2 Metric"
Figure 17: Splunk Query to Determine Top Level Measurement
𝑁𝑁𝑢𝑢𝑆𝑆𝐴𝐴𝑅𝑅𝑎𝑎𝐴𝐴𝑅𝑅𝑅𝑅 𝐼𝐼𝑅𝑅𝐴𝐴𝐴𝐴𝑅𝑅𝐴𝐴𝑅𝑅𝐷𝐷𝐴𝐴𝑅𝑅𝑅𝑅𝑆𝑆𝑅𝑅𝑅𝑅𝑎𝑎𝐴𝐴𝑅𝑅𝑅𝑅 𝐼𝐼𝑅𝑅𝐴𝐴𝐴𝐴𝑅𝑅𝐴𝐴𝑅𝑅
∗ 100 = 𝑇𝑇𝑅𝑅𝑅𝑅 𝐿𝐿𝐴𝐴𝐿𝐿𝐴𝐴𝑇𝑇 𝑀𝑀𝐴𝐴𝐴𝐴𝑅𝑅𝑅𝑅𝑆𝑆 𝑃𝑃𝐴𝐴𝑅𝑅𝑆𝑆𝐴𝐴𝑅𝑅𝐴𝐴𝑎𝑎𝑅𝑅𝐴𝐴
1114
∗ 100 = 79%
Equation 7: Metric Result from Implementation of CSC 8.2
Splunk Dashboard
As done with CSC 8.1, a Splunk dashboard was created that shared many of the same
features including a time picker and metric banners. The metric banner features three panels

55
across the top of the numerator metric, the denominator metric, and the top level percentage
measurement shown in Figure 18. Unique to this dashboard is another banner below these three;
this additional banner presents the top level metric differently. Instead of a percentage, it displays
the actual number of machines not reporting an update to the Manager. This provides a systems
administrator increased situational awareness to the tasks relevant to his or her job. Below that
table is a fused table of the metric numerator and denominator data. Below that table are the
individual tables of each metric that have not been fused. Images and source code are found in
Appendix A.
Figure 18: CSC 8.2 Splunk Dashboard
Fused Data Table
As discussed, data fusion correlation can be a difficult challenge when logs do not share a
unique identifier. This is the case in the implementation of CSC 8.2. The SEPM update logs

56
provide a computer name and the update that occurred. The ARP table features IP and MAC
addresses identifiers. To accomplish level one JDL data correlation, another log source is needed.
While the SEPM update logs do not identify an IP Address or MAC Address, they do provide a
computer name. The SEPM scan logs also provide the computer name of a host, along with the IP
address and MAC address. These logs provide the ability to correlate the computer name to IP
address and MAC address. Once that correlation occurs, it can be integrated into the SEPM
update logs, providing greater situation awareness. Figure 19 lists the query that accomplishes
this data correlation by using two sub searches within the outer search. Table 15 shows a partial
result of from the query described. The remainder of the table is highly similar.
index=sepm source="C:\\Program Files (x86)\\Symantec\\Symantec Endpoint Protection Manager\\data\\dump\\agt_system.tmp" | table computer_name, description | stats values(description) AS Updates by computer_name | join computer_name [search index=sepm source="C:\\Program Files (x86)\\Symantec\\Symantec Endpoint Protection Manager\\data\\dump\\agt_scan.tmp"| dedup src_ip | table src_ip, computer_name] | join src_ip [search index=arp type=dynamic | table src_ip, MAC_addr] | table computer_name, src_ip, MAC_addr, Updates | sort src_ip | rename computer_name AS "Computer Name", src_ip AS "Source IP", MAC_addr AS "MAC Address"
Figure 19: CSC 8.2 Data Correlation Query
Computer Name Source IP MAC Address Updates
Computer1 192.168.1.11 00-15-5d-ef-cd-02 "Symantec Endpoint Protection Manager is available to provide updates, so the scheduled LiveUpdate was skipped A LiveUpdate session ran successfully An update for Intrusion Prevention Signatures was An update for Revocation Data from LiveUpdate An update for Revocation Data was successfully An update for SONAR Definitions was successfully An update for Virus and Spyware Definitions Downloaded new content update from the management server successfully.
Computer10 192.168.1.12 00-15-5d-ef-cd-03 "Symantec Endpoint Protection Manager is available to provide updates, so the scheduled LiveUpdate was skipped A LiveUpdate session ran successfully An update for Intrusion Prevention Signatures was An update for Revocation Data from LiveUpdate An update for Revocation Data was successfully An update for SONAR Definitions from LiveUpdate An update for SONAR Definitions was successfully An update for Virus and Spyware Definitions Downloaded new content update from the management server successfully.
Table 15: CSC 8.2 Fused Data Table

57
Dashboard Value to Stakeholder
While the dashboard for CSC 8.1 was built for a strategic decision maker, the dashboard
for CSC 8.2 was built for a systems administrator. As mentioned, the blue banner features
contextualized, actionable information to a systems administrator, rather than simply a
percentage. A simple query could be developed to determine the MAC addresses that are not
present in the fused data table (i.e. not reporting an update to SEPM). This would allow a systems
administrator to know which machines need troubleshooting. The next section will cover two
scenarios where actionable information is presented to a systems administrator.
Metric Use Case Examples
Authorized & Unauthorized Machines
The fused data table can easily be modified to present log entries that did not find a
match between the anti-virus update logs and the ARP cache log. This would indicate an asset
that is not compliant with the organizational policy of receiving daily anti-virus updates. This
query, shown in Figure 20, produces a table, shown in Table 16, that highlights four
noncompliant network assets. With this information, a systems administrator would now have a
list of assets for investigation. This investigation, which would identify that of the four
noncompliant devices, one is a router that needs to be whitelisted, two are authorized servers that
are noncompliant with the anti-virus update policy, and one is a rogue unauthorized network
device. This metric implementation provided actionable information to a systems administrator
looking to secure the network.

58
index=arp type=dynamic | table src_ip, MAC_addr | join type=outer src_ip [search index=sepm source="C:\\Program Files (x86)\\Symantec\\Symantec Endpoint Protection Manager\\data\\dump\\agt_scan.tmp" AND status="Completed" | dedup src_ip] | sort src_ip | where isnull(computer_name) | table src_ip, MAC_addr | rename src_ip AS "Source IP", MAC_addr AS "MAC Address"
Figure 20: Noncompliant Network Assets Query
Source IP MAC Address 192.168.1.1 00-06-25-78-e3-fd 192.168.1.6 00-15-5d-ef-cd-0d 192.168.1.7 00-15-5d-ef-cd-0e 192.168.1.70 5c-f9-dd-6e-31-0f
Table 16: Noncompliant Network Assets
Network Outage
When an organization is able to measure its defenses, the ability to spot major anomalies
or outages can occur. Splunk provides the ability to do real-time indexing and searching. This
provides the ability to monitor for network or application outages. An example of the dashboard
in an outage can be seen in Figure 21.
Figure 21: Splunk Dashboard during a Network Outage

59
Discussion and Conclusion
The following chapter will review the research question and the methodology around
creating metrics. Then this chapter will discuss the value derived from the implementation of
these metrics in the ABC.local network. Upon reviewing this, this research’s contribution and
limitations and future work will be discussed.
Discussion
This research sought to advance the literature on how to measure Critical Security
Controls. A host of reasons make this a difficult challenge and one that has not been well studied.
This research presented six metrics to measure each of the sub controls in Critical Security
Control 8: Malware Defenses. Each of these metrics offered quantitative measurements to
validate and track compliance with the best practices outlined in the CSCs. Each of these metrics
were described in detail around the potential data sources needed to effectively measure the
control.
There is a current need in the cybersecurity industry and research space for quantitative
measurements of our security taxonomies. While this research does not seek to define why the
Critical Security Controls should be the standard, it none the less uses it a basis to build
measurement into the output of the taxonomy. The hope is that a standard measurement
taxonomy grows out of this work. A standard measurement taxonomy would allow industry and
researchers to work to integrate measurement into our collective understanding of cybersecurity.

60
Why Data Fusion is Important
This work offers an implementation of metrics from cross silo data sources. For an
organization to effectively measure security, numerous data sources are needed. Often, these data
sources do not share ubiquitous fields in every log type. Firewall logs may offer an IP address as
the major event correlator, while host based IPS logs may only provide a hostname. To use
multiple different data sources, a firm grasp in data fusion technologies are needed. Data fusion
techniques had traditionally been utilized in the RF environments and signal analysis. Within the
past ten years, new data fusion techniques have been developed for the cyber domain that allow
for correlation of cross silo data sources. A silo represents a common application or security tool
such as firewall, proxy, or IDS/IPS. Cross silo data correlation increases potential to holistically
understand what is occurring on a network.
Seeking to measure security using single silo or data in isolation will produce misleading
or inaccurate results. This is because of the limited view of a single silo of data. While firewall
logs may offer insight into the delivery of a malicious file, it cannot identify if a malicious file
was opened and installed on a host. This same logic applies to determining the number of hosts
on a network who received an antivirus/anti-malware scan. If an organization seeks to measure
compliance against the number of known and accounted for hosts in the anti-virus management
tool, it is misled in its calculation. A host can be present on a network and not connected to the
anti-virus management tool. This highlights the importance of data fusion of cross silo data
sources from security logs and the dangers of relying on a single source of data in measuring
cybersecurity in an organization.

61
Potential to Increase Situation Awareness
Metrics that are built from cross silo data sources provide the potential to increase
situation awareness to strategic decision makers, as well as, systems administrators. Metrics offer
value to a wide array of stakeholders. Few initiatives in an organization offer the potential to
increase situation awareness in a strategic decision maker and a systems administrator. As is
previously mentioned, a good metric is geared toward a particular audience and provides
actionable information.
A Chief Information Security Officer (CISO) is better informed when his/her
organization has implemented metrics that are tracked over time. As attacks change and new
products hit the market every month, a strategic decision maker who is informed by metrics is
able to more clearly determine gaps or weaknesses in their environment. If the backend
infrastructure to an anti-virus/anti-malware tool is struggling to communicate with the number of
hosts required by an organization, a metric such as CSC 8.2 provides for the ability to spot a trend
in declining number of host with an update 24 hours after it was released. Having the ability to
spot trends is the mark of an expert according to Endsley & Garland (2000). While metrics do not
create experts, they provide the data for an expert to be well informed.
Metrics provide a systems administrator the ability to measure, in real time, the
compliance of their network. This is a valuable resource that can help increase the situation
awareness of a systems administrator. The real time status of compliance is a not the only value
from metrics. Metrics are able to offer actionable information for investigation. As seen in the
Splunk dashboard implementation of CSC 8.2, the number of hosts that have not received an
update is clearly presented to a systems administrator. This actionable information allows a
systems administrator to investigate and resolve any outstanding issues. This in turn increases
security across their organizations network.

62
A Guide to Help Implement Measurement
Vaarandi & Pihelgas (2014) and Narang & Mehrotra (2010) highlight that much of the
work in security metrics fails to offer detailed implementation guides to assist researchers and
security practitioners. A primary objective of this research was to develop six metrics to measure
Critical Security Controls and offer a proof of concept on how to implement two of these metrics
that were created.
Chapter 4 provides a detailed process on the implementation of CSC 8.1 and 8.2. This
implementation provides the policies required in the centralized anti-virus manager and the
collection and manipulation of the anti-virus/anti-malware logging data. This work offers an
organization a starting point on how to implement metrics in their organization. This work is a
valuable resource to organizations and the security research community who can build on this
work with the development of other metrics that are accompanied by a detailed implementation
guide.
Contributions
This research has practical and theoretical implications. This research contributions
theoretically to the discussion around measuring security within a security taxonomy. Further
contribution includes, six new metrics for Critical Security Controls. This research can help the
theoretical development of data fusion best practices in the cybersecurity subject area and the
development of integrating measurement into the output of data fusion. Each of the implemented
metrics featured a dashboard and a fused data table in Splunk. The queries for these tables can be
found in Figure 13 and Figure 19. The source code for each of the dashboards can be found in
Appendix: Source Code for Splunk Dashboards.

63
On a practical level, this research serves as a proof of concept on how to measure the
success of an organization at meeting cybersecurity standards. This research offers insight into
measuring controls in a taxonomy, while other taxonomies can be used, this research used the
CIS Critical Security Controls as the standard taxonomy.
This research pushes the security metrics domain to be practical and technical, a current
shortfall in the existing research. The hope is that offering research that is practical and technical
will drive other researchers to develop metrics that quantifiably measure security and express, in
technical detail, how to accomplish the implementation of their metric design.
Limitations
There are a number of limitations to this research. The first limitation in the
implementation is the size of the network. Implementation of the developed metrics occurred in a
network with 10 workstations and two servers, in a virtualized environment. This would mirror a
small business. In a Fortune 100 computer network, with potentially a few hundred thousand
networking assets, the ease of implementation will vary greatly.
Another limitation in this research is the assumption that an organization will possess the
desired and required logging data sources, with an ability to index and manipulate the log
information. This is relatively easy in a network with less than 15 assets, but a significantly larger
challenge financially to store and index such large amounts of data.
When measuring the number of hosts on a network through the ARP cache a limitation
exists. An ARP cache only has visibility into traffic crossing the router. There is the possibility
that a network host is operating on a network but does not cross a routing device. This is largely
dependent on a network’s architecture.

64
Future Work
This work is a starting point for measuring the Critical Security Controls, as only one of
the twenty controls are created/implemented. Other researchers can build on this research by
developing and implementing metrics for each of the remaining critical security controls, as seen
in Figure 22. While all of the controls are important, CSC 1 is an ideal starting spot moving
forward. CSC 1 covers inventory of authorized and unauthorized devices. It is of vital importance
that security practitioners have an answer to the question of “who is on my network?” This
research offers techniques that can be utilized for determining the number of clients active on a
network.
Figure 22: All Twenty of the Critical Security Controls

65
Conclusion
Chapter one examined the reasoning behind why measuring security is hard. A lack of
consensus in defining security and a standard taxonomy to use in measurement are discussed.
Along with this, discussion around human limitations in cybersecurity, visibility into systems,
and changing techniques of attackers occur. These aspects play a role in the lack of advancement
made to measuring cybersecurity over the last decade.
Chapter two reviewed literature from three domains; security metrics, situation
awareness, particularly of the cyber subject area, and multisensor data fusion and the JDL Data
Fusion Process Model. This review outlines how each of these domains assist each other in this
work.
Chapter three explains the creation of six metrics within the CIS Critical Security
Controls. The six metrics are members of CSC 8: Malware Defenses. This CSC is a set of
controls to combat malware on systems. Provided are description of each of the controls and a
corresponding measurement.
Chapter four cover the implementation of metrics for CSC 8.1 and 8.2. This research
developed a computer network with Symantec Endpoint Protection and Splunk deployed on the
network. Collection and measurement of the data from Symantec Endpoint Protection occurred in
Splunk, where dashboards displayed each metric. Along with this, a discussion around the value
of metric dashboards to strategic decision makers and systems administrators was highlighted.
Chapter five outlines the discoveries and benefits from this research. This research
provides theoretical and practical contributions to the ongoing discussion around measuring
security. The small scale these metrics were implemented in limits this research. Future work
highlights the need to provide metrics and implementations for each of the twenty Critical
Security Controls.

66
In conclusion, this research seeks to explore how measuring Critical Security Controls,
through data fusion of security logs, have the potential to increase situation awareness to strategic
decision makers, and systems administrators. Metrics are created for each of the sub controls for
Critical Security Control 8: Malware Defenses. An implementation of CSC 8.1 and 8.2 provides a
proof of concept for the feasibility and benefits of implementing measuring into security.

67
References
Arnao, M., Smutz, C., Zollman, A., Richardson, A., & Hutchins, E. (2015). Laika BOSS :
Scalable File-Centric Malware Analysis and Intrusion Detection System Design.
Baiardi, F., Tonelli, F., Bertolini, A., & Montecucco, M. (2016). Metrics for Cyber Robustness.
NATO Science and Technology Organization, 1–18.
Ballora, M., Giacobe, N. A., McNeese, M., & Hall, D. L. (2011). Information Data Fusion and
Computer Network Defense. Situational Awareness in Computer Network Defense:
Principles, Methods and Applications, 141–164. https://doi.org/10.4018/978-1-4666-0104-
8.ch009
Bass, T. (2000). Intrusion Detection Systems and Multisensor Data Fusion. Communications of
the ACM, 43(4), 99–105. https://doi.org/10.1145/332051.332079
Beauchesne, A. M. (2017). U.S. Chamber Comments on Draft Update of the Framework for
Improving Critical Infrastructure.
Beauchesne, A. M. (2018). Cybersecurity Framework Version 1.1 Draft 2. Washington, DC.
Beres, Y., Mont, M. C., Griffin, J., & Shiu, S. (2009). Using Security Metrics Coupled with
Predictive Modeling and Simulation to Assess Security Processes Abstract : Using Security
Metrics Coupled with Predictive Modeling and Simulation to Assess Security Processes. In
2009 3rd International Symposium on Empirical Software Engineering and Measurement
(pp. 564–573). Lake Buena Vista, FL: IEEE.
Black, P., Scarfone, K., & Souppaya, M. (2008). Cyber Security Metrics and Measures. Wiley
Handbook of Science and Technology for Homeland Security. John Wiley & Sons, Inc.
Retrieved from http://onlinelibrary.wiley.com/doi/10.1002/9780470087923.hhs440/full

68
Blasch, E. P., & Plano, S. (2002). JDL level 5 fusion model: user refinement issues and
applications in group tracking. Proceedings of SPIE, 4729, 270–279.
https://doi.org/10.1117/12.477612
Bodeau, D., Graubart, R., & Heinbockel, W. (2013). Mapping the Cyber Terrain.
Brown, A., & Robinson, W. (2003). Security Metrics Guide for Information Technology Systems
(Vol. 1). Gaithersburg, MD.
Buczak, A. L., & Guven, E. (2016). A Survey of Data Mining and Machine Learning Methods for
Cyber Security Intrusion Detection. IEEE Communications Surveys & Tutorials, 18(2),
1153–1176. https://doi.org/10.1109/COMST.2015.2494502
Center for Internet Security. (2015). The CIS Critical Security Controls for Effective Cyber
Defense.
Cerullo, G., Coppolino, L., D’Antonio, S., Formicola, V., Papale, G., & Ragucci, B. (2016).
Enabling Convergence of Physical and Logical Security Through Intelligent Event
Correlation. In P. Novais, D. Camacho, C. Analide, A. El Fallah Seghrouchni, & C. Badica
(Eds.), Intelligent Distributed Computing IX (pp. 427–437). Cham: Springer International
Publishing.
Chew, E., Swanson, M., Stine, K., Bartol, N., Brown, A., & Robinson, W. (2008). Performance
measurement guide for information security. NIST Special Publication, (July), 1–80.
Retrieved from
http://scholar.google.com/scholar?hl=en&btnG=Search&q=intitle:Performance+M+easurem
ent+Guide+for+Information+Security#0
CIS Critical Security Controls: A Brief History. (n.d.). Retrieved from
https://www.sans.org/critical-security-controls/history
CIS Critical Security Controls: Guidelines. (n.d.). Retrieved from https://www.sans.org/critical-
security-controls/guidelines

69
Cybenko, G. (2018). Quantifying and measuring cyber resiliency. In Proc. SPIE 9825, Sensors,
and Command, Control, Communications, and Intelligence (C3I) Technologies for
Homeland Security, Defense, and Law Enforcement Applications (Vol. XV). Baltimore,
MD: SPIE Defense + Security. https://doi.org/10.1117/12.2230586
D’Amico, A., Whitley, K., Tesone, D., O’Brien, B., & Roth, E. (2005). Achieving Cyber Defense
Situational Awareness: A Cognitive Task Analysis of Information Assurance Analysts.
Proceedings of the Human Factors and Ergonomics Society Annual Meeting, 49(3), 229–
233. https://doi.org/10.1177/154193120504900304
Enabling and Disabling AutoRun. (n.d.). Retrieved from https://msdn.microsoft.com/en-
us/library/windows/desktop/cc144204(v=vs.85).aspx
Endsley, M. (1988). Design and Evaluation For Situation Awareness Enhancement. Proceedings
of the Human Factors and Ergonomics Society Annual Meeting, 32(2), 97–101.
Endsley, M. (1995). Toward a Theory of Situation Awareness in Dynamic Systems. Human
Factors: The Journal of the Human Factors and Ergonomics Society, 37(1), 32–64.
https://doi.org/10.1518/001872095779049543
Endsley, M., & Garland, D. J. (2000). Situation awareness analysis and measurement. Mahwah,
NJ: Lawrence Erlbaum Associates.
Fidelis Cybersecurity. (2017). How Security Metrics Deliver Business Value & Compliance.
Retrieved June 2, 2018, from https://www.fidelissecurity.com/threatgeek/2017/09/how-
security-metrics-deliver-business-value-compliance
Franke, U., & Brynielsson, J. (2014). Cyber situational awareness – A systematic review of the
literature. Computers & Security, 46, 18–31. https://doi.org/10.1016/j.cose.2014.06.008
Gartner, Ouellet, E., McShane, I., & Litan, A. (2017). Magic Quadrant for Endpoint Protection
Platforms. Retrieved from https://www.gartner.com/doc/reprints?id=1-
3N82LG5&ct=161205&st=sb

70
Giacobe, N. (2010). Application of the JDL data fusion process model for cyber security. SPIE
Defense, Security, and …, 7710(May), 77100R–77100R–10.
https://doi.org/10.1117/12.850275
Giacobe, N. (2012). Data fusion in cyber security: first order entity extraction from common
cyber data. Proceedings of SPIE: Cyber Sensing, 8408, 84080E–84080E–7.
https://doi.org/10.1117/12.919379
Giacobe, N. (2013). A Picture Is Worth a Thousand Alerts. In HUMAN FACTORS and
ERGONOMICS SOCIETY 57th ANNUAL MEETING (pp. 250–257).
Hale, J. (2014). The Windows 7 Event Log and USB Device Tracking. Retrieved from https://df-
stream.com/2014/01/the-windows-7-event-log-and-usb-device/
Hall, D. L. D. L., & Llinas, J. (1997). An introduction to multisensor data fusion. Proceedings of
the IEEE, 85(1), 6–23. https://doi.org/10.1109/5.554205
Hall, D. L., McMullen, S. A. H., & Hall, C. M. (2015). New perspectives on level-5 information
fusion: The impact of advances in information technology and user behavior. In 2015 IEEE
International Conference on Multisensor Fusion and Integration for Intelligent Systems
(MFI) (pp. 214–219). https://doi.org/10.1109/MFI.2015.7295811
How to determine that hardware DEP is available and configured on your computer. (n.d.).
Retrieved from https://support.microsoft.com/en-us/help/912923/how-to-determine-that-
hardware-dep-is-available-and-configured-on-your
Hutchins, E. M., Cloppert, M. J., & Amin, R. M. (2011). Intelligence-Driven Computer Network
Defense Informed by Analysis of Adversary Campaigns and Intrusion Kill Chains, (July
2005), 1–14. Retrieved from http://papers.rohanamin.com/wp-
content/uploads/papers.rohanamin.com/2011/08/iciw2011.pdf%5Cnhttp://www.lockheedma
rtin.com/content/dam/lockheed/data/corporate/documents/LM-White-Paper-Intel-Driven-
Defense.pdf

71
International Organization for Standardization. (2013). ISO/IEC 27001:2013.
International Organization for Standardization. (2016). ISO/IEC 27004:2016.
ISO 27004 - Information Security Metrics. (n.d.). Retrieved from
https://www.niiconsulting.com/services/advisory/iso27004-information-security-
metrics.html
Jain, S., & Ingle, M. (2011). A Review of Security Metrics in Software Development Process.
International Journal of Computer Science and Information Technologies, 2(6).
Jansen, W. (2009). Directions in Security Metrics Research. Gaithersburg, MD.
Joint Task Force Transformation Initiative. (2013). Security and Privacy Controls for Federal
Information Systems and Organizations Security and Privacy Controls for Federal
Information Systems and Organizations. NIST Special Publication.
Joint Task Force Transformation Initiative. (2014). Assessing Security and Privacy Controls in
Federal Information Systems and Organizations Assessing Security and Privacy Controls in
Federal Information Systems and Organizations. NIST Special Publication.
Jones, D. G., & Endsley, M. R. (1996). Sources of situation awareness errors in aviation.
Aviation, Space, and Environmental Medicine.
Keeney, R. L. (1992). Value-Focused Thinking (1st ed.). Harvard University Press.
Keeney, R. L., & Gregory, R. S. (2005). Objectives Selecting Attributes to Measure the
Achievement of Objectives (53rd ed.). Maryland, USA: Institute for Operations Research
and the Management Sciences (INFORMS). https://doi.org/10.1287/opre.1040.0158
Kessler, O., Askin, K., Beck, N., Lynch, J., White, F., Buede, D., … Llinas, J. (1991). Functional
description of the data fusion process. Warminster, PA: Office of Naval Technology, Naval
Air Development Center.
Krautsevich, L., Martinelli, F., & Yautsiukhin, A. (2010). Formal approach to security metrics .
What does “ more secure ” mean for you ? ∗. Proceedings of the Fourth European

72
Conference on Software Architecture, 162–169. https://doi.org/10.1145/1842752.1842787
Langweg, H. (2006). Framework for malware resistance metrics. In Proceedings of the 2nd ACM
workshop on Quality of protection. ACM. https://doi.org/10.1145/1179494.1179503
Leres, C. (n.d.). arpwatch(8) - Linux man page. Retrieved from
https://linux.die.net/man/8/arpwatch
Linstone, H. A., & Turoff, M. (2002). The Delphi Method - Techniques and Applications.
Techniques and Applications, 1–616. https://doi.org/10.2307/1268751
Luna, J., Ghani, H., Germanus, D., & Suri, N. (2011). A Security Metrics Framework for the
Cloud. In 2011 Proceedings of the International Conference Security and Cryptography
(SECRYPT).
Mancuso, V. F., Minotra, D., Giacobe, N., McNeese, M., & Tyworth, M. (2012). idsNETS: An
experimental platform to study situation awareness for intrusion detection analysts. 2012
IEEE International Multi-Disciplinary Conference on Cognitive Methods in Situation
Awareness and Decision Support, CogSIMA 2012, 73–79.
https://doi.org/10.1109/CogSIMA.2012.6188411
Marr, B. (2010). How to Design Key Performance Indicators. The Advanced Performance
Institute.
McKay, S. K., Linkov, I., Fischenich, J. C., Miller, S. J., & Valverde, L. J. (2012). Ecosystem
Restoration Objectives and Metrics.
Mellado, D., Fernandez-Medina, E., & Piattini, M. (2010). A comparison of software design
security metrics. In ACM International Conference Proceeding Series (pp. 236–242).
https://doi.org/10.1145/1842752.1842797
Narang, M., & Mehrotra, M. (2010). Security Issue – A Metrics Perspective. International
Journal of Information Technology, 2(2), 567–571.
National Institute of Standards and Technology. (2017a). Cybersecurity Framework Workshop

73
2017 Summary.
National Institute of Standards and Technology. (2017b). Draft NIST Roadmap for Improving
Critical Infrastructure Cybersecurity Version 1.1.
National Institute of Standards and Technology. (2017c). Framework for Improving Critical
Infrastructure Cybersecurity (Version 1.1 Draft 2).
Patriciu, V., & Nicolaescu, S. (2006). Security Metrics for Enterprise Information Systems.
Journal of Applied Quantiitative Methods, 1(2), 151–159.
Payne, S. C. (2006). A Guide to Security Metrics.
PCI DSS. (2014). Information Supplement : Best Practices for Maintaining PCI DSS
Compliance.
Rathbun, D. (2009). Gathering Security Metrics and Reaping the Rewards. SANS Reading Room,
1–21.
Roesch, M. (1999). Snort: Lightweight intrusion detection for networks. Lisa, 99(1), 229–238.
Ross, R., Dempsey, K., Viscuso, P., Riddle, M., & Guissanie, G. (2015). Protecting Controlled
Unclassified Information in Nonfederal Information Systems and Organizations. NIST
Special Publication 800, 1.
Sandoval, J. E., & Hassell, S. P. (2010). Measurement , Identification And Calculation Of Cyber
Defense Metrics. In The 2010 Military Communications Conference - Unclassified Program
- Cyber Security and Network Management Measurement (pp. 2174–2179).
Savola, R. (2007). Towards a Security Metrics Taxonomy for the Information and
Communication Technology Industry. In International Conference on Software Engineering
Advances, 2007. IEEE.
Sommer, R. (2003). Bro : An Open Source Network Intrusion Detection System. DFN-
Arbeitstagung Über Kommunikationsnetze, 273–288.
Steinberg, A. N., Bowman, C. L., & White, F. E. (1999). Revisions to the JDL data fusion model.

74
Proceedings of SPIE, 3719(1), 430–441. https://doi.org/10.1117/12.341367
Symantec. (2017). Symantec Endpoint Protection 14. Symantec.
Timonen, J., Lääperi, L., Rummukainen, L., Puuska, S., & Vankka, J. (2014). Situational
awareness and information collection from critical infrastructure. In 2014 6th International
Conference On Cyber Conflict (CyCon 2014) (pp. 157–173).
https://doi.org/10.1109/CYCON.2014.6916401
Tyworth, M., Giacobe, N. A., Mancuso, V., & Dancy, C. (2012). The distributed nature of cyber
situation awareness. 2012 IEEE International Multi-Disciplinary Conference on Cognitive
Methods in Situation Awareness and Decision Support, CogSIMA 2012, (March), 174–178.
https://doi.org/10.1109/CogSIMA.2012.6188375
Vaarandi, R., & Pihelgas, M. (2014). Using Security Logs for Collecting and Reporting Technical
Security Metrics. 2014 IEEE Military Communications Conference, 294–299.
https://doi.org/10.1109/MILCOM.2014.53
Wallen, J. (2011). Quick Tips: Flush the ARP cache in Windows 7. Retrieved from
https://www.techrepublic.com/blog/windows-and-office/quick-tips-flush-the-arp-cache-in-
windows-7/
Wang, A. J. A. (2005). Information security models and metrics. ACM Southeast Regional
Conference, 2, 178. https://doi.org/10.1145/1167253.1167295
Wang, C., & Wulf, W. a. (1997). Towards a framework for security measurement. In 20th
National Information Systems Security Conference, Baltimore (pp. 1–15). Baltimore, MD.
Wang, J. A., Wang, H., Guo, M., & Xia, M. (2009). Security metrics for software systems. ACM
Southeast Regional Conference, 1. https://doi.org/10.1145/1566445.1566509
Wang, L., Jajodia, S., Singhal, A., Cheng, P., & Noel, S. (2014). k -Zero Day Safety : A Network
Security Metric for Measuring the Risk of Unknown Vulnerabilities. IEEE
TRANSACTIONS ON DEPENDABLE AND SECURE COMPUTING, 11(1), 30–44.

75
Appendix: Source Code for Splunk Dashboards
Critical Security Control 8.1 Dashboard Source Code
<form> <label>Critical Security Control 8.1</label> <description>Description: Employ automated tools to continuously monitor workstations, servers, and mobile devices with anti-virus, anti-spyware, personal firewalls, and host-based IPS functionality. All malware detection events should be sent to enterprise anti-malware administration tools and event log servers.</description> <fieldset submitButton="true"> <input type="time" token="varTime" searchWhenChanged="true"> <label>Time</label> <default> <earliest>-24h@h</earliest> <latest>now</latest> </default> </input> </fieldset> <row> <panel> <single> <search> <query>(index=sepm source="C:\\Program Files (x86)\\Symantec\\Symantec Endpoint Protection Manager\\data\\dump\\agt_scan.tmp") OR (index=main) | dedup src_ip| stats dc(src_ip) | rename dc(src_ip) as "Total number of hosts with a completed scan"</query> <earliest>$varTime.earliest$</earliest> <latest>$varTime.latest$</latest> <sampleRatio>1</sampleRatio> </search> <option name="colorBy">value</option> <option name="colorMode">block</option> <option name="drilldown">none</option> <option name="numberPrecision">0</option> <option name="rangeColors">["0xd93f3c","0xf7bc38","0x65a637"]</option> <option name="rangeValues">[5,7]</option> <option name="showSparkline">1</option> <option name="showTrendIndicator">1</option> <option name="trellis.enabled">0</option> <option name="trellis.scales.shared">1</option> <option name="trellis.size">large</option> <option name="trendColorInterpretation">standard</option> <option name="trendDisplayMode">absolute</option> <option name="underLabel">Hosts with a Completed Scan</option> <option name="unit">Hosts</option> <option name="unitPosition">after</option> <option name="useColors">1</option> <option name="useThousandSeparators">1</option> </single> </panel> <panel> <single> <search> <query>index=arp type=dynamic | stats dc(src_ip) | rename dc(src_ip) as "Total Number of Network Assets"</query>

76
<earliest>-7d@h</earliest> <latest>now</latest> </search> <option name="colorMode">block</option> <option name="drilldown">none</option> <option name="rangeColors">["0x65a637","0x65a637"]</option> <option name="rangeValues">[0]</option> <option name="trellis.enabled">0</option> <option name="trellis.size">large</option> <option name="underLabel">Total Number of Network Assets</option> <option name="unit">Assets</option> <option name="useColors">1</option> </single> </panel> <panel> <single> <search> <query>index=arp type=dynamic | stats dc(src_ip) as total_denominator | table total_denominator | table total_numerator, total_denominator | join src_ip [search (index=sepm source="C:\\Program Files (x86)\\Symantec\\Symantec Endpoint Protection Manager\\data\\dump\\agt_scan.tmp") OR (index=main) | dedup src_ip| where src_ip!="IP Address" | stats dc(src_ip) as total_numerator | table total_numerator] | eval metric_percentage=total_numerator / total_denominator | eval metric_percentage =round(metric_percentage*100) | table metric_percentage | rename metric_percentage as "8.1 Metric"</query> <earliest>-7d@h</earliest> <latest>now</latest> </search> <option name="colorMode">block</option> <option name="drilldown">none</option> <option name="rangeColors">["0x65a637","0x65a637","0x65a637"]</option> <option name="rangeValues">[50,75]</option> <option name="trellis.enabled">0</option> <option name="trellis.size">large</option> <option name="underLabel">of Network Assets Reporting a Scan</option> <option name="unit">%</option> <option name="useColors">1</option> </single> </panel> </row> <row> <panel> <title>Metric Sections</title> <table> <search> <query>index=arp type=dynamic | stats dc(src_ip) as total_denominator | table total_denominator | table total_numerator, total_denominator | join src_ip [search (index=sepm source="C:\\Program Files (x86)\\Symantec\\Symantec Endpoint Protection Manager\\data\\dump\\agt_scan.tmp") OR (index=main)| dedup src_ip| where src_ip!="IP Address" | stats dc(src_ip) as total_numerator | table total_numerator] | table total_numerator, total_denominator | eval metric_percentage=total_numerator / total_denominator | eval metric_percentage =round(metric_percentage*100) | rename total_numerator as "Numerator Total", total_denominator as "Denominator Total", metric_percentage as "Metric Percentage"</query> <earliest>-7d@h</earliest> <latest>now</latest> </search> <option name="drilldown">none</option> </table> </panel> </row> <row> <panel> <title>Fused Data Table</title>

77
<table> <search> <query>index=arp type=dynamic | table src_ip, MAC_addr | join src_ip [search index=sepm source="C:\\Program Files (x86)\\Symantec\\Symantec Endpoint Protection Manager\\data\\dump\\agt_scan.tmp" AND status="Completed" | dedup src_ip | table src_ip, status, scan_id, user2,computer_name] | sort src_ip | rename user2 as "User", computer_name as "Computer Name", scan_id as "Scan ID", src_ip as "Source IP", status as "Status"</query> <earliest>-7d@h</earliest> <latest>now</latest> <sampleRatio>1</sampleRatio> </search> <option name="count">20</option> <option name="dataOverlayMode">none</option> <option name="drilldown">none</option> <option name="percentagesRow">false</option> <option name="rowNumbers">false</option> <option name="totalsRow">false</option> <option name="wrap">true</option> </table> </panel> </row> <row> <panel> <title>Numerator Data</title> <table> <title>Host's Reporting a Completed Scan to Symantec Endpoint Protection Manager</title> <search> <query>index=sepm source="C:\\Program Files (x86)\\Symantec\\Symantec Endpoint Protection Manager\\data\\dump\\agt_scan.tmp" AND status="Completed" | dedup src_ip| table src_ip, scan_id, status, user2,computer_name | where src_ip!="IP Address" | sort src_ip | rename user2 as "User", computer_name as "Computer Name", scan_id as "Scan ID", src_ip as "Source IP", status as "Status"</query> <earliest>-7d@h</earliest> <latest>now</latest> <sampleRatio>1</sampleRatio> </search> <option name="count">20</option> <option name="dataOverlayMode">none</option> <option name="drilldown">none</option> <option name="percentagesRow">false</option> <option name="rowNumbers">false</option> <option name="totalsRow">false</option> <option name="wrap">true</option> </table> </panel> <panel> <title>Denominator Data</title> <table> <title>Network Assets found in ARP Table</title> <search> <query>index=arp type=dynamic | table src_ip, MAC_addr |sort src_ip | rename src_ip as "Source IP", MAC_addr as "MAC Address"</query> <earliest>-7d@h</earliest> <latest>now</latest> <sampleRatio>1</sampleRatio> </search> <option name="count">20</option> <option name="dataOverlayMode">none</option> <option name="drilldown">none</option> <option name="percentagesRow">false</option> <option name="rowNumbers">false</option>

78
<option name="totalsRow">false</option> <option name="wrap">true</option> </table> </panel> </row> </form>
Critical Security Control 8.2 Dashboard Source Code
<form> <label>Critical Security Control 8.1</label> <description>Description: Employ automated tools to continuously monitor workstations, servers, and mobile devices with anti-virus, anti-spyware, personal firewalls, and host-based IPS functionality. All malware detection events should be sent to enterprise anti-malware administration tools and event log servers.</description> <fieldset submitButton="true"> <input type="time" token="varTime" searchWhenChanged="true"> <label>Time</label> <default> <earliest>-24h@h</earliest> <latest>now</latest> </default> </input> </fieldset> <row> <panel> <single> <search> <query>(index=sepm source="C:\\Program Files (x86)\\Symantec\\Symantec Endpoint Protection Manager\\data\\dump\\agt_scan.tmp") OR (index=main) | dedup src_ip| stats dc(src_ip) | rename dc(src_ip) as "Total number of hosts with a completed scan"</query> <earliest>-7d@h</earliest> <latest>now</latest> <sampleRatio>1</sampleRatio> </search> <option name="colorBy">value</option> <option name="colorMode">block</option> <option name="drilldown">none</option> <option name="numberPrecision">0</option> <option name="rangeColors">["0xd93f3c","0xf7bc38","0x65a637"]</option> <option name="rangeValues">[5,7]</option> <option name="showSparkline">1</option> <option name="showTrendIndicator">1</option> <option name="trellis.enabled">0</option> <option name="trellis.scales.shared">1</option> <option name="trellis.size">large</option> <option name="trendColorInterpretation">standard</option> <option name="trendDisplayMode">absolute</option> <option name="underLabel">Assets with a Completed Scan</option> <option name="unit">Assets</option> <option name="unitPosition">after</option> <option name="useColors">1</option> <option name="useThousandSeparators">1</option> </single>

79
</panel> <panel> <single> <search> <query>index=arp type=dynamic | stats dc(src_ip) | rename dc(src_ip) as "Total Number of Network Hosts"</query> <earliest>-7d@h</earliest> <latest>now</latest> </search> <option name="colorMode">block</option> <option name="drilldown">none</option> <option name="rangeColors">["0x65a637","0x65a637"]</option> <option name="rangeValues">[0]</option> <option name="trellis.enabled">0</option> <option name="trellis.size">large</option> <option name="underLabel">Total Number of Network Hosts</option> <option name="unit">Hosts</option> <option name="useColors">1</option> </single> </panel> <panel> <single> <search> <query>index=arp type=dynamic | stats dc(src_ip) as total_denominator | table total_denominator | table total_numerator, total_denominator | join src_ip [search (index=sepm source="C:\\Program Files (x86)\\Symantec\\Symantec Endpoint Protection Manager\\data\\dump\\agt_scan.tmp") OR (index=main) | dedup src_ip| where src_ip!="IP Address" | stats dc(src_ip) as total_numerator | table total_numerator] | eval metric_percentage=total_numerator / total_denominator | eval metric_percentage =round(metric_percentage*100) | table metric_percentage | rename metric_percentage as "8.1 Metric"</query> <earliest>-7d@h</earliest> <latest>now</latest> </search> <option name="colorMode">block</option> <option name="drilldown">none</option> <option name="rangeColors">["0x65a637","0x65a637","0x65a637"]</option> <option name="rangeValues">[50,75]</option> <option name="trellis.enabled">0</option> <option name="trellis.size">large</option> <option name="underLabel">of Network Hosts Reporting a Scan</option> <option name="unit">%</option> <option name="useColors">1</option> </single> </panel> </row> <row> <panel> <title>Metric Sections</title> <table> <search> <query>index=arp type=dynamic | stats dc(src_ip) as total_denominator | table total_denominator | table total_numerator, total_denominator | join src_ip [search (index=sepm source="C:\\Program Files (x86)\\Symantec\\Symantec Endpoint Protection Manager\\data\\dump\\agt_scan.tmp") OR (index=main)| dedup src_ip| where src_ip!="IP Address" | stats dc(src_ip) as total_numerator | table total_numerator] | table total_numerator, total_denominator | eval metric_percentage=total_numerator / total_denominator | eval metric_percentage =round(metric_percentage*100) | rename total_numerator as "Numerator Total", total_denominator as "Denominator Total", metric_percentage as "Metric Percentage"</query> <earliest>-7d@h</earliest> <latest>now</latest> </search> <option name="drilldown">none</option>

80
</table> </panel> </row> <row> <panel> <title>Fused Data Table</title> <table> <search> <query>index=arp type=dynamic | table src_ip, MAC_addr | join src_ip [search index=sepm source="C:\\Program Files (x86)\\Symantec\\Symantec Endpoint Protection Manager\\data\\dump\\agt_scan.tmp" AND status="Completed" | dedup src_ip | table src_ip, status, scan_id, user2,computer_name] | sort src_ip | rename user2 as "User", computer_name as "Computer Name", scan_id as "Scan ID", src_ip as "Source IP", status as "Status"</query> <earliest>-7d@h</earliest> <latest>now</latest> <sampleRatio>1</sampleRatio> </search> <option name="count">20</option> <option name="dataOverlayMode">none</option> <option name="drilldown">none</option> <option name="percentagesRow">false</option> <option name="rowNumbers">false</option> <option name="totalsRow">false</option> <option name="wrap">true</option> </table> </panel> </row> <row> <panel> <title>Numerator Data</title> <table> <title>Host's Reporting a Completed Scan to Symantec Endpoint Protection Manager</title> <search> <query>index=sepm source="C:\\Program Files (x86)\\Symantec\\Symantec Endpoint Protection Manager\\data\\dump\\agt_scan.tmp" AND status="Completed" | dedup src_ip| table src_ip, scan_id, status, user2,computer_name | where src_ip!="IP Address" | sort src_ip | rename user2 as "User", computer_name as "Computer Name", scan_id as "Scan ID", src_ip as "Source IP", status as "Status"</query> <earliest>-7d@h</earliest> <latest>now</latest> <sampleRatio>1</sampleRatio> </search> <option name="count">20</option> <option name="dataOverlayMode">none</option> <option name="drilldown">none</option> <option name="percentagesRow">false</option> <option name="rowNumbers">false</option> <option name="totalsRow">false</option> <option name="wrap">true</option> </table> </panel> <panel> <title>Denominator Data</title> <table> <title>Network Assets found in ARP Table</title> <search> <query>index=arp type=dynamic | table src_ip, MAC_addr |sort src_ip | rename src_ip as "Source IP", MAC_addr as "MAC Address"</query> <earliest>-7d@h</earliest> <latest>now</latest> <sampleRatio>1</sampleRatio>

81
</search> <option name="count">20</option> <option name="dataOverlayMode">none</option> <option name="drilldown">none</option> <option name="percentagesRow">false</option> <option name="rowNumbers">false</option> <option name="totalsRow">false</option> <option name="wrap">true</option> </table> </panel> </row> </form>