data flow methodology steve chenoweth & sriram mohan question 6
TRANSCRIPT

Data Flow Methodology
Steve Chenoweth & Sriram Mohan
Question 6

Outline
Basics Levels of Detail Bad and Good DFD practices

What is it?
A model that indicates the flow of data through a system. Represented using Data Flow Diagrams(DFD)

In class we’ll discuss this point further…
What is the difference between a DFD and a flow chart?
Question 1
Here’s your basic flowchart, from http://www.agilemodeling.com/artifacts/flowChart.htm

Notation
Source/SinkWhere the data comes from and where the data leaves the system
Process
Store
Uni/bi directional - Used to indicate flow
A transformation or validation of data
A storehouse of data like a database or file

Example - License Branch

Structural Recursion
Process nodes may have internal details that may be exploded
Allows top level or detailed overview of any process
Process is overloaded in software engineering and means a lot of things..

Example - License Branch Explosion
Must bedistinct diagrams

Types of a DFD
Current versus the Proposed System– Doing the first confirms what
you think you know about how things are!
Physical versus Conceptual Conceptual DFD is a simple
way to start.
Question 2, part of 3
Conceptual DFD from http://www.umsl.edu/~sauterv/analysis/6840_f03_papers/vanemden/index.html

How do you get started doing DFD’s?
Step 1: Develop the Context Diagram Shows how project fits into the larger environment Represents physical flow/communication Sinks and Sources must be shown A process is shown only if it is visible to the external
environment. Explode as necessary.

Example - License Branch

Levels of Details
Context Diagram Main External Environment
Level 0 Diagram Main focus is top-level internals Might be the same as the context diagram for small projects Sources and Sinks need not be shown, but represent the flow
Level i Diagram Provides a higher level of detail for nodes in level i-1 Use “Dewey decimal” notation to clarify relationships
Node 2.3 expands to 2.3.1, 2.3.2 and so on
Part of Q 3

Example - License Branch Explosion
Must be distinct diagrams for each of these, eventually, to show their detail!

Levels and Perspectives
View of process depends on positions
Do the “slide show” of this slide, to see both views! Question 6

How far to Expand?
A process can always be further expanded to sub-processes How far should we expand?
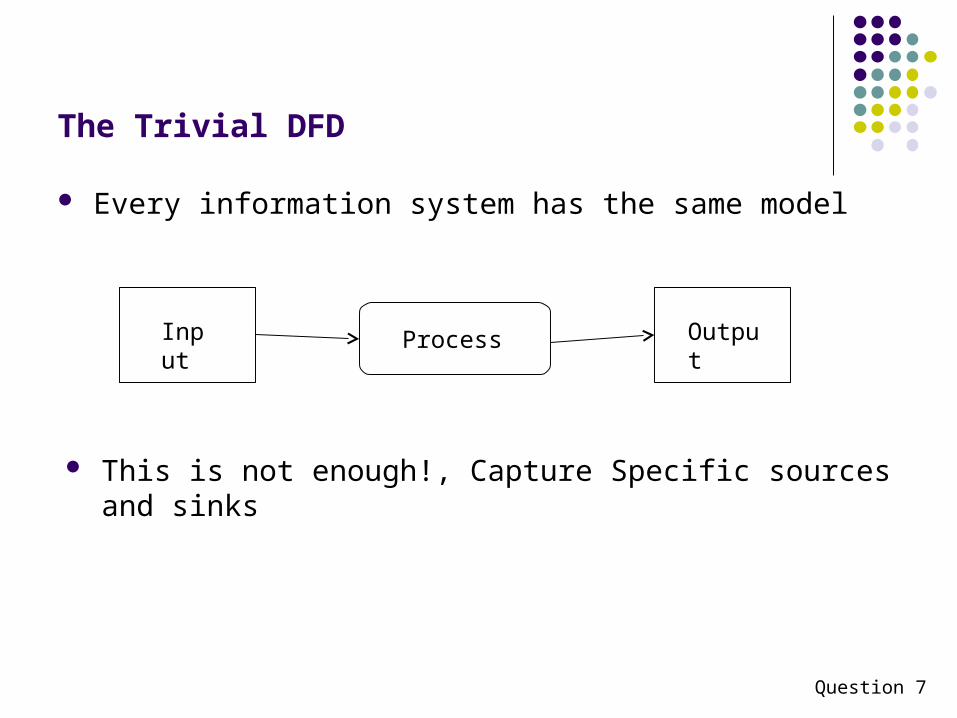
The Trivial DFD
Every information system has the same model
This is not enough!, Capture Specific sources and sinks
Input OutputProcess
Question 7

The Trivial DFD….
In Interactive systems, another trivial DFD is
User System

What do you think?
User Classify &Direct
Proc 1
Proc 2
Proc 3
Question 8

Some Problems (with the previous slide)
There is a monolithic user Don’t capture menu selection (the flow of control) in a DFD How can you correct this?
Show all user roles Separate user selection at input

A Better DFD
Internal User
Proc 1
Proc 2
Proc 3
External User
Question 9

Advantages of DFD
It is the first step towards implementation It helps guide the development of user interfaces
Guides the user through choices and avoids meaningless steps
Good way to verify requirements with your client.
Questions 4,5

Team Work – We’ll do this in class…
As a team try to draw Context, Level 0, Level 1, 2….n data flow diagrams for the degree planner project. Please turn in your work