data flow diagrams
DESCRIPTION
These are lecture notes from IIT Kharagpur on Data Flow DiagramsTRANSCRIPT
1
Function-Oriented Software Design (lecture 5)
Prof. R. MallDept. of CSE, IIT, Kharagpur
2
Introduction ● Function-oriented design techniques
are very popular:– Currently in use in many software
development organizations. ● Function-oriented design techniques:
– Start with the functional requirements specified in the SRS document.
3
Introduction ● During the design process:
–High-level functions are successively decomposed: ●Into more detailed functions.
–Finally the detailed functions are mapped to a module structure.
4
Introduction ● Successive decomposition of high-level functions: –Into more detailed functions. –Technically known as top-down decomposition.
5
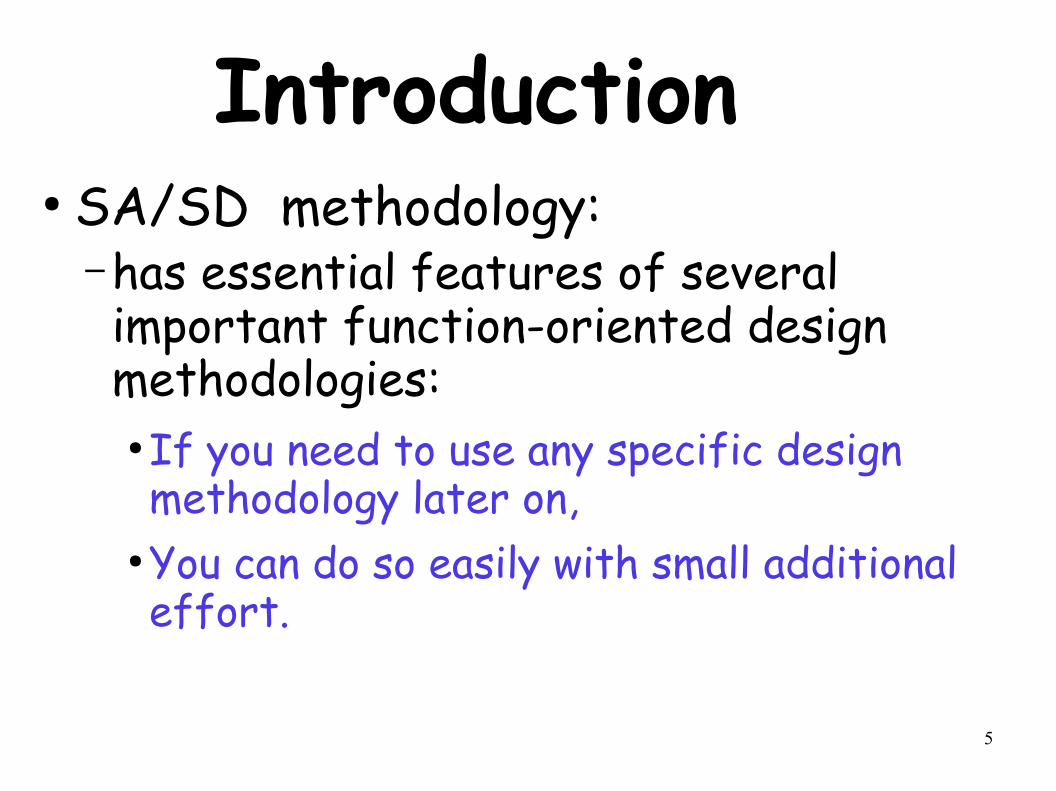
Introduction ● SA/SD methodology:
– has essential features of several important function-oriented design methodologies:
● If you need to use any specific design methodology later on,
● You can do so easily with small additional effort.
6
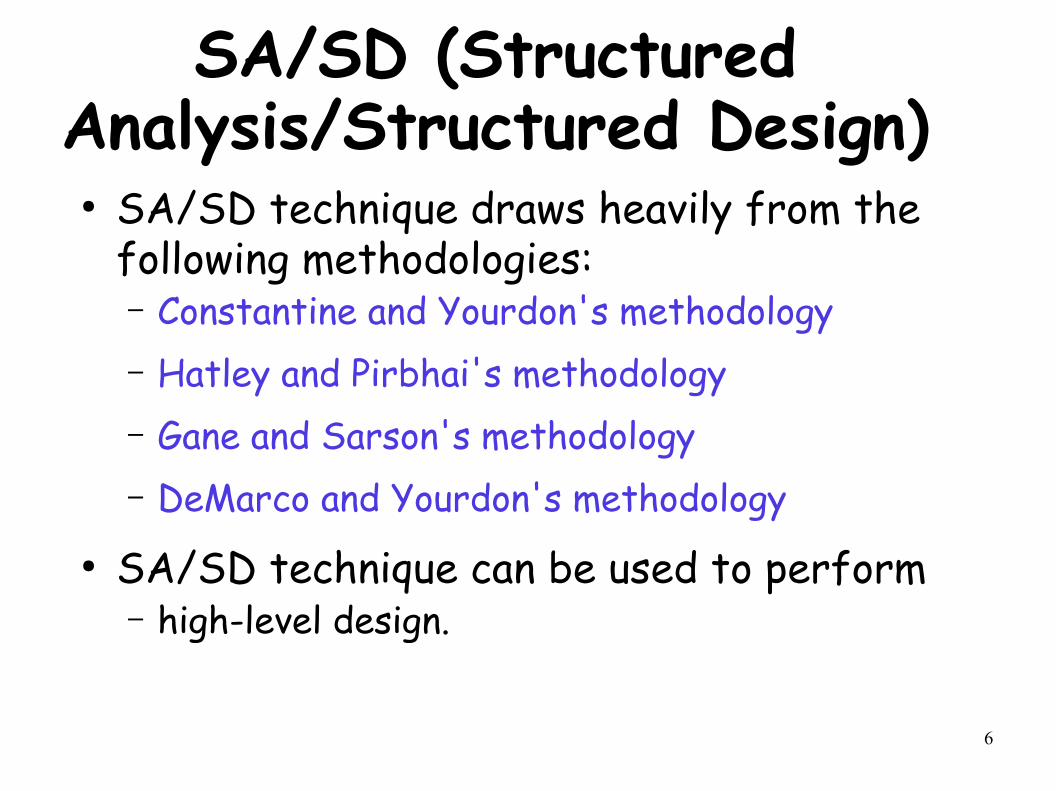
SA/SD (Structured Analysis/Structured Design)
● SA/SD technique draws heavily from the following methodologies:– Constantine and Yourdon's methodology – Hatley and Pirbhai's methodology – Gane and Sarson's methodology– DeMarco and Yourdon's methodology
● SA/SD technique can be used to perform– high-level design.
7
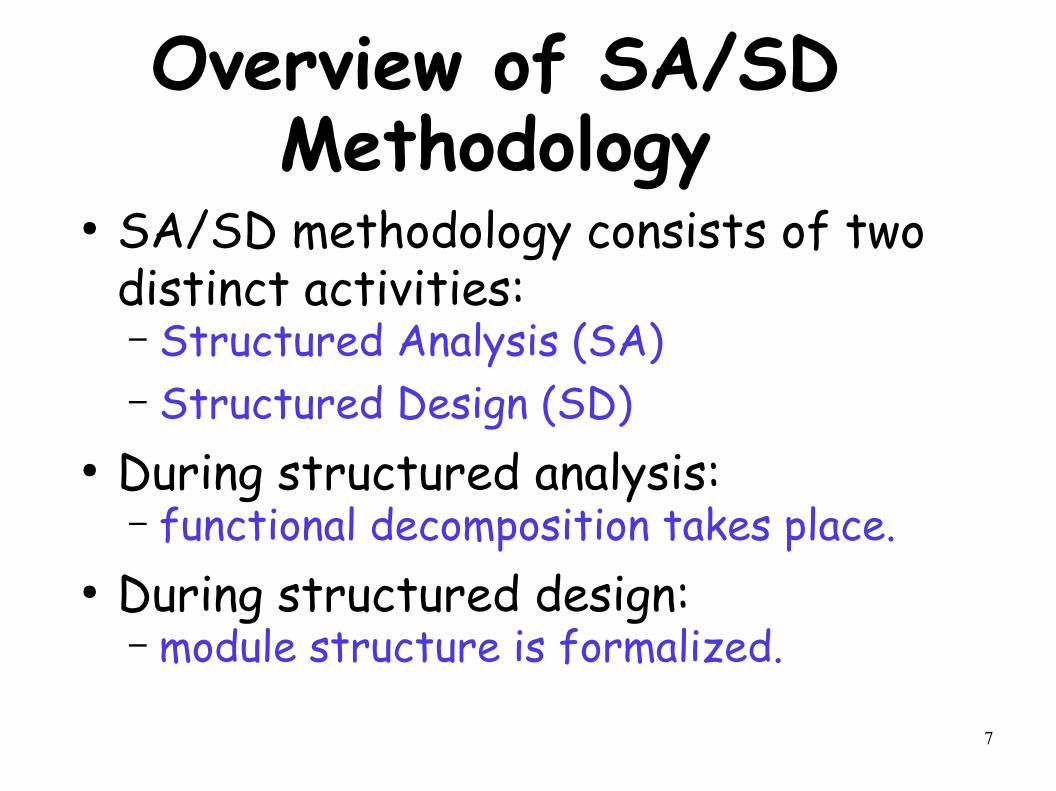
Overview of SA/SD Methodology
● SA/SD methodology consists of two distinct activities: – Structured Analysis (SA) – Structured Design (SD)
● During structured analysis:– functional decomposition takes place.
● During structured design:– module structure is formalized.
8
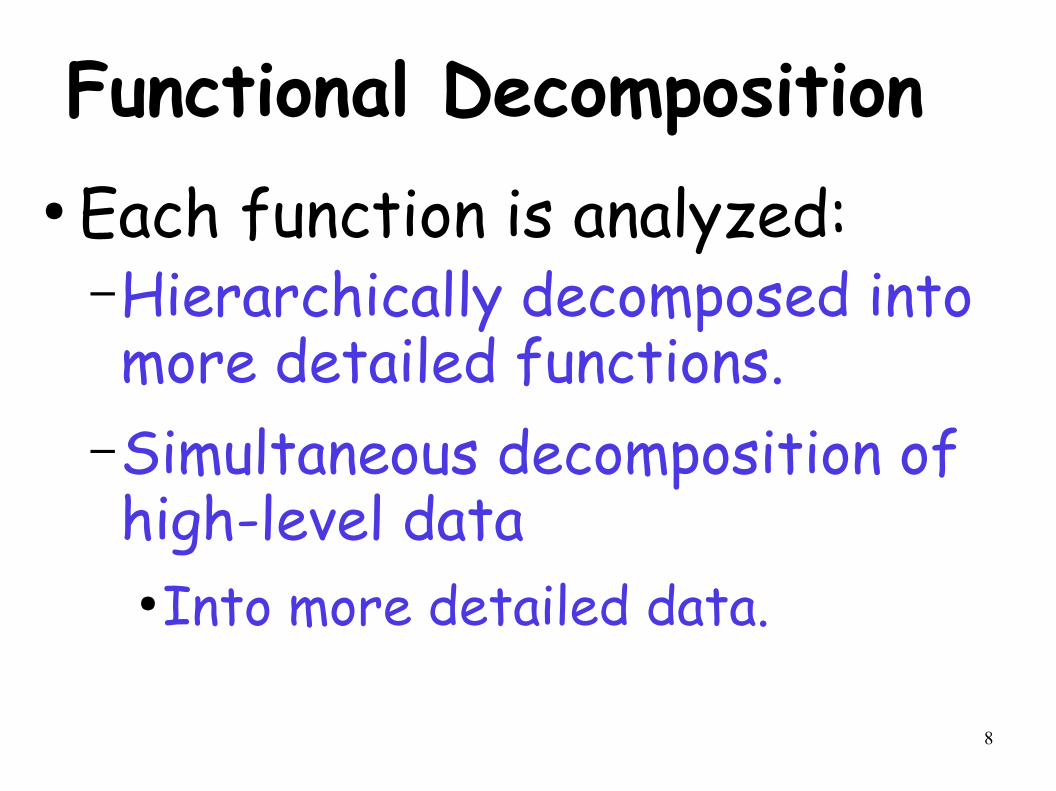
Functional Decomposition● Each function is analyzed:
–Hierarchically decomposed into more detailed functions.
–Simultaneous decomposition of high-level data
●Into more detailed data.
9
Structured Analysis● Transforms a textual problem
description into a graphic model.– Done using data flow diagrams (DFDs).
– DFDs graphically represent the results of structured analysis.
10
Structured Design● All the functions represented in
the DFD:– Mapped to a module structure.
● The module structure:–Also called as the software architecture:
11
Detailed Design● Software architecture:
–Refined through detailed design.–Detailed design can be directly implemented:
●Using a conventional programming language.
12
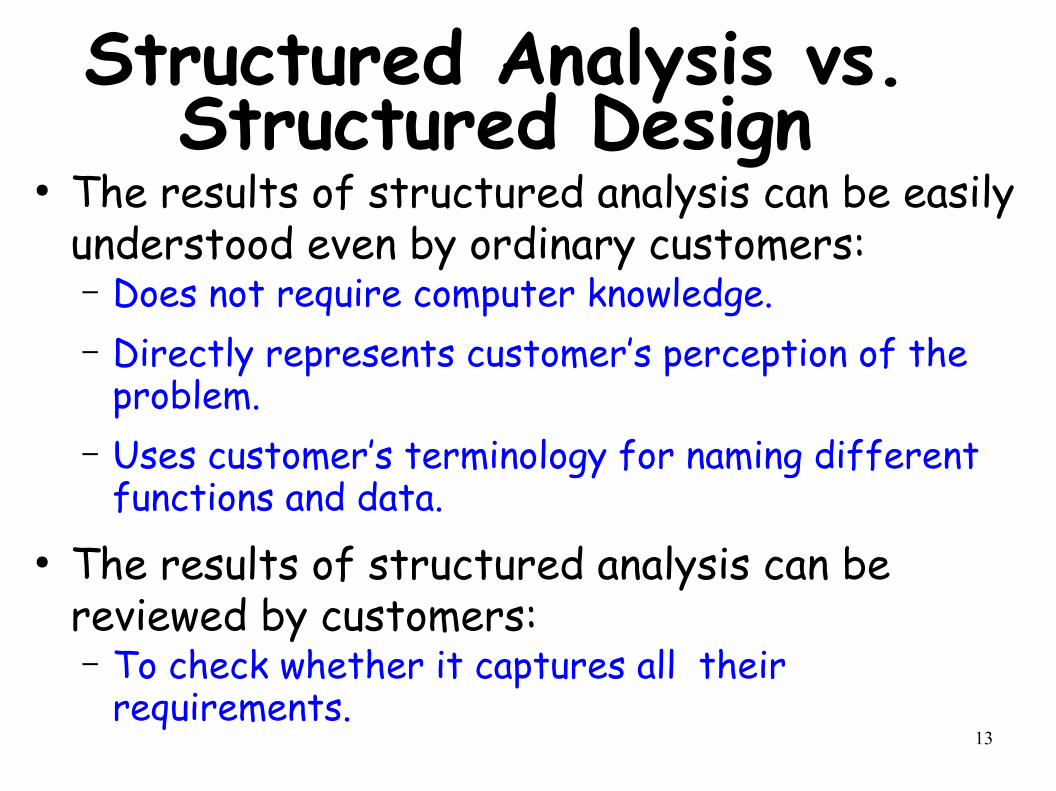
Structured Analysis vs. Structured Design
● Purpose of structured analysis:– Capture the detailed structure of the system as the user views it.
● Purpose of structured design:– Arrive at a form that is suitable for implementation in some programming language.
13
Structured Analysis vs. Structured Design
● The results of structured analysis can be easily understood even by ordinary customers:– Does not require computer knowledge.– Directly represents customer’s perception of the
problem. – Uses customer’s terminology for naming different
functions and data.● The results of structured analysis can be
reviewed by customers:– To check whether it captures all their
requirements.
14
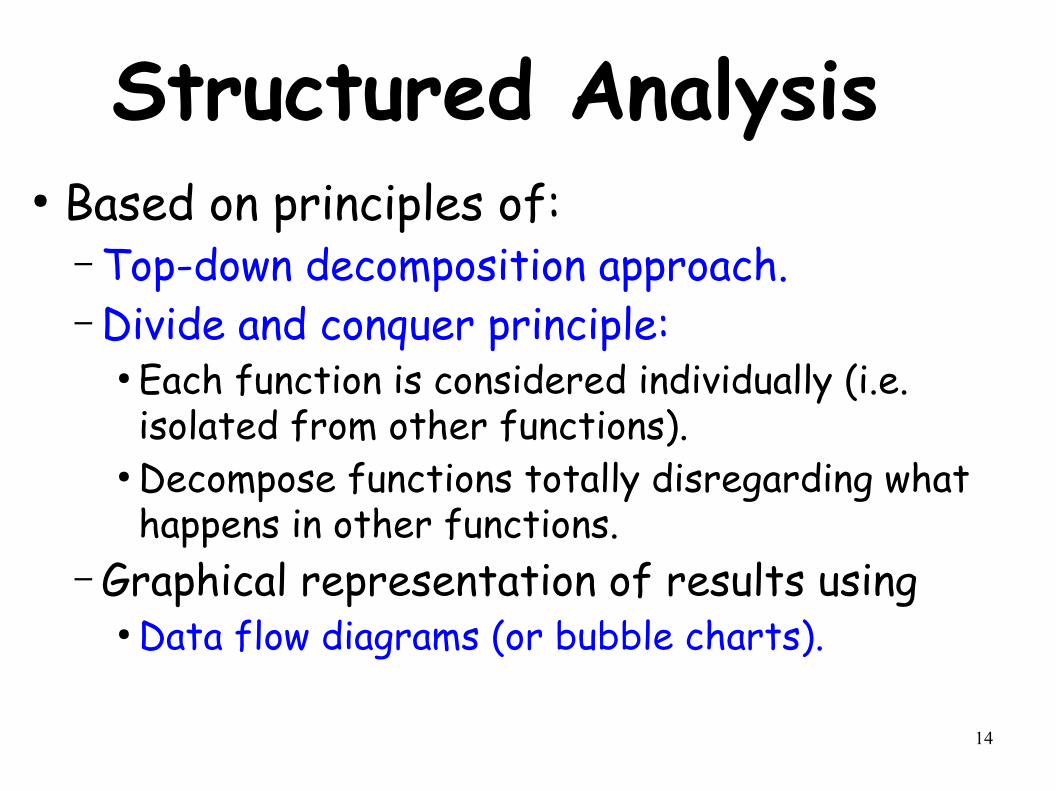
Structured Analysis● Based on principles of:
– Top-down decomposition approach.– Divide and conquer principle:
● Each function is considered individually (i.e. isolated from other functions).
● Decompose functions totally disregarding what happens in other functions.
– Graphical representation of results using● Data flow diagrams (or bubble charts).
15
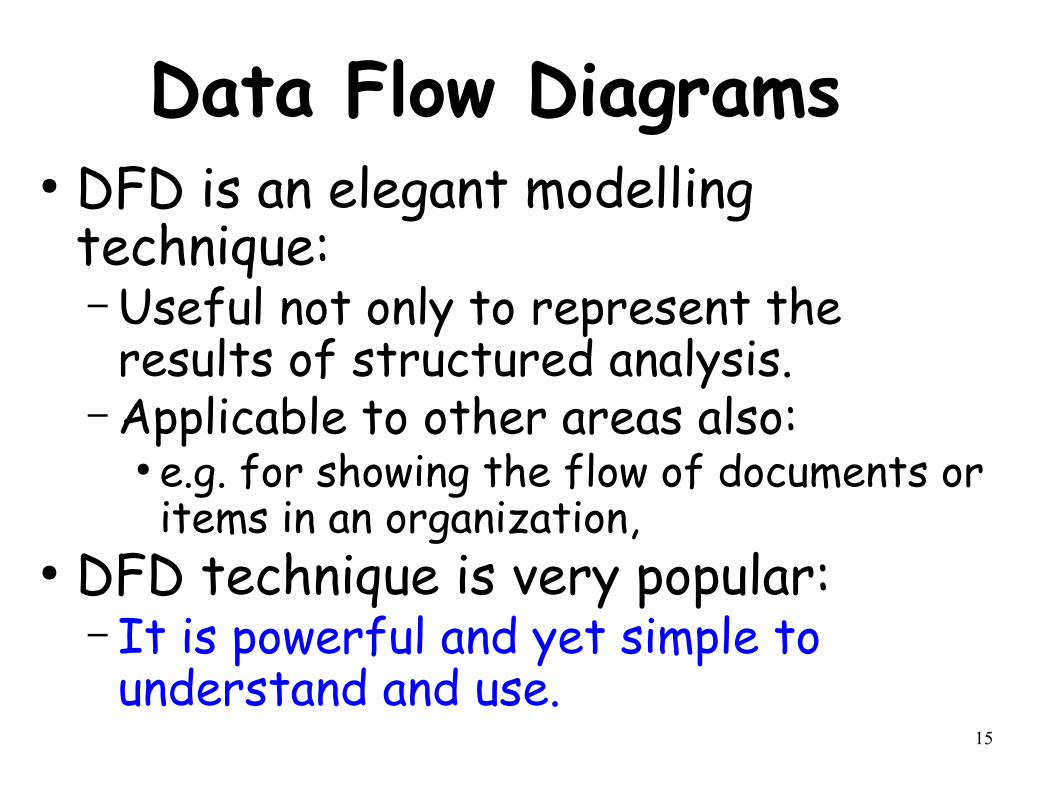
Data Flow Diagrams● DFD is an elegant modelling
technique:– Useful not only to represent the
results of structured analysis.– Applicable to other areas also:
● e.g. for showing the flow of documents or items in an organization,
● DFD technique is very popular:– It is powerful and yet simple to
understand and use.
16
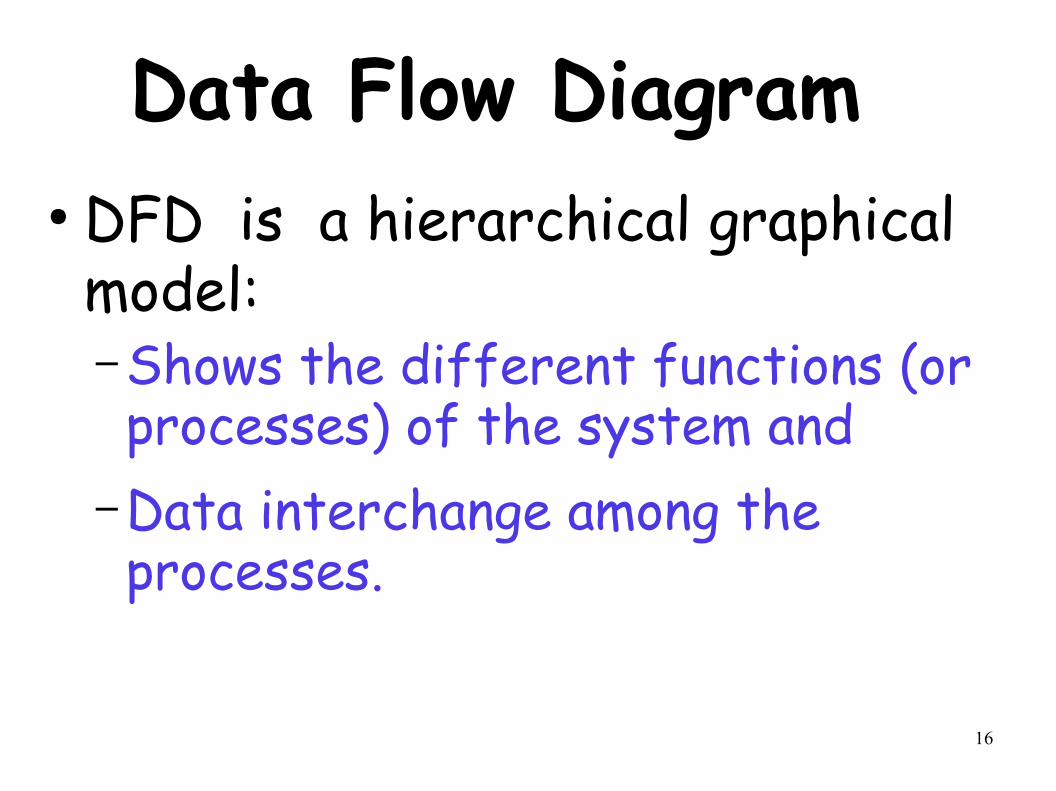
Data Flow Diagram● DFD is a hierarchical graphical
model:– Shows the different functions (or processes) of the system and
– Data interchange among the processes.
17
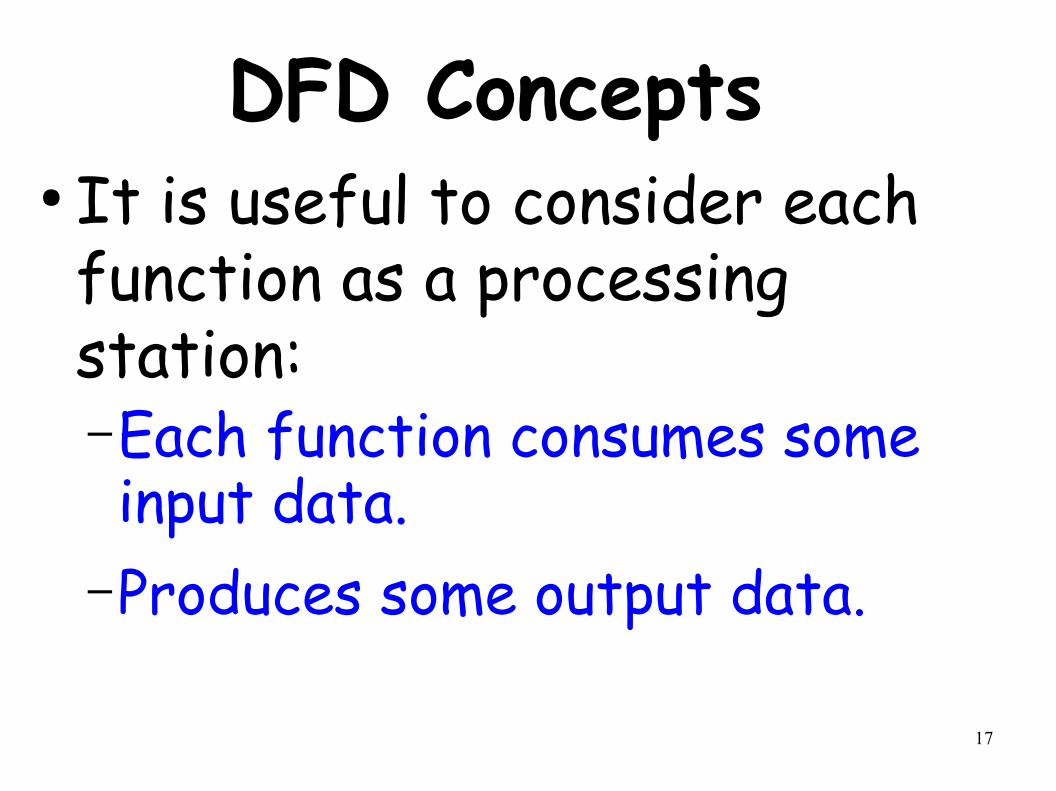
DFD Concepts● It is useful to consider each function as a processing station: –Each function consumes some input data.
–Produces some output data.
18
Data Flow Model of a Car Assembly Unit
FitEngine
Paint and Test
FitWheels
FitDoors
Chassis Store
Door Store
Wheel Store
Engine Store
Car
Partly Assembled Car
Assembled Car
Chassis with Engine
19
Data Flow Diagrams (DFDs)● A DFD model:
– Uses limited types of symbols.– Simple set of rules – Easy to understand:
● It is a hierarchical model.
20
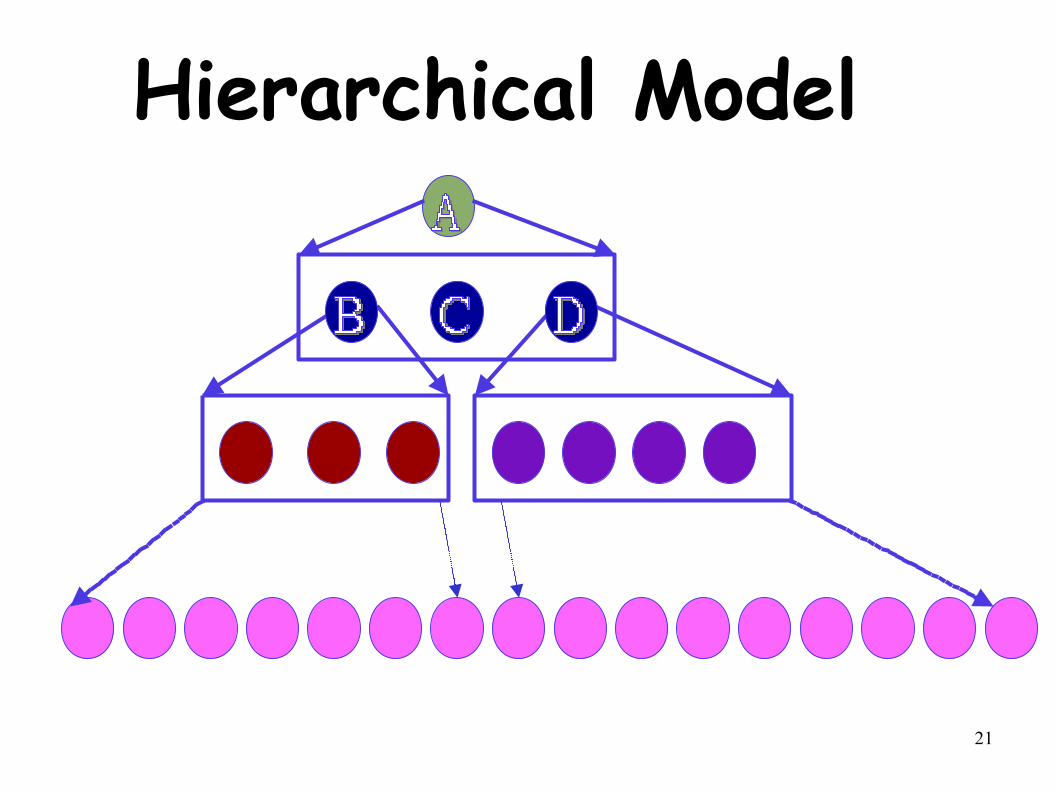
Hierarchical Model● Human mind can easily understand
any hierarchical model: – In a hierarchical model:
● We start with a very simple and abstract model of a system,
● Details are slowly introduced through the hierarchies.
21
Hierarchical Model
22
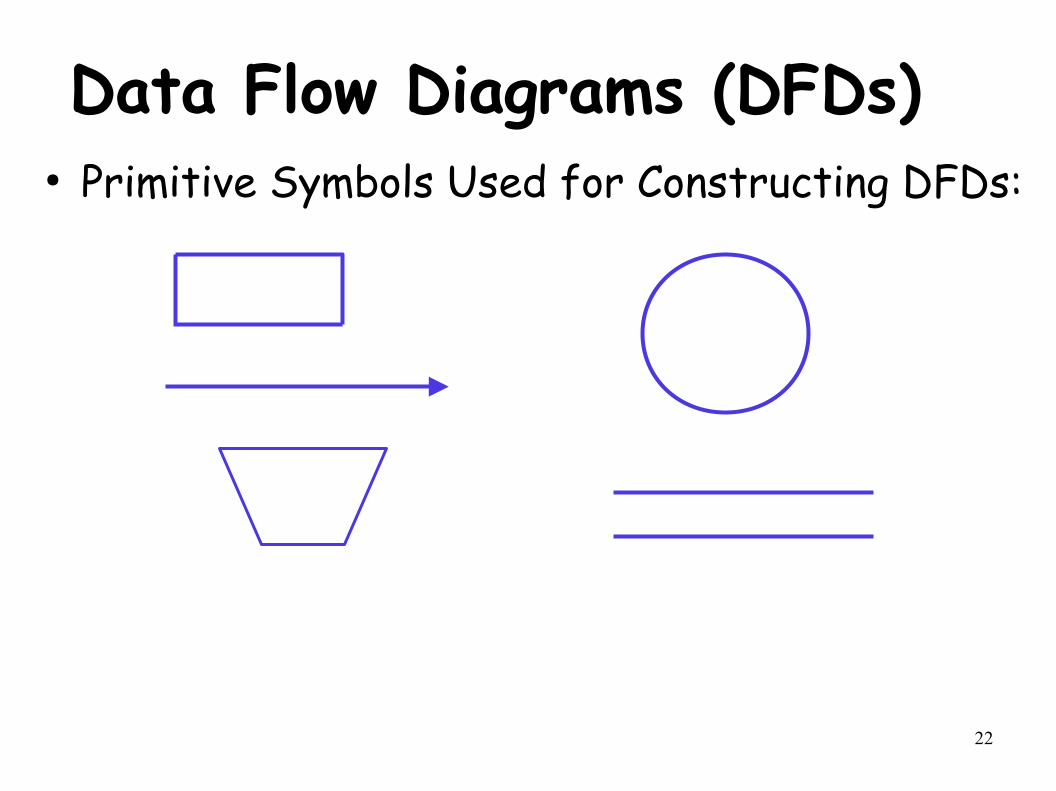
Data Flow Diagrams (DFDs)● Primitive Symbols Used for Constructing DFDs:
23
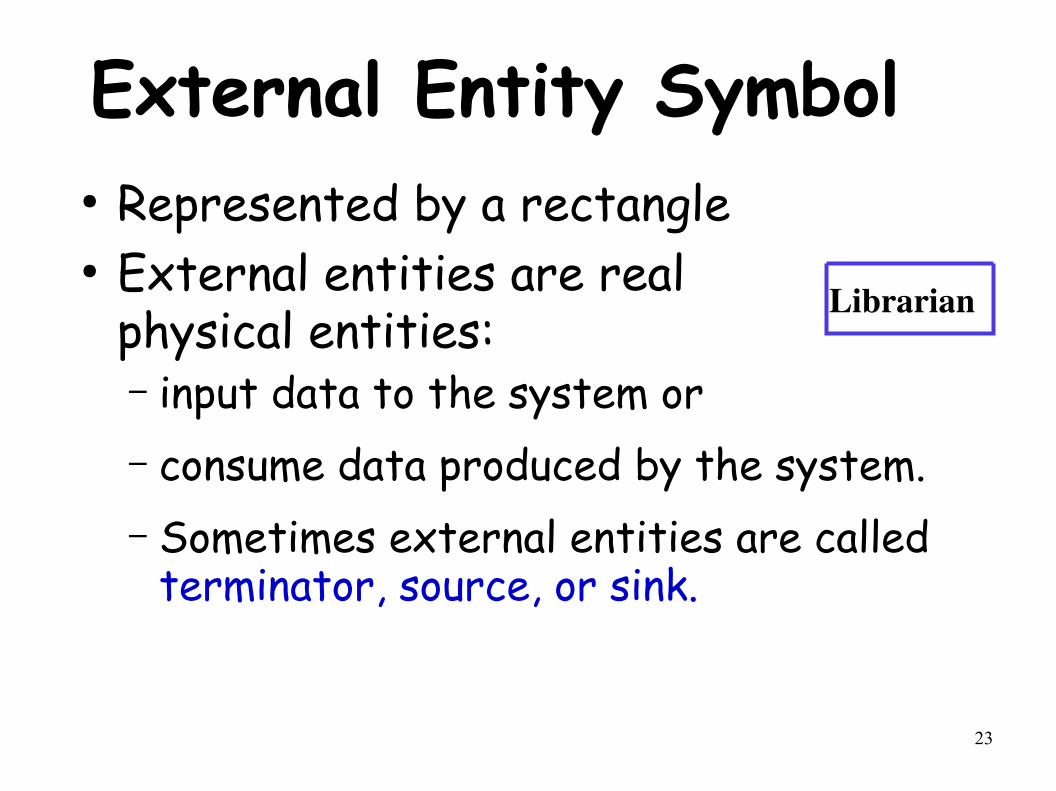
External Entity Symbol● Represented by a rectangle● External entities are real
physical entities:– input data to the system or– consume data produced by the system. – Sometimes external entities are called
terminator, source, or sink.
Librarian
24
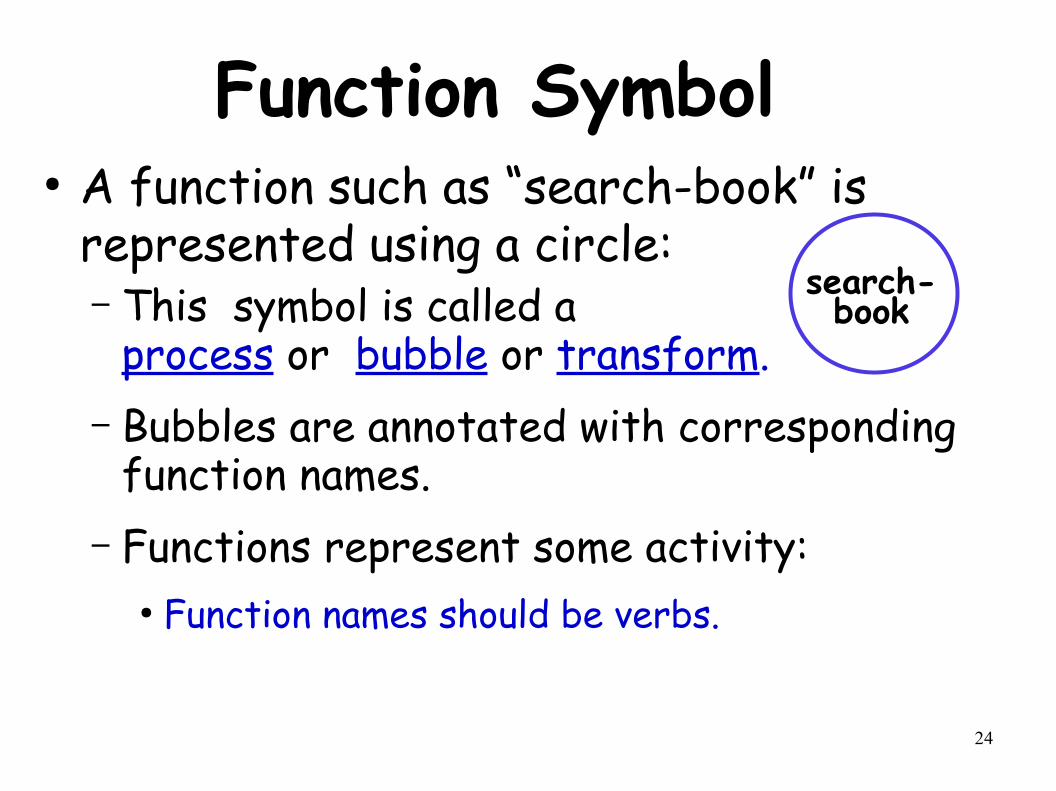
Function Symbol● A function such as “search-book” is
represented using a circle:– This symbol is called a
process or bubble or transform. – Bubbles are annotated with corresponding
function names.– Functions represent some activity:
● Function names should be verbs.
search-book
25
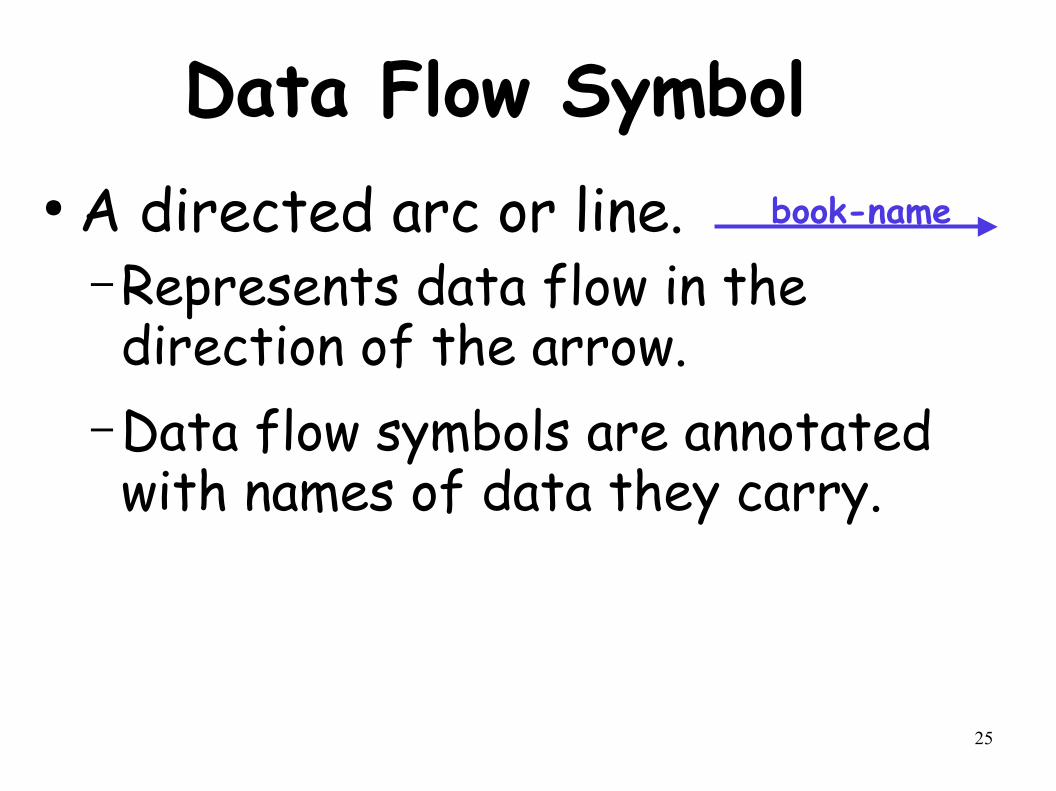
Data Flow Symbol● A directed arc or line.
– Represents data flow in the direction of the arrow.
– Data flow symbols are annotated with names of data they carry.
book-name
26
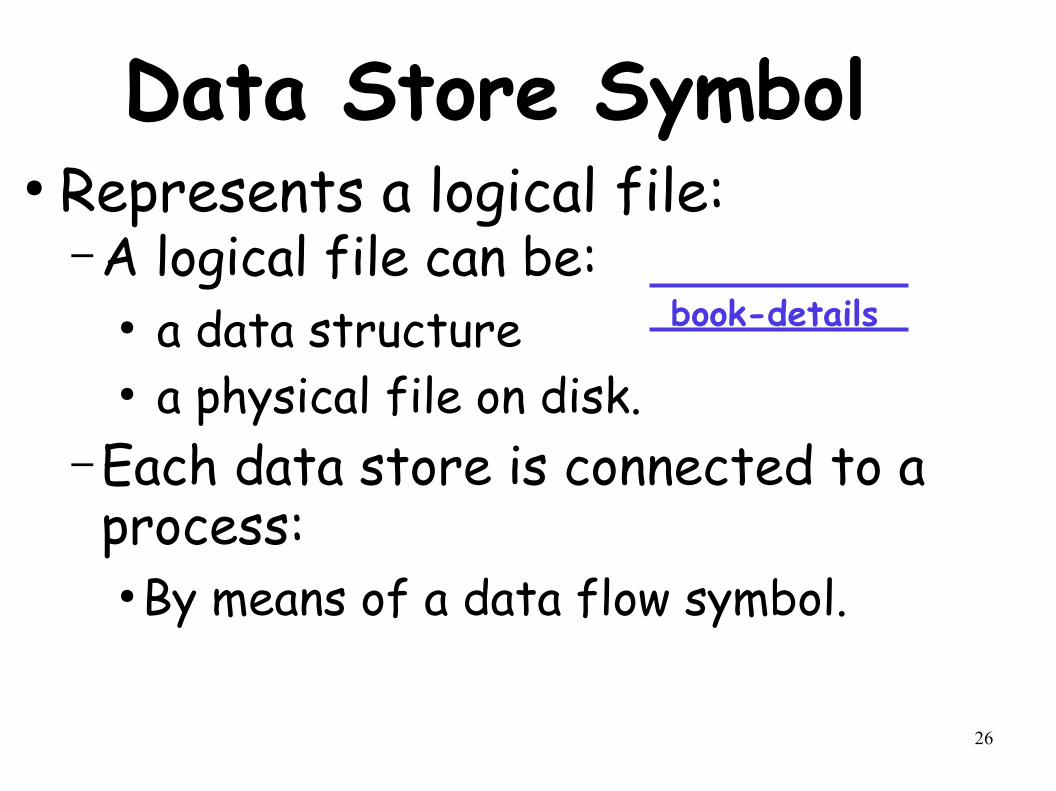
Data Store Symbol● Represents a logical file:
– A logical file can be:● a data structure ● a physical file on disk.
– Each data store is connected to a process:
● By means of a data flow symbol.
book-details
27
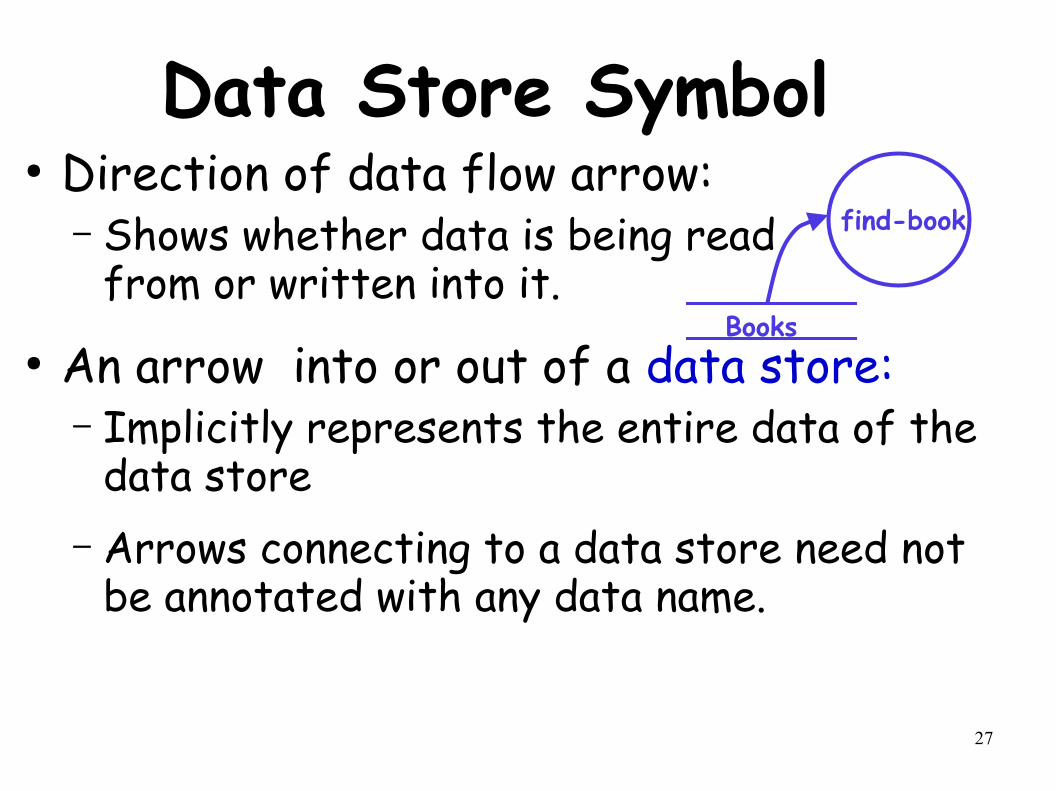
Data Store Symbol● Direction of data flow arrow:
– Shows whether data is being readfrom or written into it.
● An arrow into or out of a data store:– Implicitly represents the entire data of the
data store– Arrows connecting to a data store need not
be annotated with any data name.
find-book
Books
28
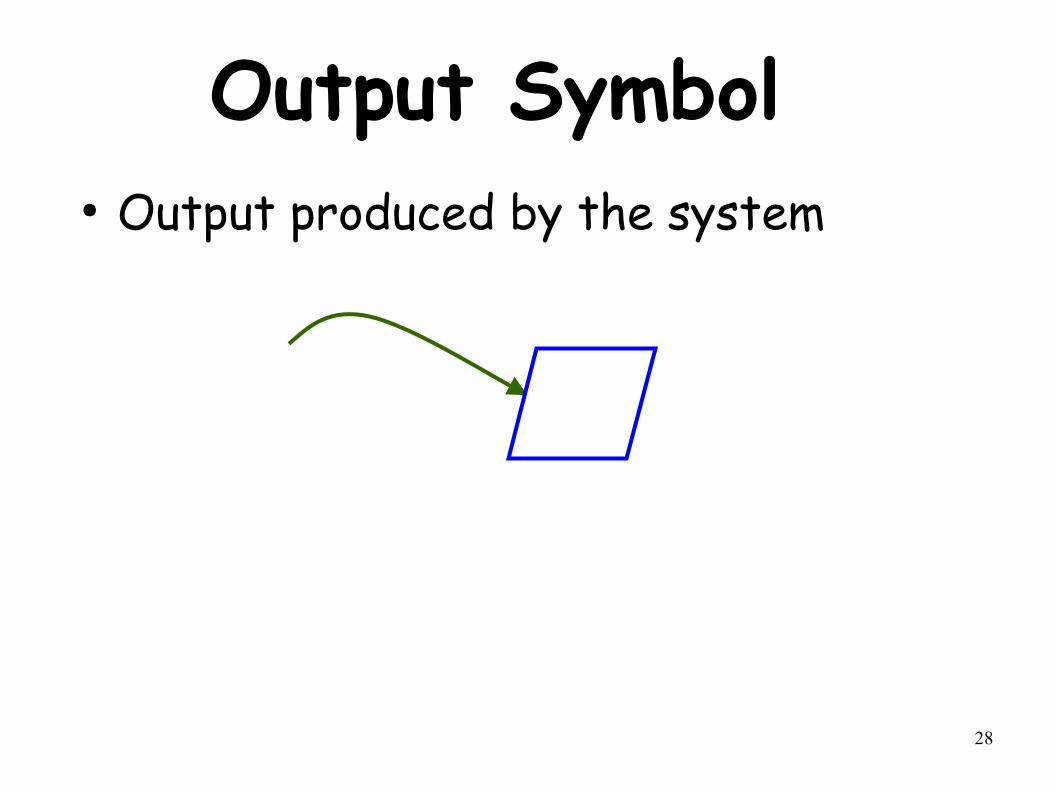
Output Symbol● Output produced by the system
29
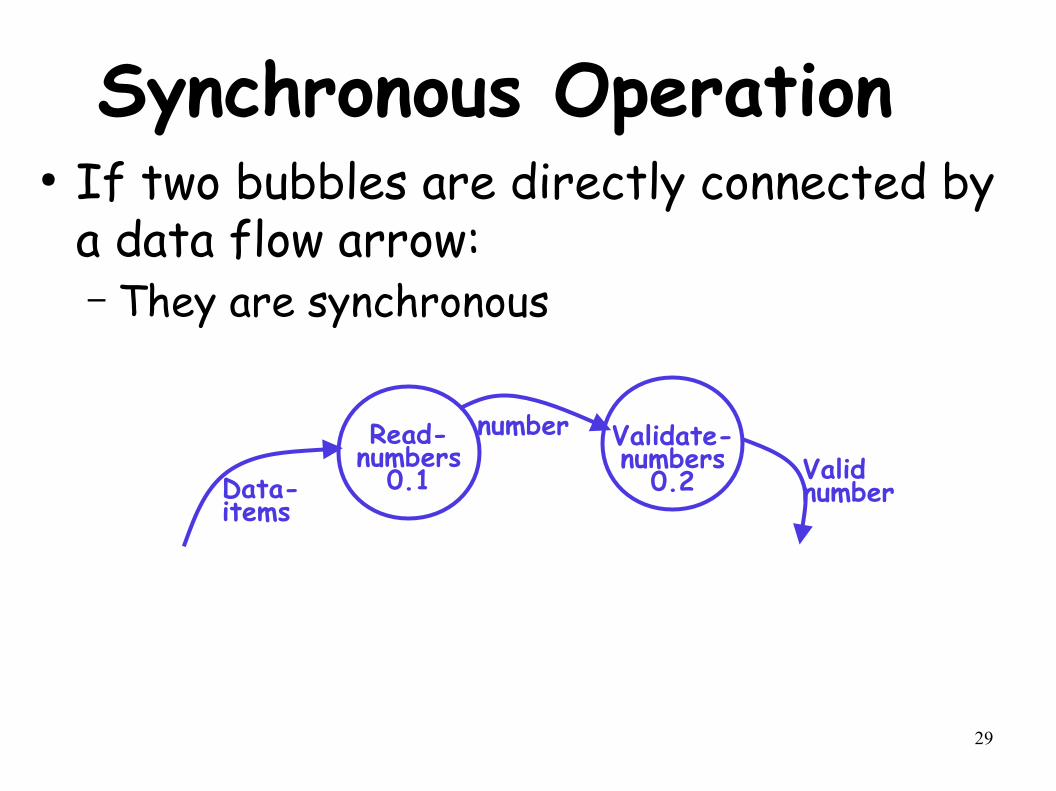
Synchronous Operation● If two bubbles are directly connected by
a data flow arrow:– They are synchronous
Data-items
Read-numbers
0.1Validate-numbers
0.2 Valid number
number
30
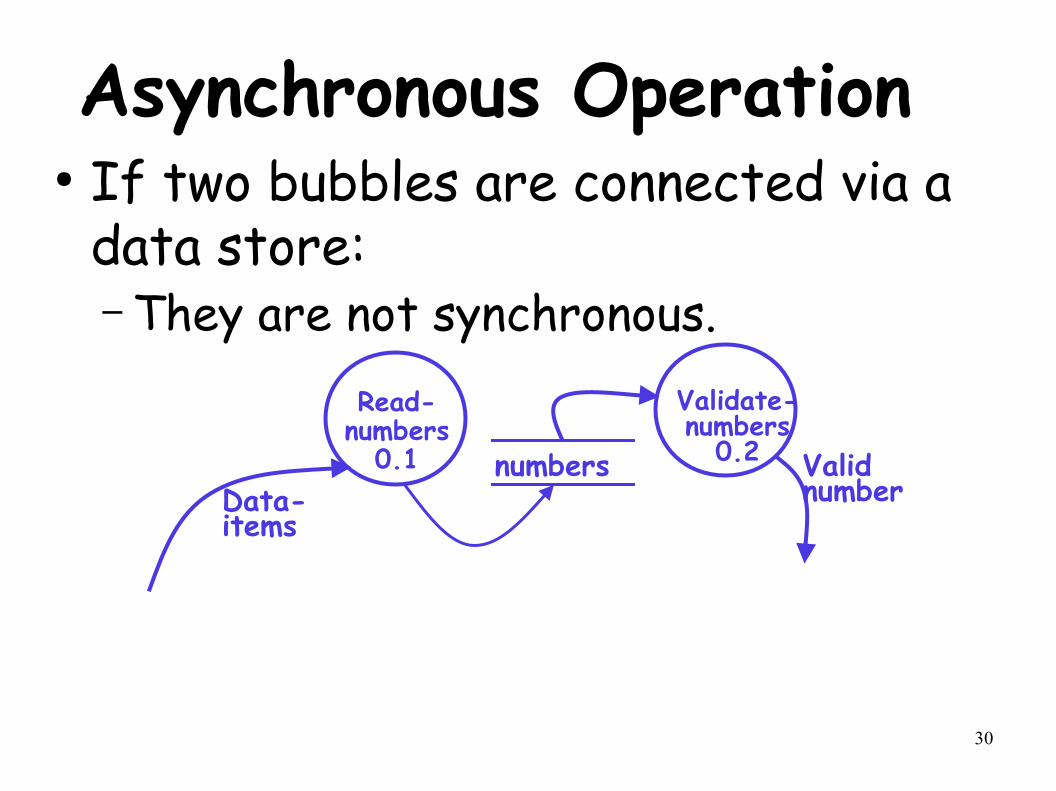
Asynchronous Operation● If two bubbles are connected via a
data store: – They are not synchronous.
Data-items
Read-numbers
0.1
Validate-numbers
0.2 Valid number
numbers
31
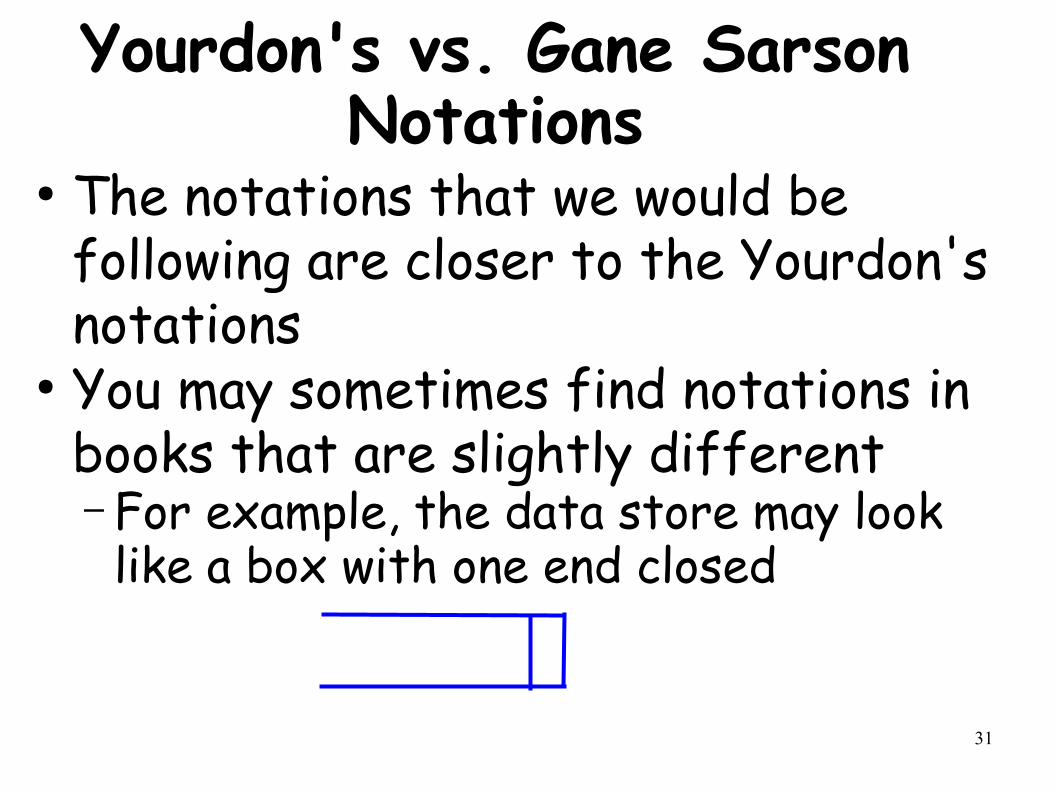
Yourdon's vs. Gane Sarson Notations
● The notations that we would be following are closer to the Yourdon's notations
● You may sometimes find notations in books that are slightly different– For example, the data store may look
like a box with one end closed
32
How is Structured Analysis Performed?
● Initially represent the software at the most abstract level:– Called the context diagram.– The entire system is represented as
a single bubble,– This bubble is labelled according to
the main function of the system.
33
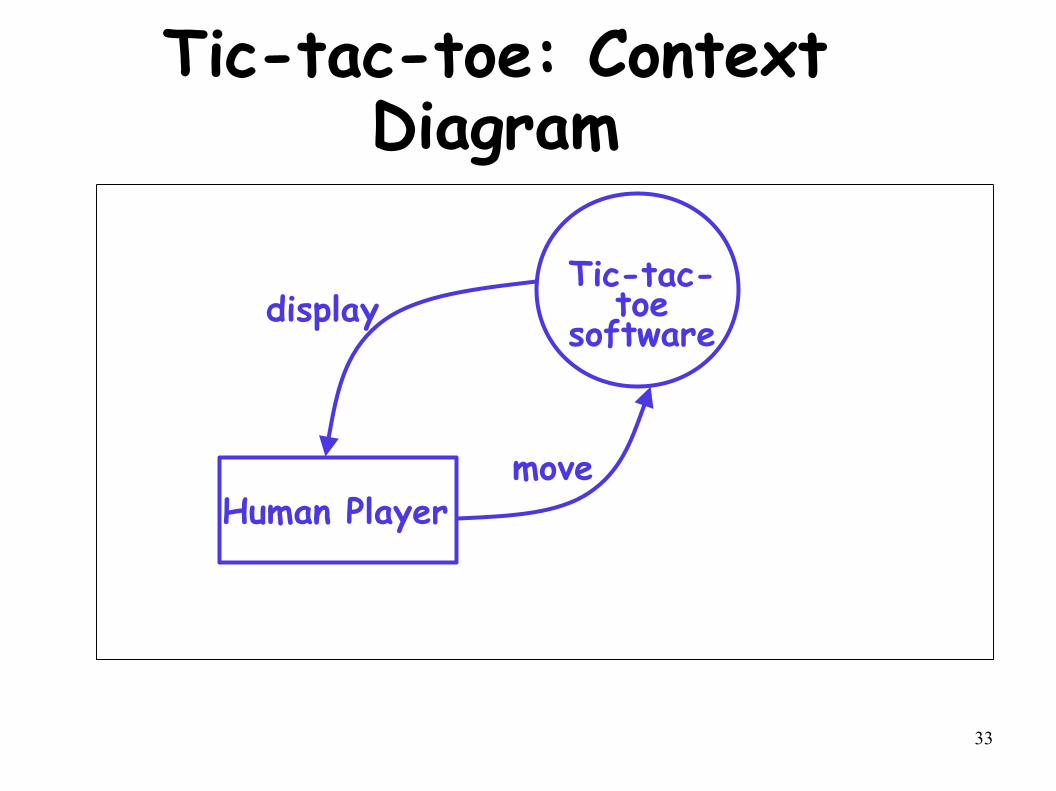
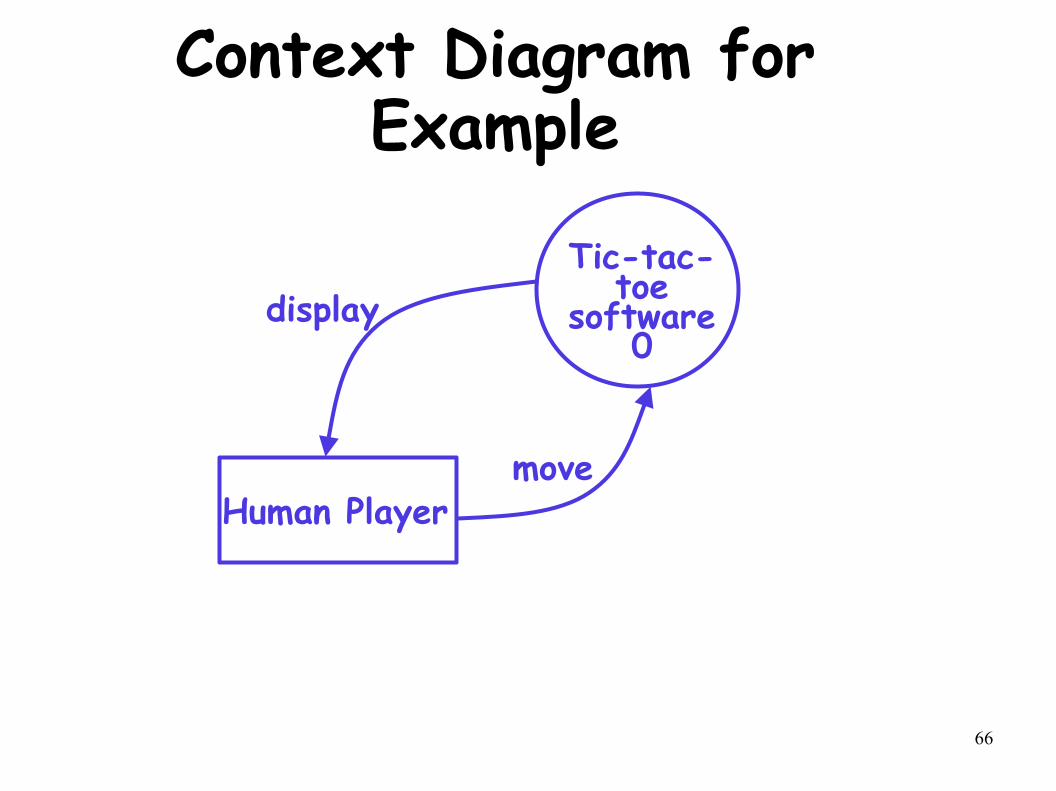
Tic-tac-toe: Context Diagram
Human Player
Tic-tac-toe
softwaredisplay
move
34
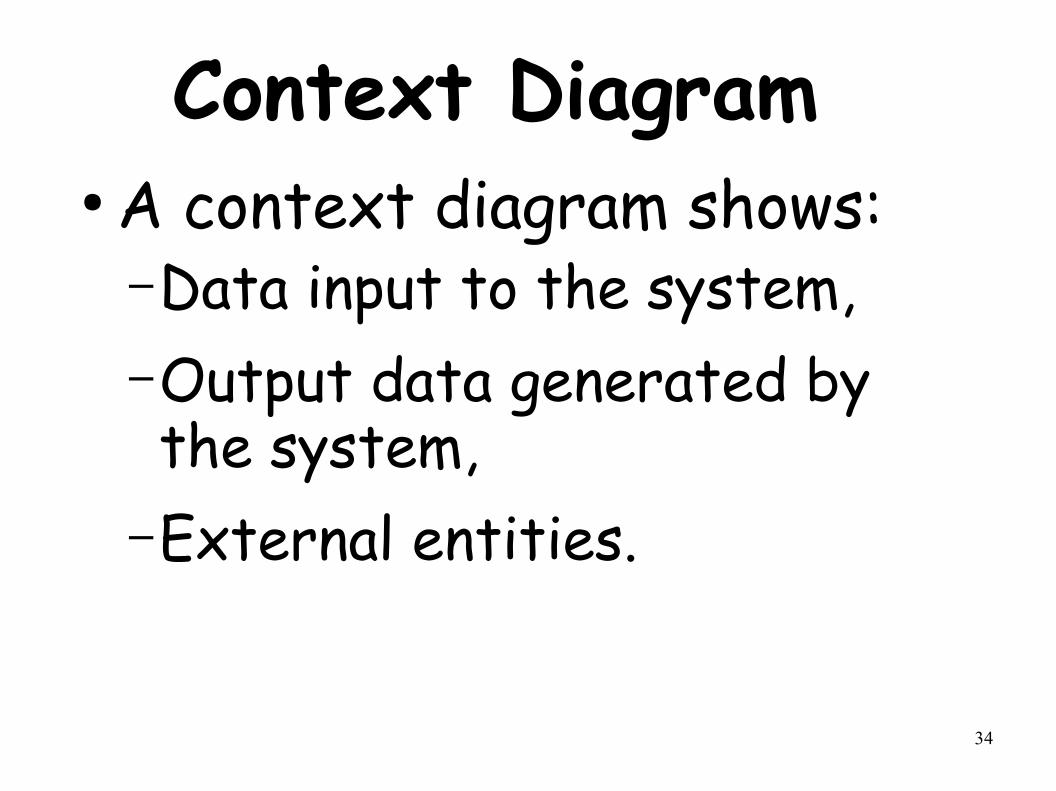
Context Diagram● A context diagram shows:
–Data input to the system, –Output data generated by the system,
–External entities.
35
Context Diagram● Context diagram captures:
– Various entities external to the system and interacting with it.
– Data flow occurring between the system and the external entities.
● The context diagram is also called as the level 0 DFD.
36
Context Diagram● Establishes the context of the system, i.e. –Represents:
●Data sources●Data sinks.
37
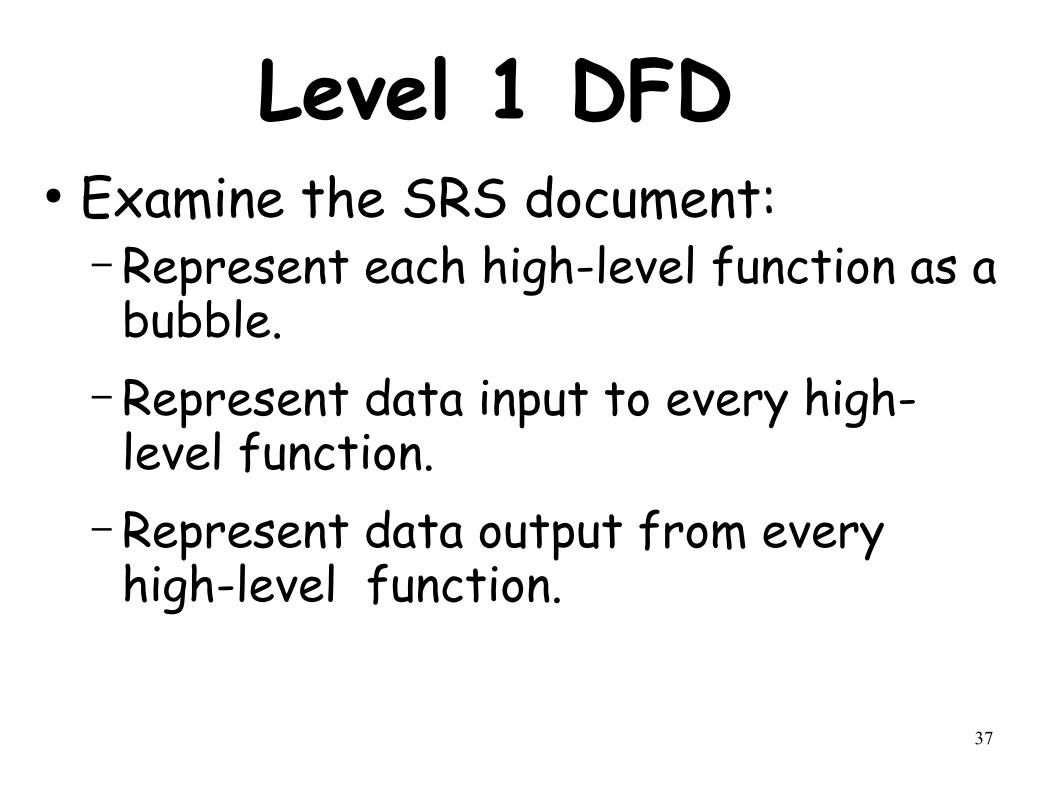
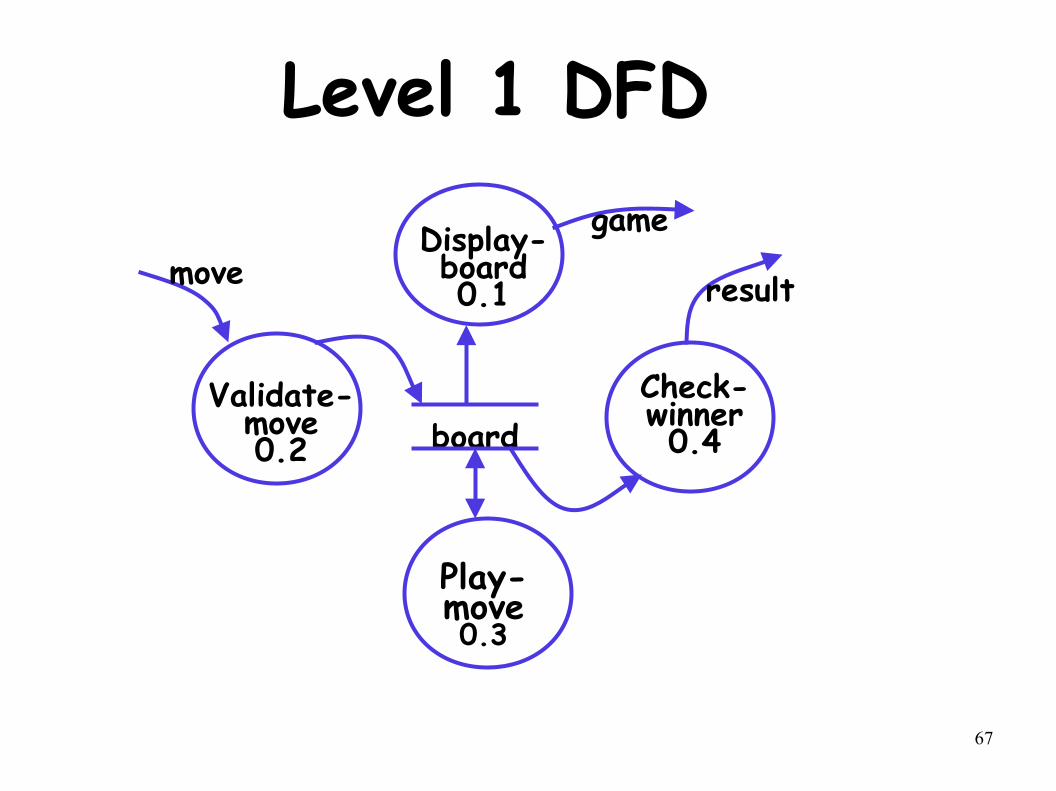
Level 1 DFD● Examine the SRS document:
– Represent each high-level function as a bubble.
– Represent data input to every high-level function.
– Represent data output from every high-level function.
38
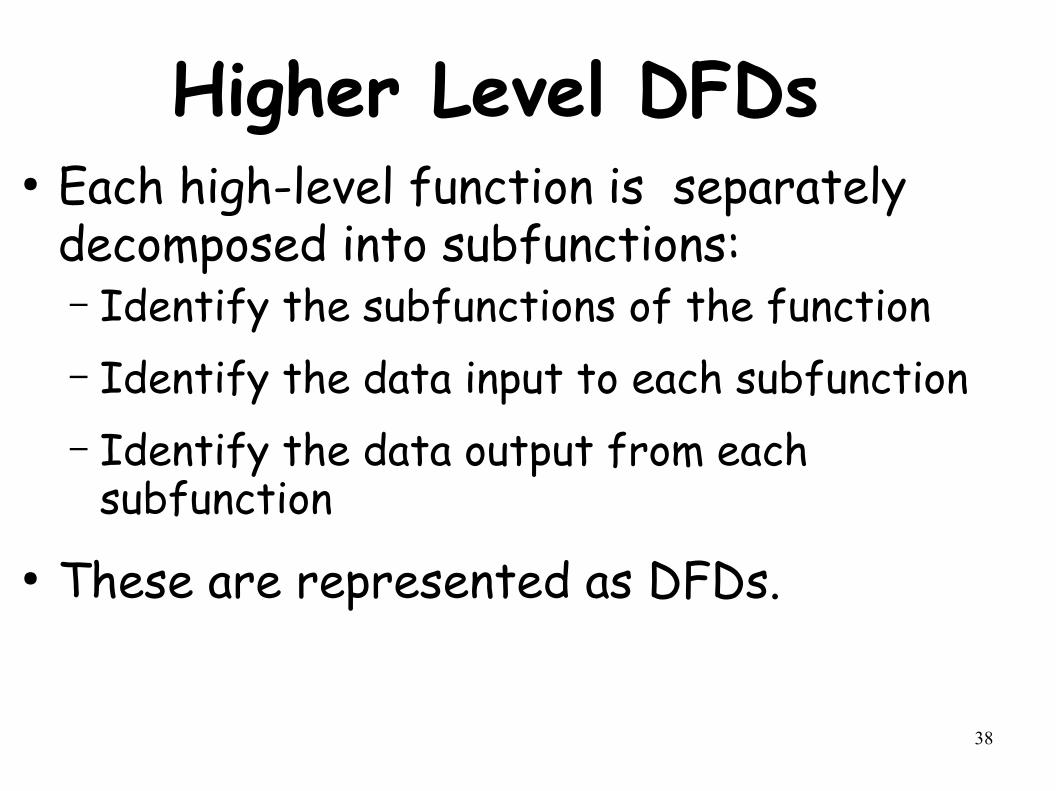
Higher Level DFDs● Each high-level function is separately
decomposed into subfunctions:– Identify the subfunctions of the function– Identify the data input to each subfunction– Identify the data output from each
subfunction ● These are represented as DFDs.
39
Decomposition● Decomposition of a bubble:
– Also called factoring or exploding.
● Each bubble is decomposed to– Between 3 to 7 bubbles.
40
Decomposition● Too few bubbles make decomposition superfluous:–If a bubble is decomposed to just one or two bubbles:
●Then this decomposition is redundant.
41
Decomposition● Too many bubbles:
–More than 7 bubbles at any level of a DFD.
–Make the DFD model hard to understand.
42
Decompose How Long?● Decomposition of a bubble should be carried on until:–A level at which the function of the bubble can be described using a simple algorithm.
43
Example 1: RMS Calculating Software
● Consider a software called RMS calculating software: – Reads three integers in the range of
-1000 and +1000 – Finds out the root mean square (rms)
of the three input numbers – Displays the result.
44
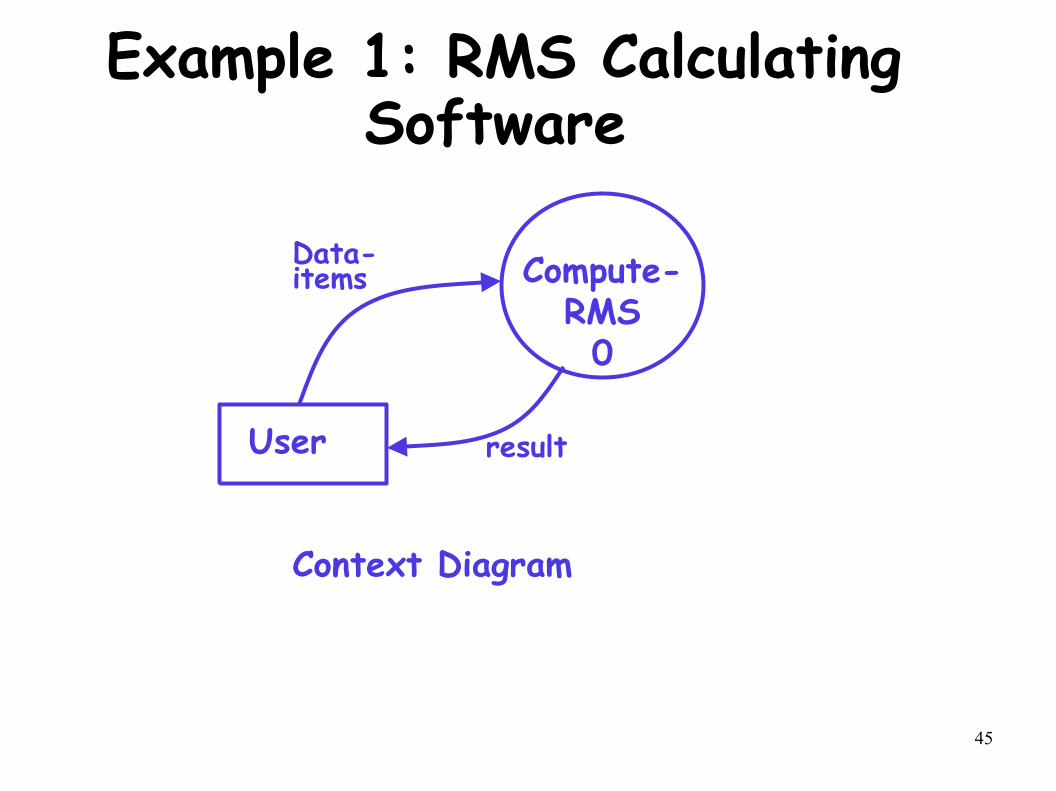
Example 1: RMS Calculating Software
● The context diagram is simple to develop: –The system accepts 3 integers from the user
–Returns the result to him.
45
Example 1: RMS Calculating Software
Compute- RMS0
User
Data-items
result
Context Diagram
46
Example 1: RMS Calculating Software
● From a cursory analysis of the problem description: –We can see that the system needs to perform several things.
47
Example 1: RMS Calculating Software
● Accept input numbers from the user: – Validate the numbers,– Calculate the root mean square of the input numbers
– Display the result.
48
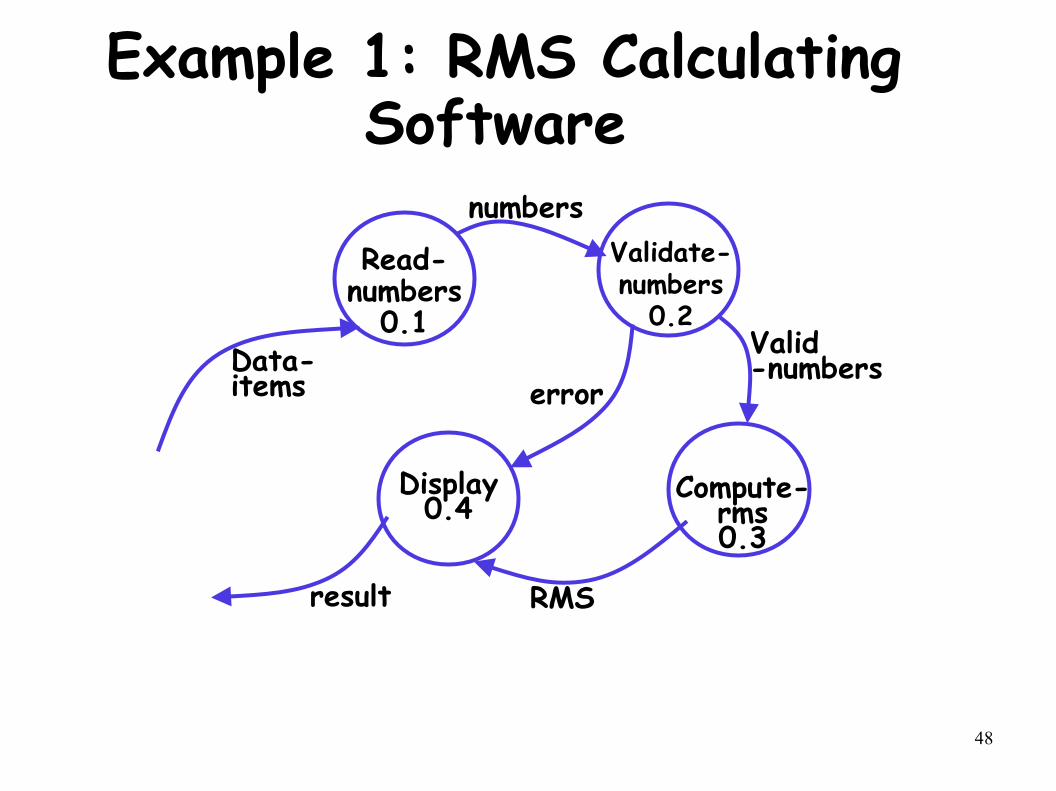
Example 1: RMS Calculating Software
Data-items
result
Read-numbers
0.1
Validate-numbers
0.2
Compute-rms0.3
Display0.4
RMS
numbers
Valid -numbers
error
49
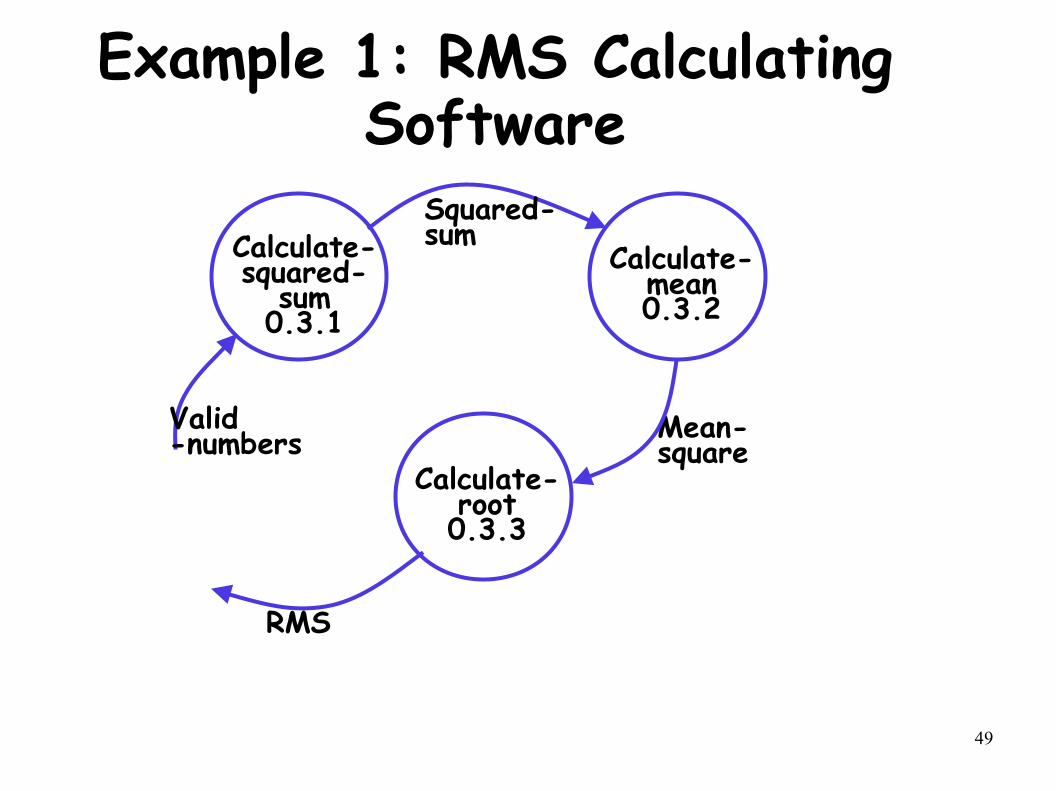
Example 1: RMS Calculating Software
Calculate-squared-
sum0.3.1
Calculate-mean0.3.2
Calculate-root0.3.3
Valid -numbers
Squared-sum
RMS
Mean-square
50
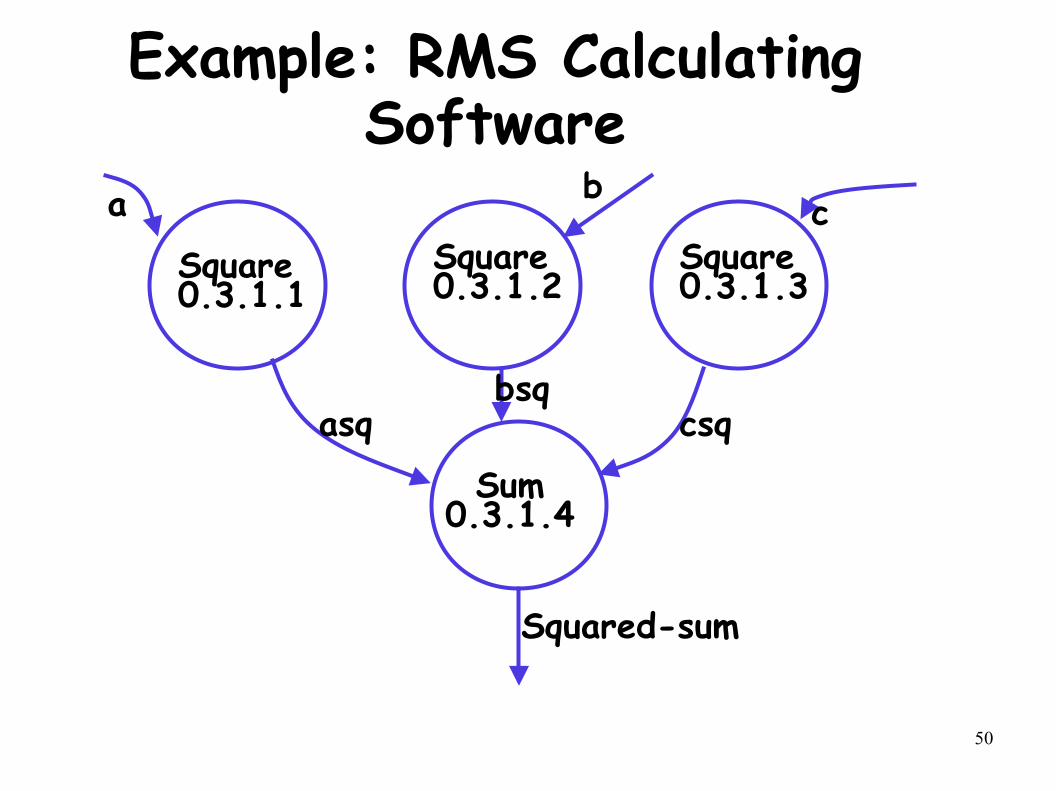
Example: RMS Calculating Software
Square0.3.1.1
Square0.3.1.2
Square0.3.1.3
Sum0.3.1.4
a bc
asqbsq
csq
Squared-sum
51
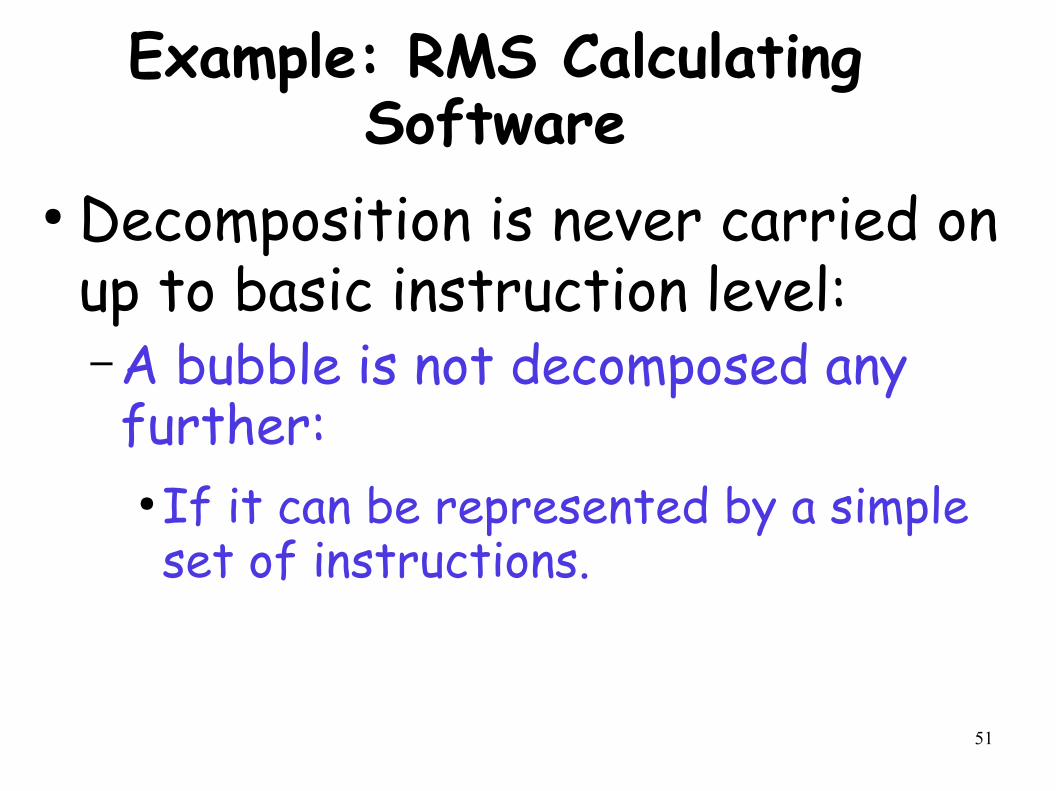
Example: RMS Calculating Software
● Decomposition is never carried on up to basic instruction level:– A bubble is not decomposed any further:
● If it can be represented by a simple set of instructions.
52
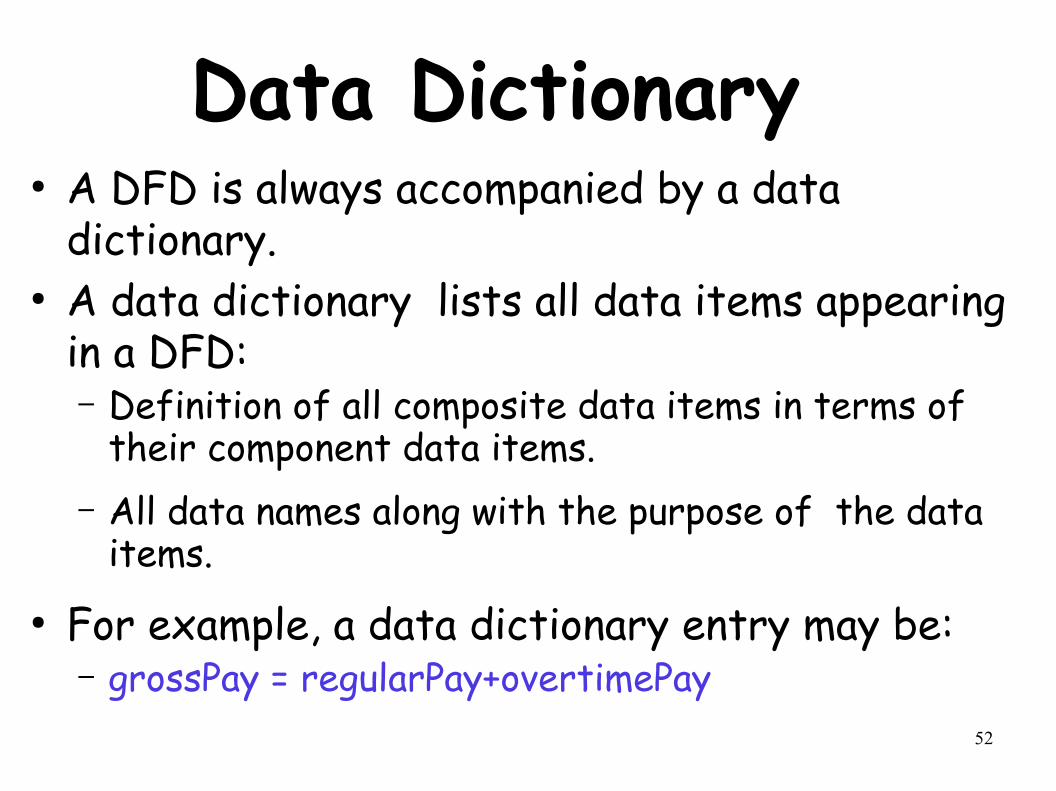
Data Dictionary● A DFD is always accompanied by a data
dictionary.● A data dictionary lists all data items appearing
in a DFD: – Definition of all composite data items in terms of
their component data items. – All data names along with the purpose of the data
items.● For example, a data dictionary entry may be:
– grossPay = regularPay+overtimePay
53
Importance of Data Dictionary
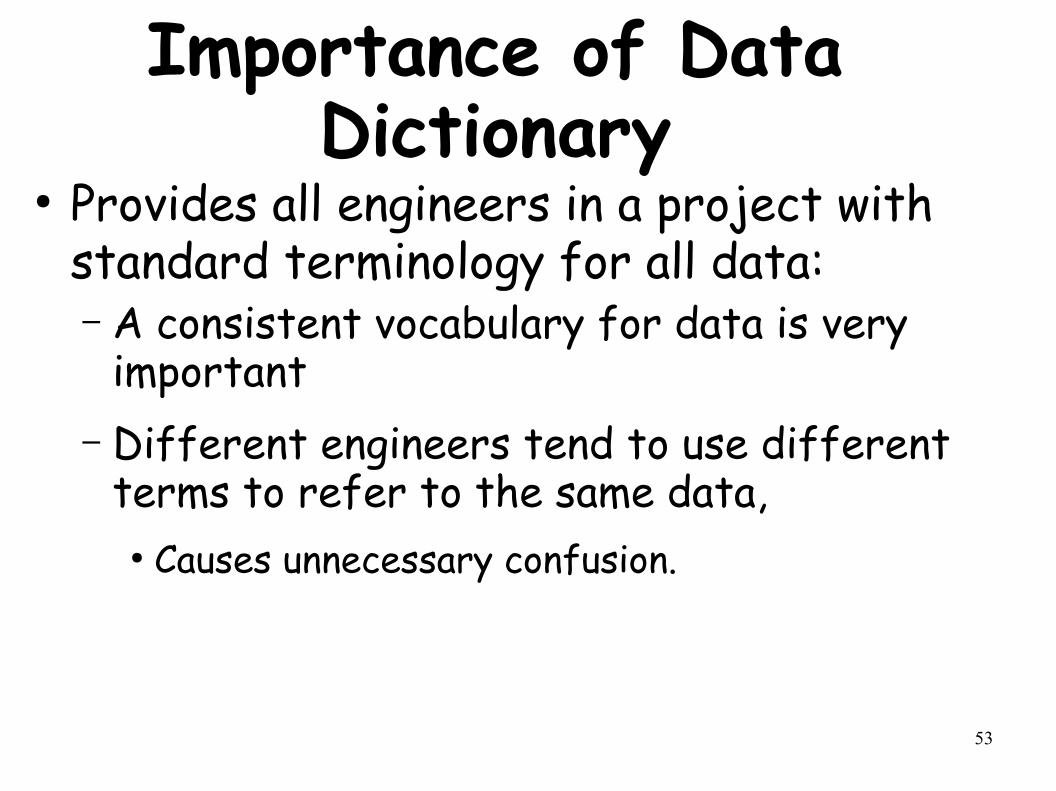
● Provides all engineers in a project with standard terminology for all data: – A consistent vocabulary for data is very
important– Different engineers tend to use different
terms to refer to the same data, ● Causes unnecessary confusion.
54
Importance of Data Dictionary
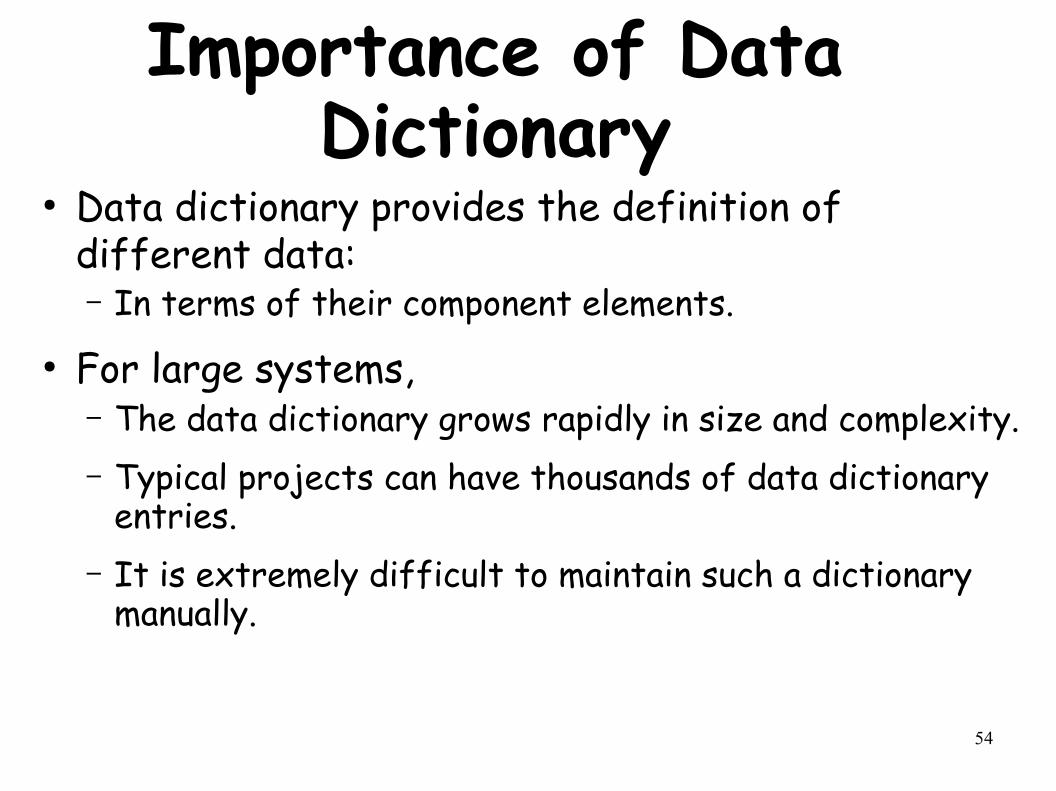
● Data dictionary provides the definition of different data:– In terms of their component elements.
● For large systems,– The data dictionary grows rapidly in size and complexity.– Typical projects can have thousands of data dictionary
entries.– It is extremely difficult to maintain such a dictionary
manually.
55
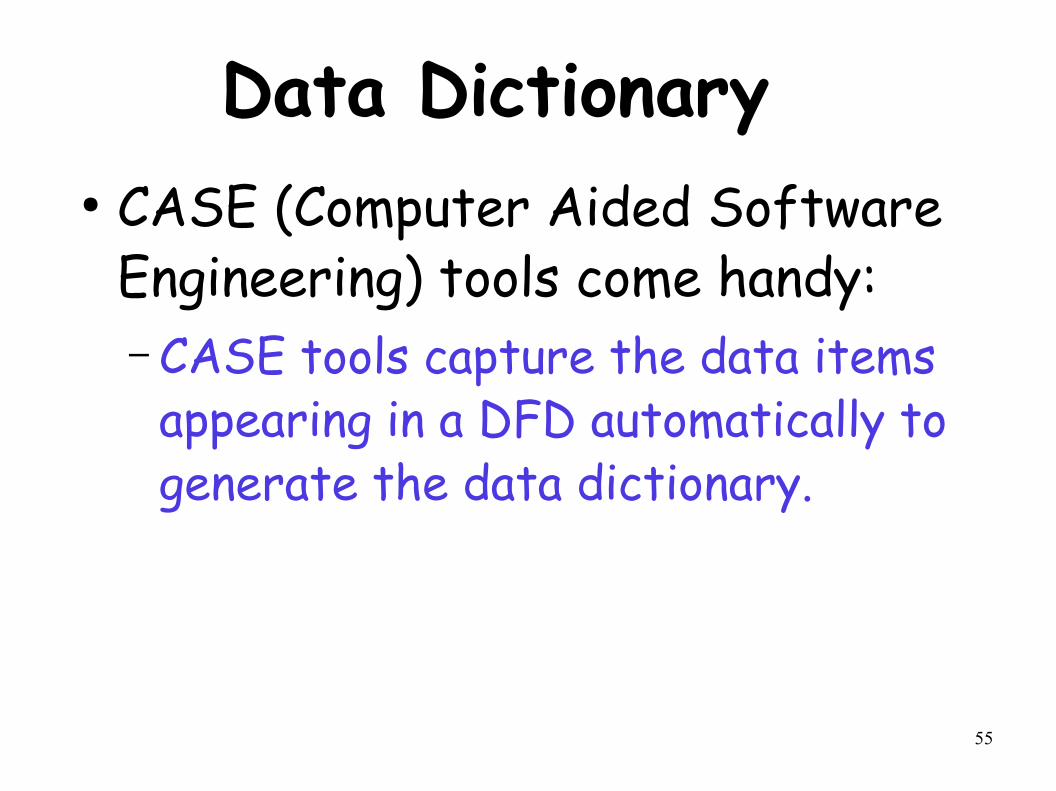
Data Dictionary● CASE (Computer Aided Software
Engineering) tools come handy:– CASE tools capture the data items
appearing in a DFD automatically to generate the data dictionary.
56
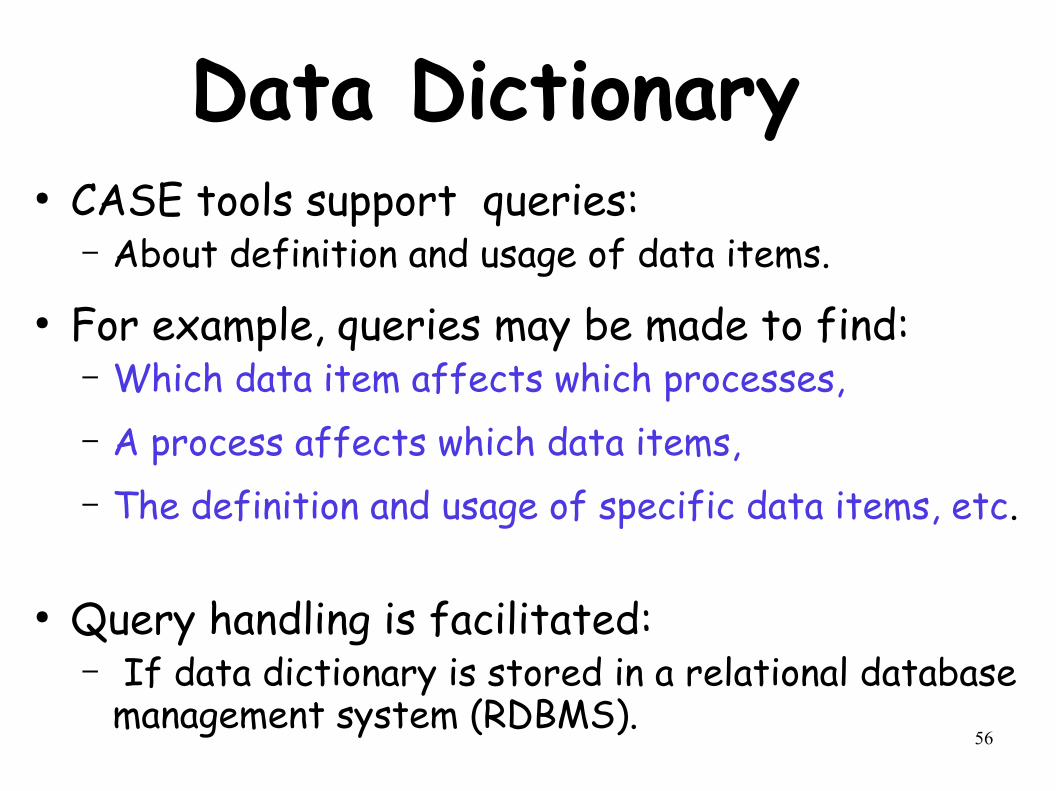
Data Dictionary● CASE tools support queries:
– About definition and usage of data items. ● For example, queries may be made to find:
– Which data item affects which processes, – A process affects which data items, – The definition and usage of specific data items, etc.
● Query handling is facilitated:
– If data dictionary is stored in a relational database management system (RDBMS).
57
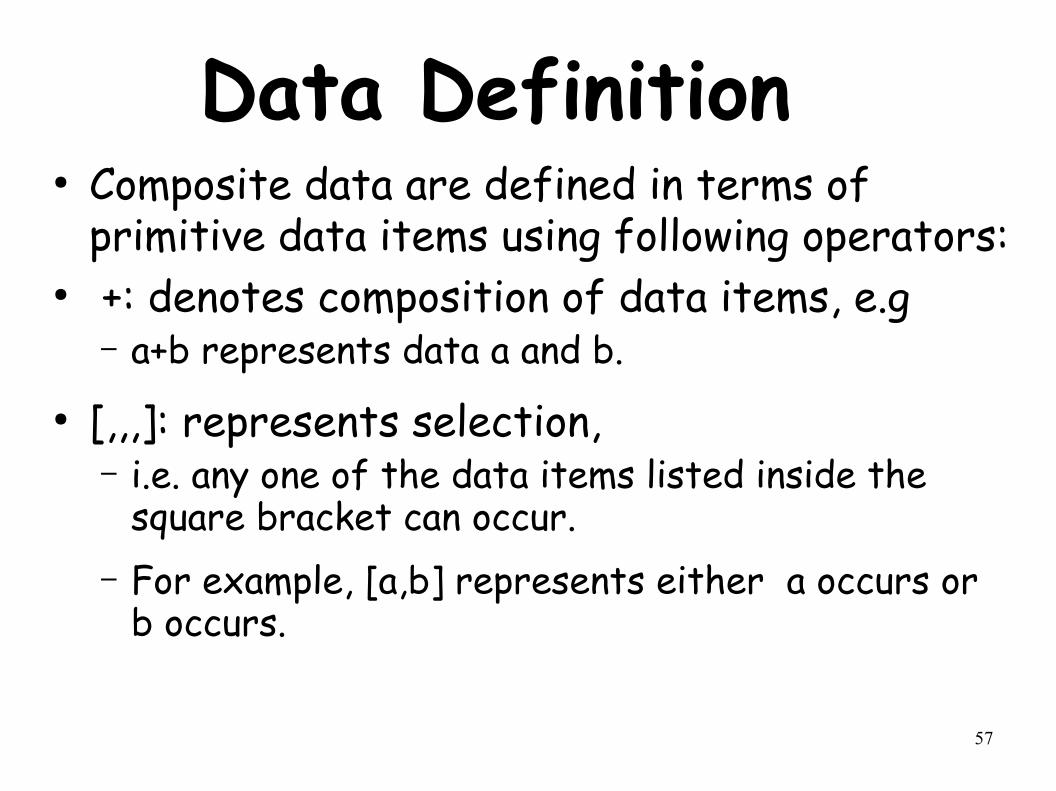
Data Definition● Composite data are defined in terms of
primitive data items using following operators:● +: denotes composition of data items, e.g
– a+b represents data a and b.● [,,,]: represents selection,
– i.e. any one of the data items listed inside the square bracket can occur.
– For example, [a,b] represents either a occurs or b occurs.
58
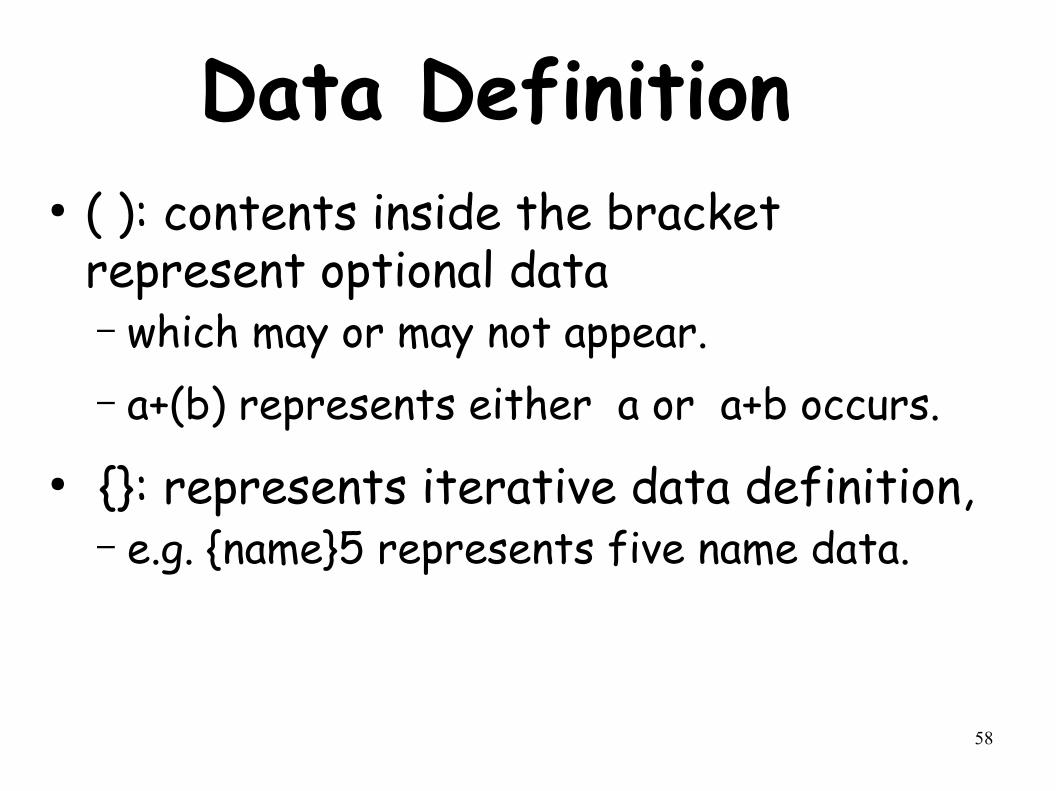
Data Definition● ( ): contents inside the bracket
represent optional data – which may or may not appear. – a+(b) represents either a or a+b occurs.
● {}: represents iterative data definition, – e.g. {name}5 represents five name data.
59
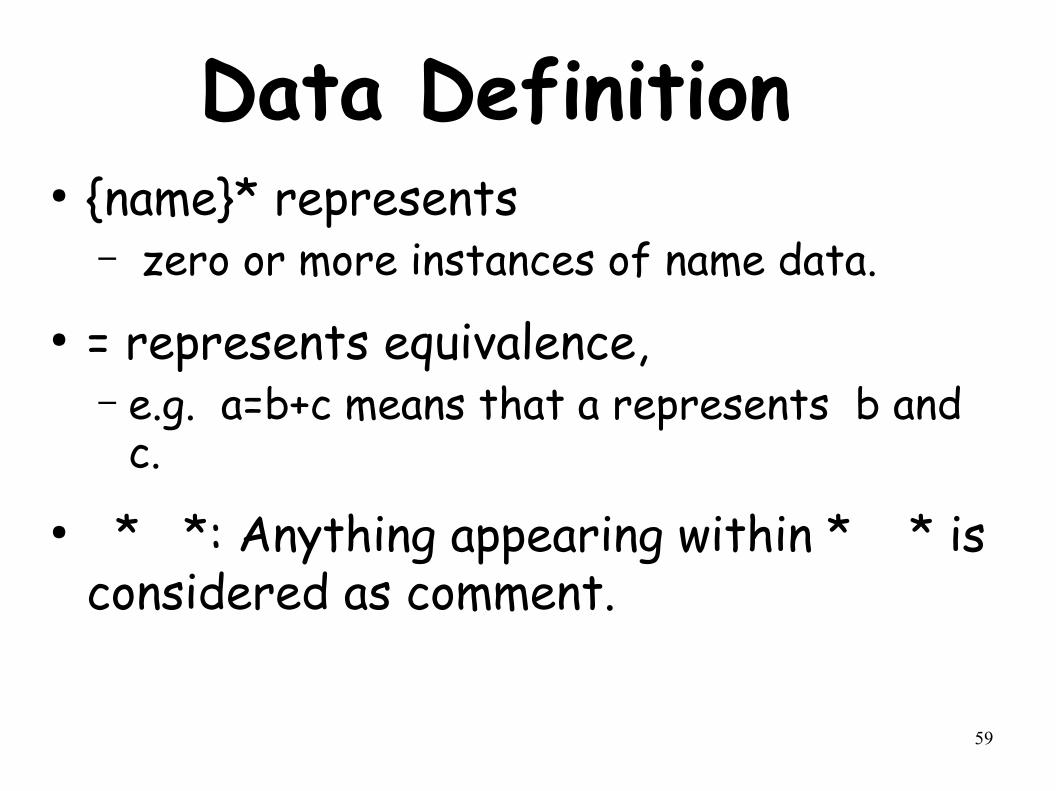
Data Definition● {name}* represents
– zero or more instances of name data.● = represents equivalence,
– e.g. a=b+c means that a represents b and c.
● * *: Anything appearing within * * is considered as comment.
60
Data Dictionary for RMS Software
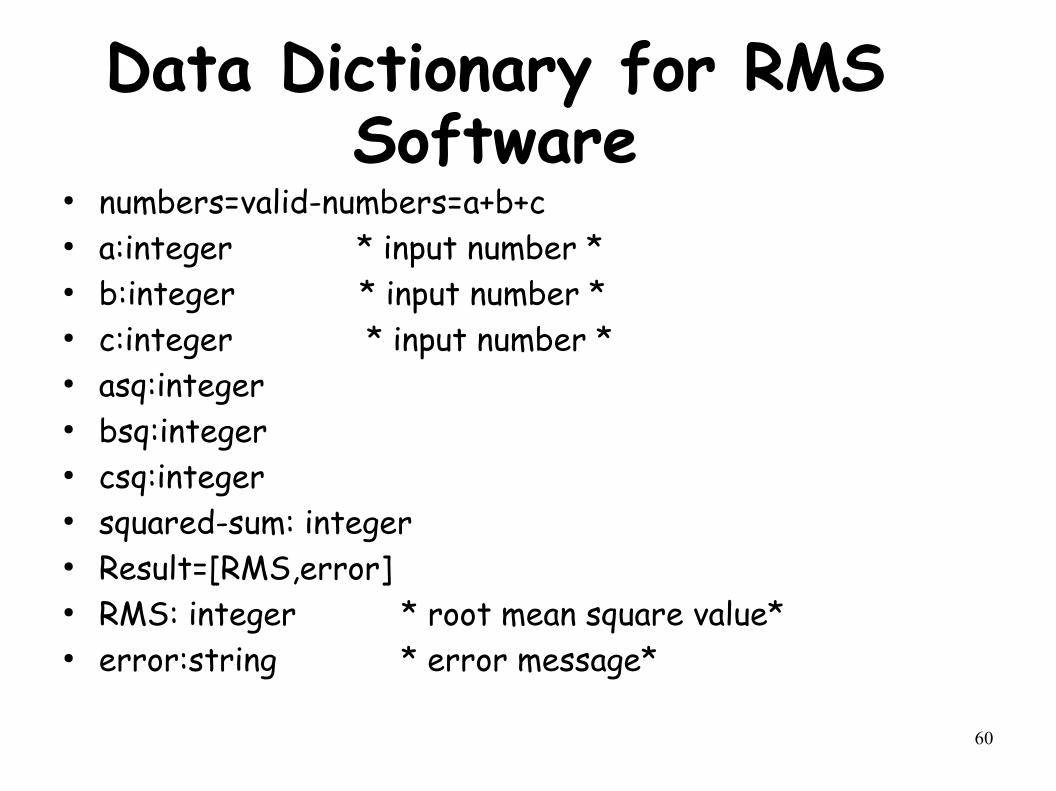
● numbers=valid-numbers=a+b+c● a:integer * input number *● b:integer * input number *● c:integer * input number *● asq:integer● bsq:integer● csq:integer● squared-sum: integer● Result=[RMS,error]● RMS: integer * root mean square value*● error:string * error message*
61
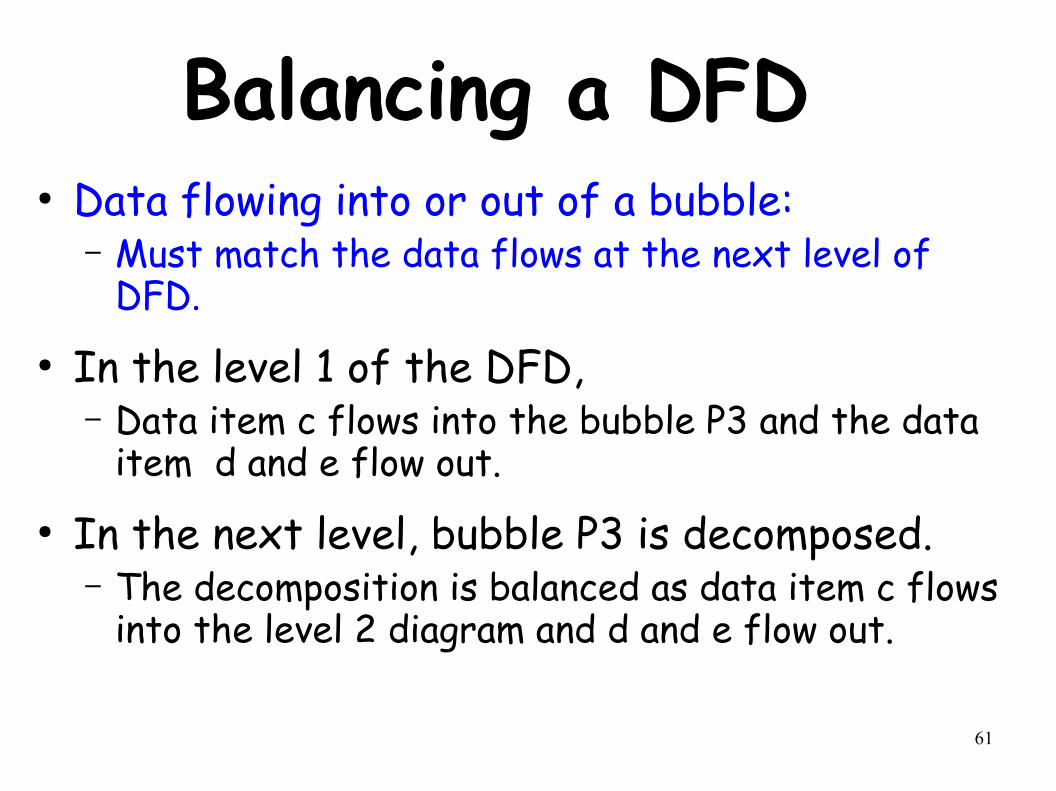
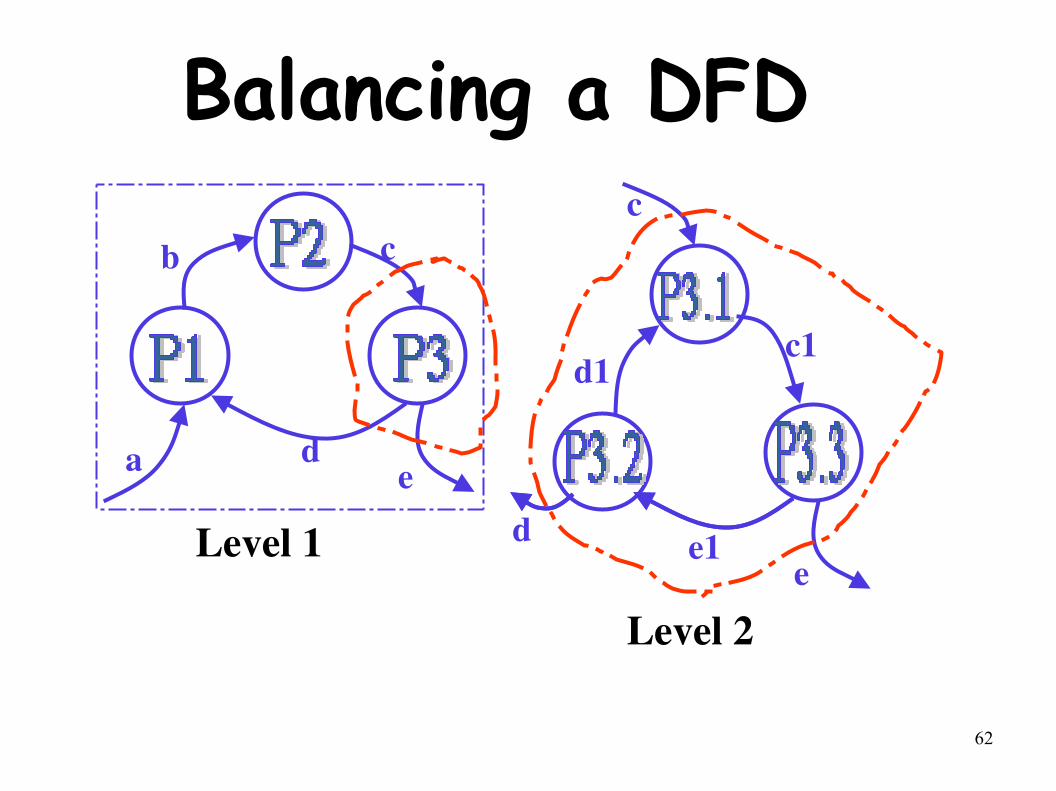
Balancing a DFD● Data flowing into or out of a bubble:
– Must match the data flows at the next level of DFD.
● In the level 1 of the DFD, – Data item c flows into the bubble P3 and the data
item d and e flow out. ● In the next level, bubble P3 is decomposed.
– The decomposition is balanced as data item c flows into the level 2 diagram and d and e flow out.
62
Balancing a DFD
a
b
ed
cc
de
c1d1
e1Level 1
Level 2
63
Numbering of Bubbles● Number the bubbles in a DFD:
– Numbers help in uniquely identifying any bubble from its bubble number.
● The bubble at context level:– Assigned number 0.
● Bubbles at level 1:– Numbered 0.1, 0.2, 0.3, etc
● When a bubble numbered x is decomposed, – Its children bubble are numbered x.1, x.2, x.3, etc.
64
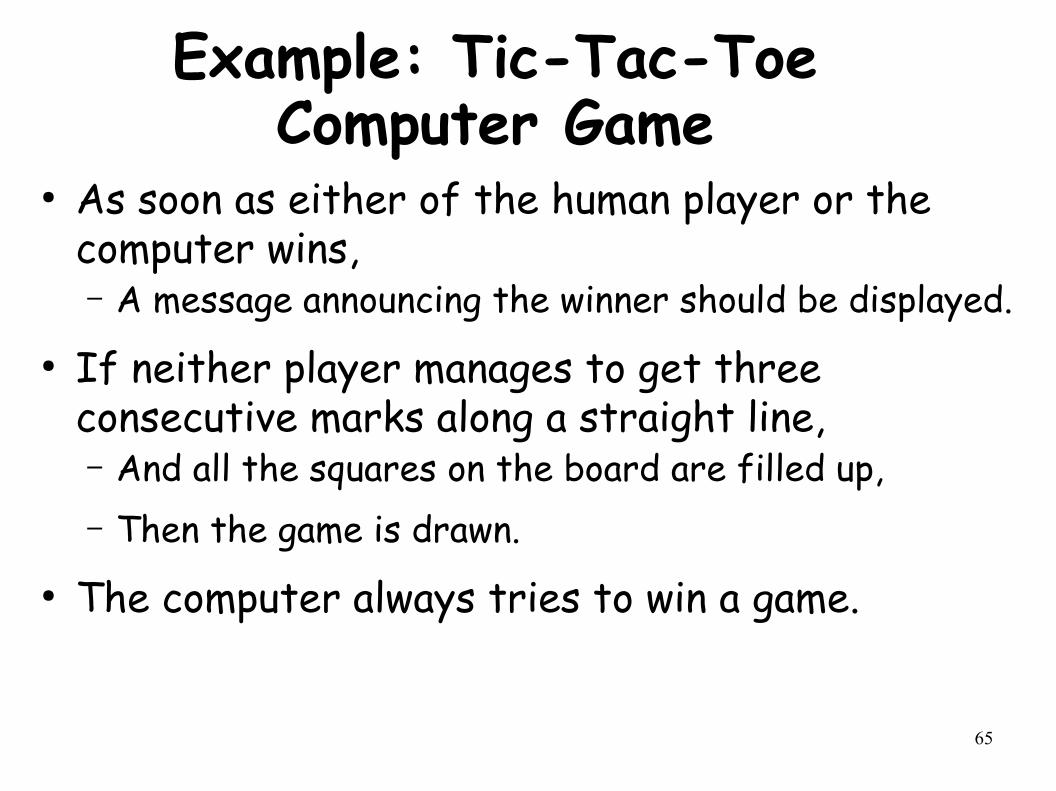
Example 2: Tic-Tac-Toe Computer Game
● A human player and the computer make alternate moves on a 3 X 3 square.
● A move consists of marking a previously unmarked square.
● The user inputs a number between 1 and 9 to mark a square
● Whoever is first to place three consecutive marks along a straight line (i.e., along a row, column, or diagonal) on the square wins.
65
Example: Tic-Tac-Toe Computer Game
● As soon as either of the human player or the computer wins, – A message announcing the winner should be displayed.
● If neither player manages to get three consecutive marks along a straight line, – And all the squares on the board are filled up, – Then the game is drawn.
● The computer always tries to win a game.
66
Context Diagram for Example
Human Player
Tic-tac-toe
software0
display
move
67
Level 1 DFD
board
Display-board0.1
Check-winner0.4
Validate-move0.2
Play-move0.3
move result
game
68
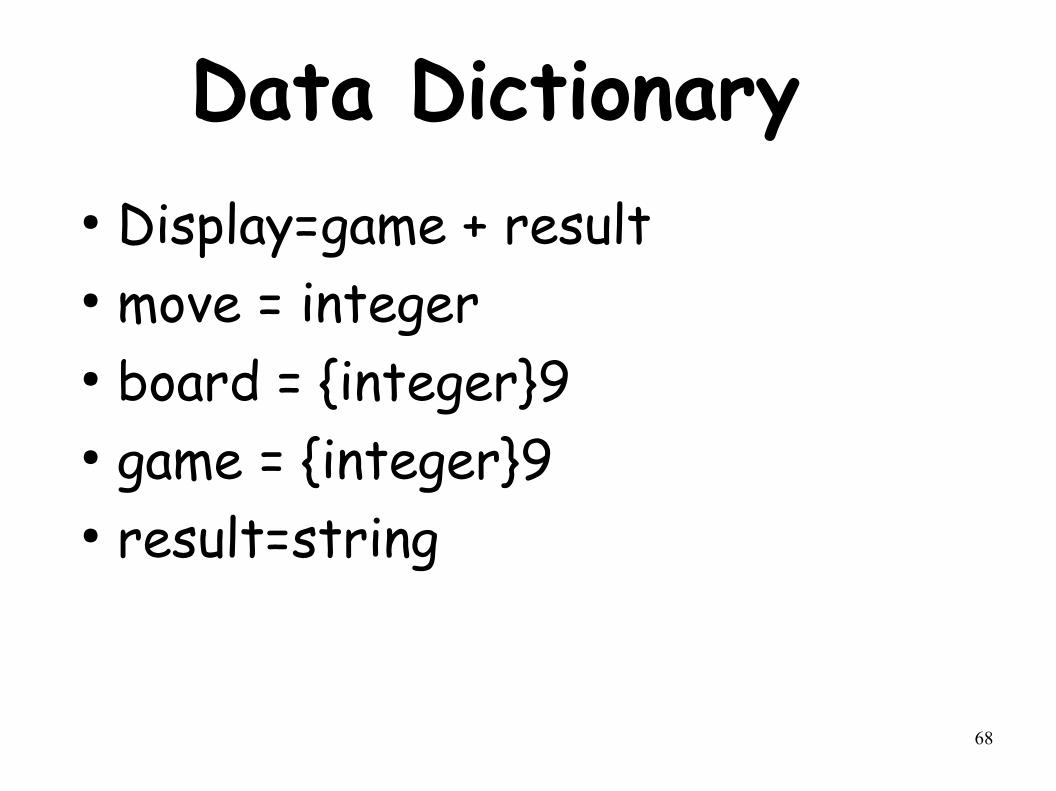
Data Dictionary● Display=game + result● move = integer● board = {integer}9● game = {integer}9● result=string
69
Summary● We discussed a sample function-oriented
software design methodology:– Structured Analysis/Structured
Design(SA/SD)– Incorporates features from some important
design methodologies.● SA/SD consists of two parts:
– Structured analysis– Structured design.
70
Summary● The goal of structured analysis:
– functional decomposition of the system. ● Results of structured analysis:
– represented using Data Flow Diagrams (DFDs).
● We examined why any hierarchical model is easy to understand.– Number 7 is called the magic number.
71
Summary● During structured design,
– The DFD representation is transformed to a structure chart representation.
● DFDs are very popular:– Because it is a very simple technique.
72
Summary● A DFD model:
– Difficult to implement using a programming language:
– Structure chart representation can be easily implemented using a programming language.
73
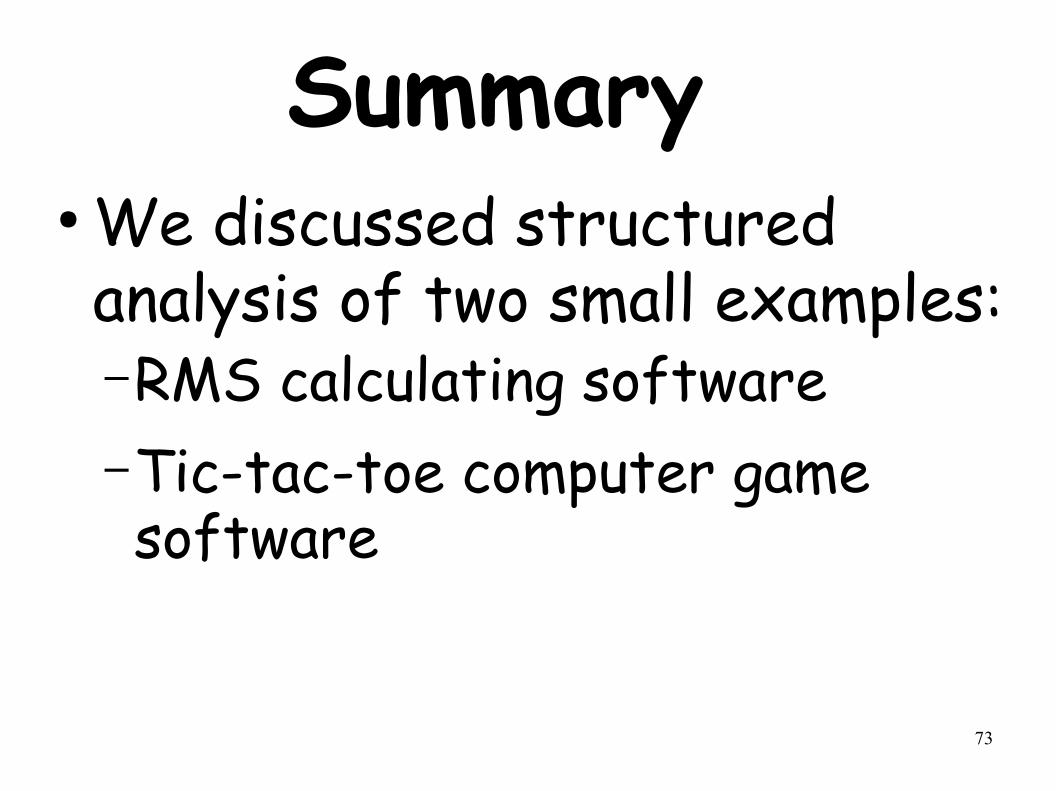
Summary● We discussed structured analysis of two small examples:–RMS calculating software–Tic-tac-toe computer game software
74
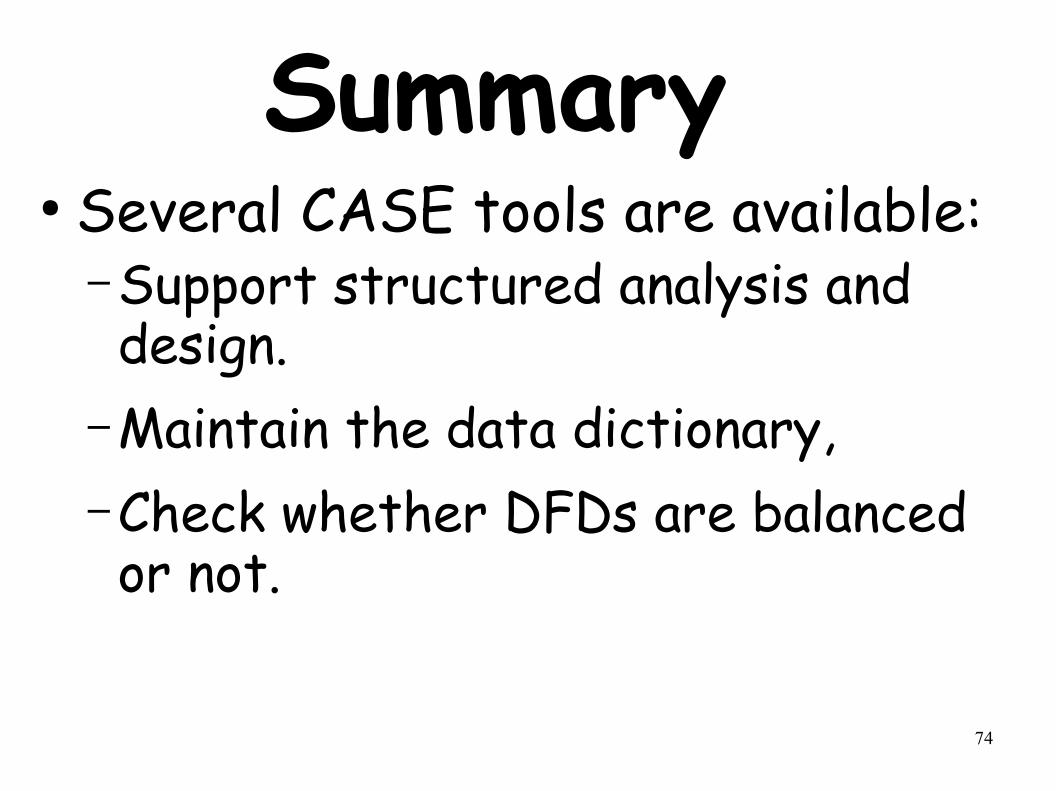
Summary● Several CASE tools are available:
– Support structured analysis and design.
– Maintain the data dictionary, – Check whether DFDs are balanced or not.