data-driven organization design -...
TRANSCRIPT

DATA-DRIVENORGANIZATIONDESIGNSustaining the competitive edgethrough organizational analytics
RUPERT MORRISON

Contents
Part One Introduction 1
1.1 Data-driven organization design 3
Effective organization design and management 5
Why people are struggling with organization design 6
How this book will help you 8
Structure of the book 10
Final thoughts 10
Notes 11
1.2 Challenges 13
Introduction 13
The reality of the challenge 14
Common challenges in organization design 17
Final thoughts 23
Notes 24
1.3 Foundations and core concepts 25
Introduction 25
Foundation 1: The organization is a system 26
Foundation 2: Organizational data is hierarchical 31
Foundation 3: Organizational data is messy 33
Applying the foundations in practice 35
Method 1: create hierarchical data structures 37
Method 2: connect the system 40
Method 3: visualize to analyse 46
Final thoughts: see it as a journey 56
Notes 57
Data Driven Organization Design_Newproof.indb 5 7/6/2015 4:24:30 PM
Contentsvi
Part twO Macro design 59
2.1 Introduction 61
Macro design in practice 62
Structure and logic for Part Two 63
2.2 strategy articulation and design criteria 65
Introduction 65
Define where you are going and why 66
The case for change 71
Constraints and risks 75
Setting the design criteria 76
Final thoughts 77
Notes 79
2.3 structural options and business case 80
Introduction 80
Develop options 82
Analysing and deciding your best option 89
Develop and sign-off the business case 97
Final thoughts: Have a strong case for change 99
Notes 100
Part three Micro design 101
3.1 Introduction 103
Structure and logic for Part Three 105
3.2 the data goldmine 108
Introduction 108
Data blockers and myths 109
Building the baseline – get ready to wrangle 113
Performing analysis: common statistical traps 122
Final thoughts 130
Notes 131
Data Driven Organization Design_Newproof.indb 6 7/6/2015 4:24:30 PM
Contents vii
3.3 objectives management 133
Introduction 133
Why organizations struggle with corporate-wide performance management 134
Process for setting and managing objectives 138
Maintaining and improving objectives management 148
Final thoughts 150
Notes 152
3.4 Fixed process design 153
Introduction 153
Types of process map 154
Understanding the as-is 159
Analysing the as-is 163
Design the to-be process and structures 170
Link the to-be work to to-be positions and hierarchical structure 178
Final thoughts 183
Notes 184
3.5 Dynamic process design 185
Introduction 185
Dynamic process design methodologies 186
Detailed example: project-driven organizations 188
Mini-examples 196
Final thoughts 200
Notes 202
3.6 Competency management 203
Introduction 203
Objectives versus competency management 205
The business case for competency management 206
Developing and putting the framework to work 210
Final thoughts 218
Notes 219
Data Driven Organization Design_Newproof.indb 7 7/6/2015 4:24:30 PM

Contentsviii
3.7 Rightsizing 220
Introduction 220
Common currently used flawed methods 221
Four methods for rightsizing your organization 222
Method 1: Ratio analysis 223
Method 2: Activity analysis 230
Method 3: Driver analysis 236
Method 4: Mathematical modelling 243
Final thoughts 247
Notes 248
Part FOur Making it Real 249
4.1 Introduction 251
What is Making it Real? 251
Realize the design is only a sketch 253
Structure and logic for Part Four 254
Notes 256
4.2 Common traps 257
Introduction 257
Knowing when and what things are going wrong 257
Final thoughts 262
4.3 HoWWIP 264
Introduction 264
HOWWIP outcomes 265
Exercises 268
Final thoughts 273
Note 274
4.4 Implementation 275
Introduction 275
Impact assessment 276
Communication 281
Transition management and consultation 285
Data Driven Organization Design_Newproof.indb 8 7/6/2015 4:24:30 PM

Contents ix
Collateral 293
Final thoughts 294
Note 295
4.5 Workforce planning 296
Introduction 296
What we really mean by workforce planning 297
How micro design helps to drive workforce planning 301
Workforce planning in practice 302
Final thoughts 307
Notes 309
4.6 talent management, succession development and succession planning 310
Introduction 310
Why all the hype? 311
Approaches to succession planning 313
Implementing talent and succession planning 319
Final thoughts 321
Notes 322
4.7 organizational getting things done 323
Introduction 323
The power of the list 324
Getting things done in a team 326
Using a data-driven approach to get things done 330
Final thoughts: Use the right management tools 333
Notes 334
4.8 sustaining the edge 335
Introduction 335
Tracking the system 335
Celebrating, reflecting and resting 340
Final thoughts 342
Notes 343
Appendix 345
Data Driven Organization Design_Newproof.indb 9 7/6/2015 4:24:30 PM

1.3 Foundations and core concepts
Introduction
Organizations are complex, constantly moving and can often seem unpre-dictable. Dealing with uncertainty is hard but it is a constant in business. The challenge is to get into the best position possible to make consistently good decisions in an ambiguous world. The only way to do this is to arm yourself with the right tools, both on a conceptual and technological level. A great example of how to do this comes from the world of economics.
In 1959 natural gas was discovered in the Netherlands. Intuition would say that gas means money, better business and more jobs. Good for every-one, right? Unfortunately not. After fi nding the gas, there were job losses and increased unemployment. On the face of it, a completely illogical and incomprehensible result. So what was really going on? The discovery of gas led to the appreciation of the Dutch currency, which in turn meant that the price of exports increased. Businesses lost trade as markets were unable to afford the increases in price and the knock-on effect meant cuts and job losses across organizations.
This example is a fantastic demonstration of systems thinking, a situation in which one part of a system, (in this case the economic system – the oil and gas industry) has a hidden connection with another part of the system (the manufacturing industry). The real question is, can seemingly unconnected relationships and unlikely scenarios such as the example above be pre-dicted? It could, and in fact in economic circles these interactions are now modelled by economists, to run scenarios and predict the impact of the economic development of natural resources. The phenomenon even has its own name: Dutch Disease.
Why is this relevant to the organization? An organization has many similarities to an economy. For example, both have tangible and intangible drivers and both are extremely volatile. Both are extremely diffi cult to
Data Driven Organization Design_Newproof.indb 25 7/6/2015 4:24:31 PM

Part One: Introduction26
understand in full and to manage accordingly. Like an economy, the organ-ization and organizational change can only be understood from a systems perspective.
In the same way in which economists model economies, can we begin modelling the organization in a way that connects the organizational system? Can we simplify the complexities of this system to understand it as a whole, see the ‘unseen’ connections and get a glimpse of seemingly unpredictable scenarios before they happen?
I believe we are part of an exciting time where the advances of technology are allowing us to gain a true competitive advantage by using data and ana-lytics from across organizations to model and connect the organizational system. This type of insight doesn’t happen overnight. It requires a long journey, from collecting and analysing the data, to understanding how it impacts the business and then implementing the changes needed for business improvement.
This chapter lays many of the foundational building blocks for this book: a mental model for organizational analytics and design. Starting from a theoretical approach to the organization, I set out three foundations:
●● Foundation 1: The organization is a system
●● Foundation 2: Organizational data is hierarchical
●● Foundation 3: Organizational data is messy
The chapter then lays out a three-step approach to deal with each one of these:
●● Method 1: Create hierarchical data structures
●● Method 2: Link the many to many
●● Method 3: Visualize to analyse
This chapter challenges some assumptions in current design work, and throws out some of the tools that have traditionally been used. I hope it provides you with a fresh perspective, and a new way of seeing and under-standing the organization.
Foundation 1: the organization is a system
Understanding the organization as a system is at the heart of this book’s application of organization design. Organization design is not about who reports to whom; it is about what each role in the organization is required
Data Driven Organization Design_Newproof.indb 26 7/6/2015 4:24:31 PM

Foundations and Core Concepts 27
to do, what decisions need to be made, what activities need to be done, what competencies are required to do these things and which employees have the right set of competencies for each role. The connections are many and inter-linked. Treating the organization as a system is about seeing and closing the gap between these areas. Answering the sorts of questions like: What are the optimum number of full-time employees (FTEs) for my organization? How are my customers going to be served? What are the value chains needed to serve those customers? How much of my workforce should be in-house versus contracting?
The idea of treating the organization as a system is not new, but the thinking is rarely applied in practice. Taking a couple of examples from existing literature, the organization as a system has been defined in the following terms:
Designing organizations is the process of purposefully configuring the elements of an organization to effectively and efficiently achieve its strategy and deliver intended business, customer and employee outcomes.1
Driving business strategy and operating context requires holistic thinking (systems, structures, people, performance measures, processes, culture, skills...); design for the future; not to be undertaken likely; a fundamental process and not a repair job.2
These descriptions are all very well, but what do they really mean? How pragmatically can we make sense of the idea of the organization as a system in a value adding way rather than an academic concept?
Let’s start at a high level. An organization has a vision, a reason for being. This is translated into goals, objectives and more broadly into a strategy in how to achieve these (see Chapter 2.2 for a detailed description of these terms). Objectives are then broken down and delivered by employees who fulfil roles within a reporting structure. Each role is associated with certain processes and competencies required to deliver the objectives and processes ascribed to that role. I could keep going round in circles, but the system can only start to be understood as a model. Figure 1.3.1 shows some of the ele-ments of the organizational system and how they can start to be connected.
This model in Figure 1.3.1 falls short of covering all the aspects of the organization – models are never able to convey the whole truth. It only shows particular elements and connections of the organization, but it is a useful way to begin to understand the complexities of the system. At first glance it may feel complex and overwhelming. I recommend you take your time, step through it slowly and focus on each of the various connections separately. The questions highlight the sorts of thought processes you should
Data Driven Organization Design_Newproof.indb 27 7/6/2015 4:24:31 PM

Part One: Introduction28
go through. For instance, how do you translate the strategy to specific goals and objectives as will be outlined in Chapter 3.3? Once the objectives are clear, you then need to define who is responsible for each one. That is represented by the links between the list of ‘Goals and Objectives’ and ‘Employees’. The datasets each have a wealth of information in them. For instance, the employee dataset will frequently have demographic, perfor-mance and reward data as outlined in Chapter 3.2. An example of a gap is the difference between required numbers of people and the actual supply of people (as explained in Chapter 4.5). There are feedback loops; for instance, I may have a target headcount in my desired org structures, but is that number right (as is explained in Chapter 3.7) and does the top-down financial implication of this headcount match my financial goals? The system starts at two ends: the strategy and what the system needs to deliver to the customer. The customer dataset is drawn at the top, to signify their primary importance, with the employees right in the middle as the connec-tion point between all the elements. Not every connection or nuance from this figure will make sense at first glance. That is fine. After you read more and more of this book, each of the elements of the system will become understandable.
I will reference aspects of this model throughout the book, putting each part of the organizational system into the context of the interrelated whole. Part Two covers vision and strategy, high-level goals, structural options and summary processes, while Part Three details objectives, processes, non-process, competencies and rightsizing. Part Four focuses on executing the plans developed in the macro and micro stages.
Exploring the organizational system in more detail, a good way to think through all its connections in practical terms is to think about a job descrip-tion as shown in Figure 1.3.2. A job description systematically captures all the major elements of the organizational system. You have the person, the role, the salary and who he or she reports to. You have a description of the objectives the person is expected to fulfil, the overall responsibilities, what he or she is supposed to do, and a list of projects that person will be focusing on and the competencies (ie skills and behaviours) required.
On this level, the organizational system conceptually is not that hard to grasp. However, in practical terms the issue is scale. Having one job descrip-tion is quite simple but what about when we look at 10,000 or even just 100? It is impossible to know how each person relates to every other person, especially across all functions – the brain can only process so much.
Unfortunately, it isn’t always possible to keep organizations in small units. The complexity and size of organizations mean that often the basics
Data Driven Organization Design_Newproof.indb 28 7/6/2015 4:24:31 PM

Foundations and Core Concepts 29
Figure 1.3.1 The organizational system
Responsibilities
Employees fulfil roles
Employees competencies
What are my key goals?
Which competencies
are core?Headcount
reports
Is right sized?
Required competencies Responsibilities
Per cent Time
GAP analysis
GAP analysis
PRocEssEs & AcTiviTiEs
sTRATEGyGoAls &
objEcTivEs
comPETEnciEs EmPloyEEs oRG sTRucTuREs & PosiTions
How are customers
served?
cusTomERsThe organizational system; ensuring your strategy meets customer demand
REPoRTsdATA sETs quEsTionslinks
kEy
Data Driven Organization Design_Newproof.indb 29 7/6/2015 4:24:31 PM

Part One: Introduction30
Figure 1.3.2 The organizational system as a job description
structures
role
economics
Job Description: Project manager
reports to: Mr XX
salary: $60,000
overview: eg Accomplishes
project objectives by planning project activities; evaluating implementation and progress of project
objectives: eg Create and maintain
strong, lasting relationships with up to 5 clients
responsibilities: eg Effectively manage
and resolve issues and risks during the project lifecycle
skills:eg Relationship
building - exceptional at building rapport with clients and the delivery teams
process & activities
obJectives
competencies
are not understood, to the point where a large majority of firms I speak to don’t know their headcount and certainly not their headcount over time, by function, location, grade and employment type (eg permanent versus contractor).
For example, I once worked with a fast-moving consumer goods (FMCG) firm who had roughly 20 manufacturing plants around Europe. They all produced the same products and by and large had the same processes. Within those processes quality control was crucial and strictly regulated. However, there was no consistency across the plants. The numbers of people working across quality control varied between two and eight. When we performed analysis we found that despite the difference in numbers, they were all covering the same amount of work. So, why the variation in number? At best they were just being inefficient and at worst, creating a massive corporate risk.
This type of obscurity not only hinders business performance but also halts individual development and performance. If managers do not know what their reports should be doing, how can they give effective feedback? How well do you know they are doing in achieving their objectives? Are they on target or not? Do they have too much to do, resulting in performance suffering across the board?
Data Driven Organization Design_Newproof.indb 30 7/6/2015 4:24:31 PM

Foundations and Core Concepts 31
To understand the interplay between all these moving parts we need to understand and break down the structural nature of the organization.
Foundation 2: organizational data is hierarchicalThe basis of my working definition of ‘organizational data’ in the context of organization design is data that has the person as the central unit of analy-sis. This is not the same as ‘people data’, which is a subset of organizational data and relates specifically to a person rather than their numerous connec-tions and links across the organization. To put this in context, every part of the organizational system in Figure 1.3.1 can be understood as organizational data. Even if you approach a design from a specific process or competencies perspective, these areas of the organization always link back to a person. Understood in this way, organizational data has two far reaching conse-quences for the organization design methodology in this book: first, organ-izational data needs to be understood in the context of a hierarchy, and second people data cannot be broken down into one unit of analysis.
The easiest way to understand the hierarchical nature of organizations is to begin from a simple people perspective. The natural structure of most organizations is one with a people hierarchy, built upon specific role levels and reporting lines connecting employees to specific managers. If we want to understand this simply, all we need to do is create a standard organization chart (Figure 1.3.3).
Figure 1.3.3 Organization chart coloured by department
Reece HarrisCEO
Ava WilkinsCFO
Josh SinghOperations Director
Tyler SwiftHR Director
Charles FariasSales Director
James PorterHead of Research
Molly WhiteGroup Financial
Controller
MiaTomlinson
Secretary
JonathanDaniels
Programme Manager
Eva HunterProgramme Manager
Jacob KhanProgramme
Manager
Joe HallProgramme Manager
Rick JonesHR Manager
Jessica TalbotHR Manager
ThomasRichard
HR Manager
MohammedSandersonHead of Admin
Bryan KornSecretary
Daniel McGeeHead of Recruitment
Libby LucasSecretary
Chelsea WalshSales manager
Hannah ReidSales manager
WhitneyKowalski
Sales manager
Deborah EvansSales manager
IsobelBrennan
Programme Manager
Sean EllisProgramme Manager
Kian SandersProgramme
Manager
Naomi AdamsProgramme Manager
Mary MayorProgramme Manager
Department Executive Finance HR Operations R&D Sales
Data Driven Organization Design_Newproof.indb 31 7/6/2015 4:24:32 PM

Part One: Introduction32
Unfortunately, far too many organization designs stop at this perspective. Design work is seen as a simple exercise of moving boxes around a PowerPoint slide. However, it is too simple to look at the design of an organization simply from a people- or even role-based view. This brings us back to my second statement, that organizational data cannot be broken down into one unit of analysis. What I mean by this is that within a person as a unit you have clusters of information linked to the person; for instance, a set of objectives, a certain amount of experience, competencies, strengths and so on. It is impossible to break a person down into one skill, or a particular set of skills. The result of this complication is that when under-standing how the organizational system is connected you have to go much deeper than a simple reporting line. In reality, what you are dealing with is a complex interconnected, overlapping web of objectives, processes, com-petencies and so on. Because people do not change very fast, and are not infinitely divisible, when dealing with organization design you have to deal with ambiguity. Things never fit together perfectly.
This complexity doesn’t mean we should give up, but that we need to understand how to break down the organizational system and see the con-nections. To do this we can apply the same hierarchical approach we took from a people perspective and apply it across the organizational system. In doing this, what you are actually doing is creating taxonomies for the various organization elements. Taxonomy is an area of science focused on classification or, put more simply, grouping things that are similar. It is a way of creating structures. A good example of taxonomy is the way Amazon organizes its products into different categories (eg books and audio versus sports and outdoors) and different subcategories (eg books, Kindle editions, children’s books) and so on. Taxonomies are a great way of categorizing and subcategorizing data into logical chunks of information.
If you take the organization you already have taxonomies in the defini-tion of the system: roles, objectives, processes, competencies and so on. Within each one of these there will be further subcategories. For example, if you go back to your org chart, it is likely that attached to the role titles are certain categories such as function, location, salary band, organizational grade. Or think of objectives. These start as overarching goals and cascade into more and more specific objectives and key performance indicators or KPIs (see Chapter 3.3.). If you build out all these hierarchies you can then start to see how they relate to each other. Unfortunately, each area of the organizational system will not fit neatly on top of another. However, it gives you the building blocks for drawing the connections and links between them.
Data Driven Organization Design_Newproof.indb 32 7/6/2015 4:24:32 PM

Foundations and Core Concepts 33
Foundation 3: organizational data is messy
The organizational system is naturally complicated. However, one of the reasons so many struggle to understand the as-is of their organization, let alone implement an organization design, is a misdirected approach to data. In the previous section I highlighted one of the unique features of people data; that as a unit of analysis they cannot be broken down into a single unit. This has consequences for how you approach people data in order to make sense of them. This section looks at what data you are really dealing with when doing an organization design before highlighting the challenges that come with this organizational data.
Let’s clarify immediately. Organizational data is not big data. At the time of writing this book there has been a huge buzz around big data and their potential business value. There is no doubt it is changing the way businesses are run. However, when it comes to people transformation and change, are big data really changing the way we design the organization?
There have been a lot of voices saying an emphatic Yes. For example Jay Galbraith, building on his four structural principles separating an organ-ization (business divisions, organizational functions, international units and customer segments), suggested that big data is a fifth structural principle when restructuring.3 New functions will be the big data operations distinguishing themselves from the previous four structural principles that separated the organization.
I am not as convinced. Because of the hype there has been a lot of misuse of the term ‘big data’. Big data is not the be-all and end-all, and thinking they are will mean you approach your organizational analytics and design in the wrong way. So what is the difference between organizational data and big data?
Big data
●● What does it look like? Big data involve looking at upwards of tens if not thousands of millions of information points that are often extremely fast moving.
●● The challenge? Their complexity, speed and volume. Big data can often be recorded in real time, involving millions of transactions over a short amount of time. For example, I once worked with a global FMCG firm that took out over $500 million of working capital across 180 markets through inventory optimization and better
Data Driven Organization Design_Newproof.indb 33 7/6/2015 4:24:32 PM

Part One: Introduction34
forecasting. This type of project represented a challenge in terms of the complexity of storing and analysing such large amounts of data in a useful and efficient way.
●● How to deal with big data. Often when storing, processing and querying big data, and in the case of the FMCG firm, you would use a data warehouse (see Chapter 3.2 for a definition).
●● When do you use big data? Examples include: marketing where big data allows more accurate customer segmentation through real-time analysis; in healthcare big data support more targeted treatment for patients; in recruitment big data allows employers to screen potential candidates more accurately through CV and social media analysis; and in the supply chain business, big data helps reduce inventory wastage.
My view is that big data will affect how organizations do their business, but will not have a massive impact on the process of designing organizations. In reality, they are only for the very largest organizations and for very specific data, such as social media data on candidates or recruitment where dataset sizes are larger than a million data points.
Organizational data
●● What does it look like? Organizational datasets are relatively small and contain the many-to-many* links of the organizational system.
●● The challenge? The complex nature of organizational data means it is often incomplete and subject to (relatively) slow but constant change. For example, organizational roles can have numerous different titles making standard analysis near impossible. Traditionally, organizational data is held in numerous systems and documents including human resource information systems (HRIS), payroll systems and disparate Excel spreadsheets. The messy nature of organizational data is one of the things that make it so challenging, not its size. Most organizational data will contain millions of data points and connections at most. This pales in comparison to the volume and velocity you are dealing with in big data. It is the fact that the data is usually incomplete, constantly changing, hard to
*In a relational database, links (say, between cells or rows) can be one-to-one (eg: one person ↔ one National Insurance number), one-to-many (eg: one order ↔ several items) or many-to-many (eg: products anyone can buy ↔ customers who can buy any product).
Data Driven Organization Design_Newproof.indb 34 7/6/2015 4:24:32 PM

Foundations and Core Concepts 35
maintain and linked in complex ways that makes the organizational data so hard to manage.4
●● How to deal with people data. Traditionally, there has been a lack of technical tools to help understand the complexities of people data. I have horrible memories of working on designs late into the night to deliver a project, only to get told at the eleventh hour that a certain figure or graph was wrong. Cue frantic changes in Excel and PowerPoint to get everything ready for the final presentation.
Traditional relational databases (for a definition of a relational database see Chapter 3.2) such as Excel are great for many things, but they are just not set up for design work. Simple rows and columns do not allow you to truly understand the many-to-many links of the organization. For example, when doing process design, tables do not allow you to see how a process links to a role, what competencies are required for that role, and who is the actual person fulfilling that role currently, because they are bound by a one-to-one relationship. The only way forward is to stop thinking in tables and instead think in terms of graphs. Graphs have the ability to connect disparate aspects of the organization because they allow for the multiple connections con-tained in organizational data (for a more detailed description of a graph database see Chapter 3.2). The thinking behind this book and organizational visualizations used is underpinned by a graph-based approach to organiza-tional data, to allow for the many-to-many links contained in organizational data.
Applying the foundations in practice
The way you see the world is the way you understand it. If you can’t see something it makes it much harder to understand. In the context of organ-izational data and analytics, being unable to see the links and connections of the organizational system not only means it takes a lot longer to perform analysis, but also means a lot of detail is obscured and lost. What all organ-izations need is a new way to see themselves. They need the ability to look round the corners; provide context; connect the system – people, activities, processes, costs and so on.
In 2014, I worked with one of the world’s largest fleet management companies who managed to do just that. Its business model is centred on optimizing the cost of serving customers while maintaining the highest standards of customer experience and satisfaction. However, the business
Data Driven Organization Design_Newproof.indb 35 7/6/2015 4:24:32 PM
Part One: Introduction36
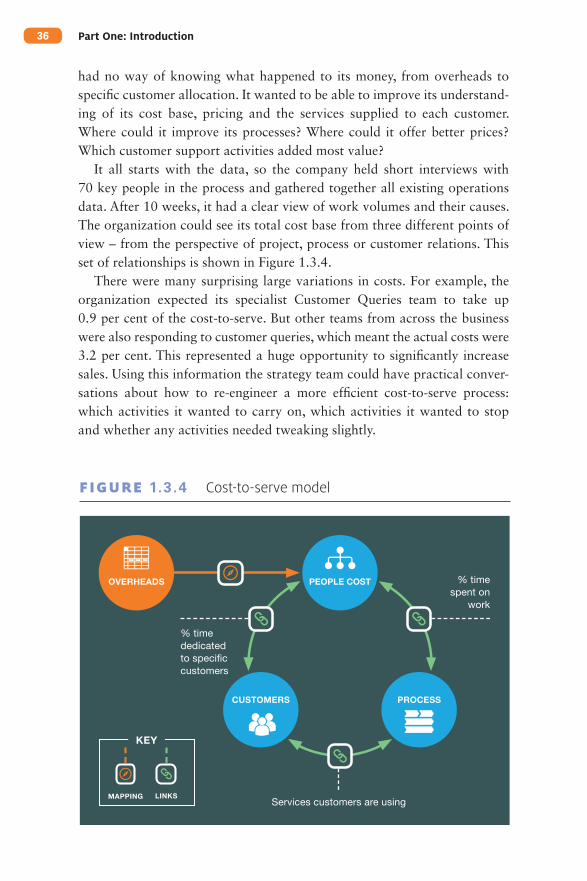
had no way of knowing what happened to its money, from overheads to specific customer allocation. It wanted to be able to improve its understand-ing of its cost base, pricing and the services supplied to each customer. Where could it improve its processes? Where could it offer better prices? Which customer support activities added most value?
It all starts with the data, so the company held short interviews with 70 key people in the process and gathered together all existing operations data. After 10 weeks, it had a clear view of work volumes and their causes. The organization could see its total cost base from three different points of view – from the perspective of project, process or customer relations. This set of relationships is shown in Figure 1.3.4.
There were many surprising large variations in costs. For example, the organization expected its specialist Customer Queries team to take up 0.9 per cent of the cost-to-serve. But other teams from across the business were also responding to customer queries, which meant the actual costs were 3.2 per cent. This represented a huge opportunity to significantly increase sales. Using this information the strategy team could have practical conver-sations about how to re-engineer a more efficient cost-to-serve process: which activities it wanted to carry on, which activities it wanted to stop and whether any activities needed tweaking slightly.
Figure 1.3.4 Cost-to-serve model
OVERHEADS
PROCESSCUSTOMERS
MAPPING LINKS
KEY
PEOPLE COST
% time dedicated to specific customers
% time spent on
work
Services customers are using
Data Driven Organization Design_Newproof.indb 36 7/6/2015 4:24:32 PM

Foundations and Core Concepts 37
This is a great example of the value in mapping and analysing the many- to-many connections of the organizational system in practice. It is the only way to truly understand what is going on, what has happened in the past and, based on this, make the most informed decisions possible for the future. When faced with change, this model is what helps you decide which aspects of the organization you should keep and which you should leave behind.
So, how do you get past the numbers? How do you connect the system practically in a way that is manageable and understandable? How can you create an accurate design and consistently make good decisions? How do you get to the point where analysing past and present data happens auto-matically, and the focus is on predicting future trends, making proactive rather than reactive business decisions?
In the next section, I outline three methods that underpin my approach to data-driven organization design. These methods are not a linear process but a continuous and interlinked cycle of activities, which feed into each other to help understand and connect the organizational system.
Method 1: create hierarchical data structures
As I outlined in Foundation 2, above, organizational data can be understood as a series of hierarchies. So, to understand and analyse the organization you need to build these hierarchies across the system. As is already probably apparent, hierarchical trees have quite specific terminology (see Figure 1.3.5 for an outline of key terms). In the context of taking a graph-based approach to understand the many-to-many connections of the organization, each position on any organizational hierarchical tree can be defined as a node. That is a connection point between multiple links. For example, a node in an org chart could represent a position that is linked to a person and a role, which are then in turn linked to numerous other data such as objectives and competencies. Equally, a node could represent an objective in an objectives tree or a process in a process tree. The node is purely an intersection point of information.
When doing organization design, like it or not, the trusty org chart is where most design starts. The org chart shows the layout of an organization in such a simple way and helps communicate the shape and structure of the reporting lines, as illustrated in Figure 1.3.3.
There is a common trap of reading too much into an org chart. It isn’t where the box sits but what is in the box that counts. For example, when doing org design, people often obsess with where their box sits relative to
Data Driven Organization Design_Newproof.indb 37 7/6/2015 4:24:32 PM

Part One: Introduction38
Figure 1.3.5 Hierarchical tree terminology
leaf parent
root
descendants All nodes that are directly and indirectly related to a parent are descendants.
A node with no children or parents is an orphan.
de
pth
4d
ep
th 3
de
pth
2d
ep
th 1
siblingsoutgoing count = 2
child
A node with children is the parent.
A node with no children is a leaf.
All nodes directly under a parent are children.
Children who share the same parent are siblings.
The top node of a tree is the root.
Synonymous with ‘Span of Control’
The number of directly connected nodes to a given parent
outgoing count The ‘level’ within a tree
Eg generally:CEO depth = 1, CFO depth = 2, etc
depth
orphan
Data Driven Organization Design_Newproof.indb 38 7/6/2015 4:24:32 PM
Foundations and Core Concepts 39
the CEO. It is as if the distance from the CEO is the sole definition of power, grade, or potential salary. So does that mean those at the bottom of the org chart are by definition unimportant, regardless of anything else? Clearly not. I have seen org charts where someone’s chauffeur is three from the top but where the lead technical director on a key future technological project is six away. There are times when the span of control or number of people below the position are assumed to be a proxy for importance instead. This type of thinking is flawed. Indeed, when I have experienced this first hand, one of the things that has always surprised me in allocating management was how we didn’t want some of the most important positions to have a team to manage at all (ie no direct reports and a span of control of zero). The amazing thing – but it’s logical in hindsight – is that (a) not everyone is good at managing, (b) many technical or sales roles suffer from the burden of management and (c) by not having a team, the influence of those indi-viduals is not necessarily diminished in the slightest.
Doing org design is not about mapping and moving people and positions in org charts. You need to see beyond depth and layers, spans of control and size of control (the total number of positions below) and see what is in the box: the objectives; accountabilities; competencies; projects they are involved in; risk they manage; clients they serve. In other words, see the system. You need to understand the information flows and hierarchies across the organ-ization to really understand how they fit together.
When building the hierarchies in practice across the organization, whether roles, objectives or processes and so on, a useful approach is the Mutually Exclusive and Collectively Exhaustible (MECE) methodology. This concept was developed by Barbara Minto while at McKinsey, a management con-sultancy firm, and is at the heart of her ‘Pyramid Principle’.5 The idea is that you take a high-level idea or action and break it down in a logical and structured way. Just as repeating points or missing out points in a presenta-tion would have a negative impact on its overall message, not adhering to the MECE framework does likewise. The table in Figure 1.3.6 summarizes the two aspects of the MECE approach and how you achieve each one.
Using this approach is extremely useful when trying to break down work (processes), objectives, competencies, risk, projects and many more of the elements within the detailed design. Theoretically, if all organizational objectives are MECE then the organization is running at the best possible efficiency; there are no duplicated objectives and, when added up, all the objectives and subobjectives cover all the strategic aims (see more in Chapter 3.3). In reality this is near impossible, but thinking it through in this way helps you avoid unnecessary blockers and inefficiencies.
Data Driven Organization Design_Newproof.indb 39 7/6/2015 4:24:32 PM

Part One: Introduction40
Figure 1.3.6 MECE methodology for building taxonomies
1. Group information into separate categories.
2. Break down into logical subcategories.
3. Continue until have enough detail.4. Check for duplication and overlaps.5. Ensure language is concise
and clear.6. Test and review with stakeholders.7. Update and maintain.
Ensure all elements are included without any gaps.
Mutually ExclusivE
collEctivEly ExhaustivE
Ensure subsets are distinct and do not overlap.
MEcE ( pronounced: ‘mee-see’) creating a MEcE taxonomy
The most important thing when building these taxonomies is to get the level of detail right. It is easy to define too much detail. For example, in the context of a work canteen there could be a process of ‘Feed staff’. This can be broken down into five main areas: Manage the canteen; Buy the food, goods and services; Preparation; Service; Clean. From this, each element can be further analysed. For example, ‘Prepare’ could be broken into ‘Meat’, ‘Vegetables’ and ‘Sauces’. These can be further broken down, and then again, and again, and again, as in Figure 1.3.7.
It is possible to break this down until you reach the point of absurdity. You could imagine that the process of ‘Slice potatoes’ could be further broken into sort potatoes; align them; cut them; and so on. Remember, though, all of these sets of information connect to one another so the more detail you create the more complexity you are going to have to manage. You have to balance detail against practicality.
Having created and visualized your taxonomies, the next step is to connect them to start defining them in the context of the organizational system.
Method 2: connect the system
With your hierarchical information in place, the next step is to link these elements in what is a series of many-to-many relationships. At the end of the day, when doing an organization design you are looking at what and how
Data Driven Organization Design_Newproof.indb 40 7/6/2015 4:24:32 PM

Foundations and Core Concepts 41
Figure 1.3.7 Example process tree
BUY
PREPARE
SERVE
FEED STAFF VEG SLICE FRIES
DEPTH 1 DEPTH 2 DEPTH 3 DEPTH 4 DEPTH 5 DEPTH 6
CLEAN
MEAT
SAUCES
RADISH WASH
POTATO
CARROT PEEL
MANAGE
much work needs to be done, and how to divide that work between your workforce. From the moment a founder brings on another person, an organ-ization is born. From this point tasks are divided up: you do X and I’ll do Y. As the volume of work, people and complexity increases, dividing the work and understanding who does what and for how long becomes harder and harder to manage. Taxonomies set the platform for bringing it all back together. For example, operations are split between functions and subfunc-tions. Work is broken down into a geographical context of what is done centrally or locally. Job grades are created so that the right level of task is done by the right level of seniority. Linking is how you can connect all these elements together.
Linking helps with a number of things:
●● It gives clarity to who is required to do what and for how long.
●● It helps ensure everything that needs to be done is covered.
●● It avoids duplications of effort or things falling between the cracks.
Figure 1.3.8 shows, in the top two tables, differing ways of linking the organ-izational system through allocation of time and an accountability matrix, and then how those allocations can be seen within the context of the org
Data Driven Organization Design_Newproof.indb 41 7/6/2015 4:24:32 PM

Part one: Introduction42
F igure 1.3.8 Connecting the organizational system
Managing DirectorExecutive
FTE 1Role Cost 200K
A Decision of the investment committee
A Project report
S Feasibility study
S Rebalancing of portfolio whennecessary
S Environment assessment
Risk ManagerRisk
FTE 1Role Cost 100K
A Term sheet and deposit agreement
A Discussion of commercial terms
A Preliminary legal assessment
A Decision of the investment committee
R Tracking impact of these on portfolio
S Loan to value
S Analyst views
S Feasibility study
S Rebalancing of portfolio whennecessary
Compliance ManagerCompliance
FTE 1Role Cost 70K
A Preliminary legal assessment
R Legal and financial statement review
S Feasibility study
Legal ManagerLegal
FTE 1Role Cost 80K
A Term sheet and deposit agreement
A Decision of the investment committee
A Discussion of commercial terms
R Preliminary legal assessment
R Legal and financial statement review
S Environment assessment
Financial AdvisorFinance
FTE 1Role Cost 65K
R Prelimary financial and marketfeasibility
R Independent appraisal
R Legal and financial statement review
R Borrower creditworthiness
R Feasibility study
S Property value
S Event based
S Market research
S Loan to value
Sales & Trading ManagerSales & Trading
FTE 1Role Cost 90K
A Rebalancing of portfolio whennecessary
A Discussion of commercial terms
R Decision of the investment committee
R Term sheet and deposit agreement
Research ManagerResearch
FTE 1Role Cost 110K
A Decision of the investment committee
A Rebalancing of portfolio whennecessary
A Preliminary legal assessment
R Environment assessment
R Project report
S Prelimary financial and marketfeasibility
Risk AnalystRisk
FTE 3Role Cost 150K
R Tracking impact of these on portfolio
S Property value
S Prelimary financial and marketfeasibility
S Decision of the investment committee
S Loan to value
S Independent appraisal
S Term sheet and deposit agreement
S Project report
Sales PersonSales & Trading
FTE 4Role Cost 200K
R Discussion of commercial terms
R Event based
R Deal sourcing
R Rebalancing of portfolio whennecessary
S Management calls
S Market research
S Analyst views
S Borrower creditworthiness
S Feasibility study
S Independent appraisal
S Project report
Resarch AnalystResearch
FTE 4Role Cost 320K
R Property value
R Analyst views
R Management calls
R Loan to value
R Market research
R Feasibility study
R Environment assessment
R Rebalancing of portfolio whennecessary
R Project report
R
R
R
R
R
R
R
R
R
R
R
R
R
R
R
R
R
R
R
R
R
R
R
R
R
RR
S
S
S
A
A
A
A
A
A
A A
AA
A
A
A
A
A
S
S
S
S
S
S
S
S
S
S
S
S
SS
S
S
S
S
S
S
S
S
S
S
S
Sales & Trading ManagerSales & Trading
FTE 1Role Cost 90K
Rebalancing of portfolio whennecessaryDiscussion of commercial terms
Decision of the investment committee
Term sheet and deposit agreement
Research ManagerResearch
FTE 1Role Cost 110K
Decision of the investment committee
Rebalancing of portfolio whennecessaryPreliminary legal assessment
Environment assessment
Project report
Prelimary financial and marketfeasibility
Sales PersonSales & Trading
FTE 4Role Cost 200K
Discussion of commercial terms
Event based
Deal sourcing
Rebalancing of portfolio whennecessaryManagement calls
Market research
Analyst views
Borrower creditworthiness
Feasibility study
Independent appraisal
Resarch AnalystResearch
FTE 4Role Cost 320K
Property value
Analyst views
Management calls
Loan to value
Market research
Feasibility study
Environment assessment
Rebalancing of portfolio whennecessaryProject report
R
R
R
R
R
R
R
R
R
R
R
R
R
R
R
R
R
A
A
A
A
A
S
S
Managing DirectorExecutive
FTE 1Role Cost 200K
A Decision of the investment committee
A Project report
S Feasibility study
S Rebalancing of portfolio whennecessary
S Environment assessment
Risk ManagerRisk
FTE 1Role Cost 100K
A Term sheet and deposit agreement
A Discussion of commercial terms
A Preliminary legal assessment
A Decision of the investment committee
R Tracking impact of these on portfolio
S Loan to value
S Analyst views
S Feasibility study
S Rebalancing of portfolio whennecessary
Compliance ManagerCompliance
FTE 1Role Cost 70K
A Preliminary legal assessment
R Legal and financial statement review
S Feasibility study
Legal ManagerLegal
FTE 1Role Cost 80K
A Term sheet and deposit agreement
A Decision of the investment committee
A Discussion of commercial terms
R Preliminary legal assessment
R Legal and financial statement review
S Environment assessment
Financial AdvisorFinance
FTE 1Role Cost 65K
R Prelimary financial and marketfeasibility
R Independent appraisal
R Legal and financial statement review
R Borrower creditworthiness
R Feasibility study
S Property value
S Event based
S Market research
S Loan to value
Sales & Trading ManagerSales & Trading
FTE 1Role Cost 90K
A Rebalancing of portfolio whennecessary
A Discussion of commercial terms
R Decision of the investment committee
R Term sheet and deposit agreement
Research ManagerResearch
FTE 1Role Cost 110K
A Decision of the investment committee
A Rebalancing of portfolio whennecessary
A Preliminary legal assessment
R Environment assessment
R Project report
S Prelimary financial and marketfeasibility
Risk AnalystRisk
FTE 3Role Cost 150K
R Tracking impact of these on portfolio
S Property value
S Prelimary financial and marketfeasibility
S Decision of the investment committee
S Loan to value
S Independent appraisal
S Term sheet and deposit agreement
S Project report
Sales PersonSales & Trading
FTE 4Role Cost 200K
R Discussion of commercial terms
R Event based
R Deal sourcing
R Rebalancing of portfolio whennecessary
S Management calls
S Market research
S Analyst views
S Borrower creditworthiness
S Feasibility study
S Independent appraisal
S Project report
Resarch AnalystResearch
FTE 4Role Cost 320K
R Property value
R Analyst views
R Management calls
R Loan to value
R Market research
R Feasibility study
R Environment assessment
R Rebalancing of portfolio whennecessary
R Project report
R
R
R
R
R
R
R
R
R
R
R
R
R
R
R
R
R
R
R
R
R
R
R
R
R
RR
S
S
S
A
A
A
A
A
A
A A
AA
A
A
A
A
A
S
S
S
S
S
S
S
S
S
S
S
S
SS
S
S
S
S
S
S
S
S
S
S
S
Inve
stm
ent P
roce
ss
D
eal G
ener
atio
n
E
vent
bas
ed
M
arke
t res
earc
h
D
eal s
ourc
ing
A
naly
sis
and
Eval
uatio
n
A
naly
st v
iew
s
M
anag
emen
t cal
ls
L
oan
to v
alue
P
rope
rty
valu
e
P
relim
inar
y re
view
P
relim
inar
y fin
anci
al a
...
P
relim
inar
y le
gal a
sse.
..
D
iscu
ssio
n of
com
mer
...
I
nves
tmen
t Com
mitt
ee
D
ecis
ion
of th
e in
vest
...
T
erm
she
et a
nd d
epos
...
D
ue D
illig
ence
Rev
iew
In
depe
nden
t app
rais
al
B
orro
wer
cre
ditw
orth
i...
L
egal
and
fina
ncia
l sta
...
F
easi
bilit
y st
udy
E
nviro
nmen
t ass
essm
...
A
gree
men
t
M
onito
ring
& A
djus
tm...
T
rack
ing
impa
ct o
f the
...
R
ebal
anci
ng o
f por
tfol..
.
P
roje
ct re
port
Managing Director
Risk Manager
Risk Analyst
Compliance Manager
Legal Manager
Financial Advisor
Sales & Trading Manager
Sales Person
Research Manager
Research Analyst
People
Processes
R
R
R
R
R
R
R
RRR
R
R
R R R R
R R
RR RR
RR
R
R
R
S
S
S
S
SSSSSSS
SS
SS
SS
S
S
S
SS
S S S
S
S
S
S S S S S S
S SS
S SS
S
S
S
SSSS
S
SSA
A
A
A
A
AA
A
A
A AA
A
A A
A A
A
A
A
0.2 0.2 0.2 0.2 0.2
0.2
0.2
0.2
0.2 0.2
0.2 0.2
0.2
0.2
0.2 0.2
0.2
0.2 0.2
0.2
0.2 0.20.2
0.20.20.2
0.2 0.2
0.2 0.2 0.2
0.2
0.2
0.2
0.2 0.2
0.2
0.2
0.2
0.2 0.2
0.2 0.2 0.2
0.2
0.2
Managing Director
Risk Manager
Managing Director
Risk Manager
Maecenas vulput...
Consectetur adipis...
Maecenas vulput...
Ligula quis
Posuere pharetra
Mauris fermentum
Discussion of commercial terms
Decision of the investment committee
Feasibility study
Environment assessment
Rebalancing a portfolio when necessary
Project report
Analyts views
Management calls
Loan to value
Preliminary legal assessment
Discussion of commercial terms
Decision of the investment committee
Feasibility study
Tracking impact of these on portfolioR
S
A
A
S
S
S
S
S
S
A
A
A
A
People Processes
Linking
RASI grid
RASI list
R
R
R
RS S
A
Inve
stm
ent P
roce
ss
D
eal G
ener
atio
n
E
vent
bas
ed
M
arke
t res
earc
h
D
eal s
ourc
ing
A
naly
sis
and
Eval
uatio
n
A
naly
st v
iew
s
M
anag
emen
t cal
ls
L
oan
to v
alue
P
rope
rty
valu
e
P
relim
inar
y re
view
P
relim
inar
y fin
anci
al a
...
P
relim
inar
y le
gal a
sse.
..
D
iscu
ssio
n of
com
mer
...
I
nves
tmen
t Com
mitt
ee
D
ecis
ion
of th
e in
vest
...
T
erm
she
et a
nd d
epos
...
D
ue D
illig
ence
Rev
iew
In
depe
nden
t app
rais
al
B
orro
wer
cre
ditw
orth
i...
L
egal
and
fina
ncia
l sta
...
F
easi
bilit
y st
udy
E
nviro
nmen
t ass
essm
...
A
gree
men
t
M
onito
ring
& A
djus
tm...
T
rack
ing
impa
ct o
f the
...
R
ebal
anci
ng o
f por
tfol..
.
P
roje
ct re
port
Managing Director
Risk Manager
Risk Analyst
Compliance Manager
Legal Manager
Financial Advisor
Sales & Trading Manager
Sales Person
Research Manager
Research Analyst
People
Processes
D
ecis
ion
of th
e in
vest
...
A
R R
Due
Dill
igen
ce R
evie
w
Inve
stm
ent P
roce
ss
D
eal G
ener
atio
n
E
vent
bas
ed
M
arke
t res
earc
h
D
eal s
ourc
ing
A
naly
sis
and
Eval
uatio
n
A
naly
st v
iew
s
M
anag
emen
t cal
ls
L
oan
to v
alue
P
rope
rty
valu
e
P
relim
inar
y re
view
P
relim
inar
y fin
anci
al a
...
P
relim
inar
y le
gal a
sse.
..
D
iscu
ssio
n of
com
mer
...
I
nves
tmen
t Com
mitt
ee
D
ecis
ion
of th
e in
vest
...
T
erm
she
et a
nd d
epos
...
D
ue D
illig
ence
Rev
iew
In
depe
nden
t app
rais
al
B
orro
wer
cre
ditw
orth
i...
L
egal
and
fina
ncia
l sta
...
F
easi
bilit
y st
udy
E
nviro
nmen
t ass
essm
...
A
gree
men
t
M
onito
ring
& A
djus
tm...
T
rack
ing
impa
ct o
f the
...
R
ebal
anci
ng o
f por
tfol..
.
P
roje
ct re
port
Managing Director
Risk Manager
Risk Analyst
Compliance Manager
Legal Manager
Financial Advisor
Sales & Trading Manager
Sales Person
Research Manager
Research Analyst
People
Processes
R
R
R
R
R
R
R
RRR
R
R
R R R R
R R
RR RR
RR
R
R
R
S
S
S
S
SSSSSSS
SS
SS
SS
S
S
S
SS
S S S
S
S
S
S S S S S S
S SS
S SS
S
S
S
SSSS
S
SSA
A
A
A
A
AA
A
A
A AA
A
A A
A A
A
A
A
0.2 0.2 0.2 0.2 0.2
0.2
0.2
0.2
0.2 0.2
0.2 0.2
0.2
0.2
0.2 0.2
0.2
0.2 0.2
0.2
0.2 0.20.2
0.20.20.2
0.2 0.2
0.2 0.2 0.2
0.2
0.2
0.2
0.2 0.2
0.2
0.2
0.2
0.2 0.2
0.2 0.2 0.2
0.2
0.2
Managing Director
Risk Manager
Managing Director
Risk Manager
Maecenas vulput...
Consectetur adipis...
Maecenas vulput...
Ligula quis
Posuere pharetra
Mauris fermentum
Discussion of commercial terms
Decision of the investment committee
Feasibility study
Environment assessment
Rebalancing a portfolio when necessary
Project report
Analyts views
Management calls
Loan to value
Preliminary legal assessment
Discussion of commercial terms
Decision of the investment committee
Feasibility study
Tracking impact of these on portfolioR
S
A
A
S
S
S
S
S
S
A
A
A
A
People Processes
Inve
stm
ent P
roce
ss
D
eal G
ener
atio
n
E
vent
bas
ed
M
arke
t res
earc
h
D
eal s
ourc
ing
A
naly
sis
and
Eval
uatio
n
A
naly
st v
iew
s
M
anag
emen
t cal
ls
L
oan
to v
alue
P
rope
rty
valu
e
P
relim
inar
y re
view
P
relim
inar
y fin
anci
al a
...
P
relim
inar
y le
gal a
sse.
..
D
iscu
ssio
n of
com
mer
...
I
nves
tmen
t Com
mitt
ee
D
ecis
ion
of th
e in
vest
...
T
erm
she
et a
nd d
epos
...
D
ue D
illig
ence
Rev
iew
In
depe
nden
t app
rais
al
B
orro
wer
cre
ditw
orth
i...
L
egal
and
fina
ncia
l sta
...
F
easi
bilit
y st
udy
E
nviro
nmen
t ass
essm
...
A
gree
men
t
M
onito
ring
& A
djus
tm...
T
rack
ing
impa
ct o
f the
...
R
ebal
anci
ng o
f por
tfol..
.
P
roje
ct re
port
Managing Director
Risk Manager
Risk Analyst
Compliance Manager
Legal Manager
Financial Advisor
Sales & Trading Manager
Sales Person
Research Manager
Research Analyst
People
Processes
R
R
R
R
R
R
R
RRR
R
R
R R R R
R R
RR RR
RR
R
R
R
S
S
S
S
SSSSSSS
SS
SS
SS
S
S
S
SS
S S S
S
S
S
S S S S S S
S SS
S SS
S
S
S
SSSS
S
SSA
A
A
A
A
AA
A
A
A AA
A
A A
A A
A
A
A
0.2 0.2 0.2 0.2 0.2
0.2
0.2
0.2
0.2 0.2
0.2 0.2
0.2
0.2
0.2 0.2
0.2
0.2 0.2
0.2
0.2 0.20.2
0.20.20.2
0.2 0.2
0.2 0.2 0.2
0.2
0.2
0.2
0.2 0.2
0.2
0.2
0.2
0.2 0.2
0.2 0.2 0.2
0.2
0.2
Managing Director
Risk Manager
Managing Director
Risk Manager
Maecenas vulput...
Consectetur adipis...
Maecenas vulput...
Ligula quis
Posuere pharetra
Mauris fermentum
Discussion of commercial terms
Decision of the investment committee
Feasibility study
Environment assessment
Rebalancing a portfolio when necessary
Project report
Analyts views
Management calls
Loan to value
Preliminary legal assessment
Discussion of commercial terms
Decision of the investment committee
Feasibility study
Tracking impact of these on portfolioR
S
A
A
S
S
S
S
S
S
A
A
A
A
People Processes
Linking
RASI grid
RASI list
D
ecis
ion
of th
e in
vest
...
Dec
isio
n of
the
inve
st...
Inve
stm
ent P
roce
ss
D
eal G
ener
atio
n
E
vent
bas
ed
M
arke
t res
earc
h
D
eal s
ourc
ing
A
naly
sis
and
Eval
uatio
n
A
naly
st v
iew
s
M
anag
emen
t cal
ls
L
oan
to v
alue
P
rope
rty
valu
e
P
relim
inar
y re
view
P
relim
inar
y fin
anci
al a
...
P
relim
inar
y le
gal a
sse.
..
D
iscu
ssio
n of
com
mer
...
I
nves
tmen
t Com
mitt
ee
D
ecis
ion
of th
e in
vest
...
T
erm
she
et a
nd d
epos
...
D
ue D
illig
ence
Rev
iew
In
depe
nden
t app
rais
al
B
orro
wer
cre
ditw
orth
i...
L
egal
and
fina
ncia
l sta
...
F
easi
bilit
y st
udy
E
nviro
nmen
t ass
essm
...
A
gree
men
t
M
onito
ring
& A
djus
tm...
T
rack
ing
impa
ct o
f the
...
R
ebal
anci
ng o
f por
tfol..
.
P
roje
ct re
port
Managing Director
Risk Manager
Risk Analyst
Compliance Manager
Legal Manager
Financial Advisor
Sales & Trading Manager
Sales Person
Research Manager
Research Analyst
D
ecis
ion
of th
e in
vest
...
People
Processes
Inve
stm
ent P
roce
ss
D
eal G
ener
atio
n
E
vent
bas
ed
M
arke
t res
earc
h
D
eal s
ourc
ing
A
naly
sis
and
Eval
uatio
n
A
naly
st v
iew
s
M
anag
emen
t cal
ls
L
oan
to v
alue
P
rope
rty
valu
e
P
relim
inar
y re
view
P
relim
inar
y fin
anci
al a
...
P
relim
inar
y le
gal a
sse.
..
D
iscu
ssio
n of
com
mer
...
I
nves
tmen
t Com
mitt
ee
D
ecis
ion
of th
e in
vest
...
T
erm
she
et a
nd d
epos
...
D
ue D
illig
ence
Rev
iew
In
depe
nden
t app
rais
al
B
orro
wer
cre
ditw
orth
i...
L
egal
and
fina
ncia
l sta
...
F
easi
bilit
y st
udy
E
nviro
nmen
t ass
essm
...
A
gree
men
t
M
onito
ring
& A
djus
tm...
T
rack
ing
impa
ct o
f the
...
R
ebal
anci
ng o
f por
tfol..
.
P
roje
ct re
port
Managing Director
Risk Manager
Risk Analyst
Compliance Manager
Legal Manager
Financial Advisor
Sales & Trading Manager
Sales Person
Research Manager
Research Analyst
People
Processes
R
R
R
R
R
R
R
RRR
R
R
R R R R
R R
RR RR
RR
R
R
R
S
S
S
S
SSSSSSS
SS
SS
SS
S
S
S
SS
S S S
S
S
S
S S S S S S
S SS
S SS
S
S
S
SSSS
S
SSA
A
A
A
A
AA
A
A
A AA
A
A A
A A
A
A
A
0.2 0.2 0.2 0.2 0.2
0.2
0.2
0.2
0.2 0.2
0.2 0.2
0.2
0.2
0.2 0.2
0.2
0.2 0.2
0.2
0.2 0.20.2
0.20.20.2
0.2 0.2
0.2 0.2 0.2
0.2
0.2
0.2
0.2 0.2
0.2
0.2
0.2
0.2 0.2
0.2 0.2 0.2
0.2
0.2
Managing Director
Risk Manager
Managing Director
Risk Manager
Maecenas vulput...
Consectetur adipis...
Maecenas vulput...
Ligula quis
Posuere pharetra
Mauris fermentum
Discussion of commercial terms
Decision of the investment committee
Feasibility study
Environment assessment
Rebalancing a portfolio when necessary
Project report
Analyts views
Management calls
Loan to value
Preliminary legal assessment
Discussion of commercial terms
Decision of the investment committee
Feasibility study
Tracking impact of these on portfolioR
S
A
A
S
S
S
S
S
S
A
A
A
A
People Processes
Org chart of RAS allocations
RAS matrix
Linking table by allocation of time
Data Driven Organization Design_Newproof.indb 42 7/6/2015 4:24:33 PM

Foundations and Core Concepts 43
chart. They both have positions as rows and, in this example, activities as columns. You can then fill in the gaps to mark which roles are connected to which activities and to see how this affcets each person within the organ-izational hierarchy.
RACI, RASIC, RAPID – cut out the complexity
A tool often used for linking is the accountability matrix. I came across this method the first time I did an OD project for the sales and marketing function of an automotive company in South Africa in the 1990s. At 5.15 pm on a Friday in early summer, 15 minutes before I was due to join my col-leagues for a well-earned beer, I got a call from the German office explaining they were urgently short of a consultant and off I went to the airport, files in hand and an angry girlfriend left behind for six weeks.
My experience of OD was limited to say the least. I had just completed a restructuring of a UK automotive distributor, but it was obvious I was not the first choice. During the flight I had to prep for the 9 am kick-off meeting and, as part of that, for the first time I came across the RACI accountability framework. This framework helps determine who is Responsible (R), Accountable (A), Consulted (C) or Informed (I) for a set of fields such as objectives, risks, projects, processes, activities and so on.
A series of questions came to mind:
●● What is the difference between being Accountable and Responsible?
●● How important was it to really define who needed to be Consulted and Informed?
●● What about other people who needed to be involved in actually doing the work?
●● Making decisions is different from doing ‘stuff’ – what about all those who have a veto on a decision, or feel they do?
●● The point of the A and R is that there should be only one person per role (ie single points of Accountability). But, what if there are two decision makers (ie two people have veto power)?
What I didn’t think of until much later, but having done this numerous times since, is once this has been defined, how do you sustain it? How do you communicate it? How do you make it live? Too often we define things like a RACI as a one-off. People make a big fuss about whether they are consulted before a decision is made or informed after it is made. But this
Data Driven Organization Design_Newproof.indb 43 7/6/2015 4:24:33 PM

Part One: Introduction44
framework just creates an unnecessary amount of detail, and is completely unrealistic to maintain.
Whenever I did an org piece, whether using RACI, RASIC (the S stands for ‘Support’) or RAPID (a framework used by the consulting firm Bain with the specifications Recommend, Agree, Perform, Input and Decide), all those questions remained. In particular, I became tired of trying to explain the difference between R and A: ‘The R needs to make sure it happens; the A gets shot if it doesn’t and, yes, they are often the same person.’ Equally, having debates about who exactly needs to be informed or consulted is fairly painful. If you debate that one for hours you really know you are going to struggle. Shouldn’t the person responsible also be responsible for working that one out? Shouldn’t we just say that the R and A is the same person? If it is a decision, should we need to know who needs to approve it (ie who has a veto)? From a workforce planning and resourcing perspective, isn’t it important to know who needs to be involved? My conclusion was that you must be able to simplify the whole thing. In response to this I thought through an RAS method for the accountability matrix:
1 Combine R and A – just have R and define it as Responsible and Accountable.
2 Throw out I and C – leave it to the person Responsible to define who needs to be Informed and Consulted.
This just gives you the R – one letter for defining the one person who is responsible. Simple.
But equally there are scenarios where it is useful to:
1 define who needs to approve a decision to help clarify the governance;
2 think through who else needs to provide time to get the work or decision done.
This leads to a simple ‘RAS’ framework as shown in Figure 1.3.9. It is a simple way of making sure accountability settings for processes and activities are not held up by unnecessary conversations, meetings and complications.
Assigning accountabilities to each process and activity provides clarity to everyone, both the person responsible for any given activity and those around him or her. The example in Figure 1.3.8 has the Financial Adviser responsible for five activities and supporting a further four. Using this RAS framework you can allocate who is responsible for what and what is required from each role. It isn’t easy to build an accountability matrix. It requires you not only to define the processes and activities, but also to think through the roles
Data Driven Organization Design_Newproof.indb 44 7/6/2015 4:24:33 PM

Foundations and Core Concepts 45
Figure 1.3.9 RAS methodology
Ensures output or end result
Veto power on a decision and signs off actions
Provides information, analysis and other support to person responsible
ACCOUNTABLE
INFORMED CONSULT
KEEP IT SIMPLE,
CLEAR AND CLEAN
THROW OUT
THE COMPLEXITY
RESPONSIBLE
APPROVE
SUPPORT
and define that link. It can be highly political and can often uncover cracks where either no one is currently responsible or multiple people are. So why bother? Why not just let people sort it out and get on with it?
First, it is true you can waste too much time on the detail. Referring back to the process of building your organizational hierarchies, this is why you need to make sure you don’t overcomplicate things. If you have endless hierarchies and detail there is no point connecting everything in infinite detail. So, to make sure you don’t go too far, start at the top. Connect the highest levels and then cascade down. Make a judgement call when you think you are going into too much detail and prescribing too much. After all, people can build the matrix out at a team level if they feel the need to formalize roles and focus. Part Three of this book defines in far more detail how best to do this and provides far more context-specific examples.
Second, putting a framework in place is useful, but it is not simply a box-ticking exercise. So to make it useful, make sure you think through the framework in practice and the amount of ‘political noise’ that will be generated by the numbers involved in the governance elements of the process design, such as the decision-making processes. This is expanded further in Chapter 3.3.
Data Driven Organization Design_Newproof.indb 45 7/6/2015 4:24:33 PM

Part One: Introduction46
It is worth mentioning that I am not suggesting that the RAS method is the only way to build out these links. For example, instead of (or in addition to) the RAS matrix you could define the percentage of time that a person spends doing each activity, as with an Individual Activity Analysis (IAA – a method I outline in Chapter 3.4). Once this information is collected, you can define the cost of each activity and process that lead to a vast range of insights and improvement potentials.
The principle of creating an accountability matrix can be applied across all the areas of the organizational system. For example, you can link roles to process and objectives, process to competencies and, therefore, indirectly linking roles and competencies together. Suddenly, the pieces of the jigsaw begin to fit together. You are starting to build out your graph. You can begin to analyse and get insight into which competencies are most in demand. If you then define which competencies each person has, then you know where the greatest gaps are and can prioritize your training and recruitment of specific skills. You can also begin scenario modelling. For example, what if you improved the efficiency of a given activity, then who would be impacted and what would the FTE reduction be? Part Three details how to do this and the ramifications of doing it in far more detail.
My final note on this section is that these connecting principles set the platform for high value adding analysis by performing ‘data mashing’. This is the process of bringing disparate sets of data together to look for and uncover new areas of insight. For example, combining your people data with sales data or network data to see where the hidden connections are. The possibilities are endless. However, the key is to get the basics in place so you can really start to explore how your people both impact and are impacted by areas across the whole.
To fully understand these links you need a way of presenting and inter-preting that information. And here we come to the final and, in many ways, the most important method: visualize to analyse and understand.
Method 3: visualize to analyse
The process of visualizing and analysing information is the foremost prin-ciple in understanding the many-to-many links and connections of the organizational system. It is the very essence of this book. Having looked at a range of definitions, I understand analytics as the revelation, understand-ing and communication of insights from data. In other words, analytics is more than just having and looking at data. Analytics if used in the right
Data Driven Organization Design_Newproof.indb 46 7/6/2015 4:24:33 PM
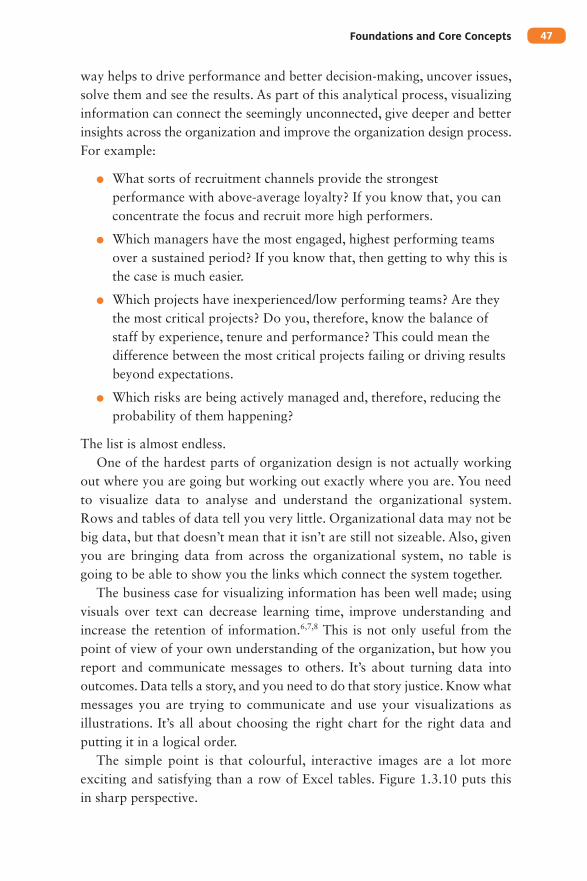
Foundations and Core Concepts 47
way helps to drive performance and better decision-making, uncover issues, solve them and see the results. As part of this analytical process, visualizing information can connect the seemingly unconnected, give deeper and better insights across the organization and improve the organization design process. For example:
●● What sorts of recruitment channels provide the strongest performance with above-average loyalty? If you know that, you can concentrate the focus and recruit more high performers.
●● Which managers have the most engaged, highest performing teams over a sustained period? If you know that, then getting to why this is the case is much easier.
●● Which projects have inexperienced/low performing teams? Are they the most critical projects? Do you, therefore, know the balance of staff by experience, tenure and performance? This could mean the difference between the most critical projects failing or driving results beyond expectations.
●● Which risks are being actively managed and, therefore, reducing the probability of them happening?
The list is almost endless.One of the hardest parts of organization design is not actually working
out where you are going but working out exactly where you are. You need to visualize data to analyse and understand the organizational system. Rows and tables of data tell you very little. Organizational data may not be big data, but that doesn’t mean that it isn’t are still not sizeable. Also, given you are bringing data from across the organizational system, no table is going to be able to show you the links which connect the system together.
The business case for visualizing information has been well made; using visuals over text can decrease learning time, improve understanding and increase the retention of information.6,7,8 This is not only useful from the point of view of your own understanding of the organization, but how you report and communicate messages to others. It’s about turning data into outcomes. Data tells a story, and you need to do that story justice. Know what messages you are trying to communicate and use your visualizations as illustrations. It’s all about choosing the right chart for the right data and putting it in a logical order.
The simple point is that colourful, interactive images are a lot more exciting and satisfying than a row of Excel tables. Figure 1.3.10 puts this in sharp perspective.
Data Driven Organization Design_Newproof.indb 47 7/6/2015 4:24:34 PM

Part One: Introduction48
Barb
ar...
Jayd
e...
Bill..
.
ArchieNorton
Spen
ce...
Rebe
cc...
Milli
e M
ann
Bren
t Kun
ze
Andr
ewSi
ngh
Barbar.
..
Ruby J
oyce
MichaelBurnham
Spence
...
Samua...
Ellen Ray
Charle...
Kennet...
Jacqueline
King
Hira...
Ryan
EmrichCorin... Lill...
Thomas
Cover
Toby KirkMatthew
Doyle
Joe Cooke
Archibald
Norton
Maria King
Norma...
Tega...Willia...
Jame...
MichaelCampo
Joett...EleanorCollins
Morris ClarkMildre...
AnthonyTurnbull
Harve...
Loga
nW
arre
n
Roy
Robe
rts
Willie Smith
TylerFitzgerald
LucasTurnbull
Brian Penley
SebastianSwift
Leah GilbertNichola...
Andre Crew
Nichola...
RebeccaStanley
Kenneth
Taylor
Elizabeth
Preston
Jake
Gallag
her
Luca Reid
Willia...
Baile...Deborah
Johnson
Domini...
Fran...
Elizabet...
Moham
ma...
Ev...Eve Sykes
Moniqu...
Constance
Kim
Jonathan
Daniels
Joh...
Han
nah
Pete
rs
Mic
hea.
..
Jean
Hub
bs
John
Stilli
ngs
Kyle
Pal
mer
Gab
rie...
Yola
nd...
Zach
ar...
Joh.
..
John
Jone
s
Ryan
Pag
e
Eva Hunter
David
Coy
le
Louis
...
Darre
l...
Leo A
llen De
mi Kem
pEdna H
owell
Lisa B
erry
James Dean
Violet Croy
Joe Hall
Michell...David LippRuby StellyEstell... Isaac
StanleyMargare...
Edwar... Georgia
James
Nathan
Nolan
Ronal...Natha...Denis...
MaddisonBennett
Harry Craig
Jacob Khan
Luk...
Christine
Jensen
Leo Moran
Greg Johns
Josh Singh
ThomasGurrola
Harve...Ada...
Billy ScottRich
Wheaton
Gar...Zoe Stevens
Paul DannerJoe...
Isobel
Brennan
Kia...Jam
es
Porter
ReeceHarris
VS
Figure 1.3.10 Data table versus sunburst visualization coloured by engagement
Data Driven Organization Design_Newproof.indb 48 7/6/2015 4:24:35 PM

Foundations and Core Concepts 49
The table of data and the visualization in Figure 1.3.10 hold the same information. The Excel file simply lists the reporting lines, engagement index, the depth and spans of control. The first row is the CEO, and each row is another position. The visualization is called the sunburst (you can see this type of image on the cover of this book). The circle in the middle is the CEO. Each position that reports to the CEO is shown on the next layer. The colour is the engagement based on an RAG status: Red for poorly engaged; Amber for just below average engagement; and Green for engaged. The number of layers can be differentiated by the distance from the centre. Early patterns in engagement can be picked up. This visual doesn’t convey all the relevant information but it is striking, easy to interpret and gives the person looking at it an immediate impression. By making your people data full of impact you will achieve more, and enjoy the process as you go.
There is a big debate in the world of data visualization. On one side is an emphasis on being scientific and precise, reducing subjective interpreta-tion of the data. One of the leading voices from this school is Stephen Few, who in his fantastic book Now You See It9 emphasizes minimizing the number of pixels in visualizations to ensure clarity. For example, using clean line charts, box plots or scatter plots over pie charts or infographics.
The other approach is to tell an emotive story: to not only convey infor-mation but also get a reaction from it. An example of this is the use of infographics to tell a story. This is an area explored by David McCandless in his book Knowledge is Beautiful,10 where the emphasis is as much on the power of the visual as the information it represents.
There is quite a clash between these two schools. The purist versus the poet, if you like. One blogger with a marketing background positions the debate strongly: ‘Do we seek to make art or is our primary goal to inform people about the state of the world around them?’11 The challenge is that while infographics are more engaging they can give a misleading view of the world. I believe you can actually get the best from both worlds, especi-ally in an organizational context. Often when representing organizational data you need to convey clarity and understanding while also engaging and creating an urge for action. I would tentatively put forward that an emergent third school: data visualization focused more specifically on hierarchical, organic and framework-driven information. This type of infor-mation naturally fits closely with organizational data, and brings together the thought process behind representing frameworks, models and structures with added clarity and insight from high-impact and comprehensive data visualization. I would argue that a great deal of organizational analysis falls
Data Driven Organization Design_Newproof.indb 49 7/6/2015 4:24:35 PM

Part One: Introduction50
Figure 1.3.11 Stacked bar graph versus sunflower visualization: performance ranking versus tenure coloured by location
Tenure Years
(513)0–2 (504)2–4 (461)4–6 (27)6 - 8
Per
form
ance
Ran
king
(181
)0–
2
57 55 68
Hannah Hall
(196
)2–
4
69 72 50
James Lyons
Karen Gill
Isabella Jenkins
Joe Hall
Sue Record
(428
)4–
6 Lisa Harvey
Herminia Timm
Charles Farias
Michael Clinton
Jay Davis
Linda Brown
Dennis Peters
Katy Fitzgerald
Aidan Hughes
Tyler Price
PerformanceRanking
Tenure Years
0–2
0–2 2–4 4–6
2–4
4–6
2
0
50
100
150
Cou
nt o
f Rec
ords
0
50
100
150
Cou
nt o
f Rec
ords
0
50
100
150
Cou
nt o
f Rec
ords
VS
Data Driven Organization Design_Newproof.indb 50 7/6/2015 4:24:35 PM

Foundations and Core Concepts 51
into this third category. I leave it up to you to decide if this represents a new genre entirely or simply a practical application of data visualization taking the best fron the other two.
Figure 1.3.11 illustrates how the same data can be visualized in very dif-ferent ways. The top figure shows a set of stacked bar graphs with the tenure ranges by performance scores. The sunflower figure below has the exact same information but shows each member of the various populations as a single coloured dot. I can see, for instance, that there are four people who have a tenure of 2–4 years with a 0–2 performance from the blue location. (The colour represents the locations of each employee.)
Hierarchical trees can be visualized in multiple ways and, in the context of organizational analytics and design work, they give the opportunity to see across the organization as a whole as you can visualize large amounts of information at once and present the organization for what it is: an organic, multifaceted system of people. Figure 1.3.12 shows several examples of hierarchical visualizations of organizational structures. Each one highlights a particular aspect of the organization. For example, Figure 1.3.12a allows you to see the organization as an organic whole. In contrast, the icicle chart (Figure 1.3.12c) helps to highlight the Span of Control and, when coloured by performance, whether there are any correlations between large spans of control and performance and any areas of the organization requir-ing particular focus.
If you are interested in reading more specifically on visualizing tree struc-tures do read The Book of Trees: Visualizing Branches of Knowledge by Manuel Lima.12
I believe that data visualization and analytics are the key not just to understanding the organization, but having an impact, making things happen and driving change. It is a theme that runs throughout this book. The type of visual you should use depends on the questions. If you want to understand the layers and structural pyramid, then a box grid is an extremely effective way of understanding the ‘shape’ of an organization, as shown in Figure 1.3.13.
However, if you are also interested in the spans of control and the layers, Figure 1.3.14 brings that to life. The rows are the layers (the depth) and the columns are the spans of control (outgoing count). The numbers in each cell represent the number of employees with those spans for the given layer. This has been coloured according to a traditional blue-to-red heat map where blue is infrequent and red frequent.
Data Driven Organization Design_Newproof.indb 51 7/6/2015 4:24:35 PM

Part One: Introduction52
Figure 1.3.12 Example organizational tree layouts
(a) Balloon tree layout
Data Driven Organization Design_Newproof.indb 52 7/6/2015 4:24:36 PM

Foundations and Core Concepts 53
Figure 1.3.12 Cont’d
100CEO
25CFO
25COO
25ExecutiveAssistant
25HR
Director
25Sales
Director
25Head of
Research
25Head ofDelivery
11.1
GroupFinancialController
11.1
Secretary
11.1
Head ofDistribution
ProgrammeManager
ProgrammeManagerProgramme
Manager
ProgrammeManager
11.1
HRManager
11.1
HR Manager
11.1
HRManager
11.1
Head ofAdmin
11.1
Secretary
11.1
Head ofRecruitment
11.1
Secretary11.1
Salesmanager
11.1
Salesmanager11.1
Salesmanager
11.1
Salesmanager
11.1
ProgrammeManager
11.1
ProgrammeManager
11.1
ProgrammeManager
11.1
ProgrammeManager
11.1
ProgrammeManager
11.1
ProgrammeManager
11.1
ProgrammeManager 11.1
ProgrammeManager
11.1
ProgrammeManager 11.1
ProgrammeManager
11.1
DeliveryGrade 2
6.25
Recruitmentresource
6.25
Recruitmentresource
6.25
Recruitmentresource
6.25
Recruitmentresource
6.25
Secretary
(b) Scaled balloon layout
Bar
bar.
..M
olly
Whi
teA
va W
ilkin
s
Arc
hie
Nor
ton
And
rew
Sin
gh
Rub
yJo
yce
Michael Burnham
Jacq
uelin
eK
ing
Rya
nE
mric
h
Tho
ma.
..M
atth
e...
Arc
hiba
ldN
orto
n
Maria King
Mic
hael
Cam
po
Ele
ano.
..M
orris
Cla
rkA
ntho
nyT
urnb
ull
Loga
nW
arre
n
Roy Roberts
Tyl
e...
Bria
n P
enle
yS
ebas
tian
Sw
ift
Reb
ecca
Sta
nley
Eliz
abet
hP
rest
on
Jake Gallagher
Deb
orah
John
son
Eve
Syk
es
Con
stan
c...
JonathanDaniels
John
Stil
lings
Kyl
eP
alm
erR
yan
Pag
e
Eva Hunter
Dem
iK
emp
Edn
aH
owel
lV
iole
tC
roy
Joe Hall
Isaa
cS
tanl
ey
Geo
rgia
Jam
es
NathanNolan
Mad
diso
nB
enne
ttH
arry
Cra
ig
Jaco
bK
han
Christine Jensen Leo
Mor
an
Greg Johns
Josh Singh
Tyl
er S
wift
Cha
rles
Far
ias
Tho
mas
Gur
rola
Ric
hW
heat
onP
aul D
anne
r
Joe.
..
Isobel Brennan
Sea
n E
llis
Kia
...
Nao
m...
James Porter
Reece Harris
(c) Icicle layout
Data Driven Organization Design_Newproof.indb 53 7/6/2015 4:24:36 PM

Part one: Introduction54
F igure 1.3.13 Box grid visualization of organizational depth (layers pyramid)
Dep
th
9
8
7
6
5
4
3
2
1
774
1,50
5
49
774
264
168
143
82
19
5
1
1,505
Records
774
1
Dep
th
9
8
7
6
5
4
3
2
1
1,50
5
49
774
264
168
143
82
19
5
1
1,505
Records
774
1774
49
264
168
143
82
19
5
1
774
Count of Records by Records and Depth
F igure 1.3.14 Box grid visualization: heat map of depth versus span of control (outgoing count)
Dep
th
0 1 2 3 4 5 6 7 8 9 10 11 12 13 14 15 16 28 33
7
6
5
4
3
2
1
49
862
290
71
3
1
1
1
1
1
7
1
4
1
1
15
2
9
1
22
6
4
1
17
12
1
2
1
14
2
2
1
10
2
1
1
13
7
2
1
17
5
3
1
10
3
1
7 3
1
1
1
1 1 3 2 1 1
1,27
5
4 14 27 34 32 19 14 23 26 15 7 5 2 1 3 2 1 1
49
870
427
122
29
7
1
1,505
Span of control
862
1
Count of Records by Outgoing Count and Depth
Data Driven Organization Design_Newproof.indb 54 7/6/2015 4:24:36 PM
Foundations and Core Concepts 55
A cornerstone of my belief in the power of data visualization and how it supports organization design is that visuals should be interactive, providing a seamless interaction with data from collection, through cleansing and analysis to manipulation and modelling. (The idea of cleansing data visually is one I explore in more detail in Chapter 3.2) By playing with data visually you will make your life so much more enjoyable. The future is one where you can work with data visually, manipulating and changing visualizations that automatically alter data at source.13 This is the Internet of Things applied to organization design and it is the logical next step from the touch-screen interactive technology we have come to expect in our everyday lives.
Model the to-be
There is so much value to be gained from visualizing and analysing the as-is of an organization. It is truly game changing to visualize and analyse future scenarios and decisions. This is the heart of good organization design, whether it is process design, objective setting, rightsizing or workforce planning.
However, at this point we are still in the world of moving boxes round a PowerPoint slide. We want to get to where, in the scenarios you plan, you can see all the elements of the organizational system shift with each change. Then you can see the gaps, the opportunities, the risks and take action accordingly.
Tracking and sustaining performance
It is all very well getting the edge, but that in itself achieves little if you cannot sustain it. You have to find a way to track changes and performance over time. For example, take an objective. Can you set up a process so you can see the before and after effects of an organizational change?
Going through all these processes creates a virtuous circle. If you can see where you are you can plan for change; if you can plan for change you can make better decisions; if you track results you can maintain your understand-ing of the as-is and look for improvements – and so on.
With this in mind I see organization design as an ongoing process rather than one of intervention. Designs should be being tweaked, honed and improved all the time. It is only through data visualization and analytics that this can be made possible.
Data Driven Organization Design_Newproof.indb 55 7/6/2015 4:24:36 PM

Part One: Introduction56
Final thoughts: see it as a journey
The concepts in this section and book are too penetrating to implement in one go as there is so much to define. In writing this book I have tried to break down each element of the system to make it easier to implement areas one at a time depending on your priorities.
By phasing the work, you should build institutional knowledge. The direction of analysis has to move from static snapshots to seeing change over time. Data is constantly changing and flow: both actuals and forecasts move. It is about seeing how these both change over time, their relationships with each other, what the gaps are, whether the gap is increasing or narrow-ing and whether you can find any causal relationships (for example, number of objectives owned by each person and the success rates of achieving the objectives) so that you can improve performance.
By creating, linking and visualizing your organizational hierarchies, the depth of analysis you can achieve is remarkable. For example, you can see the links between individual and objective performance, and then dive into whether an individual who is underperforming has missing competencies that are trainable, is overloaded with too many new objectives, or is work-ing for a new manager who has historically had significantly higher than reasonable team attrition. Once the data is in place, you can really start to have fun and see the value flow.
Building an understanding of any framework takes time and I’m sure many of you will be thinking that this interconnected vision is a fantasyland, given that many organizations struggle to understand their headcount alone. But organization design is a journey and you can never do all the work or change everything in one go. I hope the methods and ideas in this book help to facilitate change at all stages of organization design, whether in answer-ing the most basic questions or performing complex advanced analytics. The ideas in this chapter will help to navigate the remainder of this book.
Data Driven Organization Design_Newproof.indb 56 7/6/2015 4:24:36 PM

Foundations and Core Concepts 57
notes
1 Mohrman, S (2007) Organization Design for Growth: the Human Resource
Contribution , Centre for Effective Organizations, 07–10 (520), p 4
2 Stanford, N (2007) Guide to Organization Design , p 3, Profi le Books Ltd, London
3 Galbraith, J (2012) The Evolution of Enterprise Organization Designs, Journal of Organization Design , 1 (2), pp 1–13
4 Slinger, G and Morrison, R (2014) Will Organization Design Be Affected By Big Data? Journal of Organization Design , 3 (3), pp 31–39
5 Minto, B (2008) The Pyramid Principle: Logic in thinking and writing , Prentice Hall
6 McDaniel, M and Einstein, G (1986) Bizarre imagery as an effective memory aid: The importance of distinctiveness, Journal of Experimental Psychology:
Learning, Memory, and Cognition , 12 (1), pp 54–65
7 Patton, W (1991) Opening students’ eyes: Visual learning theory in the Socratic classroom, Law and Psychology Review , 15 , pp 1–18
8 Verdi, M P et al (1997) Organized spatial displays and texts: Effects of presentation order and display type on learning outcomes, Journal of
Experimental Education , 65 , pp 303–17
1 See the organization as an interconnected system.
2 Build organizational data through taxonomies across each area of the system.
3 Organizational data is not big data, and contain many-to-many relationships.
4 Connect the organizational system through hierarchy building and by using links through percentage of time, competencies scores or acronyms like RAS in the accountability matrix.
5 Make it visual because the way you see the world defi nes how you understand it.
Remember this
Data Driven Organization Design_Newproof.indb 57 7/6/2015 4:24:37 PM

Part One: Introduction58
9 Few, S (2009) Now You See It, Analytics Press
10 McCandless, D (2014) Knowledge is Beautiful, William Collins
11 McDaniel, S [accessed 11 January 2015] Stephen Few versus David McCandless, Freakalytics [Online] https://www.freakalytics.com/blog/2011/07/08/stephen-few-vs-david-mccandless-my-thoughts/
12 Lima, M (2014) The Book of Trees, Princeton Architectural Press
13 Kristi, M (2014) Support the Data Enthusiast: Challenges for Next-Generation Data-Analysis Systems, Proceedings of the VLDB Endowment, 7 (6), pp 453–56
Data Driven Organization Design_Newproof.indb 58 7/6/2015 4:24:37 PM

Lecturers adopting the book as a core text for their course will be able to obtain complementary access for all students to Orgvue for
the duration of the course, and for up to 6 months after graduation. Please contact [email protected] to find out more.
For more information including bulk orders, academic adoptions and press inquiries, please contact us at [email protected].
To request your inspection copy or (pre-)order the book, please visit http://www.koganpage.com/product/data-driven-organization-
design-9780749474416. We will ship the book as soon as it publishes on the 3rd October 2015.
Follow us on @KPCoachHR or @KoganPageEmail us on [email protected]
Visit our website on http://www.koganpage.com
Data Driven Organization Design_Sample.indd 34 6/18/2015 1:39:45 PM