data collection survey on railway sector in the republic
TRANSCRIPT

Data Collection Survey on
Railway Sector in
the Republic of South Africa
Final Report
March 2013
Japan International Cooperation Agency (JICA)
Japan International Consultants for Transportation Co., Ltd. Mitsubishi Research Institute, Inc.
AFD
JR
13-005


Data Collection Survey on
Railway Sector in
the Republic of South Africa
Final Report
March 2013
Japan International Cooperation Agency (JICA)
Japan International Consultants for Transportation Co., Ltd. Mitsubishi Research Institute, Inc.


Republic of South Africa
Basic Data of the Republic of South Africa Source: Ministry of Foreign Affairs “Regional Affairs”
Area: 1.22 million km2 (approximately 3.2 times the area of Japan)
Total trade amounts (1)Exports 61.1 billion USD (2009)
Population: 49.99 million (2010, World Bank) (2)Imports 63.9 billion USD (2009)
Population growth rate: 1.4% (2010, World Bank) Administrative capital: Pretoria Main trading items Ethnic groups: blacks, whites, colored, and Asians ( 1) Exports: Gold, rare metals, mining products,
chemical products, food, textile products, and diamond Languages: 11 official languages, including English, Afrikaans, and Bantu languages (Zulu, Sotho, etc.) (2)Imports: Machinery, automobile, chemical products,
scientific equipment, textile products, plastics, and rubber
Religion: Christians (80% of population), Hinduism, and Islam Main trading partners Main industries: agriculture, mining, and industry (1)Exports: China, USA, Japan, Germany, and UK
(2009) GDP: 363.7 billion USD (2010, World Bank) (2)Imports: China, Germany, USA, Saudi Arabia, and
Japan (2009) GNI per capita: 6,090 USD (2010, World Bank) Currency: rand 1 USD=8.648 ZAR (as of Oct. 2012)
Economic growth rate: 2.8% (2010, World Bank) 1 ZAR=9.207 yen (as of Oct. 2012)
Inflation rate: 4.3% (2010, World Bank) Japanese aid (aggregates as of FY 2009) Unemployment rate: 23.8% (2009) (1)Loan assistance: 20.145 billion yen
(2)Grant aid: 13.071 billion yen
(3)Technical assistance: 8.062 billion yen

Overview of South African Railways
1.TRANSNET
Item Contents Remarks
Type of transport Freight transport
Presiding department Department of Public
Enterprises (DPE)
Operating entity TRANSNET Freight Rail
(TFR)
Number of employees 24,000 Number of TFR
employees
Gauge 1,065 (mm)
Route length 20,953 (km)
Length of main lines 12,801 (km)
Length of branch
lines
Active lines 3,928 (km) See Chapter 3, Figure
3-3 Closed lines 3,350 (km)
Lifted lines 874 (km)
Electrified sections
50kV AC 861 (km)
See Chapter 4, Figure
4-8
25kV AC 2,309 (km)
3kV DC 4,935 (km)
Total of electrified
sections 8,105 (km)
Non-electrified sections 11,974 (km)
Axle load
Main line 20 (tons)
Coal Line, Iron Ore
Line 30 (tons)
The Coal Line is
operated with axle load
of 26 tons.
Length of main
lines
Iron Ore Line 861 (km) Sishen–Saldanha
Coal Line 450 (km) Ermelo–Richards Bay
Manganese Line 1,000 (km) Kimberley–Port
Elizabeth
Number of train
cars
EL 1,565
DL 1,092
Freight Cars 77,849
Transport volume
(FY 2011)
Iron ores for export 52.3 million (tons/year)
Coal for export 67.7 million (tons/year)
General freight 81 million (tons/year)
Total 201 million (tons/year)
Source: Compiled by Survey Team

2.PRASA
Item Contents Remarks
Type of transport Passenger transport
Commuter transport in
cities (Metrorail), Intercity
passenger transport
(Shosholoza Meyl)
Presiding department Department of Transport
(DOT)
Number of employees 16,000
Gauge 1,065 (mm)
Method of electrification 25kV AC
3kV DC
Axle load 20 (tons)
Metrorail
route length
Johannesburg 360 (km)
Pretoria 120 (km)
Cape Town 370 (km)
Durban 208 (km)
East London 49 (km)
Port Elizabeth 43 (km)
Total length 1,150 (km)
Number of
train cars
EMU 3,920
Passenger Cars 1,223
Transport
volume of
Metrorail
(FY 2010)
Johannesburg,
Pretoria 636,000 (passengers/day)
Cape Town 441,000 (passengers/day)
Durban 189,000 (passengers/day)
East London, Port
Elizabeth 27,000 (passengers/day)
Total 1.293 million (passengers/day)
Operation routes of Shosholoza
Meyl
(Use TRANSNET tracks)
Johannesburg–Cape Town 6 (trains/week)
Johannesburg–Durban 6 (trains/week)
Johannesburg–Port Elizabeth 3 (trains/week)
Johannesburg–East London 6 (trains/week)
Johannesburg–Komatipoort 3 (trains/week)
Johannesburg–Musina 3 (trains/week)
Source: Compiled by Survey Team

3.GAUTRAIN
Item Contents Remarks
Type of transport Passenger transport Intercity passenger transport,
airport rail link
Construction/operation
method Public-private partnership (PPP)
Operation company Bombela Consortium 20-year PPP contract with
Gauteng provincial government
Gauge 1,435 (mm)
Method of
electrification 25kV AC
Route length 80 (km)
Operating sections
Hatfield Station–Park Station
(North–South Line)
Sandton Station–Rodesfield
Station (East–West Line)
Sandton Station–O.R.Tambo
Station (Airport rail link)
See Chapter 3, Figure 3-10
Number of stations 10 stations
Maximum operating
speed 160 (km/h)
Number of train cars 96 (cars)
Transport volume 40,000 (passengers/day)
Source: Compiled by Survey Team
1
Data Collection Survey on Railway Sector in the Republic of South Africa Contents
Abbreviation
Summary .................................................................................................................. S-1
Chapter 1 Background and Objectives of Survey .................................................... 1-1
1.1 Background of Survey .................................................................................... 1-1
1.2 Objectives of Survey ...................................................................................... 1-2
1.3 Scope of Survey ............................................................................................. 1-2
1.4 Contents of Survey ........................................................................................ 1-2
1.5 Survey Team Members .................................................................................. 1-5
Chapter 2 Social and Economic Conditions of South Africa ..................................... 2-1
2.1 Basic Information ........................................................................................... 2-1
2.2 Policies and Systems ................................................................................... 2-10
2.3 Transport Sector .......................................................................................... 2-22
Chapter 3 Current State of Railway Sector and Issues ........................................... 3-1
3.1 Overview of Railway Sector in South Africa .................................................... 3-1
3.2 Current State of Railway Transport and Challenges ..................................... 3-10
3.3 Progress of Development Plan and Challenges ........................................... 3-14
3.4 Current State of Regulatory Systems and Challenges .................................. 3-30
3.5 Overview of Railway-related Companies ...................................................... 3-34
Chapter 4 State of Technology and Challenges of Railway Sector ........................... 4-1
4.1 State of Technology and Challenges of Railway-related Fields ...................... 4-1
4.2 Brief Review of Applicable Standards ........................................................... 4-25
4.3 Current State and Challenges of Related Private Sectors and
Supporting Industries ................................................................................... 4-32
4.4 Current State of Job Skills Training and Challenges ..................................... 4-42
4.5 State of Locomotive Maintenance ................................................................ 4-46
Chapter 5 Risk Factors of the Railway Sector Investment Plan ............................... 5-1
5.1 Financial Analysis and Investment Plans of the National
and Provincial Governments .......................................................................... 5-1
2
5.2 Investment Plans if Railway Modernization Policy is Adopted (Risk seen
fromdemand forecast in the PRASA and TRANSNET Investment Plan) ...... 5-13
5.3 Financing Prospect ...................................................................................... 5-19
5.4 Brief Review of Social/Economic/Environmental Impacts of
Current Investment Plans ............................................................................ 5-21
5.5 Decision-making Mechanisms of the Department of Transport,
Department of Public Enterprises, and Provincial Governments .................. 5-27
5.6 Economic Ripple Effect ................................................................................ 5-32
5.7 Risk Factors of Investment Plan for the Railway Sector ............................... 5-35
Chapter 6 Initiatives of Private Sector and Other Countries ..................................... 6-1
6.1 Initiatives of Japanese Companies ................................................................. 6-1
6.2 Involvement of Other Governments in Related Provinces and Railway Lines . 6-5
Chapter 7 Roadmap for the Modernization of the Railway Sector ............................ 7-1
7.1 Review Appropriate Technologies .................................................................. 7-1
7.2 Comparing the Technologies of Japan and Other Countries ........................... 7-9
7.3 Feasibility of Localizing the Production Processes of Rolling Stock and
Equipment of Japanese Companies ............................................................ 7-14
7.4 Roadmap ..................................................................................................... 7-23
Chapter 8 Overview of the Outcomes of South Africa–Japan Railway Conference .. 8-1
8.1 Overview of Railway Conference ................................................................... 8-1
8.2 Contents of Railway Conference .................................................................... 8-2
8.3 Summary of Main Opinions ............................................................................ 8-6
8.4 Major Questions and Answers ........................................................................ 8-9
8.5 Results of Questionnaire .............................................................................. 8-11
8.6 Summary of the Outcomes of the South Afirca-Japan Railway Conference . 8-12
Chapter 9 Summary and Recommendations ........................................................... 9-1
9.1 Recommendations for the Modernization of the Railway Sector in
South Africa ................................................................................................... 9-1
9.2 Challenges to Review in the Future ................................................................ 9-5

3
Figure List Figure 2-1 Age Group of Population in South Africa ....................................................... 2-2
Figure 2-2 Race Composition in South Africa ................................................................. 2-2
Figure 2-3 Provinces and Major Cities ............................................................................ 2-3
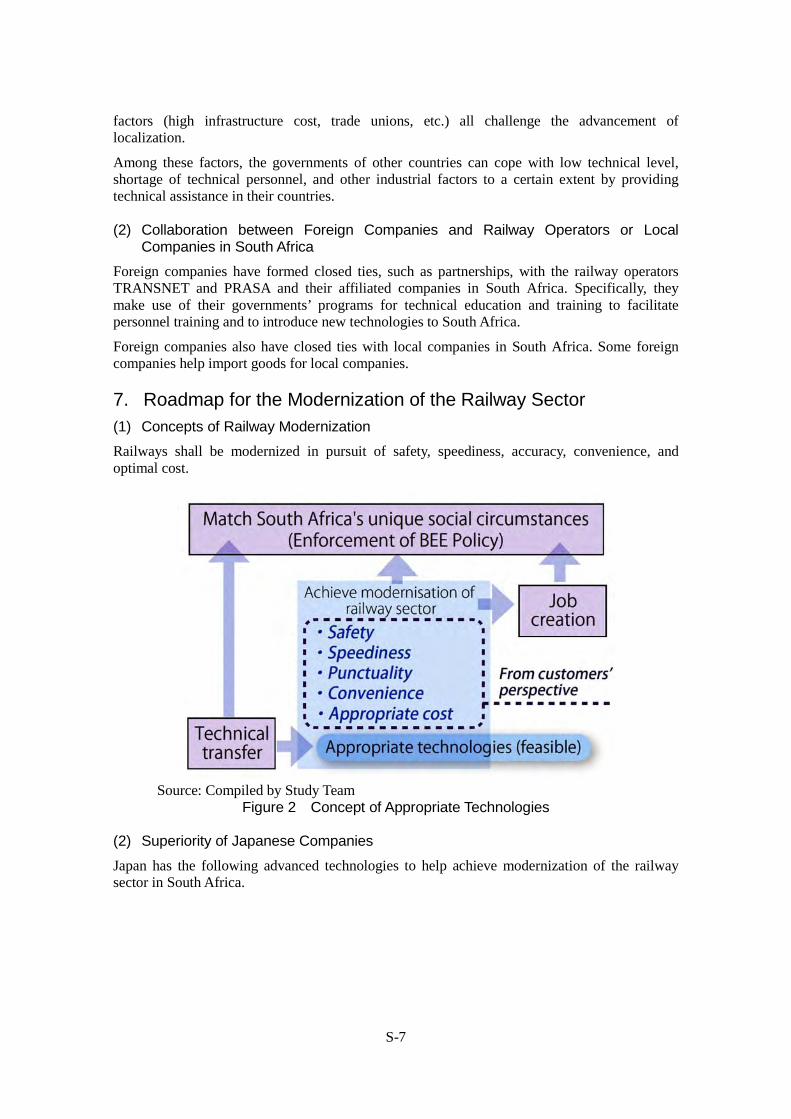
Figure 2-4 Changes in South Africa’s Nominal GDP and Growth Rate ......................... 2-4
Figure 2-5 Changes in South Africa’s Nominal GDP per Capita and Growth Rate ........ 2-5
Figure 2-6 Changes in GDP by Income Class ................................................................ 2-5
Figure 2-7 Population Ratio by Race (Left) and Income per Household (Right)
in South Africa (as in 2005–06) ..................................................................... 2-6
Figure 2-8 Employment Number in April–June 2012 and Year-over-year Growth Rate 2-7
Figure 2-9 GDP Ratios by Sector .................................................................................... 2-7
Figure 2-10 Ratio of Export Amount by Industry ............................................................. 2-8
Figure 2-11 Distribution of Mineral Resources................................................................ 2-9
Figure 2-12 Exports Statistics by Export Item (2010 and 2011) ..................................... 2-10
Figure 2-13 Diagram of Relationship for BEE-related Laws and Regulations ............... 2-16
Figure 2-14 BEE Policy Applied in the Typical Structure of a PPP ................................ 2-22
Figure 2-15 Changes in the Volume of Rail Freight ........................................................ 2-23
Figure 2-16 Shares of Commuter Transport ................................................................... 2-23
Figure 3-1 Organization Chart of TRANSNET ................................................................ 3-2
Figure 3-2 TRANSNET Route Map ................................................................................. 3-3
Figure 3-3 Core Network and Branch Lines .................................................................... 3-4
Figure 3-4 Axle Load of Various Routes ......................................................................... 3-4
Figure 3-5 Investments in TFR and TRE until FY 2011 .................................................. 3-5
Figure 3-6 Organization Chart of TRE ............................................................................ 3-6
Figure 3-7 Organization Chart of PRASA ....................................................................... 3-7
Figure 3-8 PRASA Route Map ........................................................................................ 3-8
Figure 3-9 Investments in PRASA until 2011 .................................................................. 3-9
Figure 3-10 Gautrain Route Map .................................................................................... 3-10
Figure 3-11 Changes in Transport Volumes .................................................................... 3-11
Figure 3-12 Overview of 7-Year Investment Plan ........................................................... 3-15
Figure 3-13 Investment Amounts of the 7-Year Investment Plan ................................... 3-15
Figure 3-14 7-Year Investment Plan by Group ............................................................... 3-16
Figure 3-15 7-Year Investment Plan by Facility .............................................................. 3-16
Figure 3-16 Forecast of Freight Transport Volume in the TRANSNET Long-term Plan . 3-18
Figure 3-17 Concept of the TRANSNET Systems .......................................................... 3-19
Figure 3-18 Planned Position of the New Swaziland Rail Link Plan............................... 3-23
Figure 3-19 Planned Position of Waterberg New Line .................................................... 3-24
Figure 3-20 Mid- and Long-term Plan for Signaling and Telecommunications ............... 3-27
Figure 3-21 Railway Network in Johannesburg and Its Vicinities ................................... 3-31
Figure 3-22 Example of the Supply Chain of a Rolling Stock Manufacturer
(Company A) ................................................................................................ 3-40

4
Figure 3-23 Example of the Supply Chain of an Electric Product Manufacturer
(Company B) ................................................................................................ 3-41
Figure 3-24 Example of the Supply Chain of a Coil and Rectifier Manufacturer
(Company C) ................................................................................................ 3-42
Figure 4-1 Configuration of a Freight Train on the Iron Ore Line .................................... 4-2
Figure 4-2 Assembly of EMU Car Body during Upgrade ................................................ 4-3
Figure 4-3 Age Distribution of Commuter Trains Owned by PRASA .............................. 4-5
Figure 4-4 Block Systems ............................................................................................... 4-7
Figure 4-5 Multi-aspect Signal System ........................................................................... 4-8
Figure 4-6 Multi-aspect Color Signal System .................................................................. 4-9
Figure 4-7 Interlocking Types and Average Ages (Metrorail) .......................................... 4-10
Figure 4-8 Metrorail Route Map in Cape Town Area ....................................................... 4-11
Figure 4-9 Theft Prevention Measure ............................................................................. 4-14
Figure 4-10 Map of Feeding Systems ............................................................................. 4-16
Figure 4-11 Indoor Facilities of a DC Substation ............................................................ 4-17
Figure 4-12 Transformer at an AC Substation ................................................................ 4-18
Figure 4-13 Feeding Sections along Railway Line ......................................................... 4-18
Figure 4-14 Transmission Development Plan ................................................................. 4-20
Figure 4-15 Track Condition of TRANSNET Lines (FY 2010) ........................................ 4-22
Figure 4-16 System of Railway Safety Standards .......................................................... 4-26
Figure 4-17 Example of Vehicle Gauge in South Africa
(in the case of 1065-mm gauge and ballast track) ...................................... 4-28
Figure 4-18 Construction Gauge in Horizontal and Vertical Directions .......................... 4-31
Figure 4-19 Platform Limit ............................................................................................... 4-32
Figure 4-20 Examples of Electric Locomotives ............................................................... 4-47
Figure 4-21 Workshops and Depots Surveyed ............................................................... 4-48
Figure 4-22 Conditions of Regular Inspection ................................................................. 4-49
Figure 4-23 Organization Chart of Workshop ................................................................. 4-50
Figure 4-24 Organization Chart of Depot ........................................................................ 4-51
Figure 4-25 Composition of Maintenance Team ............................................................. 4-52
Figure 4-26 Scenes of Training at SOE .......................................................................... 4-53
Figure 4-27 Postings of QC Activities.............................................................................. 4-54
Figure 5-1 Changes in the Expenditure of National Government (1) ............................. 5-2
Figure 5-2 Changes in the Expenditure of National Government (2) ............................. 5-2
Figure 5-3 Changes in the Expenditure of National Government (3) ............................. 5-3
Figure 5-4 Changes in the Revenue of National Government (unit: million ZAR) .......... 5-3
Figure 5-5 Debt (Net) Condition of the National Government ........................................ 5-4
Figure 5-6 Changes in Total Revenue of Provincial Governments
(Trend using the FY 2005 values of the provinces as 100) ........................... 5-4

5
Figure 5-7 Changes in the Expenditure of Provincial Governments
(Trend using the FY 2005 values of the provinces as 100) ......................... 5-5
Figure 5-8 Changes in the Transport/ Infrastructure-related Expenditure of Provincial
Governments (Trend using the FY 2005 values of the provinces as 100) .. 5-5
Figure 5-9 Projected Numbers of Future Population as the Premises of
Demand Forecast in NATMAP ..................................................................... 5-8
Figure 5-10 Future Economic Growth Rates as the Premises of
Demand Forecast in NATMAP ..................................................................... 5-9
Figure 5-11 Comparison of Future Population Numbers of South Africa ....................... 5-11
Figure 5-12 PRASA Demand Forecast Results .............................................................. 5-14
Figure 5-13 Forecast of GDP Growth Rate ..................................................................... 5-15
Figure 5-14 TRANSNET Demand Forecast Results from FDM ..................................... 5-16
Figure 5-15 TRANSNET Demand Forecast Result using Transportation Model ........... 5-17
Figure 5-16 TRANSNET Demand Forecast Result using Market Share Model (1) ....... 5-18
Figure 5-17 TRANSNET Demand Forecast Result using Market Share Model (2) ....... 5-18
Figure 5-18 Roles of Main Entities and Their Relationships ........................................... 5-29
Figure 5-19 Decision-making of Projects at PRASA ....................................................... 5-30
Figure 5-20 Job Creation Effect according to PRASA Investment Plan (Unit: person) .. 5-33
Figure 5-21 Effect of Tax Revenue based on PRASA Investment Plan
(Unit: million ZAR) ........................................................................................ 5-31
Figure 5-22 Projects Benefits based on PRASA Investment Plan (Unit: million ZAR) ... 5-34
Figure 5-23 Job Creation Plan based on TRANSNET Investment Plan ......................... 5-35
Figure 7-1 Concept of Appropriate Technologies ............................................................ 7-1
Figure 7-2 Schematic View of Slab Track ....................................................................... 7-5
Figure 7-3 Changes in Track Displacement at the Tohoku Shinkansen Line ................. 7-6
Figure 7-4 Changes in the Maintenance Cost of Sanyo Shinkansen Line ..................... 7-6
Figure 7-5 Economic Comparison of Ballast Track and Slab Track
(on viaducts and in tunnels) ........................................................................... 7-7
Figure 7-6 Abrasion Resistance of HE Rail .................................................................... 7-8
Figure 7-7 Changes in the Number of Suica Issued ....................................................... 7-9
Figure 7-8 Comparing the European and Japanese systems of Train Control System . 7-11
Figure 7-9 Changes in the Export Volume of Japanese Rail .......................................... 7-13
Figure 7-10 Concept of Rolling Stock Localization ......................................................... 7-15
Figure 7-11 Approach of Localization of the Signal Field ............................................... 7-17
Figure 7-12 Approach of Local Production of Track Materials (1) .................................. 7-18
Figure 7-13 Approach of Local Production of Track Materials (2) .................................. 7-18
Figure 7-14 Approach of Local Production of Slab Track ............................................... 7-19
Figure 7-15 Approach of Local Production of Automatic Ticket Gate for
Automatic Fare Collection ............................................................................ 7-19
Figure 7-16 Combination Approach to Localization ........................................................ 7-20

6
Figure 8-1 Evaluation of the Railway Conference .......................................................... 8-11
Figure 8-2 Evaluation of the Railway Sector Study ........................................................ 8-12

7
Table List
Table 1-1 List of Entities Visited ...................................................................................... 1-3
Table 1-2 Survey Team Member ..................................................................................... 1-5
Table 2-1 Major Departments under the President ......................................................... 2-4
Table 2-2 Changes in the Production Amounts of Mineral Resources in
South Africa (2008–2010) ................................................................................ 2-8
Table 2-3 Major Economic and Industrial Policies .......................................................... 2-12
Table 2-4 BEE Scorecard................................................................................................ 2-17
Table 2-5 BEE Contribution Level ................................................................................... 2-17
Table 2-6 Targets of EEA ................................................................................................ 2-19
Table 2-7 Seventeen Strategic Integrated Projects ........................................................ 2-20
Table 2-8 Lengths of Roads in South Africa ................................................................... 2-24
Table 2-9 Airport Infrastructure in South Africa .............................................................. 2-25
Table 2-10 Transport Volumes of Freight and Passengers by Air in South Africa ......... 2-25
Table 2-11 Freight Transport Volumes Handled by Ports in South Africa ...................... 2-26
Table 2-12 Overview of NATMAP Recommendations (Railway Sector) ........................ 2-27
Table 3-1 Overview of TRANSNET Lines ....................................................................... 3-3
Table 3-2 Breakdown of TFR Investment by Facility in FY 2009 .................................... 3-5
Table 3-3 Breakdown of TFR Investment by Transport Item in FY 2010 ........................ 3-5
Table 3-4 Functions of Various Factories ........................................................................ 3-6
Table 3-5 Job Functions of Various Departments ........................................................... 3-7
Table 3-6 Operation Sections of Shosholoza Meyl ......................................................... 3-8
Table 3-7 Daily Ridership of Metrorail ............................................................................. 3-12
Table 3-8 Shosholoza Meyl Ridership ............................................................................. 3-12
Table 3-9 Mean Time between Failures at Metrorail (April–August 2012) ...................... 3-13
Table 3-10 Comparison of Train Fare for the Same Section .......................................... 3-14
Table 3-11 Major Investment Projects for the Railway Sector ........................................ 3-16
Table 3-12 Investment Amount by Transport Item and Target Values of
Transport Volumes ......................................................................................... 3-17
Table 3-13 Rolling Stock Procurement Plan of TRANSNET ........................................... 3-17
Table 3-14 List of TRANSNET Mid-to-Long term Plans .................................................. 3-19
Table 3-15 Mid-and Long-term Plans of TRANSNET ..................................................... 3-20
Table 3-16 PRASA Modernization Project ...................................................................... 3-25
Table 3-17 Overview of Supporting Companies for the Railway Sector in
South Africa (Rolling Stock) ........................................................................... 3-34
Table 3-18 Overview of Supporting Companies for the Railway Sector in
South Africa (Signaling and Telecommunications) ........................................ 3-37
Table 3-19 Overview of Supporting Companies for the Railway Sector in
South Africa (Track) ....................................................................................... 3-37

8
Table 3-20 Overview of Supporting Companies for the Railway Sector in
South Africa (Construction) ............................................................................ 3-38
Table 3-21 Overview of Supporting Companies for the Railway Sector in
South Africa (Consultants) ............................................................................. 3-39
Table 3-22 Profile of Rolling Stock Manufacturer (Company A) ..................................... 3-40
Table 3-23 Profile of Electric Product Manufacturer (Company B) ................................. 3-41
Table 3-24 Profile of Coil and Rectifier Manufacturer (Company C) .............................. 3-42
Table 4-1 Specifications of Freight Cars Used on the Iron Ore Line and Coal Line ....... 4-2
Table 4-2 Types of Inspection for Electric Locomotives .................................................. 4-4
Table 4-3 Inspection Items of Commuter Trains (Running Inspection) ........................... 4-4
Table 4-4 Train Failures Causing Serious Accidents (TFR, April–June 2012) ................ 4-6
Table 4-5 Characteristics of Signaling Systems in Major Sections ................................. 4-8
Table 4-6 Weekly Train Operation Data .......................................................................... 4-12
Table 4-7 Weekly Reported Signal Incidents Data ......................................................... 4-13
Table 4-8 Number of Incidents and Main Causes ........................................................... 4-14
Table 4-9 Summary of Various Feeding Systems ........................................................... 4-16
Table 4-10 PRASA Maintenance Departments for Infrastructure Facilities .................... 4-22
Table 4-11 Cycles of Track Maintenance and Inspection ................................................ 4-22
Table 4-12 Investment Amounts for the Maintenance of Metrorail Tracks ...................... 4-23
Table 4-13 Railway Safety Standards Issued by SABS .................................................. 4-25
Table 4-14 Signal-related Companies by Job Function .................................................. 4-35
Table 4-15 Localization of Signaling Equipment and Devices ........................................ 4-36
Table 4-16 Signal Engineering Group ............................................................................. 4-38
Table 4-17 Educational System in South Africa .............................................................. 4-43
Table 4-18 NQF Levels and Education System .............................................................. 4-45
Table 4-19 Cycle of Each Shed, Inspection Contents, and Time Required .................... 4-48
Table 4-20 SOE system of TRE ...................................................................................... 4-53
Table 4-21 Maintenance Conditions at Various Workshops and Depots ........................ 4-55
Table 4-22 Status and Issues related to the Maintenance of Electric Locomotives ....... 4-72
Table 5-1 Review of the Financial Condition of South Africa by
International Organizations .............................................................................. 5-6
Table 5-2 Overview of the Investment Plans of Provincial Governments ....................... 5-9
Table 5-3 Main Contents of Relevant Laws and Regulations
and Their Relevance to Railway Projects ........................................................ 5-23
Table 5-4 Opinions and Information from Interviews ...................................................... 5-23
Table 5-5 Major Contents of Relevant Laws and Regulations
and Their Relevance to Railway Projects ........................................................ 5-24
Table 5-6 Major Opinions of and Information from Interviewed Entities ......................... 5-26
Table 5-7 A Process PRASA decides the Rolling Stock Fleet Renewal Programme ..... 5-31

9
Table 5-8 Contents of Risk Factors and Countermeasures ............................................ 5-35
Table 6-1 Delivery of Rolling Stock by Japanese Companies ........................................ 6-2
Table 6-2 Delivery of Rolling Stock by Foreign Companies in Recent Years ................. 6-5
Table 6-3 Quantities of UCW Rolling Stock Manufactured
and Delivery Data (1960 onward) .................................................................... 6-6
Table 6-4 No. of Locomotives Manufactured at UCW ..................................................... 6-6
Table 6-5 Examples of Initiatives by Foreign Companies
and the South Africa Railway Companies ....................................................... 6-8
Table 6-6 Examples of Collaboration between South African Companies
and Foreign Companies (at bidding) ............................................................... 6-8
Table 6-7 Examples of Collaboration between South African Companies
and Foreign Companies (on regular basis) ..................................................... 6-10
Table 6-8 Financial Assistance from the World to South Africa’s Railway Sector .......... 6-10
Table 6-9 Bidding Projects from FY 2012 Onward .......................................................... 6-11
Table 7-1 Comparing the Economic Efficiency of Ballast Track and Slab Track
for Shinkansen (on viaducts and in tunnels) ................................................... 7-7
Table 7-2 Market Sizes of Various Sub-sectors .............................................................. 7-9
Table 7-3 Characteristics of IC Cards by Type ................................................................ 7-13
Table 7-4 List of Equipment Targeted for Localization .................................................... 7-15
Table 7-5 Overview of Rolling Stock-related Companies................................................ 7-21
Table 7-6 Potential Candidates for Collaboration
with Japanese Companies (rolling stock) ........................................................ 7-22
Table 7-7 Overview of Signaling and Telecommunications-related Companies ............. 7-22
Table 7-8 Potential Candidate for Collaboration
with Japanese Companies (signaling and telecommunications) .................... 7-22
Table 7-9 Overview of Track-related Companies ............................................................ 7-23
Table 7-10 Potential Candidates for Collaboration with Japanese Companies (track) .. 7-23
Table 7-11 Assistance Tools of JICA ............................................................................... 7-24
Table 7-12 Roadmap for the Modernization of Railway Sector ...................................... 7-28
Table 7-13 Results of Sensitivity Analysis of the PRASA Demand Forecast.................. 7-29
Table 7-14 Results of Sensitivity Analysis of the TRANSNET Demand Forecast .......... 7-30
Table 7-15 Estimated Results of PRASA Investment Plan ............................................. 7-30
Table 7-16 Estimated Results of TRANSNET Investment Plan ...................................... 7-31
Table 7-17 Estimated Results of PRASA Job Creation Effects ...................................... 7-31
Table 7-18 Estimated Results of TRANSNET Job Creation Effects ............................... 7-32
Table 8-1 Schedule of the South Africa-Japan Railway Conference .............................. 8-2

10

11
ABBREVIATION
AFC Automatic Fare Collection ANC African National Congress APPA Atmospheric Pollution Prevention Act ASGISA Accelerated and Shared Growth Initiative for South Africa ATP Automatic Train Protection ATR Automatic Train Route Setting System AU African Union BA Basic Assessment BEE(B-BBEE) Broad-Based Black Economic Empowerment BOT Build-Operate-Transfer CCRD Consumer and Corporate Regulation Development Division CDM Clean Development Mechanism COGP Codes of Good Practice COSATU South African Trade Unions CSI Corporate Social Investment CTC Centralized Traffic Control System CTE Computer Transport Engineering DAEARD KwaZulu-Natal Provincial Government, Department of Agriculture,
Environmental Affairs and Rural Development DARD Gauteng Provincial Government, Department of Agriculture and
Rural Development DBSA Development Bank of Southern Africa DBT Dry Bulk Terminal DEAT Department of Environmental Affairs and Tourism DEL Diesel Electric Locomotive DHET Department of Higher Education and Training DL Diesel Electric Locomotive DOE Department of Energy DOT Department of Transport DPE Department of Public Enterprises DTI Department of Trade and Industry ECA Environment Conservation Act EDD Economic Development Department EEA Employment Equity Act EEDD Empowerment and Enterprise Development Division EIA Environmental Impact Assessment EL Electric Locomotive EMU Electric Multiple Unit EOI Express of Interest F/S Feasibility Study FEDUSA Federation of Unions of South Africa FMCG Fast Moving Consumer Goods FMMS Facilities Maintenance Monitoring System GFB General Freight Business GSSSD Group Systems and Support Service Division HPA Highveld Priority Area

12
IDC Industrial Development Corporation IDD Industrial Development Division IPAP Industry Policy Action Plan IRIS International Railway Industry Standards ITED International Trade and Economic Development Division JETRO Japan External Trade Organization JICA Japan International Cooperation Agency METI Ministry of Economy, Trade and Industry MFMA Municipal Finance Management Act MOP Mini Overhaul Program MOU Minutes of Meeting MPRDA Minerals and Petroleum Resources Development Act MPT Multi-Purpose Terminal MTSF Medium Term Strategic Framework NACTU National Council of Trade Unions NATMAP National Transport Master Plan NDP National Development Plan NEMA National Environmental Management Act NEPAD New Partnership for Africa's development NFA National Forest Act NGP New Growth Path NHRA National Heritage Resources Act NIPF National Industrial Policy Framework NPC National Planning Commissions NQF National Qualifications Framework NSDF National Skills. Development Framework NSDS National Skills Development Strategy NT National Treasury NWA National Water Act ODLS Operation Data Logging System OEM Original Equipment Manufacturer OTD Overhead Track Developments PFMA Public Finance Management Act PICC Presidential Infrastructure Coordinating Commission PPP Public-Private Partnership PPPFA Preferential Procurement Policy Framework Act PQ Pre-Qualification PRASA Passenger Rail Agency of South Africa PSC Passenger Safety Comfort RBCT Richards Bay Coal Terminal RME Rail Maintenance Engineering S&EIR Scoping & EIR SABS South African Bureau of Standards SADC Southern African Development Community SANAS South Africa National Accreditation System SANRAL South African National Road Agency Limited SAQA South African Qualification Authority SAR & H South African Railways and Harbors SARWHU South African Railways and Harbours Union SATAWU South African Transport and Allied Workers Union SATS South African Transport Services

13
SDA Skills Development Act SETA Sector Education and Training Authority SIP Strategic Infrastructure Plan SIP Strategic Integrated Project SOE State Owned Enterprise SOE School of Engineering SPV Special Purpose Vehicle SPX Subcontracting and Partnership eXchange SSA Sub-Sahara Africa STEP Special Terms for Economic Partnership TDMS Train Delay Managing System TEO The Enterprise Organization TetaSETA Transport Education and Training Authority SETA TEU Twenty-foot Equivalent Unit TFR Transnet Freight Rail TISA Trade Investment South Africa TNPA Transnet National Port Authority TOMS Train Operation Managing System TRE Transnet Rail Engineering UCW Union Carriage & Wagon VCET Vocational and Continuing Education and Training WSP Work Skill Program WSP Workplace Skills Plan


Summary


S-1
Summary
1. Background and Objectives of Survey (1) Background of Survey
President Zuma, who became the president of the Republic of South Africa (hereinafter referred to as “South Africa”) in 2009, positioned the development of infrastructure, including railway, a policy priority in his policy speech to the Parliament in February 2010. The Department of Transport (DOT) of South Africa has also been working on the National Transport Master Plan 2050 (NATMAP) since 2005. At this time, the draft final report has been published. It stipulates modernization of the passenger and freight transport and construction of high-speed railways.
When promoting railway modernization in South Africa, the development of railway-related industries and job creation through local production, made possible by technical transfer, will be important prerequisites. It is also necessary to pay attention to the Black Economic Empowerment (BEE) Act, which gives preferential treatment to historically disadvantaged South Africans (mainly black people) discriminated by Apartheid so as to enhance their social status and promote their participation in social activities.
The Japanese government also hopes to provide assistance to South African railways through projects that utilize Japanese technologies and operation expertise. The Ministry of Land, Infrastructure, Transport and Tourism (MLIT) conducted the “Preliminary Study on the Formation of High-speed Railway Plan in the Republic of South Africa Johannesburg–Durban Corridor” in FY 2010 and the Ministry of Economy, Trade and Industry (METI) conducted the “Study on High Speed Railway Project between Johannesburg and Durban in the Republic of South Africa” in FY 2011.
(2) Objectives of Survey and Target Areas
The objectives of this Survey are as follows:
To find out about the policies of the South African government for railway, project plans for modernizing the conventional railways, status of assistance from the private sector and other countries besides Japan, and to identify issues
To gather and analyze information necessary for prioritizing Japan’s technical assistance
To create a roadmap for modernizing the railway sector
To make recommendations for assistance measures The Survey covers South Africa as a whole. Among the nine provinces, the Survey focuses on Johannesburg, Durban, and Cape Town—the three metropolitan areas that are especially important to railway transport and the railway industry of South Africa. They are located in Gauteng Province, KwaZulu-Natal Province, and Western Cape Province, respectively. Other important railway lines surveyed include the Coal Line linking Ermelo and Richards Bay (450 km) in the eastern part of South Africa, the Iron Ore Line linking Sishen and Saldanha (861 km) in the western part of South Africa, and the Gautrain in Johannesburg that launched services in 2010. 2. Social and Economic Conditions of South Africa (1) Basic Information
South Africa has an area of 1.22 million km2, which is approximately 3.2 times the area of Japan. It has 49.99 million people. The composition ratios by race include black (79%), white (9%),

S-2
colored (mixed blooded) (9%), and Asian (3%). With ongoing urbanization at this time, there is increasing demand for daily transport means between residential areas and areas of consumption activities inside cities.
South Africa is blessed with many mineral resources, which account for 62% of the export amount. The GDP is 363.7 billion USD (as of 2010). The economy is expanding steadily at an average GDP annual growth rate of over 4% (except in 2009). South Africa is recognized worldwide as one of the emerging economies, known as BRICS.
(2) Policies and Legislative System
It has been pointed out that despite the abolition of Apartheid in 1994, inequality in the ownership of wealth and employment from the Apartheid era remains unresolved in South Africa today. The unemployment rate is high at 24.9% (as of 2012). The top priority of South Africa’s policies is job creation, with “Decent work” as the keyword. The Black Economic Empowerment (BEE) Act, an affirmative action that promotes actively the participation of blacks in the South African economy, is the backbone of all policies in South Africa. For example, the “BEE score,” which officially evaluates the “BEE contribution level” of a company based on the ratios of blacks in the number of employees and in the management and other criteria, is an evaluation criterion used in public bidding.
The transport equipment industry, including railway, is designated as a priority sector in the Industrial Policy Action Plan (IPAP). It plans to expand the industry to neighboring countries in the future. The Presidential Infrastructure Coordinating Commission (PICC), established to boost infrastructure investment, has been making public investments strategically. Among its Strategic Integrated Projects (SIPs), PICC designated the development of Waterberg coalmine (development of coalmine, railway infrastructure, etc.) as the No. 1 priority.
When a company tenders bid for a railway-related public procurement project, its BEE score will be evaluated. The level of the company’s contribution to BEE, including technical transfer, personnel development, will also be a criterion in the evaluation. An additional condition in rolling stock procurement is the requirement of a certain percentage of local content.
(3) Transport Sector
Thanks to the remarkable economic growth in recent years, the distribution volume in South Africa is also on the rise. The total freight transport volume reaches 201 million tons in FY 2011 (52.3 million tons of iron ores, 67.7 million tons of coal, and 81 million tons of general freight). While the transport of coal and iron ores contributed to the increase, the transport of general freight has shifted from railway to road.
Private vehicles meet one-third (32%) of the commuters’ need for passenger transport. Wealthy people use private vehicles and low-income people use shared taxis (mini-bus) for commuting. The heavy burden of commuting cost on low-income earners has become a serious problem, underscoring the need for an affordable and safe passenger transport means.
NATMAP, the comprehensive transport plan of DOT until 2050, advocates the modernization of passenger and freight transport for the railway sector and development of high-speed railway.

S-3
Table 1 Overview of NATMAP Proposals (Railway Sector)
Item Contents
Program Introduce standard gauge (1065 mm 1435 mm) in phases to all newly constructed railway lines
Implement feasibility studies for introduction of high-speed railways to economic corridors
Separate the construction/maintenance and management of infrastructure from train operation and provide opportunity for private operators to participate in train operation
Organization Establish the Rail Infrastructure Agency (RIA) (main entity for the
construction/ownership of infrastructure)
Funding Introduce in phases train fares that match the cost of services provided Introduce private capital
Source: Compiled by Study Team 3. Status of Railway Sector and Challenges (1) Status of Railway Sector
South African railways have a total length of 22,000 km. The railway sector is generally divided into freight transport, operated by TFR (Transnet Freight Rail) and passenger transport, operated by PRASA (Passenger Rail Agency of South Africa). The South African railways are used mainly for transporting freight.
Besides the general freight, which includes containers, the railways also transport iron ores and coal from the mines and coalfields in the inland to the ports for export. South African railways are known worldwide for their advanced technology in the transport of bulk freight with high axle load. For passenger transport, Metrorail provides urban transport to six cities in four provinces, including Johannesburg, Cape Town, Durban, and so on. Shosholoza Meyl provides long-distance passenger transport between cities. (2) Status of TRANSNET and Issues
The freight transport volume is on the rise. TRANSNET gives priority to the freight transport on important lines, using a “selection and concentration” policy. Freight transport concentrates on the three main lines (Iron Ore Line, Coal Line, and Manganese Line). Their transport volumes (125.5 million tons/year) account for approximately 60% of the overall transport volume (201 million tons/year). However, the railway does not have enough capacity to meet the increasing demand, making it necessary to increase transport capacity to cope with the increasing demand for freight transport (especially mineral resources).
To fulfill this rising transport need, TRANSNET formulated a 7-year investment plan. It plans to invest approximately 200 billion ZAR in the railway sector to increase the railway transport volume from the current 201 million tons/year to 350 million tons/year. (3) Status of PRASA and Issues
PRASA has made little investment until FY 2005. Due to the increasing need for reinvestment in safety measures, it increased its investment amounts from FY 2006. However, the limited investment in railway for over twenty years has resulted in obsolete facilities and aging rolling stock, causing frequent failures and safety problems. There are also other issues, such as insufficient connectivity with other transportation modes.
Under the modernization plan, PRASA is modernizing its railways by introducing new rolling stock and also upgrading networks, facilities, and signals to ensure compatibility.

S-4
(4) Status of Railway Sector in South Africa
There are several factors unique to South Africa that shall be taken into consideration: 1) TRANSNET and PRASA are under the jurisdiction of different departments; 2) separation of freight and passenger transport; 3) BEE Act; 4) localization; 5) educational and training systems; 6) trade unions; and 7) job creation. (5) Overview of Supporting Industries
The Study Team interviewed 40 railway-related companies, including 23 rolling stock-related companies, four signaling and telecommunications-related companies, five track-related companies, two construction-related companies, and six consulting companies. U.S. and European companies have made entry into each field. Electronic parts/systems tend to rely on imports.
4. Status of Technology and Issues of the Railway Sector (1) Railway-related Fields
To transport the rich resources of iron ores and coal efficiently, South Africa uses trains designed for 50kV AC electrification. They have a maximum axle load of 30 tons and can haul 300 to 400 cars (2.4–4 km in length). South Africa is renowned for its technological capability for transporting freight in high volume.
On the other hand, since investment in railway has been extremely limited for over twenty years, the trains and facilities are old and obsolete. In the case of rolling stock, the average age of PRASA commuter trains is 37–38 years. The electrical and signaling facilities are equally antiquated. Age-related deterioration leads to increased malfunctions. Furthermore, the production of some component parts needed for the repair has stopped, making it difficult to obtain them. For this reason, the safety levels of rolling stock and facilities have also declined.
Source: PRASA Rolling Stock Fleet Renewal Programme, PRASA (2011)
Figure 1 Age Distribution of Commuter Trains Owned by PRASA

S-5
Table 2 Mean Time between Failures at Metrorail (April–August 2012) Unit: Hour
Gauteng (Note)
Cape Town Durban National average
Track facilities
9.1 27.6 101.9 29.6
Electric facilities
19.0 87.9 100.0 33.9
Signaling facilities
0.7 2.1 4.3 1.67
(Note) Including Johannesburg, Pretoria, East London, and Port Elizabeth Source: Compiled by Study Team
The veteran engineers and skilled workers are aging and entering retirement. Since technologies have not been transferred sufficiently to the successors, maintenance cannot be performed properly and failures cannot be handled in a timely manner. Although the railway companies are stepping up efforts in technical training; unfortunately, employees who have mastered the skills often change jobs for better compensation.
Investments for modernizing the railways and increasing transport capacity are likely to increase in the future. However, the new rolling stock and facilities cannot be operated in a safe and accurate manner without the operators having mastered the newly introduced technologies and performing quality control and maintenance properly after their introduction. It is obvious that training the necessary technical personnel and enhancing the skills of operators are vital to the implementation of these railway-related projects. (2) Related Private Sectors and Supporting Industries
South Africa requires industries to increase local content. The railway-related industries are no exception. The core components of today’s railway used for controlling the output of rolling stock and the route control of signals are becoming increasingly computerized. These electronic parts are not produced locally in South Africa, as some manufacturers have strong ties to Europe and other countries. Localization can be promoted in phases, such as by producing the software part in South Africa first.
Many of the mechanical parts are produced in South Africa. Since investment in rolling stock has been suppressed, the scale of production is not large and funds are insufficient in many cases. Receiving orders on a continuous basis is necessary to maintain the quality of products.
The handling of new technologies, the transfer of technology from one generation to another, and improvement in the skills of operators are huge challenges that are similar to the ones faced by the railway-related industries. (3) Status of Job Skills Training and Issues
Immigration of artisans to other countries, aging workforce, and shortage of newly hired after the abolition of Apartheid have contributed to a shortage of skilled workers, causing a big problem. For this reason, many companies are devoting efforts to in-house education and training.
In the railway sector, TRANSNET has set up the School of Engineering (SOE) and PRASA has set up the Training Academy (TA) to provide job training. GE, EMD, other companies, and universities provide some of the education programs. Recently, the manufacturers delivering the new rolling stock and systems are also required to provide technical training.
There is strong realization in recent years of the importance of training supervisory personnel in

S-6
addition to the education and training of technicians and workers. As a practical move, the Vaal University of Technology plans to establish the first department of railway engineering in South Africa. In view of the success of JICA in similar projects in other countries, the University is expecting active support from Japan.
5. Risk Factors of the Railway Sector Investment Plans The railway sector in South Africa is continuously making huge investment. Depending on the field, there are also opportunities for Japanese companies to take part. However, the higher the risk for an investment plan to stall due to certain reasons, the more difficult it will be for Japanese companies to take part. Therefore, it is necessary to put in place measures to reduce or hedge risks.
Based on awareness of the above problem, the Study Team identifies and analyzes the various risk factors relating to the investment plans and businesses of the railway sector and review measures to reduce or hedge risks. (1) Financial Conditions of the National and Provincial Governments
Overall, the South African economy is expected to be sound. However, it is necessary to pay attention to the effects of the European debt crisis in case it deteriorates in the future. (2) Future Demand
The viability of the rate of economic growth and the forecasted population number shall be reviewed regularly from a long-term perspective. It is also necessary to monitor and evaluate continuously if the anticipated demand forecast values are being realized as the investment plans move forward. (3) Financing Prospect
PRASA and TRANSNET do not seem to have any major financing issues. On the other hand, it is likely that local governments might need to use the PPP approach to raise funds. Some believe that it is not easy to implement a project using the PPP approach. (4) Decision-making/Management, etc.
Involving stakeholders and market-related parties in the decision-making process can move a project forward more effectively and efficiently. Personnel training is essential in preventing project delays caused by dysfunctions in the management or technical insufficiency.
The opinions of market participants shall be obtained as part of the decision-making process. If some parts must be imported from overseas, the process shall also include the foreign companies. (5) Economy Wide Impact from the Implementation of Investment Plans
The job creation effect is large but to generate such effect, it is necessary to raise the local procurement rate. Market engagement (obtain opinions from market participants) shall be implemented as a means to raise local content.
6. Initiatives of Private Sector and Other Countries (1) Assistance from Other Governments
Industrial factors (low technical level, shortage of technical personnel, lack of corporate funds, etc.), policy factors (BEE Act, insufficient investment for a prolonged period, etc.), and external
S-7
factors (high infrastructure cost, trade unions, etc.) all challenge the advancement of localization.
Among these factors, the governments of other countries can cope with low technical level, shortage of technical personnel, and other industrial factors to a certain extent by providing technical assistance in their countries. (2) Collaboration between Foreign Companies and Railway Operators or Local
Companies in South Africa
Foreign companies have formed closed ties, such as partnerships, with the railway operators TRANSNET and PRASA and their affiliated companies in South Africa. Specifically, they make use of their governments’ programs for technical education and training to facilitate personnel training and to introduce new technologies to South Africa.
Foreign companies also have closed ties with local companies in South Africa. Some foreign companies help import goods for local companies.
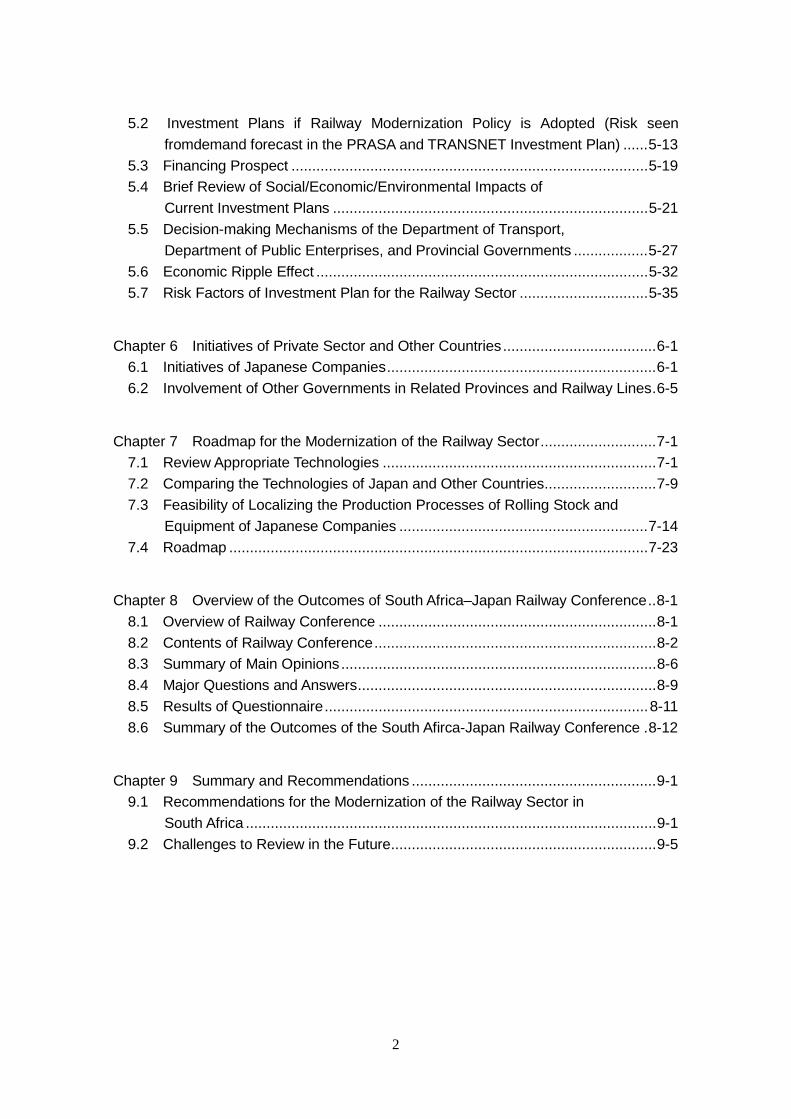
7. Roadmap for the Modernization of the Railway Sector (1) Concepts of Railway Modernization
Railways shall be modernized in pursuit of safety, speediness, accuracy, convenience, and optimal cost.
Source: Compiled by Study Team
Figure 2 Concept of Appropriate Technologies
(2) Superiority of Japanese Companies
Japan has the following advanced technologies to help achieve modernization of the railway sector in South Africa.

S-8
Table 3 Superiority of Japanese Railway Systems Sub-sector Superiority of Japanese Railway Systems
Urban Railway System
Development of an excellent railway system that integrates comprehensive urban development inside and around stations and connection with other transportation modes
Rolling stock Development of highly reliable and efficient rolling stock maintenance technology
AFC Development of a highly convenient IC card that can be used as a train ticket and for shopping at stations and in the city
Track
Development of low-maintenance track construction technology and technologies for manufacturing highly durable rail and compound sleeper that can contribute to the reduction of track maintenance cost
Source: Compiled by Study Team
(3) Approaches to Local Production
1) Core components and non-core components, 2) joint venture, and 3) licensing are conceivable approaches for promoting local production. Local companies can also use a combined approach by starting with licensing and then entering into joint ventures later.
Source: Compiled by Study Team
Figure 3 A Combined Approach to Local Production (4) Roadmap
Based on the status of the railway sector and requests from concerned parties in South Africa, JICA can assist by dispatching experts, conducting preliminary studies for collaboration, and offering overseas financing and investment.

S-9
Source: Compiled by Study Team
Figure 4 Roadmap for the Modernization of Railway Sector 8. South Africa–Japan Railway Conference (1) Overview of Conference
The South Africa–Japan Railway Conference was held in Johannesburg, Durban, and Cape Town jointly by the JETRO Johannesburg Office, Japanese Embassy in the Republic of South Africa, and JICA South Africa Office. Since the interest in/need for railway development and the direction of railway development in the future differ depending on the city, the Study Team selected themes specific to each city in an effort to obtain an accurate understanding of the needs of South Africa.
Schedule Location Main Theme Participants
(Note)
January 21, 2013 (Monday)
Johannesburg
1) Japan’s latest railway systems and socio-economic development through railway construction
2) Localization and industrialization of South African railway industry
116
January 22, 2013 (Tuesday)
Durban
1) Japan’s experience in high-speed railway (shinkansen) and socio-economic development through shinkansen construction
2) Development of high-speed railway in the Durban–Johannesburg section
94
January 24, 2013 (Thursday)
Cape Town
1) Japan’s urban railway systems and socio-economic development through the construction of urban railways
2) Utilization of Japan’s latest technologies to improve comfort and convenience of the urban railway in Western Cape province.
67
(Note) Number of participants includes speakers and administrative personnel

S-10
(2) Outcomes of Conference
1) Publicize the Advantages of the Japanese Railway System and Enhance Its Presence By deepening the understanding of railway personnel in South Africa about the superiority of the Japanese railway system, the Study Team was able to increase the presence of the Japanese railway system and enhance the perception that Japan is the best partner to help South Africa modernize its railway sector. 2) Reaffirm the Strengths of the Japanese Railway System Among the advantages of the Japanese railway system, the high level of safety and punctuality of the Japanese railway system and Japan’s ongoing efforts to improve technical capabilities through training, in particular, seem to have left a strong impression on the South African participants. Through this Railway Conference, the Study Team was able to reaffirm the strengths of the Japanese railway system. 3) Verify the Needs of Railway Development in Each City Through this Conference, the Study Team was able to confirm the specific needs of each city in railway development, including industrialization of the railway sector for Johannesburg, development of high-speed railway between Johannesburg and Durban for Durban, and further development of urban railway for Cape Town. 4) Develop Understanding of Japan’s Public and Private Initiatives The presentations on the initiatives by Japanese companies, JETRO program to invite key personnel, and the JICA assistance schemes conveyed to Conference participants that Japan’s public and private sectors are taking a proactive approach to facilitate the modernization of railway in South Africa.
9. Summary and Recommendations There are several important issues for the modernization of the railway sector in South Africa, including restoring the technological level, developing human resources, transferring technology, developing supporting industries, and promoting local production. The following are matters that shall be addressed based on the current state and issues of the railway sector in South Africa identified through this Survey and the intention of the DOT.
(1) Promote Understanding in the Superiority of Japanese Railway Systems
The Japanese railway technology has been developed mainly for passenger transport, along the two major axes of high frequency commuter transport in cities and high-speed railway, that is, high-capacity/high-speed transport by shinkansen. The pursuit of speediness and accuracy through these developments results in the advancement of operational technologies, including an optimal signal system. Besides speediness and accuracy, ensuring the safety of transport is the highest priority. In addition to introducing new facilities, Japan continues to devote efforts to maintenance to ensure safety. It is important to promote understanding in the benefits of these Japanese railway systems through seminars and training programs in Japan. (2) Review Plans for Dispatching Experts
The areas of specialties of the experts and the timing of the dispatch shall be planned carefully to ensure effectiveness in the dispatch of railway experts from Japan in order to develop human resources for the railway sector in South Africa. In particular, since the experts (experts in the development of human resources for railway) to be sent to DOT for long-term stay will need to handle multidisciplinary tasks, it is effective to send them in groups by their specialty area. The areas of expertise and dispatch plans shall be fully reviewed. When sending experts to PRASA

S-11
and TRANSNET for short-term stay, it is desirable to send experts in the fields of railway technology in which Japan has an edge. (3) Review Human Resources Development and Training Programs
Human resources development, training programs, and curricula for strengthening the functions of the School of Engineering under TRANSNET and the Training Academy under PRASA shall be examined. It is necessary to review especially the methods for technical transfer in order to promote understanding of the Japanese railway systems (urban railway and shinkansen) among the working-level personnel and young engineers in South Africa. (4) Detailed Study of Related Industries (Supporting Industries)
There is a need to clarify the technologies necessary for the railway industry of South Africa in the future and re-examine thoroughly the methods for cooperation, including the feasibility of technical transfer. To this end, it is important to utilize the UNIDO data with the cooperation of the South African government to obtain detailed data on railway-related industries in South Africa and make hypothetical business matching. (5) Establishing a System for Japanese Companies to Make Market Entry
As described above, it is important to perform hypothetical business matching using the UNIDO data to review fully the possibility for Japanese companies to make entry into the market. It is also important to review the system for making market entry, such as making entry through collaboration with beneficial partners, sharing roles with local partners, and so on to develop model cases.


Chapter 1
Background and Objectives of Survey


1-1
Chapter 1 Background and Objectives of Survey
1.1 Background of Survey
The Republic of South Africa (South Africa) is situated at the southernmost part of the African continent. It has a land area of 1.22 million km2, which is 3.2 times the area of Japan. It has a population of 50.6 million (2011), which grew at an average annual rate of 1.2% in the last ten years. The ethnic composition is diverse, with the black majority accounting for 79%, white and colored each accounting for 9%, and Asians accounting for 3%. The economy is growing steadily with an average GDP annual growth rate of over 4% (except in 2009). South Africa is recognized worldwide as one of the emerging economies, known as BRICS. On the other hand, it has a high unemployment rate of 25%, which has become a serious social problem.
South Africa has a railway network of 23,000 km, which exceeds the combined route length of all JR companies in Japan. Most of the railways in South Africa use the 1065-mm narrow gauge, known as Cape Gauge. It is basically the same as the 1067-mm gauge used for Japan’s conventional railway lines. Railway operators are generally divided into freight transport provided by the Transnet Freight Rail (TFR) and passenger transport provided by the Passenger Rail Agency of South Africa (PRASA).The railway infrastructure is owned and managed by TFR, except for certain lines. Unlike in Japan, rail freight is the main actor of railway transport in South Africa.
Besides the general freight, which includes containers, the South African railways also transport bulk freight, such as iron ores and coal, from the mines and coalfields in the inland to the ports for export. Among them, the Iron Ore Line (Sishen–Saldanha section, 861 km in length) and the Coal Line (Ermelo–Richards Bay coal terminal section, 450 km in length) are large-scale railway lines dedicated to bulk transport. Such lines do not exist in Japan. The standard for the Iron Ore Line is a freight car with 100-ton load capacity, known as “Jumbo.” A freight train, made up of five electric locomotives and a maximum of 342 of these freight cars, is approximately 4,200 m in length and can haul 34,000 tons. It is the longest commercial train in the world. On the other hand, the freight trains running on the Coal Line are approximately 2,400 m in length. These long freight trains are made up of 200 freight cars and each car has a load capacity of 80 tons. The freight cars are hauled by six electric locomotives. In this way, railways in South Africa have advanced technology in the transport of bulk freight with high axle load. To provide passenger transport in urban areas, Metrorail operates in six cities in four provinces, including Johannesburg, Cape Town, Durban, etc. Metrorail sets the train fare low and it is convenient to use. However, due to the poor security in stations and onboard trains, Metrorail is used by low-income people who do not have cars or other transportation means. The aging rolling stock and facilities also pose a serious problem. Currently, Metrorail is making plans to replace all 8,600 cars with new ones and renovate stations.
President Zuma, who became the president of South Africa in 2009, positioned the development of infrastructure, including railway, a policy priority in his policy speech to the Parliament in February 2010. The Department of Transport (DOT) of South Africa has also been working on the National Transport Master Plan 2050 (NATMAP) since 2005. At this time, the draft final report has been published. In it, NATMAP stipulates modernization of the passenger and freight transport and construction of high-speed railways.
The development of social economy through job creation and technical transfer shall be taken into consideration when promoting railway modernization in South Africa. In other words, development of railway-related industries and job creation through local production1 made
1 In this survey, shift from overseas production to local production in South Africa is referred to as “localization.”

1-2
possible by technical transfer will be important prerequisites. It is also necessary to pay attention to the Black Economic Empowerment (BEE) Act (enacted in 2004), which gives preferential treatment to historically disadvantaged South Africans (mainly black people) discriminated by Apartheid so as to enhance their social status and promote their participation in social activities.
The Japanese government also hopes to provide assistance to South African railways through projects that utilize Japanese technologies and operational expertise. The Ministry of Land, Infrastructure, Transport and Tourism (MLIT) conducted the “Preliminary Study on the Formation of High-speed Railway Plan in the Republic of South Africa Johannesburg–Durban Corridor” in FY 2010 and the Ministry of Economy, Trade and Industry (METI) conducted the “Study on High Speed Railway Project between Johannesburg and Durban in the Republic of South Africa” in FY 2011.
In fact, Japanese companies have already made inroads into the freight area by cooperating with a local rolling stock manufacturer to deliver electric locomotives to TRANSNET. In the passenger area, PRASA is currently accepting bids for 7,224 units of electric trains (EMUs) in an amount totaling 1.2 trillion yen. Japan is considering tendering a bid.
1.2 Objectives of Survey
The objectives of this Survey are as follows: To find out about the policies of the South African government for railway, project plans for modernizing the conventional railways, and status of assistance from the private sector and foreign countries, and to identify issues To gather and analyze the necessary information for prioritizing Japan’s technical assistance To create a roadmap for modernizing the railway sector To make recommendations for assistance measures 1.3 Scope of Survey
The Survey covers South Africa as a whole. Among the nine provinces, the Survey focuses on Johannesburg, Durban, and Cape Town—the three metropolitan areas that are especially important to railway transport and the railway industry of South Africa. They are located in Gauteng Province, KwaZulu-Natal Province, and Western Cape Province, respectively. Other important railway lines surveyed include the Coal Line linking Ermelo and Richards Bay (approximately 450 km) in the eastern part of South Africa, the Iron Ore Line linking Sishen and Saldanha (approximately 861 km) in the western part of South Africa, and the GAUTRAIN in Johannesburg, which launched services in 2010.
1.4 Contents of Survey
1.4.1 Local Surveys
Local surveys were conducted to meet with railway-related parties in South Africa and to collect information. The first local survey was conducted from early August 2012 and it lasted for two and a half months. The second local survey was carried out in late November for about 10 days. Table 1-1 shows the list of entities visited.

1-3
Table 1-1 List of Entities Visited Government entities of the Republic of South Africa (7) Department of Transport (DOT)
National Treasury (NT)
Department of Public Enterprises (DPE)
Department Trade and Industry (DTI)
Department of Environmental Affairs
Railway Safety Regulator (RSR)
Industrial Development Corporation (IDC)
Provincial government entities (6) Kwazulu Natal (KZN) Province / Department of Transport
Kwazulu Natal Province / Department of Agriculture, Environmental Affairs & Rural Development Western Cape Province / Department of Economic Development and Tourism
Free State Province / Department of Transport
Free State Province / Department of Agriculture & Rural Development
City of Cape Town / Department of Transport
United Nations organization (1) United Nations Industrial Development Organization (UNIDO)
Universities (4) Vaal University of Technology
University of Cape Town
University of Stellenbosch
University of Johannesburg
Financial institutions (2) Standard Bank
Development Bank of South Africa (DBSA)
Public corporation (1) Eskom Electricity
Railway operators and related companies/organizations (6) Transnet
Transnet Rail Engineering (TRE)
Transnet National Port Authority
Passenger Rail Agency of South Africa (PRASA)
PRASA Rail
RailRoad Association of South Africa
Railway companies' educational institutions (2) TRE / School of Engineering (SOE)
PRASA Technical / Centre of Technology (COT)
Railway companies' operation entities (15) Transnet Freight Rail (TFR) Sentrarand Marshaling Yard
TRE Koedesport Depot (Pretoria)
TRE Ermelo Depot
TRE Richard's Bay Depot
TRE Durban Depot
TRE Swartcops Depot (Port Elizabeth)
TRE Salkor Depot (Saldanha)
TRE Salt River Depot (Cape Town)
TRE Kimberley Depot
TRE Bloemfontein Depot
PRASA Spring Field Depot (Durban)
PRASA Salt River Depot (Cape Town)
PRASA Durban Rapid Metro Operation Control Center (CTC Center)
PRASA Cape Town Operation Control Center ( Windermere CTC Center & CMOCC)

1-4
GAUTRAIN OCC/Depot
Non-railway operation entity (1) Transnet Saldanha Port
Japanese companies/Japanese-affiliated companies (railway-related) (2) Mitsui & Co. African Railway Solutions (Pty) Ltd.
Toshiba Corporation Johannesburg Office
Businesses (44) 【Rolling stock-related】 [23] Union Carriage & Wagon Company (UCW) Rolling stock
GRINDROD Mining/Locomotive
RRL Grindrod Manufacture of locomotives
Columbus Stainless Stainless steel plate
Macsteel VRN (Stainless Division) Stainless member
DCD Dorbyl Bogie
ABB Traction motor
Mersen South Africa Carbon brush
Timken South Africa (Pty) Ltd Bearing
Rotacon Engineering Gear case
Donkin Fans Blower
KNORR-BREMSE Brake
Rollmech (Pty) Ltd. Main controller
LH Marthinusen Coil/ rectifier
Overhead Track Developments (OTD) Pantograph
Siyahamba Engineering (Pty) Ltd Car door/ window
Booyco Engineering Air-conditioning
SME Air-conditioning
Inteletrack Train separation detector
ANSYS Limited Train position tracking system
WAYMARK INFOTECH Electronic manual system
Naledi Rail Engineering Rolling stock repair
Surtees Investments (Pty) Ltd. Parts supply in general
【Signaling/telecommunications】 [5] LEBONE ENGINEERING Signal
Siemens Signal
ACTOM Electric equipment
SIEMENS Electric equipment
Aveng Manufacturing Lenning Railway Service Maintenance of railway facilities
【Track】 [5] Tubular Track Track
Plasserail South Africa Track maintenance
Rail 2 Rail Sleeper
Pandrol Rail fastening device
Stimera Infrastructure Management Services (SIMS) Track/ training
【Construction】 [4] Murray & Roberts Construction
HATCH Construction
Mott MacDonald Construction
MEHLEKETO Construction
【Consultancy】 [4] Lehaha Construction Railway construction consultant
Aurecon Infrastructure consultant
Jeffares and Green Engineering
Arcus gibb Engineering

1-5
[Non-railway] [3] Toyota South Africa Motors (Pty) Ltd Automobile
Imperial Logistics Logistics
Richards Bay Steamships Coal export
Japanese government agencies (in Japan) (2) Ministry of Economy, Trade and Industry (METI)
Ministry of Land, Infrastructure, Transport and Tourism (MLIT)
Japanese Embassy in South Africa and public organizations (3) Japanese Embassy in South Africa
JICA South Africa Office
JETRO Johannesburg Office
Source: Compiled by Study Team
(1) Government: DOT, DPE, NT, and DTI (2) Provincial governments: KZN, Western Cape, and Free State (3) Railway operators: TRANSNET and PRASA (4) Railway-related companies: UCW, TRE (Transnet Rail Engineering), manufacturers of car parts, manufacturers of signals, rolling stock repair companies, track maintenance companies, etc. (5) Railway facilities: Coal Line, Iron Ore Line, manganese line, major stations, and railway track facilities
1.5 Survey Team Members Table 1-2 shows the survey team members.
Table 1-2 Survey Team Member Job Function Name Company
Team leader/Railway system (Planning)
Yoshihiro Akiyama JIC
Rolling stock/Train operation Masahiro Watanabe JIC Signaling & telecommunications Kiichi Takemura JIC Electric power Ikuo Kawaguchi JIC (JRSEC) Civil engineering Yoshimasa Sakon JIC Locomotive maintenance Akihiro Kobayashi JIC (Toshiba Transport
Engineering Inc.) Infrastructure business/Market research
Lim Pho Soon MRI
Social economy, environmental analysis
Dinh Minh Hung MRI
Financial analysis (demand forecast) Kenichi Hori MRI Financial analysis (funding planning) Kei Owada MRI Railway industry analysis 1 Eiichi Yamamoto MRI Railway industry analysis 2 Kazuhito Hachiya MRI Administration coordinating/Assistance to railway system (planning)
Kai Sumitomo JIC
JIC=Japan International Consultants for Transportation Co., Ltd. MRI=Mitsubishi Research Institute, Inc. JRSEC=JR Soken Electric Consulting


Chapter 2
Social and Economic Conditions of South Africa


2-1
Chapter 2 Social and Economic Conditions of South Africa
2.1 Basic Information
2.1.1 National Land and Natural Condition
South Africa has an area of 1.22 million km2, which is approximately 3.2 times the area of Japan1. It has a long coastline, with its southwestern part facing the South Atlantic Ocean and its southern and eastern parts facing the Indian Ocean. The highest point in South Africa is Mt. Mafadi (altitude 3,450 m) at the border with Lesotho. South Africa is made up of three types of topography: (1) inland plateau, (2) coastal zone, which descends from the inland plateau toward the coastline, and (3) escarpment, which separates the inland plateau and the coastal zone. South Africa as a whole is on high ground. The inland plateau, which exceeds 1,000 meters in altitude, accounts for most of the national land.
As for the weather, South Africa is roughly divided into the Atlantic side, which is affected by cold currents; the Indian Ocean side, which is affected by warm currents; and the plateau area at an altitude of 1000 m, which is surrounded by steep mountain ranges in the east and west.
In terms of rainfall, the inland area, affected by warm currents from the Indian Ocean, only rains in the summer, the winter is dry. The coastal areas along the Indian Ocean have rain throughout the year. The coastal areas, which are affected by cold currents from the Atlantic Ocean, only rain in the winter. Because of the desert climate, the rainfall is extremely low throughout the year.
2.1.2 Population and Race
(1) Population
South Africa has 49.99 million people. The population growth rate in 2010 was 1.4%2. With ongoing urbanization at this time, there is high demand for daily transport means between residences and the areas of consumption activities in cities. Gauteng province, with Johannesburg as its center, is currently experiencing population growth in its urban areas. The province had a 20% increase in population from 1996 to 2003. In Western Cape and KwaZulu-Natal provinces as well, even though the increases were not as pronounced, their population is being drawn to the urban areas.
Viewed from the world standard, the population density in South Africa is extremely low, which has negative influence on the possibility of project formation for railway, bus, and other public transportation modes. Compared to other countries that have high population densities, the travel distances are notably longer.
As shown in Figure 2-1, one characteristic is the large population of young people in their 20s (average life expectancy of 52 years, 2010 World Bank). Given this age structure of the population, the government has come up with a proactive policy to expand employment in the National Development Plan (NDP2030) with a view to maximizing the working population in the 2020s.
1Ministry of Foreign Affairs of Japan, Basic Data of the Republic of South Africa, as of May 2012 (http://www.mofa.go.jp/mofaj/area/s_africa/data.html) 2 2010 World Bank data

2-2
Source: United States Census Bureau, International Database3
Figure 2-1 Age Group of Population in South Africa (2) Race Figure 2-2 shows the composition ratios by race: black (79%), white (9%), colored (mixed blooded) (9%), and Asian (3%)4.
78%
10%
9% 3%
Black
White
Colored
Asia
Source: Ministry of Foreign Affairs of Japan, Basic Data of the Republic of South Africa (as of May 2012)
Figure 2-2 Race Composition in South Africa South Africa has 11 official languages, including English, Afrikaans, and Bantu languages (Zulu, Sotho, etc.)5.
In terms of religion, Christianity accounts for 79.7% (Protestants 36.6%, Catholics 7.1%, and other Christian denominations 36%), no religion 15.1%, other religions 2.3%, and Muslims 1.5%6.
3 http://www.census.gov/population/international/data/idb/informationGateway.php 4 Source: 2001Census, CIA The World Factbook https://www.cia.gov/library/publications/the-world-factbook/geos/sf.html 5Ministry of Foreign Affairs of Japan, Basic Data of the Republic of South Africa, as of May 2012 6 2001 Census, CIA The World Factbook

2-3
2.1.3 Government
One characteristic of South Africa is that its capital functions are spread out in Pretoria, Cape Town, and Bloemfontein. The capital of the government is Pretoria, where the executive office of the President, government agencies, central bank, and the embassies of various countries are located. The Parliament is in Cape Town and the Constitutional Court is in Bloemfontein. Figure 2-3 shows the provinces and major cities. Legends 1–9 are the names of provinces.
Source: The Republic of South Africa government website
Figure 2-3 Provinces and Major Cities
In the Republic of South Africa, the president is the head of government. South Africa has a bicameral parliamentary system, consisted of the National Council of Provinces (NCOP, upper house, 90 seats) and the National Assembly (lower house, 400 seats).
The following are the major departments under the President:
https://www.cia.gov/library/publications/the-world-factbook/geos/sf.html

2-4
Table 2-1 Major Departments under the President President: Jacob Zuma (took office in May 2009)
Deputy President: Kgalema Petrus Motlanthe
<Government agencies (1 President’s Office and 43 departments, in random order)>President’s Office
(National Planning Commission, responsible for monitoring/validation/management)
National Treasury
Department of International Relations and Cooperation
Department of Trade and Industry
Department of Home Affairs
Department of Economic
Development Department of Energy
Department of Higher Education
and Training
Department of Mineral
Resources Department of
Public Enterprises
Department of Rural Development and Land
Reform
Department of Transport
Others
2.1.4 Economy
(1) GDP
The GDP of South Africa is 363.7 billion USD (as of 2010), which is 5.7% of that of Japan. The economy declined due to the effects of global economic crisis in 2009; however, it was revived mainly by the construction industry, thanks to the hosting of the FIFA World Cup in 2010, the following year. The GDP grew at approximately 2.8% annually in 2010. Figure 2-4 shows that the growth of GDP leveled off in 2011. It was believed to have been affected by strikes in the mining, quarrying, and manufacturing sectors and slowdown in global export.
-2.0
-1.0
0.0
1.0
2.0
3.0
4.0
5.0
6.0
0
50
100
150
200
250
300
350
400
450
2002 2003 2004 2005 2006 2007 2008 2009 2010 2011
GD
P G
row
th (
%)
Nom
inal
GD
P (b
illio
n U
SD)
Nominal GDP GDP Growth (%)
Source: Compiled by Study Team based on World Bank data
Figure 2-4 Changes in South Africa’s Nominal GDP and Growth Rate
1)GDP per Capita As shown in Figure 2-5, the nominal GDP per capita is approximately 8,000 USD, which is 16% of that of Japan. However, compared to the real GDP growth, the growth rate per capita is at a low level of 1–1.5% every year.
FIFA World Cup
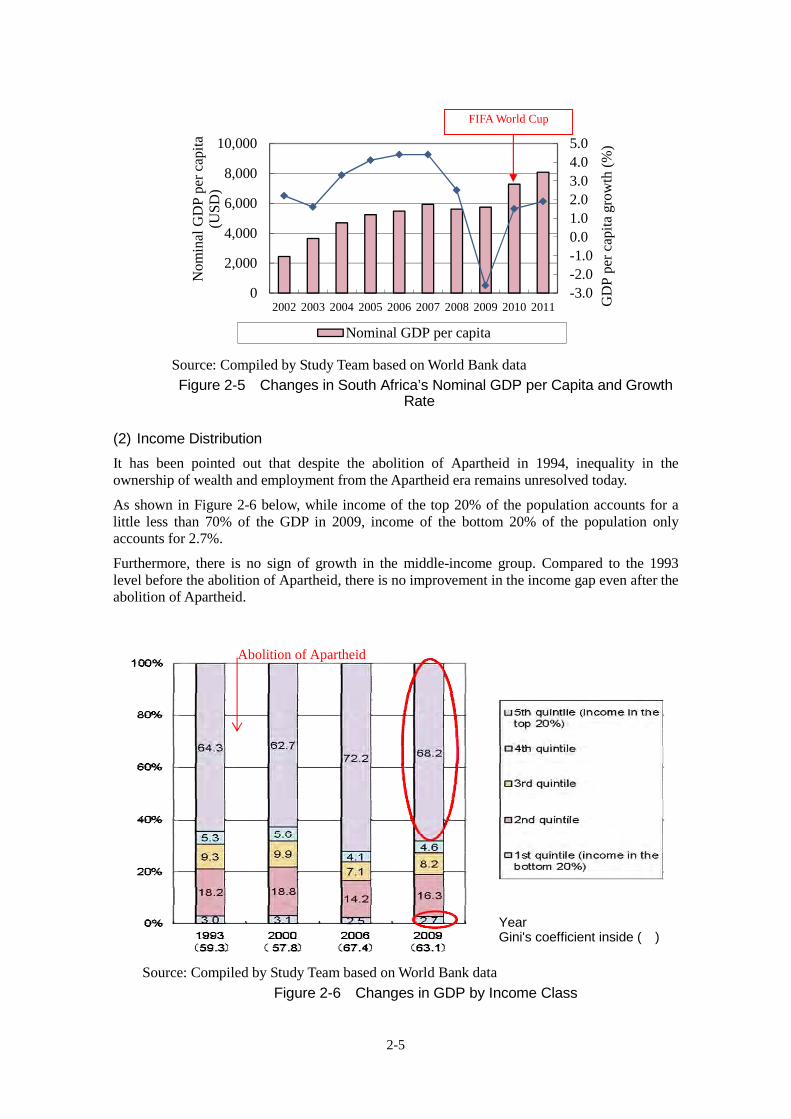
2-5
-3.0-2.0-1.00.01.02.03.04.05.0
0
2,000
4,000
6,000
8,000
10,000
2002 2003 2004 2005 2006 2007 2008 2009 2010 2011 GD
P p
er c
apit
a gr
owth
(%
)
Nom
inal
GD
P pe
r ca
pita
(U
SD
)
Nominal GDP per capita
Source: Compiled by Study Team based on World Bank data
Figure 2-5 Changes in South Africa’s Nominal GDP per Capita and Growth Rate
(2) Income Distribution
It has been pointed out that despite the abolition of Apartheid in 1994, inequality in the ownership of wealth and employment from the Apartheid era remains unresolved today.
As shown in Figure 2-6 below, while income of the top 20% of the population accounts for a little less than 70% of the GDP in 2009, income of the bottom 20% of the population only accounts for 2.7%.
Furthermore, there is no sign of growth in the middle-income group. Compared to the 1993 level before the abolition of Apartheid, there is no improvement in the income gap even after the abolition of Apartheid.
Source: Compiled by Study Team based on World Bank data
Figure 2-6 Changes in GDP by Income Class
FIFA World Cup
Abolition of Apartheid
YearGini's coefficient inside ( )

2-6
According to the “Income and Expenditure of Households 2005/2006” report issued by the South Africa Census Bureau shown in Figure 2-7, even though blacks make up 79% of the total population, they only account for 41% of the total household income. On the other hand, the total household income of whites, which account for 9% of the population, is 45%. The population ratio and household income ratio of the colored and Asians are close, making the gap between the blacks and whites even more distinct.
79%
9%
9% 3%
Black
White
Colored
Asian
41%
45%
9% 5%
Black
White
Colored
Asian
Source: Compiled by Study Team based on South Africa Census Bureau, “Income and expenditure of households 2005/2006”
Figure 2-7 Population Ratio by Race (Left) and Income per Household (Right) in South Africa (as in 2005–06)
(3) Employment
South Africa aims to create jobs for 11 million people in order to reduce the unemployment rate, currently at 24.9% (2012), to 14% by 2020 and 6% by 2030. On the other hand, it also needs to raise the education level and train the labor force to become skilled workers.
Figure 2-8 shows the employment number by sector in April–June 2012 and year-over-year growth rate.
Population ratio by race Income ratio by race

2-7
-5.0%0.0%5.0%10.0%15.0%20.0%25.0%30.0%
0500
100015002000250030003500
Year-over-year growth rate (%)(1000 persons)
Employment number Year-over-year growth rate
Source: Compiled by Study Team based on South Africa Census Bureau, “Quarterly Labour Force Survey, Quarter 2, 2012”
Figure 2-8 Employment Number in April–June 2012 and Year-over-year Growth Rate 2.1.5 Industry
As shown in Figure 2-9, mining and quarrying account for 10% of the GDP, followed by finance/real estate, manufacturing, public administration/education/health care/welfare, wholesale/retail/lodging/restaurant, and then transportation/telecommunications, other services, construction, electricity/gas/water, and agriculture/fisheries.
Agriculture,
forestry, fishing &
hunting
2%
Mining and
quarrying
10%Manufacturing
13% Electricity, gas and
water
3%
Construction
5%
Wholesale and retail
trade, hotels and
restaurants
15%
Transport, storage
and communication
8%
Finance, real estate
and business
services
21%
Public
administration,
education, health
16%
Other services
7%
Source: Compiled by Study Team based on OECD African Economic Outlook 2012
Figure 2-9 GDP Ratios by Sector As shown in Figure 2-10, mineral resources account for 62% of the export amount, showing the heavy dependence of export on mining.

2-8
21%
8%
62%
9%
Food
Mineral resources
Transportation/Equipment, etc.
Others
Source: Compiled by Study Team based on South Africa Census Bureau (as of the 3rd quarter of 2010)
Figure 2-10 Ratio of Export Amount by Industry Due to strikes, accidents, transportation problems, factory maintenance, rise in electricity charges, pay hike above the inflation rate, and other reasons, the real value added growth rate of the mining and quarrying sector in 2011 was only 0.2%. The production of coal, gold, and manganese declined because of lower demand worldwide.
Despite such circumstances, South Africa is blessed with many mineral resources. As shown in Table 2-2, it is one of the few major mining countries in the world, accounting for 7.7% of gold production (No. 4 in the world), 75.6% of platinum production (No. 1), 39.5% of chrome production (No. 1), 18.2% of manganese production (No. 2) in 2010. In addition, South Africa is also known as one of the few countries in the world producing diamond, uranium, iron ore, and coal, etc7.
As for resource reserve, South Africa has 89% of platinum-group metals (PGM) (No. 1 in the world), 24% of manganese (No. 2), and 23% of vanadium (No. 3). As shown in Figure 2-11, many of the mineral resources are concentrated in the northeastern part of South Africa.
Table 2-2 Changes in the Production Amounts of Mineral Resources in South Africa
(2008–2010) (Unit: 10,000 tons)
Mineral 2008 2009 2010
Copper 11.78 11.61 11.26
Lead 4.64 4.91 4.97
Zinc 2.9 2.82 3.58
Nickel 3.17 3.44 4.0
Platinum 0.0140 0.0147 0.0147
Gold 0.0220 0.0206 0.0192
Chrome 1030 687 1082
Iron ore 4900 5500 5500
Antimony 0.37 0.21 0.23
Manganese 680.71 456.51 717.22
Titanium 85.0 75.0 80.0
Uranium 55.5 53.3 57.3
Source: Japan Oil, Gas, Metals National Corporation, “World Mining Industry Trend 2011: South Africa”8
7 Japan Bank for International Cooperation, “Development of Mining Industry and Nationalization of Mines (South Africa)” February 2011 8 http://mric.jogmec.go.jp/public/report/2011-04/south_africa_11.pdf

2-9
Source: Siyavula Uploaded, "Natural Resources: Minerals," Connexions, April 22, 20099
Figure 2-11 Distribution of Mineral Resources
2.1.6 Trade
According to the South African Revenue Service, trade in 2011 (customs clearance basis) had an increase of 20.1% in exports over the previous year at 705,251.4 million ZAR and an increase of 24.7% in imports at 724,316.5 million ZAR. Compared to the trade surplus of 6,285.3 million ZAR in the previous year, 2011 had a trade deficit of 19,065.1 million ZAR.
Looking at the exports by item, precious stones and precious metals account for one-quarter of the exports. They had an increase of 19.3% year-over-year. As shown in Figure 2-12, mineral products, such as coal (36.9% increase) and iron ores (65.7% increase), also accounting for one-quarter of the exports, have drastic increases.
In terms of import by item, general machinery/electric machinery (increase of 19.0%) account for one-quarter of the imports. Besides telephones such as cell phones (11.9% increase), automatic data processing machines (18.9% increase), printers (9.8% increase), self-propelled bulldozers (increase by a factor of 2.0), and power generating steam turbines (31.8% increase) for new thermal power plant have increased considerably.
9 http://cnx.org/content/m22302/1.1/

2-10
0
10
20
30
40
50
020406080
100120140160180200
billi
on Z
AR
Exports statistics (by export item)
2010 amount (billion ZAR) 2011 amount (billion ZAR)
Source: Compiled by Study Team based on JETRO data
Figure 2-12 Exports Statistics by Export Item (2010 and 2011) 2.2 Policies and Systems
2.2.1 National Economic Policy
The Union of South Africa, made up of four British colonies (Orange Free State, Tranvaal, Natal, and the Cape Colony) at the time, became independent in 1910 and a member of the British Commonwealth of Nations. It left the British Commonwealth in 1961 and became a republic, known as the “Republic of South Africa.”
South Africa implemented a policy of racial segregation called Apartheid for many years. In 1991, the related Apartheid laws were repealed. In April 1994, a multi-racial election was held for the first time and the administration of Nelson Rolihlahla Mandela was born in May of the same year. Later on, Thabo Mvuyelwa Mbeki served as President from 1999 to 2008 and Kgalema Petrus Motlanthe from 2008 to 2009. From May 2009 to the present day, President Jacob Gedleyihlekisa Zuma has been leading the ruling party. From President Mandela to the present day, the African National Congress (ANC) has been the ruling party.
In the 2009 election in South Africa, the ANC got 65.9% of the votes. Once its party leader Zuma became the President, the President’s office announced the 2009–2014 Medium Term Strategic Framework (MTSF), translating the ANC campaign pledges into policies. Furthermore, the New Growth Path (NGP) was announced in 2010 and the National Development Plan 2030 (NDP) was announced in 2011 as long-term policies. These policies formed the basis of South Africa’s national economic policies.
As explained below, the top priority of South Africa’s policies is job creation. “Decent work” is an important keyword.

2-11
(1) 2009 – 2014 Medium Term Strategic Framework (MTSF)
The current MTSF spells out the details of the ANC pledges made at the 2009 election. It shows the national strategic framework for 2009–2014. MTSF puts forth the following 10 strategic priorities for development:
1. Speed up economic growth and transform the economy to create decent work and sustainable livelihoods
2. Massive program to build economic and social infrastructure 3. Comprehensive rural development strategy linked to land and agrarian reform and
food security 4. Strengthen the skills and human resource base 5. Improve the health profile of society 6. Intensify the fight against crime and corruption 7. Build cohesive, caring and sustainable communities 8. Pursue regional development, African advancement and enhanced international
cooperation 9. Sustainable resource management and use 10. Build a developmental state including improvement of public services and
strengthening democratic institutions.
MTFS is revised every three years. The National Industrial Policy Framework (NIPF) mentioned below and its action plan, the Industrial Policy Action Plan (IPAP), are revised in conjunction with the MTSF.
(2) New Growth Path (NGP) and National Development Plan 2030 (NDP)
NGP and NDP form the foundation of South Africa’s long-term national economic policies. The NGP was announced by Mr. Ebrahim Patel, Minister of Economic Development, in November 2010. Its target is to create 5 million jobs and reduce the unemployment rate to 15% in the policy period ending 2020.
The NDP was announced by Mr. Trevor Andrew Manuel, Minister of the National Planning Commission, in November 2011. Its target is to create jobs for 11 million people during the policy period ending 2030 in order to lower the unemployment rate to 6%, a more ambitious policy than the NGP. NDP provides a broad policy outline until 2030, ten years more than the NGP. It is noteworthy that NDP puts forth the following railway development plans for infrastructure development.
・Construct a new railway line to the Waterberg coalfield and upgrade the coal line in the central basin. ・Expand important transport links: 1) Upgrade the Durban–Gauteng freight line; 2) Extend the Coal Line, Iron Ore Line, and manganese line; and 3) Upgrade the Sishen–Saldanha section of the Iron Ore Line and expand the capacity of the manganese line.
Table 2-3 shows the various policies and major industrial policies mentioned above. The industrial policies under the Accelerated and Shared Growth Initiative for South Africa (ASGISA) will be explained in the next section. In addition, since the Black Economic Empowerment (BEE) Act is the backbone of all policies in South Africa, we will include its discussion in industrial policies to highlight the industrial aspect of the BEE Act.

2-12
Table 2-3 Major Economic and Industrial Policies
2.2.2 Industrial Policies
(1) Accelerated and Shared Growth Initiative for South Africa (ASGISA)
ASGISA is a strategy that serves as the basis of South Africa’s industrial policies. After numerous deliberations between the presiding departments and the South African Local Government Association (SALGA), ASGISA was announced by then Deputy President, Ms. Phumzile Mlambo-Ngcuka in February 2006.
This strategy points out the following six binding constraints that deter the economic growth of South Africa: 1) High volatility and level of the currency; 2) High cost, low efficiency, and low capacity of the national logistics system; 3) Shortage of skilled labor and regional difference in the cost of low-skilled labor; 4) Barriers to and limits on investment; 5) Regulatory environment for and burden on small and medium businesses; and 6) Deficiencies in the capacity and leadership of government agencies.
As improving the skills of workers is imperative to achieving the goals of this strategy, the Joint Initiative for Priority Skills Acquisition (JIPSA) was established two months after the ASGISA was announced.
(2) National Industrial Policy Framework (NIPF)
The National Industrial Policy Framework (NIPF) was approved by the Cabinet in January 2007 and announced by the Department of Trade and Industry. It is a policy framework to help achieve the goals of the ASGISA and to pursue economic growth beyond 2014. NIPF is revised every three years in tandem with the Mid-Term Expenditure Framework (MTEF).
Policy Summary Medium Term Strategic Framework (MTSF)
It was announced by the President’s Office in 2009. It identifies 10 strategic priorities for development, including speeding up economic growth and transforming the economy to create decent work and sustainable livelihoods
New Growth Path (NGP)
It was announced by the Minister of Economic Development, Mr. Ebrahim Patel, in 2010. The major policy target is to create 5 million jobs and reduce the unemployment rate to 15% by 2020.
National Development Plan 2030 (NDP)
It was announced by the Minister of the National Planning Commission, Mr. Trevor Manuel in 2011. The major policy target is to create 11 million jobs and reduce the unemployment rate to 6% by 2030.
Accelerated and Shared Growth Initiative for South Africa (ASGISA)
ASGISA was announced by then Deputy President, Ms. Phumzile Mlambo-Ngcuka in 2006. It points out the shortage of skilled labor as one of the binding constraints deterring the economic growth of South Africa.
National Industrial Policy Framework (NIPF)
It was announced by the Department of Trade and Industry in 2007. It is a policy framework to help achieve the goals of ASGISA and pursue growth for 2014 and beyond.
Industrial Policy Action Plan (IPAP)
IPAP is an action plan for implementing the National Industrial Policy Framework. The current IPAP is “Industrial Policy Action Plan 2012/13 - 2014/15.”
Black Economic Empowerment Act (BEE Act)
The BEE Act is an affirmative action policy to promote actively the participation of black people in the South African economy. It is a policy program based on the Broad-Based Black Economic Empowerment Act of 2003.

2-13
NIPF has 13 strategic programs: 1) Industrial sector strategies; 2) Industrial financing; 3) Trade policy; 4) Skills and education for industrialization; 5) Competition policy and regulation; 6) Increasing public expenditure; 7) Industrial upgrade; 8) Innovation and technology; 9) Land and industrial infrastructure; 10) Financing and services for small businesses; 11) Expanding black empowerment for growth and employment; 12) Trade and industry framework for South Africa and other African countries; and 13) Coordination, capacity, and organization.
It shall be kept in mind that the BEE Act must be integrated as part of the policies for promoting NIPF. (The BEE Act will be explained later.)
1) Key Sectors NIPF identified five sectoral groupings as the key sectors: (a) Natural-resource based sectors; (b) Medium technology sectors; (c) Advanced manufacturing sectors; (d) Labor-intensive sectors; and (e) Service industry sectors.
Besides the gas and oil sectors that have come to prominence in recent years, metal processing, machinery/equipment, chemicals, and plastics in the medium technology sectors also attract attention. These sectors are given priority because they can generate large employment and contribute to mining and related industries.
The automobile, aerospace, electronics, nuclear power, and other advanced manufacturing sectors require a relatively highly trained workforce and advanced technologies. At this time, these sectors are dominated by direct investment from overseas. The fact that foreign companies are controlling proprietary technologies is viewed as a problem. For this reason, South Africa aims to nurture its own proprietary technologies for the future.
NIPF clearly states that sectors that can create large employment, including these ones, will be given priority.
2) Issues NIPF points out that since the current economic structure of South Africa is highly dependent on resources, it is subject directly to the influence of economic fluctuations in large emerging economies, such as China and India, which have a great presence as importing countries. There is also the issue of foreign exchange risk, which underscores the fragile nature of South Africa’s economic structure. Together with the high cost of broadband (Internet communication), the inefficiency of railway and port infrastructure are considered major causes deterring economic development. These are cross-sectoral issues. (3) Industrial Policy Action Plan (IPAP)
IPAP is an action plan formulated for implementing the NIPF. The current IPAP is “Industrial Policy Action Plan 2012/13 - 2014/15.”10
1) Key Sectors IPAP designates key sectors into the following three clusters. Subsidies, industrial financing, and other incentive systems are offered to support these sectors.
a) Cluster 1: Qualitatively new areas of focus ・ Revitalizing metal fabrication, capital equipment, and transport equipment industries
(particularly arising from large public investments) ・Upstream industries of oil and gas ・”Green” energy and energy-saving industries
10 Two existing IPAP: “Industrial Policy Action Plan, August 2007”, “Industrial Policy Action Plan 2011/12 - 2013/14 (IPAP 2)”

2-14
・Agro-processing, linked to food security and food pricing imperatives ・Boatbuilding
b) Cluster 2: Scaled-up and broadened interventions in existing IPAP sectors ・Automotive products and components, and medium and heavy commercial vehicles ・Plastics, pharmaceuticals, and chemicals ・Clothing, textiles, footwear, and leather ・Biofuels ・Forestry, paper, pulp, and furniture ・Creative and cultural industries ・Business process services
c) Sectors with potential for long-term advanced capabilities ・Nuclear ・Advanced materials ・Aerospace and defense ・Electrotechnical and ICT
Of the above, those related to the railway industry are mainly metal fabrication, capital equipment, and transport equipment sectors in Cluster 1. For this Cluster, IPAP plans to leverage large-scale public procurements in the rail and electronics industries, invests domestically in mining capital equipment, and expands to the rest of the African continent. 2) Preferential Procurement As explained above, IPAP uses large-scale public investments as a means to strengthen the railway industry. The most important system that may present a problem here is the Preferential Procurement Policy Framework Act (PPPFA). PPPFA is one of the pillars of the BEE system. It is an affirmative action aimed at promoting the participation of black people (South Africans who are black, colored, or of Indian or Chinese origin) in the South African economy.
DTI designates items for preferential procurement. As of October 2012, DTI has designated six items, as shown below. The railway industry will have to observe the preferential procurement system when procuring rolling stock.
Since the BEE system also applies to public procurement, preferential treatment will also be given to businesses owned by black people when procuring items not designated for preferential procurement (explain later).
・Buses ・Rolling stock ・Power pylons ・Canned vegetables ・Clothing, textiles, leather, and footwear ・Set top boxes
3) Industrial Financing The NIPF advocates the strengthening of industrial financing. The Industrial Development Corporation (IDC) is stepping up its financial support of key sectors in the IPAP and NGP. The following are the specific targets and conditions of support for IPAP scheduled for the next five years:
・10 billion ZAR Job Creation Fund at prime rate under 3% over five years ・25 billion ZAR towards “green economy”

2-15
・500 million ZAR energy efficiency fund ・7.7 billion ZAR for agricultural and forestry value chains ・6.1 billion ZAR to support companies in distress as a consequence of the global financial crisis
4) Issues Implementation of the IPAP may run into the following eight issues:
・Decline in domestic demand as the credit-fuelled consumption boom of 2005-2007 unwound ・Weak growth in traditional export markets, particularly the US and European Union (EU) ・Above-inflation increases for the administered prices of electricity ・Ongoing high cost and significant inefficiencies in the rail and ports freight and logistics
systems ・Major market failures with respect to finance for fixed investment, etc. ・A significant slowdown and backlogs in infrastructure expenditure ・Short-term and unstrategic procurement practices in relation to major areas of public capital
expenditure, which both raises costs and limits prospects for localization ・Slow progress with regard to addressing the skills shortage
The issue of skills shortage is discussed as an independent subject item in IPAP in the analysis of demand and supply of human resources. This topic will be discussed in “3.4 Current State of Systems and Issues.”
(4) Black Economic Empowerment (BEE) Act
The BEE Act is a policy composed of multiple codes focusing on the 2003 Broad-Based Black Economic Empowerment Act (B-BBEE)11. Figure 2-13 shows the relationship of major relevant laws and regulations. The (1) B-BBEE Act, (2) Codes of Good Practice, and (3) PPPFA and Preferential Procurement Regulation are applicable to the bidding of public procurement. The (4) Employment Equity Act and (5) Skills Development Levies Act are applicable in both public and private cases. Since these laws are based on affirmative action, they may contradict with the principle of equality. However, the South African Constitution clearly states the reasons for allowing such laws.
This section will explain the contents of (1) basic law, (2) evaluation of contribution level, (3) preferential procurement, (4) employment equity, and (5) skills development12 in relation to the BEE policy.
11 Act No. 53 of 2003: Broad-Based Black Economic Empowerment Act, 2003 12 The DTI website provides detailed information on the BEE Act in general. http://www.thedti.gov.za/economic_empowerment/bee_codes.jsp (webpage) http://www.thedti.gov.za/economic_empowerment/docs/Inside.pdf (outline of the system)

2-16
南アフリカ共和国憲法(1996)
B-BBEE Act(2003)
Codes of GoodPractice
(2007)
Sector Codes
-運輸業、林業、建設業、観光業
Skills DevelopmentAct (1998)
Skills DevelopmentLevies Act (1999)
Preferential Procurement
Skills Development
Enterprise Development
Socio-Econ Development
Employment Equity
Management Control
Ownership
Preferential Procurement
Skills Development
Enterprise Development
Socio-Econ Development
Employment Equity
Management Control
Ownership
PreferentialProcurement
Regulations (2001)
EmploymentEquity Act
(1998)
統合されていない
PPPFA(2000)
統合されていない
(検討中の新Regulationsでは、BEEレーティングを援用。)
強行規定
公共調達に適用
強行規定
公共調達に適用
Section 9.2Section 217
Section 9.2 Section 9.2 Section 217
「BEE スコアカード」
*さらに、Eskom、Transnet 等は、スコアカードともPPPFAとも異なる独自のBEE基準を採用。
代替可能
Source: Information from the Japanese Embassy in South Africa (May 2010) (some parts modified by the Study Team)
Figure 2-13 Diagram of Relationship for BEE-related Laws and Regulations 1) Basic Law (B-BBEE Act) The Broad-Based Black Economic Empowerment Act is a legislative framework aimed at overcoming the discriminatory structure in the access to skills and productive assets from the Apartheid era.
This Act and the Codes of Good Practice that will be explained in the following section have legal binding power over government agencies, national corporations, and other public entities but they do not regulate the private sector directly. However, in bidding for public procurement, the BEE score of a company tendering the bid is an important criterion for evaluation. Since such score has important influence on the activities of private companies in an indirect way, it is necessary for private companies to increase their BEE contribution levels.
The BEE Advisory Council, chaired by the President, was established for the B-BBEE Act. It is necessary to pay close attention because the relatively frequent reporting brings small changes to the BEE Act.
The Minister of Trade and Industry issues orders for BEE strategies and the Codes of Good Practice, which will be explained in the next section. He/she is given the authority to publish the Transformation Charter. The Codes of Good Practice determine the definition and guidelines for implementing BEE. A Transformation Charter for each sector is formulated by the major stakeholders of the sector.
2) Codes of Good Practice The Codes of Good Practice (COGP) provide guidelines for measuring a company’s contribution level to the BEE Act. The COGP used in this report was formulated in 2007. Revision of the COGP has been in progress. As of October 2012, the revised version “Revised
BEE scorecard
Constitution of the Republic of South Africa (1996)
Interchangeable
Transportation, forestry, construction, tourism
Mandatory regulations, Apply to public procurement
Furthermore, Eskom, TRANSNET, and others have their own BEE standards that are different from those of the scorecard and PPPFA.
Not unified (The new regulations being
considered will use the BEE rating)
Not unified

2-17
B-BBEE Codes of Good Practice 2012” has been approved by the Cabinet and it is in the public comment stage13.
The current Codes of Good Practice use a scorecard for evaluation. It is consisted of seven elements, as shown in Table 2-3 (Government Gazette No. 29617).
The scorecard places emphasis on black ownership and preferential procurement, giving 20 points each to the two elements. In the case of ownership, it is composed of four indexes. “Ownership,” which is one of the elements, measures the legal entitlement of black shareholders in receiving dividends and capital gains from investment. The “management control” index measures the participation of blacks in a company’s board of directors and their appointment to the highest management positions. “Employment equity” measures the appointment of black people to upper management positions and professional jobs. “Skills development” measures expenditures for the skills development of black employees. “Preferential procurement” assesses a company’s usage of preferential procurement for expanding black empowerment and its expenditures for purchasing goods and services from small businesses. “Enterprise development” evaluates the investment in supporting and developing small businesses and companies owned by black people. “Socio-economic development” evaluates corporate social investment (CSI).
As shown in Table 2-5, the BEE Contribution Level in the scorecard ranges from Level 1 (highest) to Level 8 (lowest). It is used as a criterion for public procurement.
Table 2-4 BEE Scorecard
Element Weighting Ownership 20 points Management Control 10 points Employment Equity 15 points Skills Development 15 points Preferential Procurement 20 points Enterprise Development 15 points Socio-Economic Development 5 points Total 100 points
Source: DTI
Table 2-5 BEE Contribution Level
BEE contribution level QualificationLevel 1 contributor Total score 100 points Level 2 contributor Score 85 points but <100 points Level 3 contributor Score 75 points but <85 points Level 4 contributor Score 65 points but <75 points Level 5 contributor Score 55 points but < 65 points Level 6 contributor Score 45 points but < 55 points Level 7 contributor Score 40 points but < 45 points Level 8 contributor Score 30 points but < 40 points Non-compliant contributor Score < 30 points
Source: DTI
13 http://www.thedti.gov.za/economic_empowerment/docs/Statement-August.pdf

2-18
3) Preferential Procurement This system is based on the Preferential Procurement Policy Framework Act (PPPFA), which aims at promoting the participation of black people (South Africans who are black, colored, or of Indian or Chinese origins) in the South African economy by giving preferential procurement to black-ownership companies in public procurement. It gives a boost to the objective of the BEE system from a procurement aspect. By the way, this law requires a certain percentage of local contents (cost base) in the procured item in public procurement14. It has legal binding power on all government agencies and state-owned enterprises (SOEs).
The preferential procurement system was established in July 2011 based on the PPPFA, which was later revised. The law amended in November 2011 is the one in force as of October 2012. The amended law gives authority to DTI to designate strategic sectors and subsectors and define standards. The method and standard for certifying the ratio of local contents have been formulated by the South African Bureau of Standards (SABS) and South Africa National Accreditation System (SANAS).
Preferential procurement applies to items designated by DTI. As of October 2012, there are six designated items, as mentioned earlier. They are buses; rolling stock; power pylons; canned vegetables; clothing, textiles, leather, and footwear; and set top boxes. 4) Employment Equity The Employment Equity Act15 (EEA), enacted in 1998, targets all businesses, no matter whether they are in the public or private sector. It requires businesses to fill out the specified employment equity-related forms and submit them to the Department of Labor on a regular basis. Evaluation uses standards that include the personnel aspect, such as at what level black people are appointed to management positions and what level of education and training are provided to black employees.
On the other hand, all government agencies (except the South African National Defense Force, National Intelligence Agency, and Secret Service) and companies employing over 50 employees or with annual profits exceeding the standards shown in Table 2-6 must also submit affirmative action-related documents, in addition to the abovementioned specified forms for business owners. The submitted information is used by the Department of Labor for monitoring or enforcing mandatory compliance.
14 The method for calculating local contents can be found on the DTI website. http://www.dti.gov.za/industrial_development/docs/ip/guideline.pdf 15 Act No. 55 of 1998

2-19
Table 2-6 Targets of EEA Unit: ZAR
Agriculture 2 million Mining/quarrying 7.5 million Manufacturing 10 million Electricity/gas/ water 10 million Construction 5 million Retail, sale of automobile, repair service 15 million Wholesale, agency, and joint services 25 million Catering, hotel, and other transactions 5 million Logistics, warehousing, telecommunications 10 million Finance, office services 10 million Services for local communities, society and individuals 5 million
5) Skills Development Together with the abovementioned Employment Equity Act, the Skills Development Act16 (SDA) and Skills Development Levies Act (SDL) are two laws enacted that apply to both the public and private sectors. SDA requires employers with total annual payroll over 500,000 ZAR to pay skills development levies at 1% of the company’s annual payroll amount. Skills development using SDL applies to all employees. In addition, companies are required to comply with the BEE Codes of Practice to spend 3% of payroll on the skills development of black employees. A company can raise the points in the scorecard by meeting this target. Funded by SDL, the Skills Education Training Authorities (SETA) was established in 1998. It replaced the apprenticeship system with a skills training system. It is responsible for formulating and implementing skills plan for sectors, promoting skills training system, registering skills training contracts, and so on. Employers can request refund of 55% of SDL by submitting an Annual Training Report (ATR) and Workplace Skills Plan (WSP) to SETA annually.
2.2.3 Infrastructure Development Policy
(1) Presidential Infrastructure Coordinating Commission
The Zuma administration positions job creation as its most important policy. It focuses policy measures on infrastructure development, which provides the basis for further growth and job creation. In the budget speech delivered on May 30, 2012, the President announced to continue promoting economic growth and development through the New Growth Path, primarily focusing on infrastructure development. The Presidential Infrastructure Coordinating Commission (PICC), chaired by the President, has become an important coordination tool.
PICC was established based on the realization of poor planning in project development and the lack of strategy, integration, and alignment with national priorities in the past. Therefore, as a coordinating entity, PICC uses schemes that will (1) develop a single common Infrastructure Plan that will be monitored and centrally driven, (2) identify who is responsible and hold them to account, and (3) develop a twenty-year planning framework beyond one administration to avoid stop-start patterns and inefficiency.
Specifically, the infrastructure development plan is formulated as follows:
1. The presiding departments or agencies formulate infrastructure development plans
by sector and submit them to the National Planning Commissions (NPC). 2. Based on these plans, the NPC formulates Strategic Integrated Projects (SIPs) and
16 Act No. 97 of 1998〔Amended: Act 37 of 2008〕

2-20
submits them to PICC. 3. PICC prioritizes the SIPs and announces them.
(2) 17 Strategic Integrated Projects
After completion of the PICC procedures, the 17 strategic integrated projects shown in Table 2-7 were approved by the Cabinet on March 7, 2012.
SIP1 (SIP priority No. 1) integrates the urban development of Waterberg and the development of mainly coal mines. By investing in railways, pipelines, and electric infrastructure, it aims to create jobs for several thousand people. By augmenting rail capacity, it hopes to shift the mode of coal transport from road to rail in some cases and mitigate environmental burden. With SIP 1 topping the list of geographic SIPs, the emphasis is on upgrading and expanding railway infrastructure. It is also noteworthy that the upgrading and expanding of railway transport and other transport infrastructure are emphasized in SIP 7 and SIP 11.
Table 2-7 Seventeen Strategic Integrated Projects
Geographic SIPs
SIP 1: Unlocking the Northern Mineral Belt with Waterberg as the catalyst
SIP 2: Durban–Free State–Gauteng Logistics and Industrial Corridor
SIP 3: South Eastern node & corridor development
SIP 4: Unlocking the economic opportunities in North West Province
SIP 5: Saldanha–Northern Cape Development Corridor
Energy SIPs
SIP 8: Green energy in support of the South African economy
SIP 9: Electricity generation to support socio-economic development
SIP 10: Electricity transmission and distribution for all
Spatial SIPs SIP 6: Integrated municipal infrastructure project SIP 7: Integrated urban space and public transport program SIP 11: Agri-logistics and rural infrastructure
Social Infrastructure SIPs
SIP 12: Revitalization of public hospitals and other health facilitiesSIP 13: National school-building program SIP 14: Higher education infrastructure
Knowledge SIPs SIP 15: Expanding access to communication technology SIP 16: SKA / MeerKAT Radio-telescope project
Regional SIPs SIP 17: Regional integration for African cooperation and development
Source: Provincial and Local Government Conference/A summary of the Infrastructure Plan, PICC, April 13, 2012 2.2.4 Public Private Partnership (PPP) Policies
(1) Needs for PPP
As seen in the previous section, South Africa is actively pursuing infrastructure policies. High demand for developing the railway sector is expected. However, since the government’s infrastructure budget has a limit, it is understood that public private partnership (PPP) will be needed for railway projects in the future17.
17 Based on local interviews at the Development Bank of Southern Africa (DBSA)

2-21
Even at this time, a mining company is using the build-operate-transfer (BOT) scheme to operate a branch line connecting the mine and the TRANSNET main line18. TRANSNET has also reviewed in the past the use of PPP for 22 branch lines19. Due to the policy to keep the train fares for passenger railway at a low level, fare revenue can only cover about 30% of the PRASA expenditures at this time20. It is necessary to introduce PPP or contrive other ways if South Africa is to attract private capital to the railway sector.
In this backdrop, Gautrain, the biggest PPP project in South Africa, launched service when the FIFA World Cup was held there in 2010 (explained below). (2) Relevant Laws and Regulations
With regard to the legislation of PPP, a PPP framework was approved by the Cabinet in December 1999. An article was added to the Public Finance Management Act21 (PMFA) for the first time in April of the following year. Article 76 of the said Act stipulates that the National Treasury (NT) shall establish the necessary regulations and orders. The NT Regulations22 Article 16 (REG 16) enacted in 2000 regulates the financial management of PPP.
The jurisdiction applies to the PPPs under NT. The PPP Unit in the NT was established with technical assistance from the United States Agency for International Development (USAID), Deutsche Gesellschaft für Technische Zusammenarbeit GmbH (GTZ) of Germany, and the Department for International Development (DFID) of the United Kingdom.
The government of South Africa is divided into three spheres: national, provincial, and local. The laws and regulations for each sphere are different. The PMFA is only used at the national and provincial levels; it does not apply to the PPPs of the local government. Instead, the Municipal Finance Management Act23 (MFMA) and Municipal Systems Act24 (MSA) are applicable.
(3) PPP Manual
NT has prepared a detailed manual of specific procedures to follow when implementing a PPP project25.The manual is made up of nine modules. The 1 to 9 modules match the PPP project cycle. It is worth mentioning that Module 2 cites all the Codes of Good Practice (COGP). As shown in Figure 2-14, the COGP apply not only to the special purpose vehicle (SPV) but also to equity and subcontracts. It also states clearly the objectives of BEE policy in relation to local socio-economic impact.
18 Based on local interviews at the Department of Economic Development and Tourism, Western Cape Government 19 ibid. 20 Based on local interviews at PRASA 21 Act No. 1 of 1999 〔Amended: Act No. 29 of 1999〕 22 See Treasury Regulations for departments, trading entities, constitutional institutions and public entities, (March 2005, National Treasury / Gazette 27388) 23 Act No. 56 of 2003 24 Act No. 32 of 2000 25 Available at NT website, http://www.ppp.gov.za/Pages/Governance.aspx
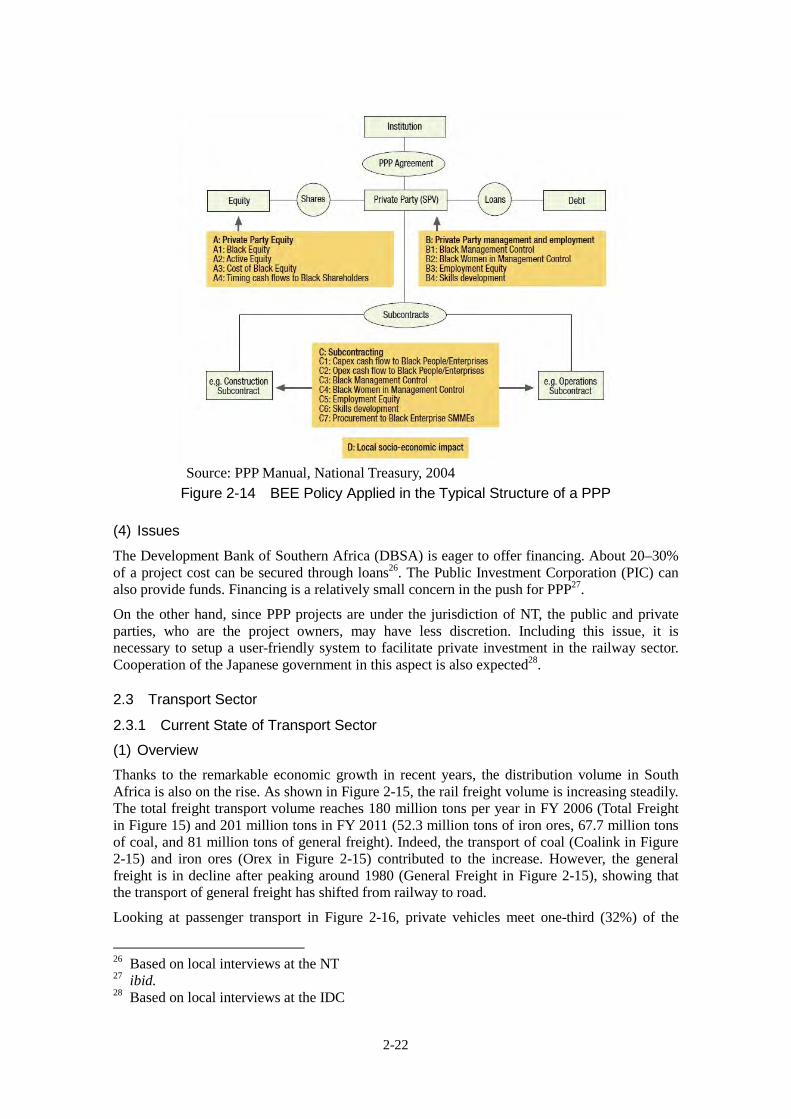
2-22
Source: PPP Manual, National Treasury, 2004
Figure 2-14 BEE Policy Applied in the Typical Structure of a PPP
(4) Issues
The Development Bank of Southern Africa (DBSA) is eager to offer financing. About 20–30% of a project cost can be secured through loans26. The Public Investment Corporation (PIC) can also provide funds. Financing is a relatively small concern in the push for PPP27.
On the other hand, since PPP projects are under the jurisdiction of NT, the public and private parties, who are the project owners, may have less discretion. Including this issue, it is necessary to setup a user-friendly system to facilitate private investment in the railway sector. Cooperation of the Japanese government in this aspect is also expected28.
2.3 Transport Sector
2.3.1 Current State of Transport Sector
(1) Overview
Thanks to the remarkable economic growth in recent years, the distribution volume in South Africa is also on the rise. As shown in Figure 2-15, the rail freight volume is increasing steadily. The total freight transport volume reaches 180 million tons per year in FY 2006 (Total Freight in Figure 15) and 201 million tons in FY 2011 (52.3 million tons of iron ores, 67.7 million tons of coal, and 81 million tons of general freight). Indeed, the transport of coal (Coalink in Figure 2-15) and iron ores (Orex in Figure 2-15) contributed to the increase. However, the general freight is in decline after peaking around 1980 (General Freight in Figure 2-15), showing that the transport of general freight has shifted from railway to road.
Looking at passenger transport in Figure 2-16, private vehicles meet one-third (32%) of the
26 Based on local interviews at the NT 27 ibid. 28 Based on local interviews at the IDC

2-23
commuters’ need. The use of public transport (railways, buses, taxis (most are shared mini-bus taxis)) totals 40% and the use of railway is only 6%. In general, wealthy people use private vehicles and the low-income class uses shared taxis for commuting. The heavy burden of commuting cost on low-income earners has created a serious problem, underscoring the need for an affordable and safe passenger transport means.
Source: “NATMAP Status Quo Report,” DOT, 2008
Figure 2-15 Changes in the Volume of Rail Freight
Source: “NATMAP Status Quo Report,” DOT, 2008
Figure 2-16 Shares of Commuter Transport
(2) Railway
1) Rail Passenger Transport The Passenger Rail Agency of South Africa (PRASA), under the Department of Transport (DOT), operates passenger railways with government subsidies. Rail passenger transport is consisted of two types: long-distance inter-city trains and short-distance commuter trains (intra-city).
The long distance passenger rail transport is provided by Shosholoza-Meyl, an independent division within the Department of Transport. However, because of the deregulation of road transport in the early 1980s, Shosholoza-Meyl lost customers to the increasing numbers of buses, mini-buses, and taxis. Consequently, its services become sparse, with only a handful trains

2-24
operating per week.
On the other hand, the short-distance commuter trains are operated in only four provinces, namely, Eastern Cape, Gauteng, KwaZulu-Natal, and Western Cape. The short-distance commuter train services are also affected by deregulation, which led to severe competition from minibus-taxis.
In addition to the PRASA passenger rail services mentioned above, Gautrain launched services in June 2010, linking the Johannesburg international airport and the city center. It has attracted attention as a project using a public-private partnership (PPP) scheme. (It will be discussed in more details in Chapter 3.) 2) Rail Freight Transport Transnet Freight Rail (TFR), under the Department of Public Enterprises (DPE), is a company funded 100% by the government. Its annual transport volume totals 201 million tons, including 81 million tons of general freight, 67.7 million tons of coal, and 52.3 million tons of iron ores.
Road freight transport was regulated by the Road Transportation Act for many years. Due to the deregulation in 1987, rail freight also faces severe competition from road freight. (It will be discussed in more details in Chapter 3.)
(3) Road Transport
The road network in South Africa totals 750,000 km. As shown in Table 2-8, the national roads and paved provincial roads, which account for 8% of the national road network, connect the major cities. The traffic volume of cars on high-standard national roads in big cities exceeds 150,000 cars/day. Except for the morning and evening rush hours, cars operate at approximately 100 km per hour on highways.
As shown in Figure 2-16, road transport meets two-third of the need in commuter transport (private vehicles 32%, shared taxis 25%, and buses 9%).
Table 2-8 Lengths of Roads in South Africa Road Authority Length(km) % of total road network National Roads 16,197 2% Provincial Roads Paved 47,157 6% Provincial Roads Gravel 176,716 23% Provincial Roads Access 124,238 16% Un-proclaimed Rural Roads 221,092 29% Metro, Municipal and Roads 168,058 22% Total 753,458 100%
Source: “NATMAP Status Quo Report,” DOT, 2008 (4) Air Transport
As shown in Table 2-9, South Africa has 25 airports, including 13 international airports and 12 regional airports. In addition, there are 125 locations serving as air force facilities or local runways.
Air transport statistics are being compiled. As shown in Table 2-10, the airfreight volume in 2005 is estimated to be approximately 700,000 tons/year and the number of air passengers is estimated to be 30 million/year.

2-25
Table 2-9 Airport Infrastructure in South Africa
Province International Domestic Local, military,
private Total
Number of runways (international and
Domestic) Eastern Cape 2 2 27 31 4 Free State 1 0 8 9 1 Gauteng 2 3 11 16 9 KwaZulu-Natal 1 4 17 22 5 Limpopo 1 2 21 24 5 Mpumalanga 1 0 14 15 1 Northern Cape 2 0 20 22 2 North-West 1 1 13 15 2 Western Cape 2 0 25 27 2 TOTAL 2005 13 12 156 181 32
Source: “NATMAP Status Quo Report,” DOT, 2008
Table 2-10 Transport Volumes of Freight and Passengers by Air in South Africa
Province Total cargo ton
p.a. International p.a. Domestic p.a.
Scheduled local p.a.
Total p.a.
Eastern Cape 2,523 1,060,000 1,060,000 Free State 44,929 707,446 707,446 Gauteng 560,000 15,849,170 11,616 15,860,786 KwaZulu-Natal 6,375 3,484,000 70,000 70,000 3,624,000 Limpopo 4,400 51,471 266,861 318,332 Mpumalanga 2,737 240,000 240,000 Northern Cape 27,108 327,978 0 0 327,978 North-West 0 Western Cape 44,000 1,600,000 3,066,331 3,066,331 7,732,662 TOTAL 2005 692,072 23,320,065 3,414,808 3,136,331 29,871,204
Source: “NATMAP Status Quo Report,” DOT, 2008 (5) Ports
South Africa has 18 ports, including eight commercial ports. The commercial ports are located in KwaZulu-Natal province (Richards Bay and Durban), Eastern Cape province (East London, Ngqura, and Port Elizabeth), and Western Cape province (Mossel Bay, Cape Town, and Saldanha). These commercial ports are all managed by Transnet National Ports Authority (TNPA), which is an operation unit under TRANSNET. It is a landlord port authority.
Ninety percent of South Africa’s trade is maritime trade (by value and volume). Similar to the railways, ports are vital to the socio-economic development of South Africa. Table 2-11 shows the maritime transport volumes of various provinces.

2-26
Table 2-11 Freight Transport Volumes Handled by Ports in South Africa
Province
Bulk and break bulk cargo (tonnes) Containers (teu)
TOTAL
2005 Imports Exports
Coastwise
landed
Coastwise
shipped
TOTAL
2005 Imports Exports
Coastwise
landed
Coastwise
shipped
Eastern Cape 5,837,115 909,604 3,107,841 1,706,556 113,154 374,206 207,776 161,495 3,359 1,576
KwaZulu-Natal 127,058,781 33,738,950 90,105,159 599,250 2,615,422 1,484,324 724,388 718,232 13,114 25,570
Northern Cape
Western Cape 38,360,369 60,049,856 30,285,116 843,532 1,181,865 571,694 268,267 271,502 18,221 13,704
Transshipment
Cargo 2,298,764
587,012
TOTAL 2005 173,555,069 40,698,410 123,498,116 3,149,338 3,910,441 3,014,236 1,200,431 151,249 34,694 40,850
TOTAL 2007 183,328,184 3,712,090
Source: “NATMAP Status Quo Report,” DOT, 2008 2.3.2 Transport-related Policies
South Africa has three noteworthy transport-related polices: (1) National Transport Master Plan (NATMAP), (2) Public Transport Strategy 2007–2020 (PTS), and (3) New Partnership for Africa’s Development (NEPAD). A summary of each policy is given below.
(1) National Transport Master Plan (NATMAP)
South Africa has the largest economy in Africa. Except in 2009, which was deeply affected by Lehman’s fall, South Africa has managed to maintain an average GDP growth rate of over 4% annually. Since the population also increases by more than 1%, the distribution volume increases as a result.
As for the transport sector, commuter transport relies on automobile in cities and inter-city passenger transport relies heavily on automobile and airplanes. The railway’s share in passenger transport is less than 6% for commuter transport. For long-distance passenger transport, the railway’s share is only 3.5% even in South Africa’s most important corridor between Johannesburg and Durban. Except in the specialized bulk transportation of iron ores and coal, the reliability of rail freight is low due to the uncertainty of arrival time. For this reason, freight transport is mainly carried out on roads, making it a big challenge for promoting modal shift.
In this backdrop, President Zuma positioned the development of infrastructure, including railway, a policy priority in his policy speech to the Parliament in February 2010. Furthermore, the Department of Transport (DOT) has been working on the National Transport Master Plan 2050 (NATMAP) since 2005.
Including NATMAP, the various departments and agencies in the government have also formulated infrastructure master plans of their respective areas and submitted them to the National Planning Commission (NPC). NPC reviews and coordinates the master plans to form Strategic Integrated Projects (SIP). The Presidential Infrastructure Coordinating Commission (PICC) then prioritizes the SIPs for infrastructure development and formulates development plans.
NATMAP is a long-term plan. It spans a period of 45 years from 2005 to 2050 and targets five areas, including road, railway, airplane, port, and pipeline. Besides integrating these areas, NATMAP also emphasizes their relations to land use. It is also characterized by its recommendations for funding, legal framework, and implementation systems.
NATMAP is formulated not only at a national level but also at the nine provinces, following the procedures of status analysis, future forecast, strategy formulation, and investment planning. Reports have been produced for each stage. DOT receives transport project plans formulated by various provincial governments and integrates them into the general plan.

2-27
For the railway area, NATMAP clearly states the modernization of passenger and freight transport and development of high-speed railway. Table 2-12 summarizes the specific recommendations.
Table 2-12 Overview of NATMAP Recommendations (Railway Sector)
Item Contents Program ・Introduce standard gauge (1065 mm 1435 mm) in phases to all newly
constructed railway lines ・ Implement feasibility studies for introduction of high-speed railways to
economic corridors ・Separate the construction/maintenance and management of infrastructure from
train operation and provide opportunity for private operators to participate in train operation
Organization ・ Establish the Rail Infrastructure Agency (RIA) (main entity for the construction/ownership of infrastructure)
Funding ・Introduce in phases train fares that match the cost of services provided ・Introduce private capital
A draft final report of NATMAP has already been published. At this time, the presiding portfolio committees have also arrived at an agreement. After completing the necessary procedures, the report will be presented to the Cabinet in the near future29. (1) Public Transport Strategy 2007– 2020 (PTS)
The Cabinet approved PTS and its action plan in March 2007. PTS, which includes a transport infrastructure plan of several billion ZAR, is expected to change fundamentally public transportation in South Africa.
The strategy aims to have the government operate public transport services, which have been managed by transport operators. It will shift the intermodal transport focusing on commuters to an integrated and high-speed mass transport public network designed for general users. It also includes plans to shift to an integrated bus, railway, and taxi public transport system.
(2) New Partnership for Africa’s Development (NEPAD)
South Africa, which has a total population of 260 million people and a regional market of 430 billion USD, has great potential for socio-economic development. To utilize this potential for economic growth, the Southern African Development Community30 (SADC) aims to develop an efficient and cost-effective transnational transport network. There are five priority areas for regional infrastructure development, namely, transportation, energy, electricity and telecommunications, water infrastructure, and tourism.
The railway industry in South Africa is highly aware of market development transcending national borders. In our interviews with the DOT and private companies, the Study Team heard frequent mentioning of business visions to export products to southern Africa.
29 Based on local interviews at DOT 30 15 Member States as of 2012: Angola, Botswana, Democratic Republic of Congo, Lesotho, Madagascar, Malawi, Mauritius, Mozambique, Namibia, Seychelles, South Africa, Swaziland, United Republic of Tanzania, Zambia, and Zimbabwe

Chapter 3
Current State of Railway Sector and Issues


3-1
Chapter 3 Current State of Railway Sector and Issues
3.1 Overview of Railway Sector in South Africa
3.1.1 Characteristics of South African Railways
The first railway in South Africa started service in June 1860 in a 3.2-km section between Durban’s Market Square and Point. The first railways were constructed to transport diamond and gold from mines in the inland to the ports. Since those railways had to be completed quickly at the time, a 1065-mm narrow gauge, known as “Cape Gauge,” was used.
The South African railways are used mainly for transporting freight. Besides the general freight, which includes containers, the South African railways also transport bulk freight, such as iron ores and coal, from the mines and coalfields in the inland to the ports for export. Among them, the Iron Ore Line and the Coal Line are large-scale railway lines dedicated to bulk transport. Such lines do not exist in Japan.
The 861-km dedicated single-track freight line (Iron Ore Line) linking Sishen (altitude 1,200 m) in the inland where the iron ore mines are located and the Saldanha port on the Atlantic coast is characterized by its use of the 50-kV single-phase AC electrification, which is rare in the rest of the world. The standard for the Iron Ore Line is a freight car with 100-ton load capacity, known as “Jumbo.” A freight train, made up of five electric locomotives and a maximum of 342 of these freight cars, is approximately 4,200 m in length and can haul up to 34,000 tons.
There are several coalfields in the area about 200 km east of Johannesburg. The coal produced there is transported to a local city Ermelo via a branch line (3kV DC) for export. Long freight trains of approximately 2,400 m, made up of 200 freight cars with a maximum load capacity of 84 tons each and hauled by six electric locomotives, are used. They operate on an approximately 450-km line (Coal Line), which descends from Ermelo at an altitude of 1,700 m to Richards Bay facing the Indian Ocean.
As such, railways in South Africa have advanced technology in the transport of bulk freight with high axle load.
3.1.2 Changes in the Organization of Railway Operation
When the Union of South Africa was formed in May 1910, all the railways and ports in the country were unified to form the South African Railways and Harbours (SAR&H). In 1934, the South African Airways was also integrated. SAR&H was later nationalized in 1981 and its name was changed to South African Transport Services (SATS).
The relatively profitable rail freight and mid-to-long distance passenger railway of SATS, together with the South African Airways, ports, and pipelines for the transport of petroleum that relied 100% on imports, became TRANSNET on April 1, 1990. TRANSNET is a corporation completely funded by the government. It is under the jurisdiction of the newly established Department of Public Enterprises (DPE). The railway section was named Spoornet. Since it was not possible to charge high fare to the users, the urban passenger transport became South African Rail Commuter Corporation (SARCC) during the 1990 organizational reform. SARCC, under DOT, continued to operate with government subsidies.
A business restructuring in 2007 transferred the mid-to-long distance passenger transport, except Blue Train, from Spoornet to SARCC. Spoornet was renamed Transnet Freight Rail (TRF) in July 2007.
In March 2009, SARCC became Passenger Rail Agency of South Africa (PRASA), which provides railway services for 1,150 km. Under PRASA, there are Metrorail and Shosholoza Meyl. Metrorail provides suburban transport and Shosholoza Meyl provides mid-to-long

3-2
distance transport.
Besides these government railways, Gautrain launched service in June 2010 in tandem with the hosting of the 2010 FIFA World Cup. It links O.R. Tambo International Airport and the city center. Gautrain operates on standard gauge (1,435 mm) at a maximum speed of 160 km/h.
3.1.3 TRANSNET
(1) Organization
TRANSNET is one of the nine state owned companies (SOCs) under the jurisdiction of DPE. It transports coal, iron ores, and other mineral materials and general goods in South Africa. Due to the rising prices of mineral resources since 2000, TRANSNET is profitable. Its organization is divided into rail, ports, and pipelines. Among them, TRANSNET Freight Rail (TFR) and TRANSNET Rail Engineering (TRE) are related to the railway business. Figure 3-1 is an organization chart of TRANSNET.
Source: Compiled by Study Team
Figure 3-1 Organization Chart of TRANSNET (2) Overview of Railway Lines
Table 3-1 gives an overview of the railway lines and Figure 3-2 is a route map. The first railway was completed in the 1860s. By 1910, most of the existing main lines had been built. The lines built afterwards are mostly branch lines. Since the opening of the Iron Ore Line and Coal Line in 1976, no new lines have been constructed. Because the main lines were constructed in the old days, whether the alignment of these networks can support higher speed through the introduction of new rolling stock shall be verified.
The important lines are the Iron Ore Line (861 km), Coal Line (450 km), and manganese line (1,000 km). As shown in Figure 3-3, TRANSNET classifies its lines into 1) Core network (approximately 12,800 km) and 2) Branch lines (approximately 7,300 km). TRANSNET has plans to utilize private railway operators effectively for the branch lines (7,300 km) by entering into concession contracts with them and to transfer the branch lines to provincial governments. This plan is based on the Public Finance Management Act (1999) and it has been approved by the Minister of DPE. The objectives are to 1) boost regional development; 2) promote modal shift from road to railway; 3) reduce transportation cost; 4) encourage private sector participation in the railway business; and 5) enhance the safety of road and railway transport. In reality, approximately 7,000 km of the Core Network are used for freight transport. Figure 3-4 shows the axle load of each route. The axle loads are heavy compared to that of the Japanese rolling stock (maximum 16 tons).
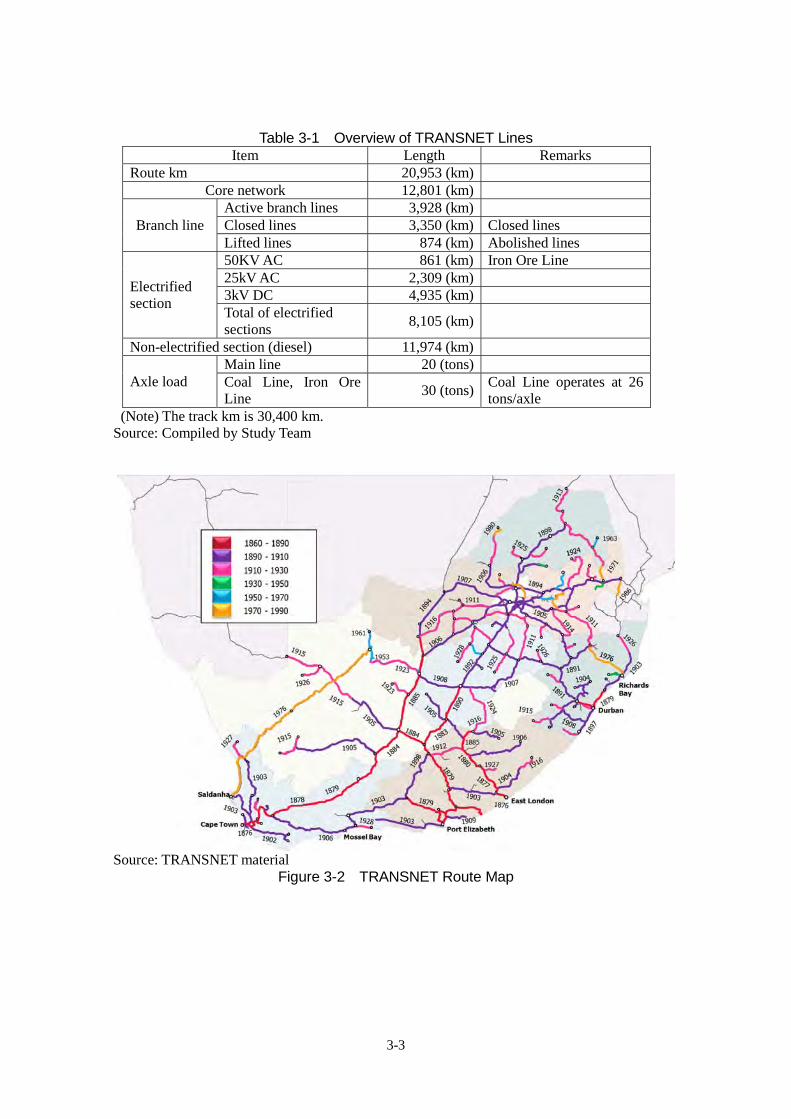
3-3
Table 3-1 Overview of TRANSNET Lines
Item Length Remarks Route km 20,953 (km)
Core network 12,801 (km)
Branch line Active branch lines 3,928 (km) Closed lines 3,350 (km) Closed lines Lifted lines 874 (km) Abolished lines
Electrified section
50KV AC 861 (km) Iron Ore Line 25kV AC 2,309 (km) 3kV DC 4,935 (km) Total of electrified sections
8,105 (km)
Non-electrified section (diesel) 11,974 (km)
Axle load Main line 20 (tons) Coal Line, Iron Ore Line
30 (tons)Coal Line operates at 26 tons/axle
(Note) The track km is 30,400 km. Source: Compiled by Study Team
Source: TRANSNET material
Figure 3-2 TRANSNET Route Map

3-4
Source: TRANSNET material
Figure 3-3 Core Network and Branch Lines
Source: TRANSNET material
Figure 3-4 Axle Load of Various Routes (3) Railway Investments to Date
Figure 3-5 shows the investment amounts in TFR and TRE to date. Although the investments show a rising trend from FY 2005 onward, the investments until FY 2004 were small. For a

3-5
breakdown of the investments, Table 3-2 shows the investment amounts to TFR by facility in FY 2009 and Table 3-3 shows the investment amounts to TFR by freight transport item in FY 2010. In Table 3-3, the coal export and iron ore export account for 54% of the total, showing that investments are concentrated in the important Coal Line (450 km) and Iron Ore Line (861 km).
Source: Compiled by Study Team
Figure 3-5 Investments in TFR and TRE until FY 2011
Table 3-2 Breakdown of TFR Investment by Facility in FY 2009 Unit: ZAR
Infrastructure Locomotive Freight car Total Sustaining 2,072 million 2,921 million 2,009.2 million 7,085 million Expansion 1,543 million 532 million 566 million 2,641 million Total 3,615 million 3,453 million 2,658 million 9,726 million
Source: Compiled by Study Team
Table 3-3 Breakdown of TFR Investment by Transport Item in FY 2010 Freight transport Investment amount (ZAR) Percentage
General Freight 5,758 million 46% Export Coal 3,138 million 25% Export Iron Ore 3,646 million 29% Total 12,542 million
Source: Compiled by Study Team (4) Overview of Transnet Freight Rail (TFR)
TFR is the only rail freight public corporation in South Africa. It also owns and manages the railway infrastructure in South Africa. It is the largest operation unit of TRANSNET and has about 24,000 employees. (5) Overview of Transnet Rail Engineering (TRE)
TRE maintains rolling stock, manufactures freight cars/locomotives, and upgrades freight cars/passenger cars, etc. (large-scale repair works such as replacement of main equipment, car body,

3-6
etc.). It has about 13,000 employees. It currently owns 132 depots and 6 factories (Koedesport, Germiston, Durban, and Uitenhage in Pretoria and Salt River and Bloemfontein in Cape Town).
Its business is divided generally into nine areas, as shown in Figure 3-6. Table 3-4 shows the business area of each factory.
Source: Compiled by Study Team
Figure 3-6 Organization Chart of TRE
Table 3-4 Functions of Various Factories
Business area Koedoes-
poort Germiston Durban Uitenhage Salt River Bloemfontein
Locomotive Coach Wagon Port Rolling Stock Equipment
Rotating Machine
Auxiliary Wheel Foundry
Source: Compiled by Study Team (6) Educational Institutions
1) School of Engineering The School of Engineering was established under TRE as an education and training institution. It has other campuses in Koedoespoort (Pretoria), Germiston, Durban, Bloemfontein, Uitenhaga (Port Elizabeth), Salt River, and Saldanha (Cape Town).

3-7
2) School of Rail The School of Rail was established under TFR as an education and training institution. It has main campus in Tambo area in Johannesburg, which provides education for train drivers, signaling staff, and train operational personnel.
3.1.4 PRASA
(1) Organization
PRASA is an organization under the jurisdiction of the Department of Transport (DOT). It provides commuter railway transport in cities, long distance passenger services between cities, and long distance bus services. PRASA is divided into five units, three departments (PRASA Rail, PRASA Technical, and PRASA CRES) and two supplementary departments (Autopax and Intersite Investments). Figure 3-7 is an organization chart of PRASA and Table 3-5 shows the job functions of the various departments. The PRASA Group as a whole has about 16,000 employees.
Source: Compiled by Study Team
Figure 3-7 Organization Chart of PRASA
Table 3-5 Job Functions of Various Departments Department Job functions
PRASA Rail Metrorail operates commuter trains in cities and Shosholoza Meyl operates long-distance trains between cities. They receive subsidies from the government for their operation.
PRASA Technical It is established in April 2012 for the maintenance and refurbishment of existing rolling stock, and receipt of new rolling stock.
PRASA CRES (Note)
It manages real estate assets owned by PRASA, including buildings, stations, and land, etc. It is responsible for managing the existing facilities, utilizing and commercializing land effectively, upgrading stations, and preparing renovation plans.
Autopax It is a bus company established during the 2010 FIFA World Cup and bought 500 buses for that purpose. It is offering inter-city and rural transport services. It does not receive any subsidies for its operation.
Intersite Investment It invests in the development of new stations and large stations, such as the Johannesburg Park Station and Cape Town Station. It is responsible for 12–15 large-scale area developments near stations.
(Note) Corporate Real Estate Solutions Source: Compiled by Study Team

3-8
(2) Route Overview
Metrorail operates commuter trains in cities and Shosholoza Meyl operates long-distance trains between cities. Metrorail provides urban transport in six major cities in South Africa, including Johannesburg (360 km), Pretoria (120 km), Cape Town (370 km), Durban (208 km), East London (49 km), and Port Elizabeth (43 km).
Shosholoza Meyl uses Metrorail tracks inside cities and TRANSNET tracks outside cities. Table 3-6 shows the operation sections of Shosholoza Meyl.
The fare revenue of Metrorail can only pay for 30% of its necessary expenses; the remaining 70% (3,000 million ZAR) are subsidized by the government. Subsidies for Shosholoza Meyl amount to 500 million ZAR. Payments from the government tend to be late.
Table 3-6 Operation Sections of Shosholoza Meyl
Operation section No. of trains (train/week)
Travel time (minimum)
Johannesburg–Cape Town 6 26 hr. 10 min. Johannesburg–Durban 6 12 hr. 30 min. Johannesburg–Port Elizabeth 3 20 hr. Johannesburg–East London 6 20 hr. Johannesburg–Komatipoort 3 12 hr. 20 min. Johannesburg–Musina 3 14 hr. 20 min. Source: Compiled by Study Team
Source: PRASA material
Figure 3-8 PRASA Route Map
Johannesburg
Pretoria
Durban
Cape Town
East London
Musina
Port Elizabeth
Komatipoort
Metrorail Shosholoza Meyl

3-9
(3) PRASA Investments to Date
Figure 3-9 shows the investments in PRASA. The amounts of investment were low until the second half of the 2000s. However, due to the aging rolling stock, facilities and the increasing need for investment for safety measures, PRASA took the opportunity of urban development for the hosting of the 2010 FIFA World Cup to upgrade rolling stock and station facilities. The amounts of investment increased from FY 2007.
Source: Compiled by Study Team
Figure 3-9 Investments in PRASA until 2011 (4) Educational Institution
The Center of Technology (COT) was established in April 2012 under PRASA Technical. The Training Academy is the educational institution of PRASA Rail. It has campuses at four locations, including Durban, Cape Town, Pretoria, and Braamfontein. Each year, about 2000 to 2500 PRASA employees receive training there. 3.1.5 Gautrain
Gautrain is an 80-km line linking Pretoria in the north and Johannesburg in the south, with a branch line from Marlboro to O.R. Tambo International Airport. The O.R. Tambo International Airport–Sandton section (approximately 20 km in length) was opened on June 8, 2010. The line started full service from June 22, 2012. The conventional lines in South Africa use 1065-mm gauge and most of them use DC electrification (3 kV). Gautrain, on the other hand, uses standard gauge (1435 mm) and AC electrification (25 kV 50 Hz). Each station has Park & Ride facilities. Gautrain also offers buses as a feeder service.
“Electrostar,” a four-car train (car width: 2.8 m, length: 83.17 m, and occupancy: 321 persons) made by Bombardier Transportation is used for the Gautrain line. It operates at 160 km/h, the highest speed in Africa. The headway is 20 minutes but is shortened to 12 minutes during rush hours. It takes 14 minutes from O.R. Tambo International Airport to Sandton. Bombardier delivered 24 trains (96 cars). Five trains service the airport link and 19 trains are used for intercity transport between Johannesburg and Pretoria. Of the 96 trains, fifteen were

3-10
manufactured at Bombardier’s Derby plant in the UK and the remaining 81 trains were assembled by UCW in South Africa.
The Gautrain has been constructed and operated by the method of public-private partnership (PPP) which is the biggest in Africa. In 2006, the Gauteng provincial government and Bombela Consortium reached a 20-year PPP business agreement. The Consortium procured 50% of its funds from Bombardier in Canada and RATP Développement in France and the other 50% from major construction companies and banks in South Africa.
The 80-km route has 20 km of tunnels and 9 km of elevated tracks and embankments. Among the ten stations (platform length of 160 m), three of them are underground stations. The total project cost was 26 billion ZAR. The construction began on September 28, 2006.
There is quite a difference between the fares for airport passengers and suburban passengers. While the O.R. Tambo International Airport–Sandton section costs 115 ZAR, the suburban transport, for example, Sandton–Rhodesfield section only cost 27 ZAR. When using the Gautrain, passengers pay 6 ZAR for the Gautrain buses that connect at the stations and 12 ZAR per day for parking (Park & Ride).
Source: Gautrain material
Figure 3-10 Gautrain Route Map
3.2 Current State of Railway Transport and Challenges
3.2.1 TRANSNET
(1) Transport Volume
Figure 3-11 shows the changes in the transport volumes of TRANSNET, which indicate a rising trend. In particular, in the backdrop of an increasing global need for resources in recent years, the export volumes of mineral resources have increased. Of the 201 million tons of total transport volumes in FY 2011, the Coal Line (450 km) transported 67.7 million tons, the Iron Ore Line (861 km) 52.3 million tons, and the manganese line (1000 km) 5.5 million tons. The

3-11
lengths of these three lines total 2,311 km but they accounted for about 60% of the total transport volume, showing that rail freight is concentrated on these three lines.
Source: Compiled by Study Team
Figure 3-11 Changes in Transport Volumes (2) Important Routes
1) Coal Line The Coal Line is a 25 kV AC electrified line. It is designed for an axle load of 30 tons but the actual axle load of freight trains is 26 tons. Since the Overvaal Tunnel near Ermelo is single-track, the transport volume (line capacity) is limited. The line was completed in 1976. There are 16 trains/one way per day.
The transport capacity of the Coal Line is 81 million tons/year while the coal port Richards Bay can handle 91 million tons/year, showing that the transport capacity of rail freight is smaller. About 50% of the freight volume transported on the Coal Line is for general freight business (GFB), such as lumber, fertilizers, chemicals, and so on.
2) Iron Ore Line The line was constructed using funds from the national company YSCOR. After completion in 1976, the Iron Ore Line has been transporting iron ores from the Sishen mine, Khumani mine, and Kolomela mine to the ports in Saldanha. Since the transport volume of the iron ores for export is determined by the freight transport capacity of the Iron Ore Line, the freight transport capacity of the line has become the bottleneck. 3) Manganese Line The section between the manganese mine (Postmasburg) and Kimberly (250 km) uses the 3 kV DC electrification system while the section between Kimberly and Port Elizabeth (approximately 1,000 km) uses the 25 kV AC electrification system. General freight is also transported on this line. At this time, manganese is transported on the manganese freight train, which has 104 cars. Since the capacity of Port Elizabeth is limited, the Ngqura Port, which has higher capacity, will be used in the future.

3-12
(3) Challenges
1) Aging Branch Lines Using a “selection and concentration” policy, TRANSNET transports freight on approximately 7,000 km of the lines; the rest of the lines are mostly not used. Since the tracks of the unused lines have not been maintained, the branch lines in particular have become dilapidated.
2) Coping with Increasing Demand The railway’s capacity to transport mineral resources from production sites to loading ports cannot meet the demand. The transport volumes of coal and iron ore, which are important mineral resources, are constrained by the railway transport capacity, which is the bottleneck. 3.2.2 PRASA
(1) Transport Volume
1) Metrorail Table 3-7 shows the daily ridership of Metrorail, which is rising every year. However, the FY 2010 ridership is lower than that of the previous year because the number of passengers due to traffic to the Word Cup was subtracted.
Table 3-7 Daily Ridership of Metrorail Unit: 10,000 passengers
FY Johannesburg,
Pretoria Cape Town Durban
East London, Port Elizabeth
Total
2005 73.4 47.9 16.4 2.5 140.3 2006 76.2 48.8 17.8 2.7 145.5 2007 85.5 53.2 20.5 3.0 162.2 2008 93.2 57.7 22.7 3.8 177.0 2009 90.7 55.3 24.1 3.8 174.0 2010 63.6 44.1 18.9 2.7 129.3
Source: Compiled by Study Team 2) Shosholoza Meyl Table 3-8 shows the ridership in each Shosholoza Meyl operation section.
Table 3-8 Shosholoza Meyl Ridership
Operation section No. of trains (train/week)
No. of passengers (Note) (passenger/week)
Johannesburg–Cape Town 6 1731 Johannesburg–Durban 6 1618 Johannesburg–Port Elizabeth 3 489 Johannesburg–East London 6 1345 Johannesburg–Komatipoort 3 634 Johannesburg–Musina 3 292
(Note) No. of passengers per week (August 22–28, 2012) Source: Compiled by Study Team (2) Challenges
1) Aging Facilities Since PRASA has not made proper investment in railway facilities for many years, the facilities are old. In particular, aging of the rolling stock is quite serious because the average period of use

3-13
has reached 37 years1. Although the tracks have been maintained, damages to the rails and sleepers are visible. 2) Safety Issue The aging facilities mentioned above threaten the safety of train operation. The facilities break down frequently. Table 3-9 shows the mean time between failures (MTBF) of each infrastructure facility. In particular, since signaling facilities fail every 1.67 hours, safety is a concern.
Table 3-9 Mean Time between Failures at Metrorail (April–August 2012)
Unit: Hour
Gauteng (Note)
Cape Town Durban National average
Track facilities
9.1 27.6 101.9 29.6
Electric facilities
19.0 87.9 100.0 33.9
Signaling facilities
0.7 2.1 4.3 1.67
(Note) Including Johannesburg, Pretoria, East London, and Port Elizabeth Source: Compiled by Study Team
3) Security Issue Metrorail has many stations, making it difficult to allocate security personnel at all stations and onboard the trains. Consequently, thefts, fare cheating, and other crimes are rampant. The graffiti inside trains also stands out. Crime-prevention posters are used to raise the awareness of the public but they have little effect. Due to such security concern, Metrorail is avoided by the well-to-do people with private vehicles. It has become the transportation means of low-income people with no other transport options. 3.2.3 Gautrain
(1) Transport Volume
In the planning stage, the demand was projected at 100,000 people per day. In reality, the ridership is only about 40,000 per day.
The airport link is built from Sandton Station to O.R. Tambo Station. While it takes 30–40 minutes by car and about 90 minutes during the weekday morning rush hours to travel from Sandton to the airport, Gautrain has shortened the trip to 14 minutes, making it very convenient. Therefore, there are many passengers using the airport link from Sandton Station.
(2) Challenges
1) Insufficient Feeder Routes Although Gautrain buses are available at each station, they have limited use because there are insufficient feeder routes. Since the airport link stops at Sandton Station, pickup service is needed to go to the downtown area. Furthermore, there is no transport means available to go to places that are far away from the stations or the Gautrain bus stations. 1 See p.4-5 “Figure 4-3 Age Distribution of Commuter Trains Owned by PRASA”

3-14
2) High Train Fare Table 3-10 is a fare comparison between Gautrain and Metrorail for the same section. The Gautrain fare is about 4–5 times that of the Metrorail. It is high compared to the Metrorail fare, which is kept at a low level as a policy.
Table 3-10 Comparison of Train Fare for the Same Section
Unit: ZAR Section Gautrain Metrorail
Park Station–Pretoria Station 49.00 10.00 Park Station–Rhodesfield Station 31.00 7.00 Rhodesfield Station–Pretoria Station 46.00 8.00 Pretoria Station–Hatfield Station 20.00 5.50
Source: Compiled by Study Team 3.3 Progress of Development Plan and Issues
The Study Team reviewed the development plans formulated by TRANSNET and PRASA and identified issues to facilitate deployment of these development plans. 3.3.1 7-Year Investment Plan of TRANSNET
(1) Overview
TRANSNET has formulated a 7-year investment plan from FY 2012 to FY 2018 to strengthen the functions of freight transport. The investment plan, with a total amount over 300 billion ZAR, aims to enhance the functions of railways, ports, and pipelines in order to meet the increasing market demand. Of the 300-billion ZAR investment amount, approximately 200 billion ZAR will be invested in the railway sector and approximately 100 billion ZAR will be invested in the ports and pipelines sectors. The total transport volume of the railways will be increased from the current 201 million tons/year to 350 million tons/year. While stimulating economic growth and promoting modal shift from road to rail, the investment plan will create jobs (The investment plan, as a whole will create 588,000 jobs.), enhance the skills of workers, enable localization, and facilitate modernization of the railways. Figure 3-12 is an overview of the 7-year investment plan and Figure 3-13 shows the changes in investment amounts.

3-15
Source: TRANSNET Market Demand Strategy, April 10, 2012, TRANSNET Figure 3-12 Overview of 7-Year Investment Plan
Source: Compiled by Study Team
Figure 3-13 Investment Amounts of the 7-Year Investment Plan As shown in Figure 3-14, the amounts of investment for different TRANSNET groups will total 205 billion ZAR, with 201 billion ZAR earmarked for TFR and 4 billion ZAR for TRE. Compared to the investments (70 billion ZAR) in TFR and TRE in the last seven years (FY 2005–2011), the amounts of investments will be tripled.
In terms of investment by facility, the plan will invest 77.8 billion ZAR in locomotives and 71.1 billion ZAR in tracks, as shown in Figure 3-15.

3-16
Source: Compiled by Study Team
Figure 3-14 7-Year Investment Plan by Group
Source: Compiled by Study Team
Figure 3-15 7-Year Investment Plan by Facility Table 3-11 shows the major investment projects of the railway sector. Table 3-12 shows the investment amount by transport item and the target values of transport volumes.
Table 3-11 Major Investment Projects for the Railway Sector
Investment Project Investment amount
(billion ZAR) Introduction of new locomotives 110 Improvement of Coal Line 35 Improvement of signaling systems 15 Technical training 7.6 Small business promotion 4.2 Source: Compiled by Study Team

3-17
Table 3-12 Investment Amount by Transport Item and Target Values of Transport Volumes
Investment amount
(billion ZAR)
Transport volume (ton/year) Current
【FY 2011】 Target
【FY 2018】 General freight
151.1 79.70 million 170.2 million
Coal for export
31.6 68 million 97.5 million
Iron ores for export
18.3 53 million 82.5 million
Total 201 200.7 million 350.2 million Source: Compiled by Study Team
The following shows the progress and challenges of each sub-sector of the development plan. (2) Rolling Stock
1) Progress of Development Plan The rolling stock procurement plan shown in Table 3-13 has been formulated for the rolling stock area.
Table 3-13 Rolling Stock Procurement Plan of TRANSNET Usage
GFB(General Freight Business) Coal
export Iron ore export
Freight Type EL EL DL
Series 19E EL
Series 15E EL & DL
2013 45 - - - - 2,108 2014 50 - 100 56 - 1,398 2015 - 65 100 56 - 2,440
2016 - 130 100 - EL 23 DL 3
3,092
2017 - 130 100 - - 4,285 2018 - 130 65 - - 3,223 2019 - 144 - - - 2,854 Total 95 599 465 112 26 19,400
EL: Electric Locomotive, DL: Diesel Locomotive Source: TRANSNET Annual Results, March 31, 2012 Among the procurement items, the bidding for 95 units of electric locomotive for general freight business in 2013–14 was closed in April 2012. It is believed that Mitsui-Toshiba, Siemens, Alstom, Bombardier, China South Locomotive and Rolling Stock Industry (Group) Corporation (CSR) Zhuzhou, China North Locomotive and Rolling Stock Industry (Group) Corporation (CNR) Dalian, and several South African companies have tendered bids for this project, which totals 4 million USD. In October, the South African government announced that CSR Zhuzhou has been awarded the order of these 95 electric locomotives.
The closing date for the bidding of 599 units of electric locomotive for general freight business in 2015–19 and the 465 units of diesel locomotive for general freight business in 2014–15 was scheduled for October 16, 2012. However, the briefing session for the bidding was postponed to November 29 and the closing of the bid to February 26, 2013. 2) Issues of Development Plan The TFR rolling stock procurement plan orders many units a year and the order spans several

3-18
years. In order to satisfy the high-level requirements of localization, it is necessary to strengthen the rolling stock manufacturing facilities and human resources in South Africa in general. From the perspective of the rolling stock manufacturers, it is a big concern to what extent the facilities and human resources to be added will be used in the long term.
As shown in Figure 3-16, TRANSNET predicts that the rail freight transport volume will more than triple in the 30 years after 2011, with general freight growing at an impressive rate of 6% on the average every year.
Source: TRANSNET material
Figure 3-16 Forecast of Freight Transport Volume in the TRANSNET Long-term Plan
At this time, however, the rolling stock plan after the end of the 7-year investment plan is not clear. Rolling stock manufacturers will face a tough decision on how to utilize the facilities and human resources to be added. (3) Signaling and Telecommunications
1) Progress of Development Plan (2010–2035) The mid-to-long term plan aims to enhance transport capacity, increase speed, and improve transport efficiency of especially the dedicated freight lines (coal, iron ore, manganese). To this end, the double-track Centralized Traffic Control System (CTC) will be adopted and the signaling and telecommunication facilities will be upgraded and improved to shorten the headway between trains.
Furthermore, as shown in Figure 3-16, adoption of the train management system and onboard data communication system, and upgrade of the infrastructure and rolling stock monitoring systems have been planned for the future.
Since approximately 6,100-km of the color light signal sections (approximately 7,700 km) already have CTC, the mid-to-long term CTC plan will upgrade the rest of the 1,600 km to CTC.

3-19
Table 3-14 shows the specific plans for the sections in each area and the targeted fiscal year for their completion.
Source: TRANSNET material
Figure 3-17 Concept of the TRANSNET Systems
Table 3-14 List of TRANSNET Mid-to-Long term Plans Section/Area
Planned construction Section/Location Planned
completion
Iron Ore Line
Improvement of signals and telecommunications
Expand side tracks for crossing (19 locations, 4.4 km)
2010
Improvement of signals and telecommunications
Expand sides tracks for passing (4.4 km)
2014
Improvement of signals and telecommunications
Expand side tracks for crossing (9 locations, 4.4 km)
2015
Western and Southern Cape area
CTC for parallel single tracks
Kraaifontein–Bellville 2014
Improvement of signals and telecommunications
Wellington–Kraaifontein 2014
Eastern Cape area (Manganese line)
Improvement of signals
Hotazel–Kimberley 2013
CTC Hotazel–Kimberley 2019 Double-track CTC Hotazel–Kimberley 2022 Signals for double tracks
Kimberley–De Aar 2019
CTC Noupoort–Bloemfontein After 2025
Freight ring plan for Gauteng area
Double-track CTC Pendoring–Rustenburg 2027 Double-track CTC Pyramid.S–Wildebeeshoek 2027 Double-track CTC Baviaanspoort–Leeufontein 2032 Double-track CTC Tweedracht–Kleinzonderhout 2033 Double-track CTC Roodekoppies–Knoppiesfontein 2025

3-20
Double-track CTC Ystervarkfontein–Katbosfontein 2036 Shortening headway to 8 minutes
Zestfontein–Cowles Dam 2027
Shortening headway to 8 minutes
Aurum–Rooivlei 2037
Shortening headway to 8 minutes
Rooivlei–Rietvallei 2027
New CTC for double tracks
Houtheuwel–Skansdam 2029
Plan for connecting Capecor and Natcor in the Gauteng area
CTC Fieldsview–Macfarlane 2032 CTC Macfarlane–Klerksdorp 2020 CTC Potchefstroom–Koekemoer 2035 Double-track CTC Cachet–Welverdiend 2025 Double-track CTC Oberholzer–Randfontein 2030
Natcor
CTC Kaydale–Palfmord 2028 CTC Palmford–Ennersdale 2031 CTC Kaydale–Pietermaritzburg 2035 CTC Ennersdale–Pietermaritzburg 2028
Richcor Improvement of signals
All sections 2018
Eastern Port Feeder Double-track CTC Durban–Richards Bay 2035
Maputo Corridor Double-track CTC Witbank–Derwent 2026 Double-track CTC Belfast–Machadodorp 2029 Double-track CTC Machadodorp–Nelspruit 2026
Source: Compiled by Study Team 2) Challenges of Development Plan It is not known how TRANSNET is coordinating with PRASA in its mid-to-long term plans. In particular, since the general freight transport and intercity passenger transport both use the infrastructure owned by TRANSNET, if the CTC development plan is pursued with only freight transport in mind, PRASA, which operates the intercity passenger transport, must reflect the different TRANSNET systems in its specifications; otherwise, operational mishaps will eventually result. (4) Electric Supply
1) Progress of Development Plan TRANSNET places priority on major freight lines to boost transport capacity in the mid-term plan and aims at doubling the tracks in the long-term plan. Table 3-15 shows the mid- and long-term plans of TRANSNET.
Table 3-15 Mid-and Long-term Plans of TRANSNET
Line/ Area Planned construction Section/Location
Planned completion
Iron Ore Line
Improvement of overhead contact lines
Expand tracks for crossing, 19 locations, 4.4 km
2010
Improvement of overhead contact lines
Expand the side tracks for passing (4.4 km)
2014
Improvement of overhead contact lines
Expand tracks for crossing, 9 locations, 4.4 km
2015

3-21
Eastern Cape area
(Manganese line)
Construction of new substation
2 locations, Hotazel–Sishen 2021
Improvement of overhead contact lines
Expand tracks for crossing, 5 locations, (3 kV DC)
2019
Upgrade of overhead contact lines
3 substations, 25 kV, Hotazel–Kimberley 2013
Electrification of double tracks
3 kV DC, Hotazel–Kimberley 2022
Electrification of double tracks
Kimberley–De Aar 2019
Freight ring plan for
Gauteng area
Doubling of track 25 kV, Pendoring–Rustenburg 2027
Doubling of track 25 kV Pyramid South–Wildebeeshoek
2027
Doubling of track 3 kV, Baviaanspoort–Leeufontein 2032 Doubling of track 3 kV, Tweedracht–Kleinzonderhout 2033 Doubling of track 3 kV, Roodekoppies–Knoppiesfontein 2025 Doubling of track 3 kV Ystervarkfontein–Katbosfontein 2036
Plan for connecting
Capecor and Natcor in the Gauteng area
Doubling of track 3 kV, Macfarlane–Klerksdorp 2020
Richcor area 25-kV electrification Blackhill–Ermelo 2020 Eastern Port
Feeder Doubling of track Durban–Richards Bay 2035
Maputo Corridor
Doubling of track 3kV, Witbank–Derwent 2026 Doubling of track 3kV, Belfast–Machadodorp 2029 Doubling of track Machadodorp–Nelspruit 2026
Northern area 25-kV electrification Lephalale–Thabazimbi 2020 Source: Compiled by Study Team 2) Challenges of Development Plan TRANSNET is planning to strengthen freight transport, its main operation. However, freight transport will compete with the long-distance intercity transport of PRASA for the same tracks. Under such circumstances, coordinating the use of electricity is essential.
The utility company Eskom will be providing electricity to the railways. In tandem with the modernization plan of the railway sector, Eskom also has put in place a 10-year expansion plan so that even though the railway’s transport volume increases, it can supply the electricity needed. Eskom is responsible for 85% of all electricity generation in South Africa. Although it can transmit 100% of the electricity, it can only distribute 65%. Except for the Iron Ore Line, the railway substations receive 132 kV and 88 kV electric supplies from Eskom, or lower distribution system. Therefore, depending on the area, it may be necessary to consider using electricity supplied by other utility companies. (5) Civil Engineering
1) Progress of Development Plan The major civil engineering projects are explained below: The plan for new railway lines includes the Swaziland rail link and the new line linking the Waterberg coalfield and Ermelo. However, the 7-year investment plan only includes studies for these lines. Their construction costs have not been earmarked in the investment plan.

3-22
a) Iron Ore Line In the backdrop of increasing demand for iron ores worldwide, Kumba and other mining companies are increasing the production of iron ores. Although production is on the rise, the transport capacity of the Iron Ore Line has become the bottleneck. In order to expand the transport capacity of the Iron Ore Line from the current 60 million tons/year to 82.5 million tons/year, construction of crossing facilities and a railway line at the Saldanha Port is planned.
b) Coal Line Relative to the 91 million tons/year of freight that the Richards Bay Port can handle, the Coal Line has transport capacity for only 81 million tons/year. The railway capacity of the Coal Line has become the bottleneck. To expand the transport capacity of the Coal Line from the current 81 million tons/year to 97.5 million tons/year, TRANSNET plans to raise the axle load of the feeder lines from the coalfields to Ermelo to 26 tons.
c) Manganese Line The manganese reserve in South Africa amounts to approximately 80% of the world manganese reserve. However, South Africa only has 20% of the world market. Given the increasing demand for manganese, TRANSNET plans to increase the transport capacity of the manganese line to 16 million tons/year so that the mining companies can supply the manganese to the market. The plan will 1) double the tracks in the Kimberly–De Aar section (232 km), 2) construct a new loop line, and expand the existing loop line to accommodate freight trains with 200 wagons. d) New Swaziland Rail Link Plan The Swaziland Rail Link will serve as a new transport route between Ermelo and Maputo and as an alternative transport route for the existing Coal Line (Ermelo–Richards Bay). The plan will shift the general freight transported on the Coal Line to the new line and increase the transport volume of general freight to the ports in Maputo and Richards Bay. The 7-year plan has slated 5 billion ZAR for investment. The project will include the construction of new lines in the following sections and improvement of the existing lines.
Construction of a new line in the Lothair–Nerston–Sidvokodvo section (146 km) Improvement of the existing lines in the Davel–Klipstapel section, Klipstapel–Lothair
section, Sidvokodvo–Golela section, and Golela–Richards Bay section
Figure 3-18 shows the planned position of the New Swaziland Rail Link.

3-23
Source: Compiled by Study Team based on Google Map
Figure 3-18 Planned Position of the New Swaziland Rail Link Plan e) Waterberg New Line Plan The Waterberg region is said to have 40% of South Africa’s coal reserve, which amounts to 35 billion tons. The coal in the Ermelo area is expected to be depleted in 15 to 20 years; therefore, Waterberg will replace Ermelo for the mining of coal for export and domestic consumption (electricity generation by Eskom) in the future. The target of coal transport for the immediate future is 23 million tons/year. At this time, the concept study has been completed and a feasibility study will be conducted. An investment of 5.1 billion ZAR is slated for this project. The project includes the following plans:
Upgrade the axle load to 26 tons Electrification of Thabazimbi–Lephalale section Expansion and restructuring of marshalling yard
Figure 3-19 shows the planned position of the Wataerberg New Line.
DavelLothair
Nerston
Sidvokodvo
Golela
Richards Bay
Construction of new line
Improvement of existing line

3-24
Source: Compiled by Study Team based on Google Map
Figure 3-19 Planned Position of Waterberg New Line 2) Challenges of Development Plan The TRANSNET 7-year plan aims to increase the transport volumes of major lines, with approximately 140% increase to the Iron Ore Line and 120% to the Coal Line. To cope with the increase, TRANSNET will construct and expand the transport facilities. The increase in transport volume will exert more burdens on the tracks, making track maintenance even more important. At present, these tracks are closed down once a year for track maintenance. It has been pointed out, however, that TRANSNET does not have a clear strategy for track maintenance and it has not put much emphasis on it thus far. Therefore, it is necessary to include a track maintenance plan in the investment plan. 3.3.2 PRASA Modernization Project
(1) Overview
The PRASA commuter trains were manufactured based on a basic structure using the technologies of the 1950s. Given their average age of 37 years, the trains are old. Of the approximately 4,600 cars (2011), only about 3,000 cars can actually be used. In the last three years (as of February 2012), approximately 2,000 cars have been upgraded. The upgrade is a major refurbishment, which ranges from installing a new car body on a reused underframe, installing new electrical equipment, and so on. Besides the upgrade, approximately 12 billion ZAR was spent in an overhaul to inspect/repair the removed equipment and regular maintenance. Because about one-third of the cars already have a service life of over 37 years, it is not a good idea to upgrade the old cars. They shall be replaced as early as possible.
To that end, a modernization strategy has been formulated. It includes introduction of new model rolling stock and compatible networks, facilities, and signal improvements. Table 3-16 shows the major investment items being planned at this time.
Lephalale
Waterberg Coalfield
Thabavimbi
Botswana

3-25
Table 3-16 PRASA Modernization Project
Item Investment amount
(billion ZAR) Procurement of new EMUs (7,224 cars) (in the future 20 years)
135
Modernization of signaling system (in the future 5–10 years)
17
Modernization of infrastructure (in the future 3 years)
15
Repair of existing cars (in the future 3 years) 10 Source: Compiled by Study Team
The following explains the progress and challenges of the development plan of each subsector: (2) Rolling Stock
1) Progress of Development Plan The 7,244 units of EMUs to be procured under the Metrorail plan is the number of units required to replace the existing cars based on the projected demand for the future 20 years and the approximately 1,500 units for the new lines being planned (Cape Town, etc.). Specifically, a contract to supply 360 units of new rolling stock per year for 10 years starting from 2015 will be executed in two phases. Bidding for the first-phase 10-year rolling stock procurement started in May 2012 and was scheduled to close on September 10 of the same year but was later extended to September 30.
The specifications for the new rolling stock are as follows: - 6-car configuration, 135 m in length, and couple into a 12-car configuration during peak
hours - Occupancy: “Metro” 1,215 persons (long seats) and “Metro Express” 1,025 persons (cross
seats) - Maximum safety using Automatic Train Protection (ATP) - Maximum speed: 120 km/h (basic design speed 160 km/h) - Cape Gauge (1065 mm) - 3kV DC electrification. However, the trains used in Eastern Cape province and some of the
new lines will use 25 kV AC. - Design life: 40 years
Prior to the above, bidding for 88 units of dual diesel electric locomotives to enhance the traction power of Shosholoza Meyl’s long-distance passenger trains took place in December 2011. It was announced that a lease contract with Swifambo Leasing totaling 3.5 billion ZAR was concluded. The manufacturer is Fossloh (Germany). These locomotives will be introduced three to five years from now. 2) Challenges of Development Plan The challenges of this plan are the same as those of the TFR locomotive procurement plan. That is, the scale of the PRASA rolling stock procurement plan is extremely large. It plans to procure 360 cars a year. The first phase alone will span 10 years.
On the other hand, it is not clear at this time how the procurement plan will proceed specifically after the second phase. Rolling stock manufacturers will face a tough decision on how to utilize the facilities and human resources to be added.

3-26
(3) Signaling
1) Progress of Development Plan (2010–2025) To modernize the signaling and telecommunications facilities, the mid-term development plan will upgrade the existing aging facilities from 2010 to 2019. The objectives are to enhance the safety, reliability, and operability; improve services by ensuring punctual operation; increase transport capacity by shortening headways and enabling two-way operation; strengthen measures to prevent lightning damage, and take measures to prevent thefts and destruction of wayside facilities, and so on.
As a means to achieve these objectives, PRASA plans to implement the following set of specific measures:
・Introduce electronic interlocking device ・Adopt automatic train detection ・Install LED signals ・Use facilities monitoring device ・Introduce new type CTC ・Install optic ring network (2010 – 2014) ・Set up operation communication networks for dispatching facilities and station facilities ・Set up digital wireless telecommunications network (GSM-R) (2012 – 2017) ・Install barrier along railway tracks (2010 – 2014) ・Install level crossing protection equipment
In the implementation of these measures, PRASA aims to build a foundation for introducing the latest wireless train control system in the next step. It will coordinate introduction of new rolling stock with the utilization of a high-speed high-capacity open transport network.
The long-term development plan aims to put in place a wireless train control system in 2020. This system will replace the ground signaling system with wireless communication between the onboard and ground devices in order to control the interval between trains to prevent collision. Consequently, the system will cut maintenance cost by drastically reducing ground facilities and enabling train operation with minimum headways. Furthermore, as shown in Figure 3-20, a policy will be adopted to enable the driver to carry out automatic or semi-automatic train operation if needed.

3-27
Source: PRASA material
Figure 3-20 Mid- and Long-term Plan for Signaling and Telecommunications
The budget for the mid-term development plan will reach 17 billion ZAR to promote modernization of the signaling and telecommunications facilities under the jurisdiction of Gauteng, Kwa Zulu Natal (KZN), and Western Cape. In the next five to over ten years, 1 billion ZAR will be allocated to the Gauteng area and 3.5 billion to 4 billion ZAR to the Western Cape area.
As for the progress of the development plan, international bidding for the modernization project of Gauteng area resulted in Siemens SA being awarded the project in January 2012. A contract agreement was concluded in August and the project was launched.
The modernization project of the Western Cape area is divided into Phase I (Central Line) and Phase II (including 4 other sections and the equipment and signal section). In Phase I, in tandem with the moving of the current CTC center from Windermere to Bellville, upgrade of all the Central Line facilities will be completed in 2015. The bidding was closed in August 2012 and eight companies have tendered bids. In the end, Thales was awarded the first refusal right and the project is expected to start within this fiscal year. On the other hand, Phase II is scheduled to start in 2019 and to be completed by 2022.
Furthermore, Bombardier was awarded the first refusal right for Durban in the KZN area and the project is expected to start within FY 2012. 2) Challenges of Development Plan a) Coordinating the Schedules of the PRASA Projects in Introducing New Rolling Stock and Signaling and Telecommunications
With regard to the abovementioned signaling and telecommunications project for the three areas, the lack of coordination in the schedules between the introduction of ATP to enable high-density train operation while preventing train collision and the introduction of new rolling stock (EMU) is a concern.

3-28
b) Need for a Plan to Enable Smooth Transition from the Existing System to the New System When implementing the development plan, it is necessary to put together a well-thought-out plan and carry out publicity activities in advance to avoid causing inconvenience to the society and problems resulting from lower service level.
c) Prompt Education and Training to Prepare Staff for the Modernization and Maintenance of Signaling and Telecommunication Facilities No large-scale investment in facilities was made since 1990 and no technology transfer took place during that period. Since projects to modernize facilities started to take off in FY 2012, it is important to transfer technology to the technical staff at PRASA through education and training in new technologies as well as maintenance technology for maintaining the facilities.
d) Unifying Traffic Control The development plan places emphasis on the urban commuter railways of three areas: Gauteng, KZN, and Western Cape. However, its compatibility with the future inter-city long-distance railway plan (Shosholoza Meyl) is not clear. From the operational and technical aspects, it will be a challenge to unify the traffic control of Metrorail and Shosholoza Meyl.
In addition, compared to the traffic control of Gautrain, which is in operation, the PRASA development plan does not have a traffic control system. If dispatching will be performed as previously, there are concerns about a new system that can deal with operation in the future.
e) Coordination with TRANSNET to Separate Passenger and Freight It is necessary to coordinate with TRANSNET immediately with regard to the separation of freight and passenger transport so that the general freight transport will not interfere with the inter-city passenger transport. According to the TRANSNET plan, its goal is to complete introduction of the CTC to the Gauteng area by 2025. At this time, there are no CTC plans for the other areas.
It is also necessary to coordinate with TRANSNET with regard to the separation of assets between passenger and freight transport and the dissolution of PRASA consignment of dispatching duties to TRANSNET.
(4) Electric Supply
1) Progress of Development In the PRASA modernization plan, upgrade of the overhead contact lines (OHTE) is planned in tandem with the introduction of new rolling stock. Amid the infrastructure plans (total of 645 projects) in SIP1 (Strategic Integrated Projects) to SIP17 approved by the Presidential Infrastructure Coordinating Commission (PICC), electrification of the existing line sections in the next 20 years has been registered in the transportation project SIP7. In addition, upgrade of the overhead contact lines together with the upgrade of signaling system in the Durban area is scheduled to start in FY 2012. 2) Challenges of Development Plan Similar to TRANSNET, electricity to PRASA will be supplied by the utility company Eskom. In response to the modernization plans of the railway sector, Eskom has put in place its own 10-year upgrade plan. Therefore, even if the railway’s transport volume increases, Eskom can supply the electricity needed. Eskom is responsible for 85% of all electricity generation in South Africa. Although it can transmit 100% of the electricity, it can only distribute 65%. Therefore, depending on the area, it may be necessary to consider using electricity supplied by other utility companies.

3-29
(5) Civil Engineering
1) Progress of Development Plan a) The Bridge City Rail Link (BCRL) In Durban City, a comprehensive development plan integrating industrial, commercial, and residential facilities, known as the Bridge City Development Plan, is currently under construction. Upon its completion, it will create new demand of 90,000 passengers a day for the urban railway. For this reason, an underground station (Bridge City Station) and a 3.2-km double-track extension to connect to the existing railway lines are being constructed in the Bridge City Development area. The investment amount for this railway infrastructure, which is slated for completion in FY 2013, will total 650 million ZAR. b) The Greenview Capacity Improvement Project The project currently under way in the Tshwane area is designed to meet the increasing demand for railway use. It includes the construction of a new station, renovation of two stations, new construction of road bridges, and doubling of 4.5-km tracks. At present, the double tracks of the railway line are constructed, and 60% of the project is completed (as of August 2012). The whole project is slated for completion in FY 2013. c) Station Improvement and Upgrade Program This plan will upgrade/renovate existing stations, construct new stations, and enhance connectivity with other transportation modes (bus and taxi). The investment amount is expected to be 1 billion ZAR. The project will target over 50 stations. It also plans to provide barrier-free access and commercial facilities to increase revenue income. d) Rehabilitation Plan for Tracks, Platforms, etc. In the next three years, 400 million ZAR will be invested in the rehabilitation of tracks, roadbeds, platforms, road bridges, and the removal of highly dangerous level crossings. e) Increasing the Speed of PRASA Long-distance Passenger Transport Lines Currently, it takes 26 hours to travel from Johannesburg to Cape Town. As a railway transport business, it is not viable. Therefore, to put together a strategy for long-distance passenger transport, PRASA is reviewing increasing the maximum speed in the following four sections to 160 km/h:
1) Johannesburg–Polokwane section 2) Johannesburg–Bloemfontein section 3) Bloemfontein–East London section 4) Johannesburg–Durban section
2) Challenges of Development Plan a) Harnessing New Technologies To modernize its infrastructure facilities, PRASA has put in place an investment plan of 15 billion ZAR for the next 3 years. This is an unprecedented large sum compared to the past investment amounts. The investment plan will include new technologies for increasing the speed of passenger transport lines and providing barrier-free access. For the modernization of infrastructure facilities, it is necessary to enhance the technological capabilities of engineers to harness new technologies and to cultivate new generations of engineers. b) Sharing Tracks with TRANSNET Intercity passenger transport is using the TRANSNET tracks. There are many challenges in achieving the high speed of 160 km/h. The current PRASA technologies are not compatible. Since TRANSNET can only transport freight at a maximum speed of 60–70 km/h, the

3-30
difference in speeds between the intercity passenger trains and freight trains is too big. Currently, PRASA and TRANSNET are conducting joint studies to make improvement. 3.4 Current State of Regulatory Systems and Challenges
(1) Different Regulatory Agencies for TRANSNET and PRASA
The agencies supervising TRANSNET and PRASA are different. TRANSNET, which provides freight transport, is under the jurisdiction of the Department of Public Enterprises (DPE). PRASA, which provides passenger transport, is under the jurisdiction of the Department of Transport (DOT). However, PRASA uses the tracks of TRANSNET for its intercity passenger transport. It operates on the same tracks as freight transport.
TRANSNET and PRASA are both making large-scale investment plans. However, it is not clear how the two entities are working and coordinating with each other with regard to their respective investment plans. Cooperation of both entities is indispensable in order to modernize the railways in South Africa smoothly without the need for rework in the future. In particular, if the tracks are used for both freight transport and intercity passenger transport, uniformity in signaling, traffic control, and other systems between the two entities is imperative. (2) Separating Freight and Passenger Transport
Rail freight is the main player of railway transport in South Africa. The 21,000-km railway network that spans the whole nation is owned by TRANSNET. For this reason, PRASA pays TRANSNET track usage charge in order to operate its intercity long distance passenger trains (Shosholoza Meyl) on TRANSNET tracks. This track usage charge includes the fees for borrowing locomotives and drivers.
NATMAP puts forth the policy to set up the Rail Infrastructure Agency (RIA), a new organization under the jurisdiction of DOT, and transfer the railway infrastructure currently owned by TRANSNET and PRASA to RIA to enable it to manage the railway infrastructure in an integrated manner. The establishment of RIA raises the possibility of a more effective and efficient relation between the freight and passenger transport in the future.
Even in the main sections, the freight trains limit their maximum speeds at about 60–70 km/h. Since the slow freight trains are in the way, it is difficult to increase the speed of passenger trains. This accounts for the railway’s drastic reduction in competitiveness against other transport modes.
On the other hand, the approximately 1,150-km networks for mainly commuter trains (Metrorail) in large city areas (Gauteng, Cape Town, Durban) are owned by PRASA. Freight trains rarely enter these sections. Figure 3-21 is an example of track ownership in Johannesburg and its vicinities.

3-31
Source: Procurement of New Rolling Stock Network Information and Infrastructure Interface, PRASA (2011)
Figure 3-21 Railway Network in Johannesburg and Its Vicinities
(3) BEE Measures
At present, a prerequisite for winning the contracts of public companies is a BEE Level of 4. In order to secure such BEE score, companies are taking various measures, such as by conducting training programs, using companies certified as local BEE, increasing the stock ownership of BEE companies, and so on. The BEE policy is extremely complicated and its contents change every year, making it very difficult for companies to cope with the requirements. In addition, BEE requirements are expected to continue to be stringent in the future.
It is the fact that BEE is the keynote of all policies in South Africa, including socio-economic policies, industrial policies, etc. It shall not be viewed simply as a hurdle but a clear manifestation of local need. For this reason, it is important to find trustworthy BEE partner companies and build cooperative relationships with them. In this sense, use of the Subcontracting and Partnership eXchange (SPX) administered by UNIDO in South Africa will be helpful. This program has created a database of over 1,000 South African companies (approximately 200 railway-related companies). It uses the database to do benchmarking and company matching2.
(4) Localization
The local contents requirement has direct impact on companies (known as Tier 1 companies) that participate in the public bidding of items specified by the Department of Trade and Industry (6 items as of October 2012, including railway rolling stock). However, the local contents of products that companies (Tier 2 companies) deliver to the Tier 1 companies will also be affected indirectly (see “2.2.2(4)3 Preferential Procurement”). The government is demanding higher local contents; however, increasing local contents will lead to higher production cost and other challenges.
2 http://www.unido.org/index.php?id=1000131

3-32
In the context of the BEE policy, local production, which includes technical transfer, is an extremely important principle. Therefore, it shall be pursued proactively. It is important to note that the South African railway industry not only has its eye on the domestic market but also on the Southern African Development Community (SADC)3. Therefore, it is necessary to look at the railway market in southern Africa with South Africa as its hub, and to review ways to form alliances with South African companies, treating local production as one of the options. (5) Education and Training System
People with engineering skills are in short supply. The basic education for engineering is insufficient and the educational level is not too high. The limited availability of textbooks, loss of good teachers to immigration overseas, and inadequate education and training facilities are said to be the reasons.
As mentioned earlier, the biggest concern of industrial development in South Africa is the availability of industrial personnel. In fact, in the case of a Japanese manufacturer that had received a TRANSNET order of locomotives and started local production, contrary to expectation, it found that the technical level of the local manufacturer is extremely low. It had to immediately dispatch as many as 20 technical personnel from Japan to South Africa and station them there to provide guidance. For example, they had to teach the local staff step by step, from basics such as how to pressure bond a wire connector, before they could overcome the hurdles4.
In this case, the remedial measure was taken after the bid, and in the previous phase, during the evaluation of the BEE score at the public bidding, the education and training level of the local manufacturer and the technical transfer had high scores. Therefore, from the viewpoint of facilitating the advance of Japanese companies in South Africa, it is worth considering ways to secure public support in this area rather than having certain private companies shouldering the burden on their own5.
Thus, rather than working on individual cases, it is advisable to provide assistance to the National Skills Development Framework (NSDF) in South Africa by, for example, dispatching a team of experts in training railway personnel to DOT so that they can provide guidance in the education and occupational training at universities, TRE, and PRASA.
(6) Labor Union
The labor unions in South Africa are very powerful. They sometimes make strong demands on companies. Thirty-one labor unions, formed based on the industry, are registered with the Department of Labor (as of February 2012). Three major labor union alliances, namely, the South African Trade Unions (COSATU, 2 million members), Federation of Unions of South Africa (FEDUSA, 520,000 members), and National Council of Trade Unions (NACTU, 400,000 members), each groups the labor unions by industry.
COSATU, the largest labor union alliance, is in a strategic political alliance (the so-called “Tri-partite Alliance”) with the African National Congress (ANC) and the South African Communist Party (SACP), making it part of the ruling coalition. In response, the NACTU joined forces with the radical Pan Africanist Congress (PAC). The FEDUSA has many white members but it does not ally with any particular political party.
Unions related to the railway industry include the South African Transport and Allied Workers Union (SATAWU) and National Union of Metalworkers of South Africa Metalworkers
3 Based on local interviews (DOT, manufacturers of electric equipment, and infrastructure consultants) 4 Based on local interviews (Japanese manufacturer in South Africa) 5 Same intent expressed in local interviews (Japanese company in South Africa)

3-33
(NUMSA) under COSATU; the Professional Transport & Allied Workers Union South Africa (PTAWU) and United Transport & Allied Trade Union - South African Railways and Harbours Union (UTATU-SARWHU) under FEDUSA; and Metal and Electrical Workers Union of South Africa (MEWUSA), Transport and Allied Workers Union (TAWU), and Transport and Omnibus workers Union (TOWU) under NACUTU. Among them, SATAWU and UTATU are the unions formed by TRANSNET employees. They are the two largest labor unions in the railway industry.
Typical demands made by the unions include a) wage increase, b) request for more education and training, and technical training, and c) opportunities for labor-management dialogue, etc6. Among them, a) and c) are common demands even in Japan. Demand b) “more education and training” is unique to South Africa.
It might be difficult for the Japanese to handle many issues in times of strike. It is desirable, therefore, to allocate local personnel well versed in various matters to local sites to handle the situation7. (7) Job Creation
Due to the high unemployment rate, the government places great emphasis on job creation. The intent of the BEE policy is to provide not just any job but decent work.
In this sense, the railway industry is by nature an industry that has a wide range of supporting industries. Its growth is likely to help create jobs. In reality, however, it is hard to say that the supporting industries of railway have fully been established. In the future, when the Presidential Infrastructure Coordinating Commission (PICC) starts to make adjustments and places orders for infrastructure in a strategic manner, it is likely to bring improvement to the supporting industries.
It has become obvious that the biggest obstacle to employment at this time is the labor force’s lack of skills. Even in the interviews that the Study Team conducted in South Africa, the Study Team seldom came across concerns about the capacity of facilities and equipment in meeting the projected demand for railway infrastructure; rather, there were concerns about the supply of labor with sufficient skills.
For this reason, it is extremely important to expand the education and training explained in (5) in order to create jobs. It is an urgent task.
6 Based on interviews with a Japanese manufacturer that has local operation 7 Based on interviews with a Japanese trading company that has local operation
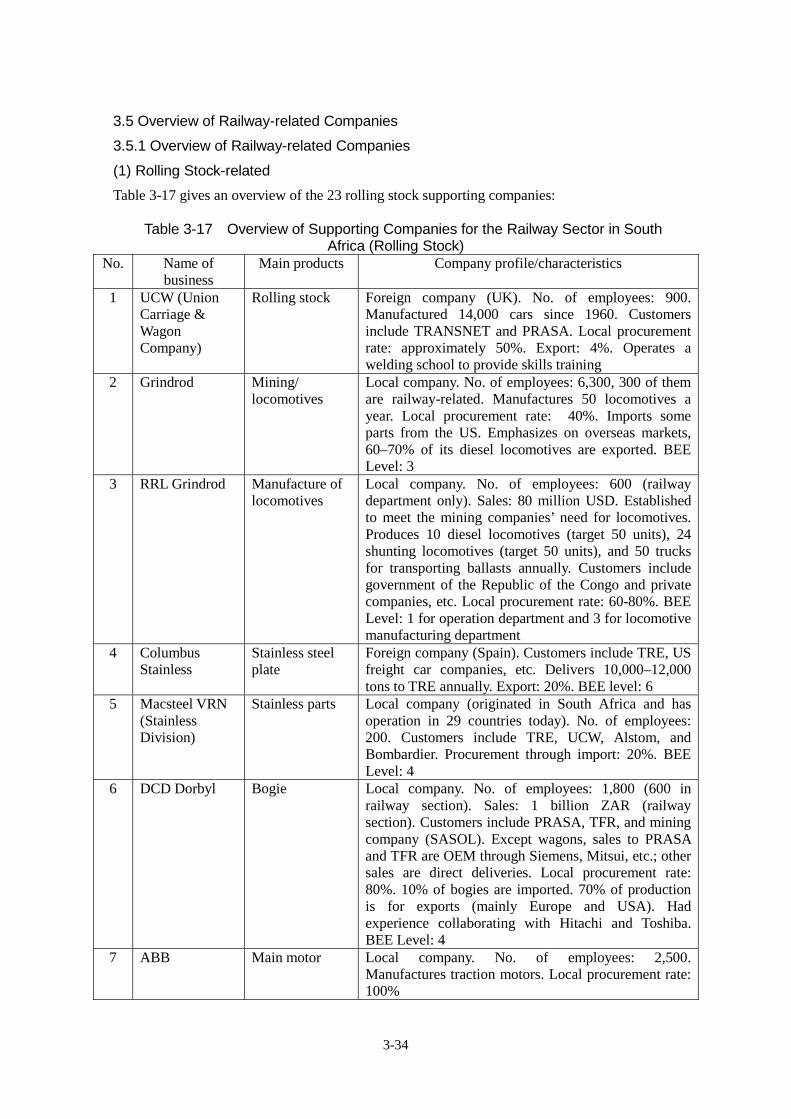
3-34
3.5 Overview of Railway-related Companies
3.5.1 Overview of Railway-related Companies
(1) Rolling Stock-related
Table 3-17 gives an overview of the 23 rolling stock supporting companies:
Table 3-17 Overview of Supporting Companies for the Railway Sector in South Africa (Rolling Stock)
No. Name of business
Main products Company profile/characteristics
1 UCW (Union Carriage & Wagon Company)
Rolling stock Foreign company (UK). No. of employees: 900. Manufactured 14,000 cars since 1960. Customers include TRANSNET and PRASA. Local procurement rate: approximately 50%. Export: 4%. Operates a welding school to provide skills training
2 Grindrod Mining/ locomotives
Local company. No. of employees: 6,300, 300 of them are railway-related. Manufactures 50 locomotives a year. Local procurement rate: 40%. Imports some parts from the US. Emphasizes on overseas markets, 60–70% of its diesel locomotives are exported. BEE Level: 3
3 RRL Grindrod Manufacture of locomotives
Local company. No. of employees: 600 (railway department only). Sales: 80 million USD. Established to meet the mining companies’ need for locomotives. Produces 10 diesel locomotives (target 50 units), 24 shunting locomotives (target 50 units), and 50 trucks for transporting ballasts annually. Customers include government of the Republic of the Congo and private companies, etc. Local procurement rate: 60-80%. BEE Level: 1 for operation department and 3 for locomotive manufacturing department
4 Columbus Stainless
Stainless steel plate
Foreign company (Spain). Customers include TRE, US freight car companies, etc. Delivers 10,000–12,000 tons to TRE annually. Export: 20%. BEE level: 6
5 Macsteel VRN (Stainless Division)
Stainless parts Local company (originated in South Africa and has operation in 29 countries today). No. of employees: 200. Customers include TRE, UCW, Alstom, and Bombardier. Procurement through import: 20%. BEE Level: 4
6 DCD Dorbyl Bogie Local company. No. of employees: 1,800 (600 in railway section). Sales: 1 billion ZAR (railway section). Customers include PRASA, TFR, and mining company (SASOL). Except wagons, sales to PRASA and TFR are OEM through Siemens, Mitsui, etc.; other sales are direct deliveries. Local procurement rate: 80%. 10% of bogies are imported. 70% of production is for exports (mainly Europe and USA). Had experience collaborating with Hitachi and Toshiba. BEE Level: 4
7 ABB Main motor Local company. No. of employees: 2,500. Manufactures traction motors. Local procurement rate: 100%

3-35
8 Mersen South Africa
Carbon brush Foreign company (France). No. of employees: 100. Sales: 100 million ZAR (railway section: 25 million ZAR). Main customers: TRANSNET (72%) and PRASA (28%). Local procurement rate: 60–65%. Other procurement mainly by importing from its group companies (mainly France). Has 40% share of the electric fuse market. BEE Level: 6. The demand for carbon brush may decline as PRASA converts the traction motors of its EMUs from DC to AC.
9 Timken South Africa (Pty) Ltd
Bearing Foreign company (USA). No. of employees: 200. Sales: 18 million USD. Has 100% of the bearing market share. Imports only from the US. Exports to overseas: 60–70%. Delivery to Toshiba in the past. An important manufacturing base in South Africa. BEE Level: 5
10 Rotacon Engineering
Gear case Local company. No. of employees: 84. Manufactures iron and aluminum products. Sales: 26 million ZAR. Customers include TRE (70%) and Toshiba (25%). 90–95% of the pinion gear case market share. Local procurement rate: 98%. BEE Level: 1
11 Donkin Fans Blower Local company. No. of employees: 140. Sales: 100 million ZAR. Customers: TRE, TFR, PRASA, GE, and UCW. Imports 100% of motors from overseas. Export: approximately 20%. BEE Level: 4. Collaborates with the TRE School of Engineering. Contacted by STADDLER (UK) for the bidding of PRASA project
12 Knorr-Bremse Brake Foreign company (Germany). Local procurement rate: 65%. Makes other procurements from its group companies in Germany, France, Hungary, USA, and Australia. Customers include UCW and Computer Transport Engineering (CTE). Exports also to Germany, Brazil, India, Australia, and USA. BEE Level: 3
13 Rollmech (Pty) Ltd.
Main controller Local company. No. of employees: 4. Main business: design of railway equipment and devices (master controller, master key system, etc.). Also procures component parts from overseas and contracts with local companies. Local procurement rate: 85–90%. Sales: 20 million ZAR
14 LH Marthinusen Coil, rectifier Local company. No. of employees: 500. Member of the Actom Group. Sales: 500 million ZAR (railway section 60 million ZAR). Main customer: PRASA. Only delivers component parts to TRANSNET. Local procurement rate: 70–80%. Mostly procures from companies in the same group. BEE Level: 3 (as Actom Group). Demand for the company’s contracted maintenance service may decline as PRASA converts the traction motors of its EMUs from DC to AC.
15 OTD (Overhead Track Developments)
Pantograph Local company. No. of employees: 25–30. Customers include PRASA and TRANSNET. Local procurement rate: 100%. Imports carbon strips and others through Siemens. BEE Level: 4

3-36
16 Siyahamba Engineering (Pty) Ltd
Car doors/ windows
Local company. No. of employees: 126. 80–90% of train door and window market in South Africa. Customers: PRASA (90%) and a small percentage (1%) exported to the USA and Taiwan through GE. BEE Level: 4. Contacted by Korea
17 Booyco Engineering
Air-conditioning Local company. No. of employees: 90. Sales: 72–-80 million ZAR. Manufactures HVAC system (cooling, heating, ventilation, and filtering system). Main customer: TFR. Other customers include PRASA, Bombardier, GE, EMD, Siemens, and Alstom. Local procurement rate: 75–85%. 80% share of the air-conditioning market in South Africa. BEE Level: 5
18 SME Air-conditioning Local company. No. of employees: 120. Sales: 70 million ZAR. Main customers: TRANSNET and PRASA (total 65%). Also delivers to Bombardier (15%), Kei Rail, and Grindrod. 50% share of the air-conditioning market in South Africa (Booyco has the remaining 50% share)
19 Inteletrack Train separation detection device
Local company. Sales: 10 million ZAR. Customer: TRANSNET. Exports train operation monitors to neighboring countries in Africa
20 Ansys Limited Train position tracking system
Foreign company (USA). No. of employees: 80. Sales: 100 million ZAR (70% railway). Main business: train position tracking system using Radio Frequency Identification (RFID). Main customer: TFR. Cooperated with GE in automating marshalling yards. Participated in Gautrain bidding as a GE subcontractor. BEE Level: 5
21 Waymark Infotech
Electronic manual system
Local company. No. of employees: 70. Sales: 250 million ZAR (80% TFR and 20% military). After delivering the Series 18E interactive electronic manual (IEM) to TFR (from 2004), it also delivered IEM to Series 19E (Coal Line) and Series 15E (Iron Ore Line). Local procurement rate: 100%. BEE Level: 4
22 Naledi Rail Engineering
Repair of rolling stock
Local company. No. of employees: 120. Repairs EMUs for passenger transport. The EMU repair market in South Africa is 400 cars annually. The four other companies in the industry include TRE, UCW, Commuter Transport Engineering (CTE), and WICTRA. Each has 20% market share. Customers include PRASA (90%) and TRANSNET (10%). One of its managers previously worked for Alstom and Bombardier. The company cooperated with a Swiss company when tendering bid for PRASA’s EMUs. BEE Level: 4
23 Surtees Investments (Pty) Ltd.
General supplier of component parts
Local company. No. of employees: 167. Sales: 275 million ZAR. Overseas procurement rate: 50%. Customers include TRE (80%) and mining companies, such as Anglo American. Export: 10% at present. BEE Level: 8
Source: Compiled by Study Team

3-37
(2) Signaling and Telecommunications
Table 3-18 gives an overview of the four signaling and telecommunications supporting companies.
Table 3-18 Overview of Supporting Companies for the Railway Sector in South
Africa (Signaling and Telecommunications) No. Name of business Main products Company profile/characteristics 1 Lebone
Engineering Signals Local company. Engineering for signals, other
track-related facilities, and electrification facilities 2 Siemens Signals Foreign company (Germany). No. of employees: 1,800
(railway-related: 180). Controls 8 facilities on the African continent. Procures the core signaling products from its group companies overseas since it is difficult to procure them locally. Customers include PRASA and TRANSNET. Does not export
3 Actom Electric equipment
Foreign company. Manufactures signals and other railway-related equipment. Manufactured rolling stock in South Africa in the past. Also manufactures non-vital components of switch machines and interlocking devices. No. of employees: 7,500. Sales: 7.5 billion ZAR. BEE Level: 3
4 Mehleketo Signals/ railway construction
No. of employees: 40 (signal department only). The only certified signal technology company in South Africa. Formed joint ventures with Siemens and Bombardier to tender bids. BEE Level: 3
Source: Compiled by Study Team
(3) Track
Table 3-19 gives an overview of the five track supporting companies.
Table 3-19 Overview of Supporting Companies for the Railway Sector in South Africa (Track)
No. Name of business Main products Company profile/characteristics 1 Tubular Track Track Local company. No. of employees: 110. Main product is
ballastless track, which has the merit of requiring almost no maintenance. Imports rails and turnouts from VAE (Austria) and rail pad from TIFEX (UK). Ballastless track is used at 18 Metrorail stations and will be used at 40 stations in the future. Desires to work with Japan. BEE Level: 2
2 Plasserail South Africa
Track maintenance
Foreign company (Australia). No. of employees: 360 (including 1,000 subcontractors). Sales: 320 million ZAR. Customers include TRANSNET (75%), PRASA (15%), and private mining companies (10%). Has 60% share of South Africa’s track maintenance market (Aveng Manufacturing Lenning Railway Service has the remaining 40% share). Imports 60% of the main components for track maintenance machines from Australia. BEE Level: 3
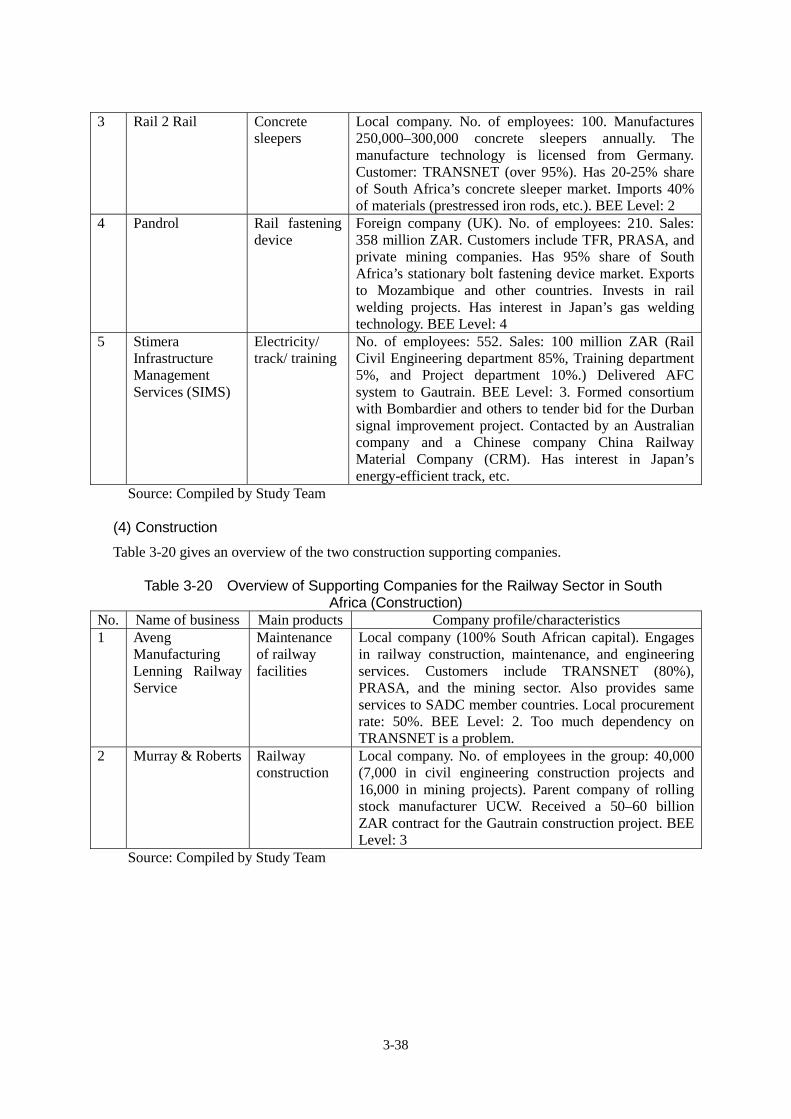
3-38
3 Rail 2 Rail Concrete sleepers
Local company. No. of employees: 100. Manufactures 250,000–300,000 concrete sleepers annually. The manufacture technology is licensed from Germany. Customer: TRANSNET (over 95%). Has 20-25% share of South Africa’s concrete sleeper market. Imports 40% of materials (prestressed iron rods, etc.). BEE Level: 2
4 Pandrol Rail fastening device
Foreign company (UK). No. of employees: 210. Sales: 358 million ZAR. Customers include TFR, PRASA, and private mining companies. Has 95% share of South Africa’s stationary bolt fastening device market. Exports to Mozambique and other countries. Invests in rail welding projects. Has interest in Japan’s gas welding technology. BEE Level: 4
5 Stimera Infrastructure Management Services (SIMS)
Electricity/ track/ training
No. of employees: 552. Sales: 100 million ZAR (Rail Civil Engineering department 85%, Training department 5%, and Project department 10%.) Delivered AFC system to Gautrain. BEE Level: 3. Formed consortium with Bombardier and others to tender bid for the Durban signal improvement project. Contacted by an Australian company and a Chinese company China Railway Material Company (CRM). Has interest in Japan’s energy-efficient track, etc.
Source: Compiled by Study Team
(4) Construction
Table 3-20 gives an overview of the two construction supporting companies.
Table 3-20 Overview of Supporting Companies for the Railway Sector in South Africa (Construction)
No. Name of business Main products Company profile/characteristics 1 Aveng
Manufacturing Lenning Railway Service
Maintenance of railway facilities
Local company (100% South African capital). Engages in railway construction, maintenance, and engineering services. Customers include TRANSNET (80%), PRASA, and the mining sector. Also provides same services to SADC member countries. Local procurement rate: 50%. BEE Level: 2. Too much dependency on TRANSNET is a problem.
2 Murray & Roberts Railway construction
Local company. No. of employees in the group: 40,000 (7,000 in civil engineering construction projects and 16,000 in mining projects). Parent company of rolling stock manufacturer UCW. Received a 50–60 billion ZAR contract for the Gautrain construction project. BEE Level: 3
Source: Compiled by Study Team

3-39
(5) Consultants
Table 3-21 gives an overview of the six supporting companies providing consulting services, including the railway field:
Table 3-21 Overview of Supporting Companies for the Railway Sector in South
Africa (Consultants) No. Name of business Main
products Company profile/characteristics
1 Lehaha Construction
Consultant for railway construction
Local company. No. of employees: 12. No experience in South Africa’s railway projects. Currently conducting feasibility studies for railway projects in Zambia and Uganda. BEE Level: 3
2 Aurecon Infrastructure consultant
Foreign company (headquartered in Singapore, other locations in Australia and South Africa). No. of employees: 1,800, deployed in 25 countries worldwide. Customers include PRASA and TRANSNET. Conducted studies for five provinces during the formulation of NATMAP. BEE Level: 2
3 Jeffares and Green
Engineering Local company. No. of employees: 300 (11 in railway department). Main businesses: railway planning, design, maintenance management, etc. Customers include TFR and PRASA. Supports TRANSNET’s 7-year plan. BEE Level: 4
4 Arcus gibb Engineering Local company. No. of employees: 650 (50-60 in railway department). Conducted studies for the PRASA modernization plan, etc. BEE Level: 2
5 Hatch Consultant Foreign company (Canada). No. of employees: 50 (railway field). Design of construction projects for mining, energy, ports, etc. Provides services to 60 countries.
6 Mott MacDonald Consultant Foreign company. Customers include TRANSNET, PRASA, and private mining companies. The private mining companies are the largest customers. Engaged in the design, construction, and upgrade of the Coal Line for TRANSNET. Currently working on a Mozambique railway project. BEE Level: 3
Source: Compiled by Study Team
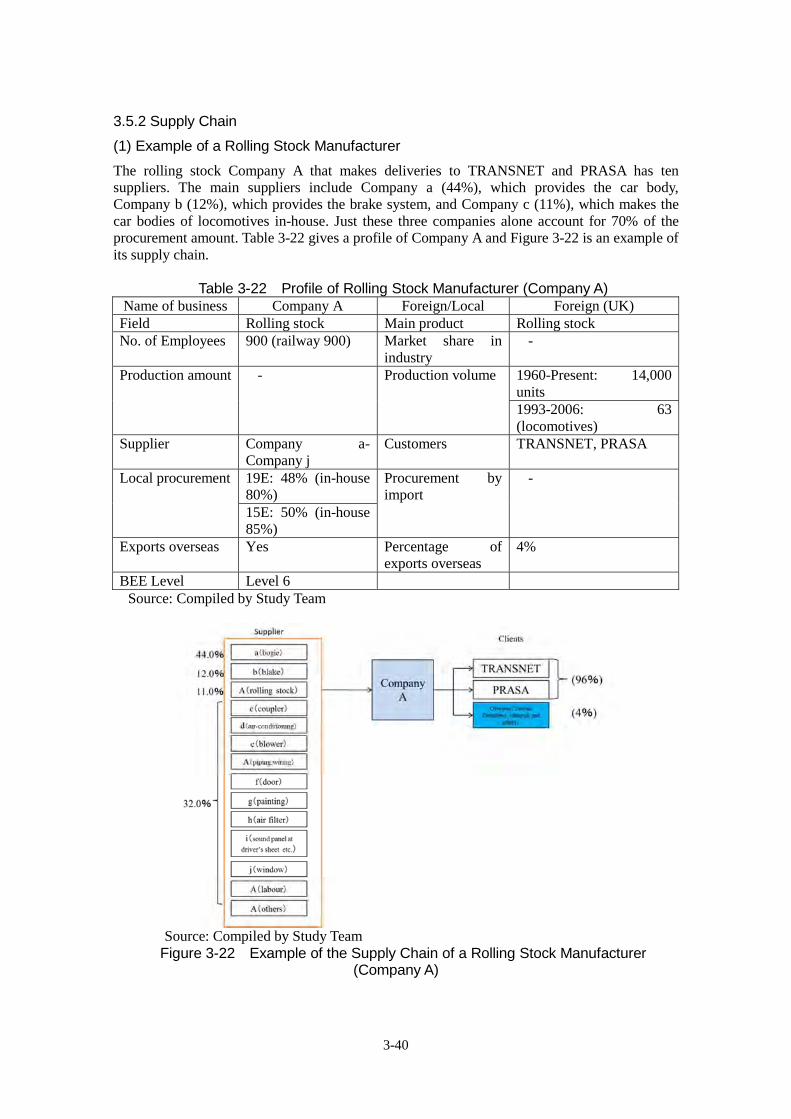
3-40
3.5.2 Supply Chain
(1) Example of a Rolling Stock Manufacturer
The rolling stock Company A that makes deliveries to TRANSNET and PRASA has ten suppliers. The main suppliers include Company a (44%), which provides the car body, Company b (12%), which provides the brake system, and Company c (11%), which makes the car bodies of locomotives in-house. Just these three companies alone account for 70% of the procurement amount. Table 3-22 gives a profile of Company A and Figure 3-22 is an example of its supply chain.
Table 3-22 Profile of Rolling Stock Manufacturer (Company A)
Name of business Company A Foreign/Local Foreign (UK) Field Rolling stock Main product Rolling stock No. of Employees 900 (railway 900) Market share in
industry -
Production amount - Production volume 1960-Present: 14,000 units 1993-2006: 63 (locomotives)
Supplier Company a- Company j
Customers TRANSNET, PRASA
Local procurement 19E: 48% (in-house 80%)
Procurement by import
-
15E: 50% (in-house 85%)
Exports overseas Yes Percentage of exports overseas
4%
BEE Level Level 6 Source: Compiled by Study Team
Source: Compiled by Study Team
Figure 3-22 Example of the Supply Chain of a Rolling Stock Manufacturer (Company A)

3-41
(2) Example of an Electric Product Manufacturer
Company B is an electric product manufacturer that delivers mainly electric carbon brushes and carbon brush holders to TRANSNET and PRASA. Most of its suppliers are companies in the same group. It procures 50% of the total amount from affiliated companies in Europe and the USA, 20% from affiliated companies in Brazil, and 30% from a South African company. Table 3-23 gives a profile of Company B and Figure 3-23 is an example of its supply chain.
Table 3-23 Profile of Electric Product Manufacturer (Company B)
Name of business Company B Foreign/Local Foreign (France)Field Rolling stock Main product Carbon brush No. of Employees 100 Market share in industry 50% Production amount
25 million ZAR Production volume
Supplier Companies in the same group
Customers PRASA, TRANSNET
Local procurement
60-65% Procurement by import 35-40%
Exports overseas Yes (Australia) Percentage of exports overseas
-
BEE Level Level 6 Source: Compiled by Study Team
Source: Compiled by Study Team
Figure 3-23 Example of the Supply Chain of an Electric Product Manufacturer (Company B)

3-42
(3) Example of a Coil and Rectifier Manufacturer
Company C, which delivers mainly coils and rectifiers to the rolling stock of TRANSNET and PRASA, uses mostly local suppliers. Its percentage of local contents is 70–80%. Table 3-24 gives the profile of Company C and Figure 3-24 is an example of its supply chain.
Table 3-24 Profile of Coil and Rectifier Manufacturer (Company C)
Name of business Company C Foreign/Local Foreign Field Rolling stock Main product Coil, rectifier No. of Employees 500 Market share in industry - Production amount 500 million ZAR (railway 60
million) Production volume
Supplier Mainly companies in the same group
Customers PRASA
Local procurement 70-80% Procurement by import - Exports overseas Percentage of exports
overseas
BEE Level Level 3 Source: Compiled by Study Team
Source: Compiled by Study Team
Figure 3-24 Example of the Supply Chain of a Coil and Rectifier Manufacturer (Company C)

Chapter 4
State of Technology
and Challenges of Railway Sector


4-1
Chapter 4 State of Technology and Challenges of Railway Sector
4.1 State of Technology and challenges of Railway-related Fields
In this study, the Study Team conducted field surveys and interviews of railway companies, administrative entities, and related organizations regarding the state of technology and issues of various fields related to railway. The following are the results and challenges for the future. 4.1.1 Rolling Stock
This section will mainly cover the specifications of rolling stock and maintenance. The making of new rolling stock will be covered in “4.3 State of Related Private Sectors, Supporting Industries, and Issues.” (1) Current Status
1) Characteristics of Rolling Stock In South Africa, railways are electrified using 3kV DC, 25 kV AC, and 50 kV AC. Suburban lines near big cities use DC as they were electrified at a relatively early period. The rural lines mainly use AC. The Iron Ore Line (Sishen–Saldanha section) uses 50 kV AC electrification, which is quite rare in the world. For this reason, various types and models of rolling stock are in use, including electric locomotives that can be used for various electrification methods and non-electrified sections, diesel electric locomotives, diesel locomotives, and electric multiple units (EMUs). DC motor is used mainly for the traction motor of locomotives and the motor cars of EMU; however, AC induction motor, which is the world standard today, is used for Series 19E and 15E electric locomotives.
Both the freight trains and passenger trains of the South African National Railway use vacuum brake as the main braking system. It is an extremely old system, which was abolished and replaced by the existing automatic brake in Japan eighty years ago. In principle, since it is difficult to have strong braking power and high-speed brake response, the braking system has to be big in size, which is a drawback. Incidentally, even in the United Kingdom, the former colonial power, vacuum brake was widely used up to the 1970s.
However, automatic brake has been adopted by the long freight trains operating on the Iron Ore Line and Coal Line. Furthermore, improvement is being made to commuter trains. Automatic brakes are installed during their large-scale refurbishment (Upgrade, explained later).
On the other hand, the South African railway is known worldwide for its technology to use rolling stock with heavy axle load in long trains for mass transportation.
As an example, the Iron Ore Line opened for service in 1976 has a maximum permissible axle load of 30 tons, which is one of the highest in the world. Locomotives coupled in 3–4 units are allocated at multiple positions throughout the trainset. Except for the first locomotive, no drivers are onboard the other locomotives. Their operation is by multiple unit control, in which the driver in the first car operates the other locomotive units using a wireless remote control system.
Figure 4-1 shows the configuration of a freight train on the Iron Ore Line.
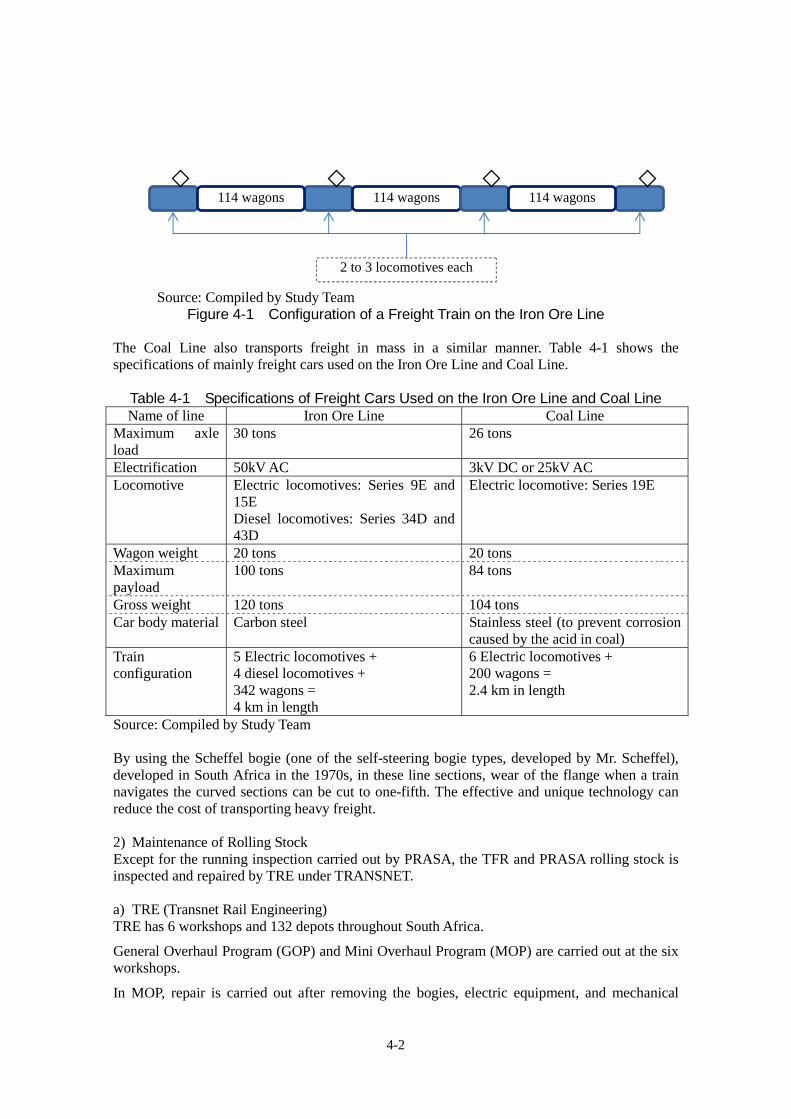
4-2
Source: Compiled by Study Team
Figure 4-1 Configuration of a Freight Train on the Iron Ore Line The Coal Line also transports freight in mass in a similar manner. Table 4-1 shows the specifications of mainly freight cars used on the Iron Ore Line and Coal Line.
Table 4-1 Specifications of Freight Cars Used on the Iron Ore Line and Coal Line Name of line Iron Ore Line Coal Line
Maximum axle load
30 tons 26 tons
Electrification 50kV AC 3kV DC or 25kV AC Locomotive Electric locomotives: Series 9E and
15E Diesel locomotives: Series 34D and 43D
Electric locomotive: Series 19E
Wagon weight 20 tons 20 tons Maximum payload
100 tons 84 tons
Gross weight 120 tons 104 tons Car body material Carbon steel Stainless steel (to prevent corrosion
caused by the acid in coal) Train configuration
5 Electric locomotives + 4 diesel locomotives + 342 wagons = 4 km in length
6 Electric locomotives + 200 wagons = 2.4 km in length
Source: Compiled by Study Team By using the Scheffel bogie (one of the self-steering bogie types, developed by Mr. Scheffel), developed in South Africa in the 1970s, in these line sections, wear of the flange when a train navigates the curved sections can be cut to one-fifth. The effective and unique technology can reduce the cost of transporting heavy freight.
2) Maintenance of Rolling Stock Except for the running inspection carried out by PRASA, the TFR and PRASA rolling stock is inspected and repaired by TRE under TRANSNET.
a) TRE (Transnet Rail Engineering) TRE has 6 workshops and 132 depots throughout South Africa.
General Overhaul Program (GOP) and Mini Overhaul Program (MOP) are carried out at the six workshops.
In MOP, repair is carried out after removing the bogies, electric equipment, and mechanical
114 wagons 114 wagons 114 wagons
2 to 3 locomotives each

4-3
parts and dissembling the whole car. GOP is also a dismantling inspection. It is of a larger scale that involves replacement and upgrade of parts.
The frequency and implementation are different depending on the car type. The typical overhaul periods are as follows:
[Electric locomotives] - GOP:12 year-cycle, takes approximately two months to overhaul - MOP:6 year-cycle (3 years for Series 19E and 15E), takes approximately one month to
overhaul [EMU] - GOP: Implement according to rolling stock condition (known as Condition Based
Maintenance: CDM) - Light Repair:Repair of the traction motor and some equipment units An even larger scale of overhaul is called upgrade. Such large-scale refurbishment will reuse the under-frame and bogie but replace the whole car body and equipment with new ones to improve their performance. The upgrade from vacuum brake to automatic brake will also be carried out at this time.
As an example, when an EMU is being upgraded, the old car body will be dismantled and removed from the under-frame. Car body panels made of carbon steel sheets will be bolted together at several locations. The roof material will be attached to assemble a new car body. It is a simple method without using welding; however, the side sheathing of the car body cannot support heavy weight, making it imperative to have a heavy and strong under-frame. This is an old method. Figure 4-2 is an example that shows the assembly of the car body. Furthermore, upgrade includes replacement with an electric air compressor, making the main control circuit contactless, and changing the vacuum brake to automatic brake.
Source: Photo taken by Study Team
Figure 4-2 Assembly of EMU Car Body during Upgrade Table 4-2 shows the inspection periods of locomotives. However, the periods are slightly different depending on the use conditions and car type.

4-4
Table 4-2 Types of Inspection for Electric Locomotives Type of inspection Cycle Contents Time required
A-Shed 1 month Appearance inspection of car body Appearance inspection of equipment Cleaning
4 hours
B-Shed 6 months Inspection items of A-Shed: Inspect condition of high voltage and wire connection Inspect oil
1 day
C-Shed 1 year Inspection items of B-Shed: Change oil Calibration Calibrate meters Adjust brakes
2 days
D-Shed or MOP(Mini Overhaul Program)
6 years (3 years for Series 19E and 15E )
Overhaul by removing the electric equipment and mechanical equipment (including bogie) from the car body
1 month
D-Shed or GOP (General Overhaul Program)
12 years Overhaul by removing the electric equipment and mechanical equipment (including bogie) from the car body Refurbishment Repainting of car body, etc.
2 months
(Note)”Shed” is used here as a type of inspection. Source: Compiled by Study Team
b) PRASA PRASA carries out running inspection of its commuter trains, that is, inspection of train cars in between their deployment for commercial operation at its own car depots. Table 4-3 shows the inspection periods.
Table 4-3 Inspection Items of Commuter Trains (Running Inspection) Inspection item Period Inspection contents Duration
PSC (Passenger Service Comfort)
14 days Oil, pantograph, seats 1.5–2 hours
Intermediate Shedding 28 days Carbon brush of traction motor, motor generator, motor driven blower
3–6 hours
Full Shed 48–56 days Rotating machines in general Braking equipment-related
6–9 hours
Source: Compiled by Study Team
(2) Issues
Similar to other areas, investment in railway rolling stock has been extremely limited for over twenty years in South Africa. As a result, the trains are outdated.
As shown in Figure 4-3, the average age of the EMU used for the PRASA commuter trains is 37–38 years. Most of the trains are over 26 years old. As the trains age, the frequency of malfunctions rises. It becomes more difficult to obtain parts for replacement. According to the interviews that the Study Team conducted at car depots, malfunctions mostly occur in electrical wiring, traction motor, and other rotating equipment. The reason is degradation caused by aging. As an example, since malfunctions occur frequently before the regular inspection period in Cape Town, the ratio of condition-based maintenance vs. regular inspection is extremely high, as much as 3: 1.

4-5
Source: PRASA Rolling Stock Fleet Renewal Programme, PRASA (2011)
Figure 4-3 Age Distribution of Commuter Trains Owned by PRASA
1) Difficulty in Obtaining Component Parts Even when it is necessary to replace certain component parts during inspection, many of the electrical component parts are not manufactured in South Africa. It takes time for the imported parts to clear customs. Some of them may take up to several months to obtain. As time passes, some component parts may no longer be produced by the manufacturers. Thus, in order to ensure the operating condition of rolling stock, the railway operator has to stop using some train cars and remove their parts for use in other cars.
Some imported parts may also have problems. Originally, TRF uses traction motors manufactured by Siemens for its electric locomotives; however, it has purchased the less expensive traction motors from China for replacement. Since there are weaknesses in the structure, flashover occurs easily. 2) Decline in the Technical Level of Workers and Interruption in Technologies Decline in the technical level of workers is a serious problem. Even basic tasks are prone to errors. For example, mistake in the installation of carbon brush in the traction motor of a locomotive may cause the train to break down.
Therefore, TRE established the School of Engineering (SOE) in main car depots to provide technical education to high school graduates based on department needs before the graduates are hired for the positions. PRASA also established educational facilities called Training Academy to enhance the skill level. However, due to the low wages compared to working in mines, all workplaces in the railway are having difficulty maintaining the skill level as even the skilled workers leave for other jobs.
On the other hand, the veteran engineers and skilled workers are entering retirement one after another. The shortage of successors raised concerns about the interruption of technology. It is necessary to provide basic education to new employees as well as strengthen the training of mid-level employees. 3) Frequent and Serious Failures of Rolling Stock Although each workplace collects data on the malfunctions of each train car, the data have not been used effectively for analyzing the trend of failures as a whole and preventing the recurrence of malfunctions.

4-6
Table 4-4 shows train failures that resulted in serious accidents.
Table 4-4 Train Failures Causing Serious Accidents (TFR, April–June 2012) Cause
Type of accident
Damaged axle
Brake failure Coupler failure
Wear of wheel flange
Fire of high-voltage equipment
Train collision
- - - - -
Train derailment
3 3 2 1 -
Source: Fourth quarter report submitted by TFR to RSR
Table 4-4 shows that train derailments occurred frequently because of train failures. In particular, damaged axles and wear of wheel flange are not failures that occur suddenly. There should have been some symptoms or changes in dimensions/shapes beforehand. It is possible that there is quality issue in some of the component parts or problem in maintenance technology, making it not possible to detect defects during regular inspection.
As explained above in 1) to 3), the frequent failures caused by aging rolling stock, decline in work skills, and lack of capability to analyze data on train failures are some of the issues of rolling stock. Among them, the issue of aging rolling stock will be resolved by the planned procurement of large number of trains in the future. The use of AC electric motors and electronic control circuit in the new-type trains is expected to reduce the high-maintenance parts.
On the other hand, the new trains will no longer have some mechanical parts, especially the control circuitry. Since it is difficult to understand the operation through instinct, it makes it increasingly necessary to understand their mechanism correctly. At the same time, movable parts that are important to safety, such as wheels, axles, and brakes, will remain. Even though the new model rolling stock is said to require less maintenance, without correct understanding of the new technologies and enhanced ability for analyzing malfunctions, the newly introduced trains will be compromised by improper maintenance, making it difficult to provide safe and reliable services. Therefore, the importance of education and training will not change in the least. 4.1.2 Current State of Signaling Technology and Issues
(1) Current State
The signal sections account for 50% of the South Africa railway network (22,000 km). Most of them use color light signals, approximately 25% of them are mechanical signals. For the color light sections, 6,200 km have CTC control and 600 km have station control.
As shown in Figure 4-4, many different types of block systems are in use. Besides the automatic block system, the radio type, telegraph type, token type, and other block systems are being used.

4-7
Source: TRANSNET material
Figure 4-4 Block Systems
Table 4-5 shows the differences and characteristics of signaling systems in major line sections.
The TRANSNET Coal Line uses the 3-aspect color signal system. Under this system, many crossovers had to be constructed on station premises and between stations to facilitate single-track parallel operation. The inefficiency of such operation became known in the past. By the way, there is a historical reason for the unique multi-aspect signal system in South Africa as it was installed to eliminate inefficiency by using speed control at locations with turnouts.
The Metrorail lines of PRASA and the general freight lines of TRANSNET (sections besides the Coal Line and Iron Ore Line) have the same signal system. However, since the braking distances of the two types of trains are different, their buffer distances for preventing overrun are also different. Metrorail added flickering function to the yellow and red aspects and increased the number of indicators.
The multi-aspect signal system and the flickering aspect in Metrorail line sections are signaling systems unique to South Africa; they are different from the Japanese system.

4-8
Table 4-5 Characteristics of Signaling Systems in Major Sections
Section Characteristics Remarks TRANSNET (Coal Line)
- 3-aspect color signal system (G-Y-R) - Multi-aspect color signal system (G-R-Y-Y)
(Figure 4-5) - Turnout on the mainline 1/20 [speed limit 75
km/h] (G-Y aspect) - Turnout on the mainline 1/12 [speed limit 30
km/h] (Y-Y aspect) - Gradient 1/160 (1 m difference in height for
horizontal distance of 160 m)
Source: Photo taken by StudyTeam
Figure 4-5 Multi-aspect Signal System
- Drawback of 3 aspect color signal system:
Cannot distinguish the inward of a Y aspect whether it is an R aspect or a Y aspect
- Inefficiency in operation:Crossover between the up line and down line
- Difficult to secure braking distance:
W-Y aspect/Y aspect/R aspect (W: white light)
TRANSNET (Iron Ore Line)
- Single track - 3-aspect color signal system - Turnout on the mainline 1/12 [speed limit 30
km/h] - Has passing side line [90-km interval:
Length 4 km]
- Mainline indication of station yard signals:
W-G aspect and W-Y aspect
- Branch siding indication: Y-W(L)/Y-W(R) aspect
TRANSNET (General
Freight Lines)
- 3-aspect color signal system - Multi-aspect color signal system:
R-B aspect (Emergency Aspect) (B: Blue light) Install Shunting signal / Route indicator
- Install overlap section (over 275 m) or safety siding
- Share with passenger trains
- Also use mechanical signal system

4-9
PRASA (Metrorail
Lines)
- 3-aspect color signal system - Multi-aspect color signal system (Figure
4-6): R-B aspect(Emergency Aspect) Y-flash aspect, R-flash aspect Install Shunting signal / Route indicator
- Install overlap section (over 110 m) or safety siding
Source: Photo taken by Study Team
Figure 4-6 Multi-aspect Color Signal System
- Indication similar to the one used in general freight line sections
- Shorten overlap sections to improve headway
- Y-flash aspect: Indicate the existence of a turnout inward of the G aspect
- R-flash aspect: Release emergency aspect
GAUTRAIN
- Cab signal with wayside signal - Automatic Train Protection (ATP)
- Use standard gauge - With train protection
function (Note) Emergency aspect: Despite the red aspect, if the blue aspect lights up, the train can
proceed gradually after confirming with the dispatcher. There is a function to notify the driver in advance by turning the red aspect on and off when releasing the emergency aspect.
Source: Study Team/ Railway Signaling & Telecommunications in South Africa 1998 IRSE
The major railway operators in South Africa are TRANSNET, PRASA, and GAUTRAIN. Although the environment faced by each operator and the history of their establishment are different, the Study Team will look at PRASA at this time since it faces issues that are also common to the other operators.
1) Aging To show the actual condition of how much signaling facilities have aged, the Study Team used the interlocking devices (total 162 sets) for ensuring the safety of trains operating in the Metrorail sections in four areas (Southern Gauteng/ Northern Gauteng/ Western Cape/ Durban) operated by PRASA as an example.
Figure 4-7 shows the average ages of various interlocking devices by type from their installation until the present time.
As of 2012, the average operation year of the mechanical interlocking device, which accounts for 38% of all interlocking devices, is 46 years. The average operation year of the hybrid relay interlocking device, which accounts for 47% of all interlocking devices, is 30 years.
In order words, 85% of the interlocking devices are old and are operating under a condition that
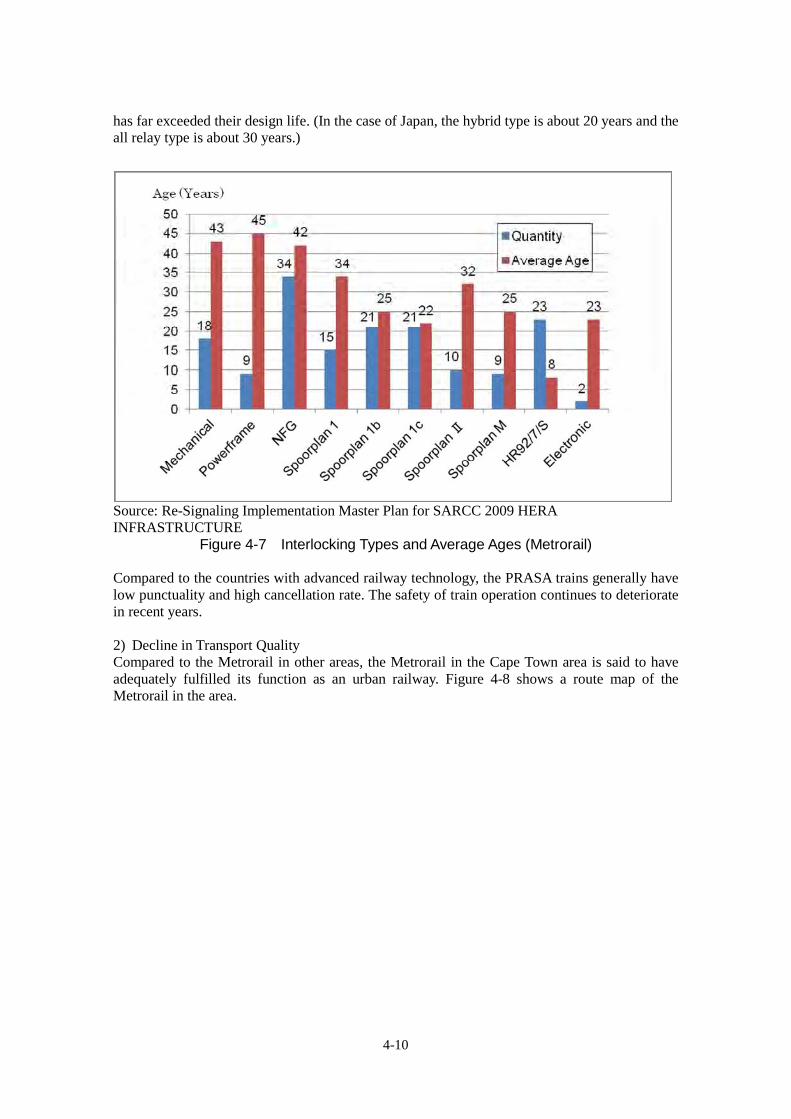
4-10
has far exceeded their design life. (In the case of Japan, the hybrid type is about 20 years and the all relay type is about 30 years.)
Source: Re-Signaling Implementation Master Plan for SARCC 2009 HERA INFRASTRUCTURE
Figure 4-7 Interlocking Types and Average Ages (Metrorail)
Compared to the countries with advanced railway technology, the PRASA trains generally have low punctuality and high cancellation rate. The safety of train operation continues to deteriorate in recent years. 2) Decline in Transport Quality Compared to the Metrorail in other areas, the Metrorail in the Cape Town area is said to have adequately fulfilled its function as an urban railway. Figure 4-8 shows a route map of the Metrorail in the area.
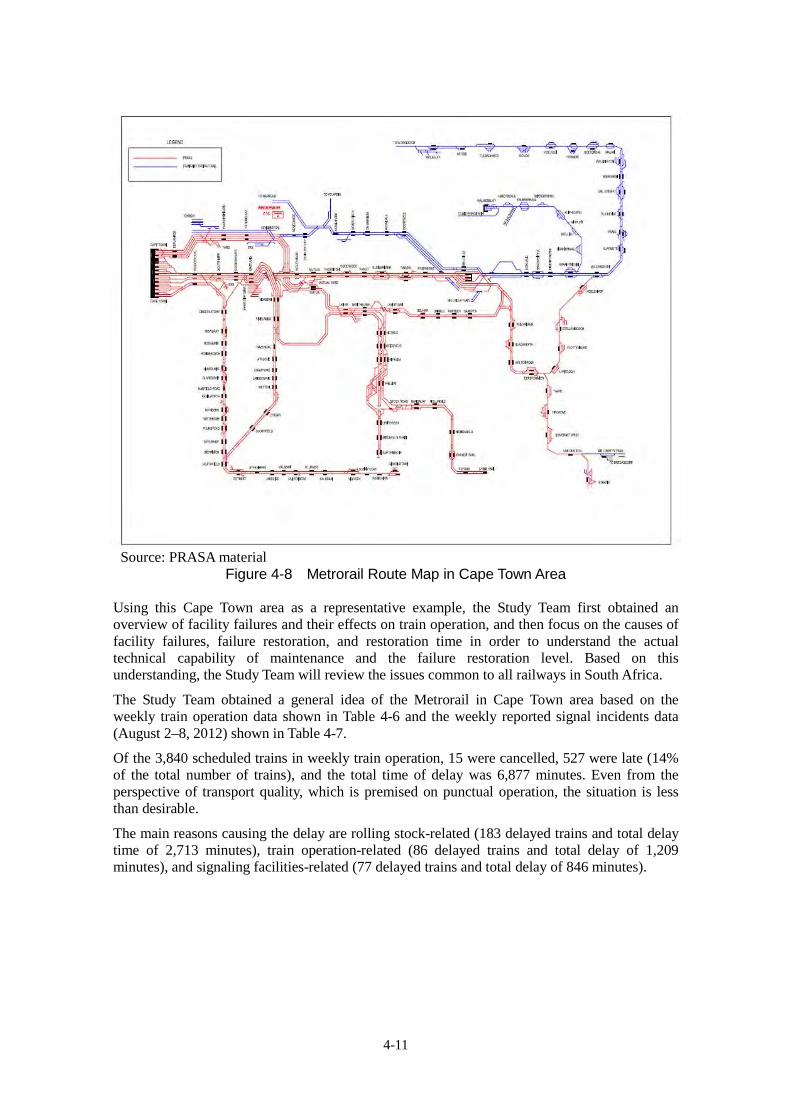
4-11
Source: PRASA material
Figure 4-8 Metrorail Route Map in Cape Town Area Using this Cape Town area as a representative example, the Study Team first obtained an overview of facility failures and their effects on train operation, and then focus on the causes of facility failures, failure restoration, and restoration time in order to understand the actual technical capability of maintenance and the failure restoration level. Based on this understanding, the Study Team will review the issues common to all railways in South Africa.
The Study Team obtained a general idea of the Metrorail in Cape Town area based on the weekly train operation data shown in Table 4-6 and the weekly reported signal incidents data (August 2–8, 2012) shown in Table 4-7.
Of the 3,840 scheduled trains in weekly train operation, 15 were cancelled, 527 were late (14% of the total number of trains), and the total time of delay was 6,877 minutes. Even from the perspective of transport quality, which is premised on punctual operation, the situation is less than desirable.
The main reasons causing the delay are rolling stock-related (183 delayed trains and total delay time of 2,713 minutes), train operation-related (86 delayed trains and total delay of 1,209 minutes), and signaling facilities-related (77 delayed trains and total delay of 846 minutes).

4-12
Table 4-6 Weekly Train Operation Data
Source: Metrorail Cape Town material

4-13
Table 4-7 Weekly Reported Signal Incidents Data
Source: Metrorail Cape Town material

4-14
Including the main section and three branch sections, the signaling depot has 96 members. They are responsible for the maintenance of signaling facilities (43 interlocking stations) in sections of approximately 250 km (including mechanical signal sections of 35 km).
3) Number of Incidents and Main Causes Table 4-8 classifies the incidents of signaling facilities (56 incidents) by cause.
Table 4-8 Number of Incidents and Main Causes
Item Incident Cause Signal 7 Burnt out light bulb, fuse blowout, no oil in machine,
transformer malfunction, etc. Switch
13 Bad contact, locking failure, switch failure
Track circuit 10 Cable erosion/loose connection, fuse blowout, wear and tear of relay points
Interlocking device
23 Bad route setting, fuse blowout
Grade crossing, etc.
3 Gate barrier malfunction
Source: Compiled by Study Team
It is true that the facilities are old judging from the failure contents of the signal, switch, track circuit, and grade crossing but most of the failures were due to insufficient maintenance. Essentially, the defective items should have been identified during regular inspection. They should have been probably adjusted, repaired, and replaced. In reality, however, these defects might have been discovered for the first time after the incidents occurred. It is difficult to explain, given the maintenance staff system mentioned above, why regular inspection has not been carried out properly to deal with these rampant failures when the regular maintenance plan is being implemented.
On the other hand, failures in interlocking devices are probably caused by the old equipment, based on the phenomena.
In addition, there are many squatter areas along the tracks. Thirty-two incidents of damaged signal boxes and grade crossing gates, and theft of signal cables occurred, which affected train operation considerably. Figure 4-9 shows one measure to prevent theft.
Source: Photo taken by Study Team
Figure 4-9 Theft Prevention Measure
4) Delay in Restoration from Failures Next, by understanding the actual condition of restoration from failures, the Study Team determines the technical capability of the maintenance organization and the system for failure

4-15
response. The failure restoration time is the total of the time required to reach the site where the failure occurs and the time to repair and restore. In particular, if the Study Team only looks at the failures of switches and track circuits, which greatly affect train operation, the Study Team sees the following situation:
Among the incidents of switch failure, the maximum restoration time for repair works, such as adjustment and replacement of parts, is 113 minutes (repair 100 minutes) and the average time is 75 minutes (repair 40 minutes). The maximum restoration time for track circuit is 292 minutes (repair 255 minutes) and the average restoration time is 96 minutes (repair 66 minutes).
Since restoration from failures is taking long time, it is difficult to say that maintenance skills have been mastered through the daily maintenance works. (2) Challenges
1) Present Challenges The technical challenge for the moment is to step up education and training with the objective to master the skills necessary for carrying out total function inspection, individual check, adjustment, and repair of switches and track circuits in the maintenance of machinery and equipment at the existing work sites.
Furthermore, it is advisable to upgrade immediately the interlocking devices, which are the core element for ensuring safe train operation. However, due to the rampant occurrence of failures caused by old equipment, it is desirable to provide re-education and on-site training of interlocking function inspection to enable diagnosis of the causes of failures and their respective treatments.
2) Future Challenges There was a long time since 1990 that no large-scale facility investment was made and technical transfer was lagging. Under such circumstances, it is necessary to quickly educate and train personnel to take charge of the modernization of the signaling and telecommunications facilities and the maintenance afterwards. Domestic education and training programs as well as education and training programs with overseas assistance shall be utilized to implement the projects for the modernization of facilities that have been gathering momentum since FY 2012. To train all personnel, it is necessary to implement an education and training program to train the leader class and then have the trained leaders to provide education and practical skills training to workplace staff at education and training centers. To enable the staff to master the new technologies and the maintenance skills required for maintaining the facilities through practical skills training is an urgent and important task.
4.1.3 Electric Power
(1) Current State
1) Feeding Methods South Africa uses three types of feeding methods for its electrified lines. Most of the feeding sections use the 3kV DC feeding system, totaling approximately 5,700 km in length. In addition, approximately 2,500 km of feeding sections use the 25kV 50Hz AC feeding method and 861 km of feeding sections use the 50kV 50Hz AC feeding method, which is rare in the world. Figure 4-10 is a map of the feeding systems. Only the Iron Ore Line has 50kV AC sections, spanning the distance from Sishen in the inland to Saldanha. The 3kV DC feeding system is mainly used by the PRASA Metrorail in the suburbia of big cities. The 25kV feeding system is used by the Coal Line and the long-distance sections between cities. Shosholoza Meyl goes through the 3kV DC and 25kV AC feeding systems when operating in the Johannesburg–Cape Town section.

4-16
Source: TRANSNET material
Figure 4-10 Map of Feeding Systems The electrification of South African railways started in 1926 with 3kV DC. Direct current electrification was the norm until the switch to alternate current in the 1970s. The current electrification systems were established by the 1980s. The DC substations, AC substations, and overhead contact lines are all facilities that have been used for over forty years since installation.
Table 4-9 gives a summary of the three types of feeding systems. The 3kV DC feeding system is a standard feeding system used by various countries in the world. Compared to the 1.5kV DC feeding system in Japan, the 3kV DC feeding system has many merits, such as little electricity loss, long interval between substations, and so on.
The 25kV AC is also a standard feeding system used by many countries in the world. It is used for the Shinkansen high speed lines in Japan.
The 50kV AC feeding system is a system with few parallels in the world. It is used by the Black Mesa and Lake Powell (BM&LP) Railroad in the United States to transport freight from the mines. This feeding system has the advantage of being able to transport heavy freight with large axle load using little load current.
Table 4-9 Summary of Various Feeding Systems Item 3kV DC substation 25kV AC substation 50kV AC substation
Feeding voltage 3kV 25kV 50kV No-load voltage 3.3kV 27.5kV 55kV Receiving voltage
88–132kV 88–132kV 275–440kV
Continuous output current
1,500A 800A 800A
Feeding transformer
4,950kVA 20MVA 40MVA
Rectifier 4.5MW None None Interval between substations
8–21 km 20–30 km 140 km

4-17
Main railway lines
Metrorail Coal Line GAUTRAIN
Iron Ore Line
Characteristics : International standard for DC feeding : Low voltage : Small insulation distance : Large current : Thick wayside cables
: International standard for AC feeding : High voltage compared to DC : Large insulation distance : Small current compared to DC : Thin wayside cables
: Rare feeding system in the world : High voltage : Large insulation distance : Small current : Thin wayside cables
Source: Compiled by Study Team 2) Facilities Although TRANSNET and PRASA, the major railway operators in South Africa, use different trains, they share the use of some railway facilities. Here is an example of the current state of a 3kV DC substation. The Wolmerton Substation in the suburb of Pretoria was built in 1969. It is old because over forty years have passed since its construction. The receiving voltage is 88kV. The transformer used for the rectifier was made by AEG in 1969. The primary AC circuit breaker was just replaced in July 2012. The rectifier is an indoor open-type 4.5 MW silicon rectifier. The transformer for the rectifier was installed at the same time. The high-speed circuit breaker for feeding electricity to various directions is an open-air type made by Secheron. Figure 4-11shows the indoor facilities. The maximum train density for both the up and down lines in this substation section is about 40 trains/hour during the morning and evening rush hours
(a) Silicon Rectifier (b) High-speed Open Air-type
DC Circuit Breaker (HSCB) Source: Photos taken by Study Team
Figure 4-11 Indoor Facilities of a DC Substation Figure 4-12 is an example of the 25kV AC substation. This substation was constructed in 1982. It has been in use for over forty years. The Study Team could see from the nameplate of the feeding transformer that the transformer was made by GE in South Africa following the British Standard.

4-18
(a) Transformer for AC Substation (b) Transistor Nameplate
Source: Photos taken by Study Team Figure 4-12 Transformer at an AC Substation
The overhead contact lines along the railway line were installed in the same period when the substation was constructed. Therefore, the 3kV DC feeding sections were built by the 1970s and the 25kV AC feeding sections were built in early 1980s. Both feeding sections have been in use over forty years. They are as old as the substation facilities. However, due to cable theft and other reasons, some facilities have been replaced in the past. Figure 4-13 shows the feeder cables.
(a) DC Feeding Section (b) AC Feeding Section
Source: Photos taken by Study Team Figure 4-13 Feeding Sections along Railway Line
3) Maintenance In terms of the maintenance system, the maintenance teams spread out in various parts of South Africa have prepared maintenance manuals based on international standards, South African standards, and TFR standards for performing preventive maintenance. Despite the availability of maintenance manuals for various facilities, they are manuals for regular inspection only. TRANSNET employs 6,000–7,000 people nationwide. It is providing training for inspection and maintenance personnel. One team is consisted of 15 people and it is responsible for 140 km on the average. For important line sections, such as the Coal Line, TRANSNET is taking measures by either reducing the distance of the section per team or increasing the number of people in a team.
The main units of equipment in the TRANSNET substations are managed, refurbished, and replaced based on a life cycle of 25 or 50 years. Such tasks are contracted out to companies performing maintenance for TFR.
In the one year and two month period from November 2010 to January 2012, 1,082 accidents and failures took place at the substations. Of these 1,082 incidents, 100 of them affected the train operation. 60 trains were cancelled and 177 trains were delayed. Given that over 1,000
4-19
accidents or failures occurred over a period of about one year, one might guess that the maintenance works have not been properly done.
In terms of wayside facilities, theft of overhead contact line is rampant. Cable theft from train control facilities and civil engineering structures has been on the rise since 2008. Theft of copper cables by crime organizations is increasingly becoming an international problem. The technologies to replace copper are being developed. However, since the value of copper does not change even with contaminants, there is no real solution to theft. TFR is interested in obtaining information on Japanese technology that can replace the base material copper with other materials. (2) Challenges
1) Aging of Facilities Although detailed inspection and maintenance manuals have been prepared for the inspection and maintenance of facilities, some of them do not indicate the inspection cycle. The life cycles (25 years, 50 years) of various main facilities have been designated and simple maintenance and inspection has been carried out. However, even the life cycles of the facilities have shown that the facilities are old, which is a big problem for the future. 2) Stagnation of Technical Level At the early stage of electrification around 1970, due to the high demand, major European manufacturers established production systems in South Africa. It is believed that South Africa had achieved a relatively high level of technology at the time. However, due to the designation of life cycles of the various major facilities and stagnant investment, investment in facilities and the passing on of technologies have been put on the back-burner, making it an urgent task to improve the level of technical personnel.
3) Restoration from Failures Thefts of copper products, such as overhead contact lines, from wayside facilities occur frequently. It is necessary to find ways to shorten the restoration time after the occurrence of such incidents. (3) Capacity of Electricity Companies
Eskom is a major electricity company in South Africa. It has licenses for the generation, transmission, and distribution of electricity. Its generation department generates 85%, its transmission department transmits 100%, and its distribution department distributes 65% of electricity nationwide. In 2011, its maximum supply was approximately 42,000 MW, the maximum load demand was approximately 37,000 MW, and its average supply-and-demand factor was about 85%. The relationship between demand and supply in the last ten years shows that while the supply was increasing gradually from 37,000 MW to 42,000 MW, the maximum load demand is showing a rising trend, despite certain fluctuations. The average supply-and-demand factor trends slightly lower from about 90%, showing conscious effort to maintain steady supply.
Eskom has 27 electricity generation plants, including 13 coal-based thermal power plants, 4 gas turbine power plants, 6 hydraulic power plants, 2 pumped-up hydroelectric power plants, 1 wind power plant, and 1 nuclear power plant. The coal-based thermal power plants generate 85% and the nuclear power plant generates 5% of the total electricity output. In addition, electricity is also generated using renewable energy sources, such as gas and wind power. The nuclear power plant is the only one of its kind on the African continent.
The domestic electricity use is approximately 21,000 GWh annually, an average derived from the three-year data from 2009 to 2011. The railway’s share of Eskom’s load is 2,870 GWh,

4-20
approximately 1.4% of the overall usage. Since the percentage is so low, the railway does not pose any problem. However, it is necessary to consider the percentage of electricity use in different parts of the country.
Including modernization of the railway sector such as the TRANSNET 7-year plan, Eskom has forecasted the electricity demand for the next ten years (2011–2020) and drawn up a plan to increase output. Using 2009 or 2010 as the base year, it forecasted that the electricity demand would increase by approximately 15,000 MW in the next ten years. In response to the forecast, Eskom plans to build three thermal power plants, including Medupi, Kusile, and Coal3, to add 20,000 MW by 2020.
Furthermore, it plans to strengthen the transmission system to ensure steady power supply. As shown in Figure 4-14, Eskom plans to add approximately 6,000 km to the 756-kV transmission network, approximately 8,000 km to the 400-kV transmission network, and 740 km to the 275-kV transmission network. In addition, 1,700 km of 800-kV high voltage direct current (HVDC) lines have been planned from the Coal3 power plant in Waterberg to the Gauteng, Kwa Zulu Natal (Central Grid and East Grid) areas.
With the implementation of these plans, the short circuit capacity at the receiving end of each feeding substation relative to the capacity of feeding substations for the railway sector (a maximum of approximately 10 MVA for DC substation and a maximum of 80 MVA for AC substation) is adequate (2000–5000 MVA) even under the current situation. When the electricity system is strengthened with Eskom’s 10-year plan, it is believed that the increase in electricity demand from the modernization of the railway sector can fully be met.
Source: “Transmission 10-year Development Plan,” Eskom
Figure 4-14 Transmission Development Plan
4-21
4.1.4 Civil Engineering and Track
(1) Current State
1) Civil Engineering and Construction Technologies Until the construction of GAUTRAIN, which opened for service in 2010, there was no construction of new railway lines for about 30 years in South Africa, after the opening of the Iron Ore Line and Coal Line by TRANSNET in 1976. This period, however, was marked by concentrated investment in the construction of roads. Thanks to the economic growth in recent years and hosting of the FIFA World Cup in 2010, many infrastructure facilities have been constructed. Murray & Roberts and other major construction companies took part in many construction projects for highways, soccer stadiums, and others both in South Africa and overseas. Based on this, it is believed that these construction companies have a certain level of construction technology in building bridges, embankment, and tracks. 2) Track Maintenance Technology a) Track Maintenance Technology of TRANSNET TRANSNET Freight Rail (TFR) is maintaining the tracks of railway lines owned by TRANSNET. Train operation on the important lines, including the Iron Ore Line and Coal Line, is suspended for ten days every year to perform intensive track maintenance. Besides that, no track maintenance is carried out on a daily basis. At the Iron Ore Line, approximately 60 km of the ballasts are replaced and cleaned every year. It will take twelve years to replace all the ballasts on the line (861 km).
In FY 2009, TFR replaced 471 km of rails and 190 km of sleepers (280,000 sleepers), ballasts, and switches. In FY 2010, it replaced 555 km of rails and 292 km of sleepers, and carried out maintenance on 528 km of tracks. In FY 2011, it replaced 731 km of rails, maintained 690 km of tracks, and replaced 391,000 of sleepers. The last three years show a rising trend in the track maintenance volume.
Of all the track maintenance works, TFR only performed about 20% of them in-house. The other 80% are performed by outside track maintenance companies. In particular, track maintenance works that require the use of large machinery are mostly performed by outside track maintenance companies. Thus, it is hard to say that TFR has sufficient track maintenance technology.
Figure 4-15 shows the track condition of TRANSNET lines in FY 2010. It indicates that lines with high transport demand have above average track maintenance, showing that the tracks have been maintained to a certain extent.
However, it is likely that the tracks have not been adequately maintained. As an example, about 30 incidents of pantograph damage in 19E locomotives that operate on the Coal Line occur every year. The pantograph is damaged after being caught by the overhead contact line. Such damage is caused by the vibration of the train car and when the relative positions of the overhead contact line and the pantograph, pressed by the rail in curved areas, exceed the tolerance. One of the causes is track maintenance. It points to improper management of the positional relationship between the track and overhead contact line.

4-22
Source: TRANSNET material
Figure 4-15 Track Condition of TRANSNET Lines (FY 2010) b) Track Maintenance Technology of PRASA Table 4-10 shows the PRASA maintenance departments for infrastructure facilities. They are divided into four departments under PRASA Technical. Each department maintains the track facilities, signaling facilities, and electric facilities. They have 374 employees. Among them, 118 are responsible for track maintenance.
Table 4-10 PRASA Maintenance Departments for Infrastructure Facilities Department Route Route length (km)
Gauteng South Johannesburg, Pretoria 776 North East London, Port Elizabeth 291
Cape Cape Town 460 Durban Durban 294 Source: Compiled by Study Team
Track maintenance of the PRASA Metrorail lines are carried out in accordance with the track maintenance plan drawn up every year. The PRASA employees perform regular inspection and other maintenance works. However, maintenance works that require large machinery are performed by outside track maintenance companies, as in the case of TFR. Table 4-11 shows the cycles of track maintenance and inspection.
Table 4-11 Cycles of Track Maintenance and Inspection
Work Task Work Frequency 1)Operational State Assessment
Infrastructure Measuring Vehicle 4 monthly 2)Physical State Assessment Running lines : Track 48 monthly Running lines : Turnouts 12 monthly Yard track 48 monthly

4-23
Yard turnouts 24 monthly 3)Safety Inspections Foot Patrolling Running lines : Track 2 daily or weekly
Running lines : Turnouts Monthly Yard track Monthly Yard Turnouts 6 monthly 4)Trolley Inspections Track inspector’s trolley Half monthly Regional engineer’s trolley 2 monthly Source: Compiled by Study Team
As far as the study team could see during our local survey at Metrorail sites, it is difficult to say that track maintenance has been carried out satisfactorily. Garbage was scattered on platform tracks and there were damages on the rails and sleepers. Furthermore, as shown in Table 3-9 in Chapter 3, the national average of mean time between failures (MTBF) of Metrorail tracks in the period between April and August 2012 is 29.6 hours per incident. The MTBF is 9.1 hours in the Metrorail line sections in the Gauteng area (including Johannesburg, Pretoria, East London, and Port Elizabeth), 101.9 hours in the Metrorail line sections in the Durban area, and 27.6 hours in the Metrorail line sections in the Cape Town area. With such frequent occurrences of failures, it cannot be said that the tracks are sufficiently maintained.
Table 4-12 shows the amounts that PRASA invested in the track maintenance of Metrorail lines in the past four years. After 2009, the amounts of PRASA investment have increased and it is conceivable that funds have been appropriated for track maintenance. However, the investment amounts before 2000 were extremely small. It is believed that almost no track maintenance was carried out.
Table 4-12 Investment Amounts for the Maintenance of Metrorail Tracks FY 2009 2010 2011 2012 (budget)
Track maintenance cost (ZAR)
211 million 172 million 205 million 215 million
Source: Compiled by Study Team
3) Technologies for the Manufacture of Track Materials and Maintenance Equipment Materials used during track construction and maintenance include rail, fastening device, turnout, ballastless track, ballast, sleeper, and track maintenance equipment. The manufacturing technologies of South Africa for each material are explained below. a) Rail Since South Africa cannot produce rail domestically, it imports all of them from overseas, mainly from VEA (Australia), TATA Steel (India), and Germany. The imported rails are welded together in South Africa but the rail welding technology level is extremely low. b) Fastening Device All fastening devices are manufactured in South Africa and 98% of them are manufactured by Pandrol SA. The fastening devices used by TRANSNET and PRASA include E-Clip, fist, and bolt fixed fastening device. The spring-type fastening device, known as E-Clip, is mainly used. GAUTRAIN uses fast clip. The steel and plastic materials used for the fastening device are procured domestically.
The fastening devices made by Pandrol SA are manufactured in accordance with the standards of the British Standard Institute (BSI). It is believed that they do not have any technical problems.

4-24
c) Turnout Voestalpine VEA SA manufactures turnouts for ballasted and ballastless tracks in South Africa. It procures materials, such as sleepers and fastening devices, domestically but imports rails from the VEA headquarters (Australia). d) Ballastless Track Tubular Track in South Africa is manufacturing ballastless track (T-Track). The rigidly connected structure is made of reinforced concrete vertical beam and steel gauge bar that connects the beams on the left and right. Among the materials that it uses, it imports the rails and track pads. A standard-gauge (1435 mm) T-Track structure allows operation with 36 tons of axle load at 80 km/h. Tubular Track has received technical certification from TRANSNET. e) Ballast The ballast is all produced domestically by construction companies in South Africa. No particular technical issues have been reported so South Africa should have sufficient production capability. f) Concrete Sleeper All sleepers are produced in South Africa. They are made by concrete sleeper manufacturers or construction companies.
The concrete used to make concrete sleepers is procured domestically. However, it has quality problem. Since the fixing power between the base plate, which is used to stabilize the fastening device to the sleeper, and the concrete is weak, the base plate is made bigger in order to attach it to the concrete. For this reason, the cost of base plate has become higher. Furthermore, the concrete sleepers used in the past for the Iron Ore Line have alkali-aggregate reaction (AAR), which leads to damage in some concrete. This is due to the lack of knowledge on concrete manufacturing when the Iron Ore Line was constructed (1970s).
The pre-stressed concrete (PC) steel rod used in the PC sleepers are imported. They still cannot be manufactured in South Africa.
Based on the above, it cannot be said that the production technologies are sufficient. g) Track Maintenance Machine Two companies in South Africa, namely, Lennings and Plasserail, manufacture track maintenance equipment. Plasserail imports the main components of track maintenance equipment from the group companies’ headquarters Plasser & Theurer (Australia). Approximately 60% of the components are imported from Australia and approximately 40% are procured locally.
On the other hand, Lennings imports approximately 50% of its components and procures approximately 50% locally. (2) Challenges In the TRANSNET 7-year investment plan, as shown in Figure 3-14 in Chapter 3, TRANSNET plans to invest 71.1 billion ZAR in tracks, which break down to an investment of approximately 10 billion ZAR a year on the average. This amount is approximately three times the 3.615 billion ZAR invested in infrastructure in FY 2009. The PRASA modernization project also plans to invest 15 billion ZAR in the next three years. The amount that will be invested in track maintenance is not clear; however, investment greater than the amounts in the past is anticipated. To cope with such modernization, both TRANSNET and PRASA need to enhance technological capability and train technical personnel.

4-25
4.2 Brief Review of Applicable Standards
4.2.1 Overview
The Railway Safety Regulator (RSR) formulates the South African Standards on Railway Safety. RSR is an organization established in 2004 under DOT pursuant to the National Railway Safety Regulator Act. It supervises the operation and management of railways, as well as (1) issues Safety Permits to railway operators, (2) formulates the Railway Safety and Technical Standards in accordance with the laws, and (3) provides guidance for improving the operation of railway operators.
The Standards on Railway Safety is part of the South Africa National Standards (SANS). As shown in Table 4-13, the Standards are numbered, organized, and formulated in series. The completed standards are issued by the South African Bureau of Standards (SABS).
Table 4-13 Railway Safety Standards Issued by SABS Code Contents Issued
SANS 3000-1 General October 2009 SANS 3000-2-1 Track, civil and electrical infrastructure April 2008 SANS 3000-2-2 Track, civil and electrical infrastructure May 2008 SANS 3000-2-2-1 Track, civil and electrical infrastructure April 2012 SANS 3000-2-3 Rolling stock May 2008
SANS 3000-2-4 Train authorization and control systems and equipment
In preparation
SANS 3000-2-5 Train operation management In preparation
SANS 3000-2-6 Interoperability, intermodal and utilities management
In preparation
SANS 3000-3 Railway occurrence management In preparation SANS 3000-4 Human factors management February 2011SANS 3000-5 Railway stations In preparation Source: Compiled by Study Team
Figure 4-16 shows the specific system of Railway Safety Standards

4-26
Source: “SANS 3000-2-1:2008 Railway Safety Management”
Figure 4-16 System of Railway Safety Standards Even now, RSR is in the process of formulating the Standards on Railway Safety. The ones that have been completed and approved are enacted in sequential order. The opinions of the railway operators are heeded during formulation of the Standards.
The enacted Standards do not give specific values. They put forth the requirements that must be met, which are mainly the so-called performance criteria. Each railway operator then established its specific standards for the requirements stipulated in the above-mentioned Standards.
In addition to the standards of the Rail Safety and Standards Board (RSSB) of the United Kingdom, the former colonial power, the technical standards of representative railway operators TRF and PRASA also incorporate the standards of the countries in which the rolling stock is manufactured, such as the Association of American Railroads (AAR, USA) and the International Union of Railways (UIC).
4.2.2 Rolling Stock
(1) Axle Load
To enable mass transportation, South Africa uses long freight trains with extremely high axle load, at a maximum of 30 tons in the case of the Iron Ore Line, for train operation. In many

4-27
other line sections as well, the maximum axle load is 20–26 tons. The freight cars that carry the freight and the locomotives hauling them are designed with maximum axle loads that are permissible for the line sections where they operate to ensure sufficient tractive force. It is not rare to have maximum axle load of 26 tons in various European countries. Since the conventional lines in Japan are limited to a maximum axle load of 16 tons, Japan does not have any rolling stock with such high axle load. When the axle load is high, it is certainly necessary to pay attention to the strength. Japan does not have any experience or accumulated data on how the 25–30 ton axle load will change the adhesion coefficient, which indicates the ease of sliding between the rail and the wheel. South Africa requires an adhesion coefficient of 40%. Japan does not have any example of such high adhesion coefficient. However, the Japanese manufacturers are accumulating experience through the manufacture of the Series 15E electric locomotives (axle load 30 tons) for the Iron Ore Line. At this point, the Study Team does not anticipate any problems. (2) Car Body Strength
The Japanese technical standard stipulates that the car body structure be “solid, strong, and can endure the train operation,” The standard’s interpretative criterion clearly states that the strength of the car body is premised on normal operation. It does not require the strength to endure the head-on collision of trains or the impact of fallen rocks. In this respect, the South African standard mandates strength to endure collision. This stems from a philosophical difference between using a signal security system or grade crossing security system to prevent collision and ensuring collision safety of the car body on the assumption that collision will happen.
The South African standard stipulates a compressive load of approximately 300 tons for locomotives. It is even higher than that of UIC. It is because the long freight trains being used exert heavy load when navigating gradients and braking. Even so, Japanese manufacturers can still adequately fulfill the requirement as they have delivered rolling stock to South Africa in the past. Increasing the strength of the car body also increases its weight, making it difficult to design a car body within the permissible range of axle load. However, South Africa already has higher permissible axle load compared to Japan, increasing the weight of the train car is not a problem. (3) Gauge
South Africa uses the 1065-mm gauge, which is virtually the same as the 1067-mm gauge used in Japan. This seems to put the Japanese manufacturers in favorable light but in reality, gauge is not an issue for the manufacturers. (4) Electric Equipment
The electrical equipment in South Africa’s rolling stock follows the International Electrotechnical Commission (IEC) standards, which started by citing the British Standard (BS). Since the Japanese manufacturers have participated in many international projects, they have dealt with many international standards. In recent years, the push to equalize the International Organization for Standardization (ISO), European Norm (EN), and International Electrotechnical Commission (IEC) into common standards has made progress, further removing the barriers.
(5) Electrification System
The Iron Ore Line uses the 50kV AC electrification system, an application of the highest voltage in the world. It is important to secure an insulation distance between the pantograph areas and the transistors. Other than that, the structure is not different from other rolling stock.

4-28
(6) Vehicle Gauge
The vehicle gauge showing the maximum permissible cross-section of the vehicle, as shown in Figure 4-17, is not substantially different from that of Japan.
Source: “Clearances on ballasted track (1065mm track gauge),” RSR, 2009
Figure 4-17 Example of Vehicle Gauge in South Africa (in the case of 1065-mm gauge and ballast track)
Historically, the Japanese rolling stock manufacturers have dealt with the different technical standards of foreign countries and have exported many trains. They also have experience dealing with the heavy freight trains unique to South Africa. No technical issue about rolling stock is likely to obstruct the participation of Japanese manufacturers. 4.2.3 Signal
The “SANS3000 Part 2-4: Technical requirements for engineering and operational standards – Train authorization and control systems and equipment,” which is equivalent to the technical standard on the safety of signaling facilities in South Africa, is currently being formulated. It has not gone into effect. The following are the differences from the Japanese standard, summarized based on the technical specifications submitted for bidding.
These differences are caused by different operating conditions and environmental conditions in South Africa. They are not technical issues that the Japanese companies cannot resolve if they were to participate in South Africa’s projects. - Since some of the freight yards have both 3kV DC and 25kV AC sections, when the train
moves between the two sections, the DC–AC switchover combines the signals’ interlocking conditions and operates automatically.
- South Africa uses a block system that has both block sections and overlap sections. The length of an overlap section is over 275 m for the freight trains and over 110 m for the passenger trains. In sections where it is not possible to secure enough braking distance, an overlap section or a safety siding is installed.
- The track circuit in South Africa has a train shunting sensitivity of 0.5Ω and leakage resistance of over 2Ω/km. Compared to Japan, South Africa has higher axle load (maximum

4-29
30 tons) and longer trains (maximum 4 km). It has little rain and is relatively dry. (Reference: In Japan, the shunting sensitivity is 0.06Ω and the leakage resistance is 2Ω/km.)
- The Iron Ore Line in South Africa uses the 3-aspect signals (G, Y and R). A white aspect (W) is added to the mainline branch line and the sideline branch line to notify the driver in advance with a G-W or Y-W aspect.
4.2.4 Electric Supply
The railway electric equipment in South Africa follows the IEC and EN standards. EN is a common standard for all European countries. Many of its standards are from the British Standard. The IEC tends to follow the EN. Since the IEC is somewhat different from the Japanese Industrial Standards (JIS), it presents certain challenges for Japan but they can be overcome. (1) Difference in Voltage
The DC electrified sections in South Africa use the international standard voltage of 3kV while Japan uses the standard voltage of 1.5kV. Given that the power consumption of the traction load is the same, when the voltage is doubled, the electric current is halved and the voltage drop ratio becomes one-fourth. Therefore, in the case of 3kV feeding, it is possible to have longer interval between substations, making 3kV feeding a more advantageous method than the 1.5kV Japanese feeding standard. Furthermore, since the traction load current is smaller than the 1.5kV feeding, it will have a bigger difference from the traction load current when a ground fault or a short circuit occurs along the railway line, making it easier to protect the feeding system of the railway line than in Japan. Since Japan has not made much progress in the 3kV feeding technology, it will be difficult to make inroads in this area. However, technology to identify failures from the sizes of the fault current and operation current will be effective in shortening the restoration time. (2) Difference in Transformers for AC feeding
South Africa’s AC substations mainly use the 88kV and 132kV receiving voltages. A substation typically uses a single-phase transformer to receive current from a 3-phase electricity source. Due to concerns about the voltage unbalance ratio, Japan uses complicated transformers with interconnection, including the Scott connected transformer, modified wood-bridge connected transformer, and roof delta connected transformer, etc. The reason is to reduce the unbalance or voltage fluctuation of a particular phase of the voltage source when a large volume of single-phase current from a 3-phase electricity system is used. When comparing the electric power systems of South Africa and Japan in the same voltage class, the South African system has high short circuit capacity, strong electric power system, and its railway load capacity is lower than that of Japan. Because of these reasons, South Africa can make do with a simple structure, such as the V-connected two single-phase transformers. It may be difficult for Japan to make entry. (3) Difference in Earth Connection of AC Feeding Methods
The rails are grounded in the AC electrified sections in South Africa. In Japan, however, the rail uses ungrounded AT feeding system in the AC electrified sections to prevent electromagnetic interference for telecommunication. The rail is bonded to wayside structures along the line in some sections to control the potential. Due to the difference in environmental conditions near the railway and the difference in thinking about maintenance interval, IEC and JIS have different limit values for touch potential. However, adaptation is possible.

4-30
4.2.5 Civil Engineering
(1) Axle Load
The maximum axle load of the TRANSNET lines is 30 tons and the maximum axle load of the PRASA lines is 20 tons. Both are higher than the axle load in Japan (maximum axle load of the conventional line is 16 tons). On the other hand, Japan has already manufactured and exported rails that are designed for high axle load. The high axle load can be accommodated by increasing the size of the structure. (2) Construction Gauge
Figure 4-18 shows the construction gauge in the horizontal and vertical directions. Different from the Japanese standard (400 mm in Japan), the construction gauge in South Africa has a 925-mm leeway in the horizontal direction from the vehicle gauge. However, the difference will not act against the introduction of Japanese technologies. It is possible to construct structures that comply with the construction gauge of South Africa.

4-31
Curve radius (m)
Cant No cant cant
H(mm) L(mm) H、L B(mm) C(mm)
100 2700 3030 2750 1140 2050
300 2540 2760 2560 1250 1900
500 2510 2680 2520 1320 1850
1000 2480 2600 2490 1380 1760
3000 2470 2470 2470 1500 1600
>5000 2460 2460 2460 1600 1600
Curve radius(m)
Non-electrified section
Electrified section
3kV, 25kV 50kV
S(mm) V(mm) V(mm)
100 4470 5050 5400
300 4410 5020 5370
600 4370 5000 5350 1000 4350 4990 5340
>3000 4270 4930 5280
Source: PRASA material Figure 4-18 Construction Gauge in Horizontal and Vertical Directions
【Horizontal direction】
【Vertical direction】

4-32
(3) Platform Limit
Figure 4-19 shows the platform limit at a PRASA station. There are certain differences when compared to the Japanese standards, however, it is possible to comply with South Africa’ platform limit when constructing the structure.
Curve radius
(m) A(mm) B(mm) C(mm) D(mm)
100 1650 1790 890 810
200 1530 1630 890 820
300 1520 1580 890 830
400 1520 1550 880 840
500 1520 1540 880 850
1200 1520 1520 860 860
2000 1520 1520 860 860
3000 1520 1520 860 860
Straight line 1520 1520 860 860 Source: PRASA material
Figure 4-19 Platform Limit 4.3 Current State and Challenges of Related Private Sectors and Supporting Industries
4.3.1 Rolling Stock
(1) Current State
1) Manufacture of Rolling Stock South Africa had been manufacturing new rolling stock domestically since the old days. The level of technology was high. The Series 6E electric locomotive made by UCW recorded a maximum speed of 245 km/h in a speed test conducted in 1978. It is still the world record for narrow-gauge railway today. However, amid the social changes that took place since the second half of the 1980s, investment in railways was suppressed. For about two decades, the rolling stock manufacturing field was in distress.
From the second half of the 2000s, however, the manufacture of freight locomotives was restarted and it continues today.
At present, there are two major rolling stock manufacturers: Union Carriage and Wagon (UCW) and TRE. They account for almost all of the South African market. Currently, they manufacture locomotives and freight cars. No electric trains (EMUs) have been produced since delivery of all of Gautrain’s cars (81 cars produced in South Africa).
860

4-33
a) UCW UCW has been cooperating with Mitsui and Toshiba in delivering Series 19E electric locomotives for the Coal Line and Series 15E electric locomotives for the Iron Ore Line to TFR since 2008. The Japanese companies are responsible for the electric equipment and systems for the locomotives. At the beginning of production, since many engineers and designers from the past had already left UCW, Toshiba sent about 20 engineers to station in South Africa to reestablish production control, provide technical supervision at production sites, and offer quality control guidance to suppliers. The production will reach 110 units of Series 19E and 44 units of Series 15E by 2013, plus an additional order for 32 units of Series 15E. Both series use the AC traction motor (3-phase AC induction motor), which is the standard for today’s railcars. However, since the electronic components (elements) and circuit board are not produced in South Africa, the overall local procurement rate is 48%. The local procurement rate for machinery part (by UCW) is 80%. For Series 15E, its overall local procurement rate is 50% and local procurement rate for machinery part is 85%.
The initial 15 units of the Gautrain trains, which opened for services in 2010, were manufactured by Bombardier Inc. at its Derby factory in the United Kingdom and imported into South Africa. The materials and component parts of the other units were supplied to UCW, where they were assembled. b) TRE TRE has been cooperating with GE since 2011 to manufacture Series 43 electric diesel locomotives for general freight use at the Koedoespoort factory (Pretoria). One hundred units are scheduled to be delivered by 2013, with an additional order for 43 units.
The freight cars are manufactured at various workshops in Germiston, Uitenhage, and Bloemfontein. By March 2013, the Durban and Cape Town workshops are expected to start manufacturing container freight cars.
Although no passenger trains are manufactured in South Africa at this time, TRE will surely expand into this area, in order to meet the procurement need of PRASA for electric commuter trains, comply with the BEE Act, and utilize the production capability in South Africa. c) Grindrod This company is a unique existence in that it does not have TRANSNET and PRASA as its main customers. It is originally a maritime shipping company. After mine management, it entered the diesel locomotive business since 2009. It is currently producing diesel locomotives for dedicated lines used by mining companies and exports to countries in southern Africa and Australia. It also does not compete with the two major manufacturers, UCW and TRE, in terms of customers or products.
At present, it produces 10 units of diesel locomotives for mainline use annually. Its target is to increase production to 50 units per year.
It produces diesel engines, the main component, in South Africa in cooperation with EMD, a US company. The traction motor and control system are supplied by National Rail Equipment Company (NREC), a US company. The company specializes in locomotives for export. One of the reasons is that it is too costly for it to meet the necessary local production requirements for domestic sale. d) Rolling Stock Repair Companies Besides the three companies mentioned above, there are also companies contracted by the various railway operators to repair or refurbish their existing rolling stock. The main companies are Commuter Transport Engineering (CTE), WICTRA, and Naledi Rail Engineering. Together with TRE and UCW, the five companies each have 20% share of the refurbish market of the

4-34
PRASA commuter trains.
They repair the whole car, from the car body to the running gear. As they expand their car category to include locomotive in the future, they will certainly go into production, given the BEE Act, by collaborating with foreign companies to meet the procurement need of PRASA for commuter trains. 2) Car Components and Parts There are many companies in the field of car components and parts, and their levels vary.
Timken South Africa (bearing), Knorr Bremse South Africa (brake system), LH Marthnusen (coil/ rectifier), Mersen South Africa (carbon brush), and ABB (motor) have strong connections overseas. They all have foreign parent companies. These companies often implement quality control as a group or have group supply chains with a global scale. It is believed that most of them can maintain product quality at a certain level.
Although the main control circuit of today’s railway car has all been computerized, South Africa does not produce electronic parts or circuit boards domestically. It must rely on foreign companies. There will certainly be strong push to increase local production rate in this area in the future. At this time, TFR has imposed stringent conditions in its procurement of locomotives for general freight use. It requires raising the local production rate to 65% for locomotives in general and 80% for electric components and parts after three years upon receipt of the order.
On the other hand, Ratocon Engineering (gear case), OTD (pantograph), Booyco Engineering (air-conditioning for train cars), and Siyahamba Engineering (door for train cars) are local companies specializing in components and parts, especially machined parts. Many of them do not have large production scales because of the limited railway investment in the past 20–30 years. There is also considerable difference in the quality, safety management, and education and training of the employees, depending on the approach and motivation of the management. For example, in 2006 when Mitsui and Toshiba received the order for electric locomotives for TFR use, Toshiba had to provide guidance to Rotacon Engineering repeatedly before it could achieve the quality level required for the finished products. In this backdrop, it is necessary to review the quality of the actual products carefully in South Africa. (2) Challenges
1) Education and Training to Enhance Technical Capabilities At the rolling stock manufacturing sites, the numbers of engineers and skilled workers from the past are dwindling as they are approaching retirement. Succession of their technical expertise has become a problem. During the period when investment in railway was suppressed, many of the mid-level employees, who would have become the next generation of engineers, resigned en masse. Today it is very difficult to find successors. Furthermore, the skills of the newly hired and young workers, who would have been trained by those mid-level employees, have not had much improvement. New employees cannot grow into new mid-level employees in this vicious cycle. To break the cycle, it is necessary to provide assistance to enhance the technical skills of employees at all levels simultaneously.
There are many small and medium-sized companies in the car parts industry. Similar to other industries, they are struggling to secure high-quality workforce. Very often, they cannot provide other education and training besides on-the-job training. (Employees have no choice but to learn while doing the actual work.)
It is certain that future procurements will require a higher level of localization. Collaborating with these companies will be a prerequisite for Japanese companies to make inroads into the South African market. Therefore, how to assist these companies in education and training will be an important factor in ensuring steady supply of high-quality rolling stock. It will be the key

4-35
to entering the South African market.
2) Securing Works It is necessary to secure a certain level of works on a continuous basis in order to maintain technical capabilities. As an example, TFR is currently planning to procure locomotives for general freight business. Within the short period of six years, 1,064 locomotives will be manufactured. However, it is not clear at this time what the plan is going forward. The same is true with regard to the procurement of PRASA commuter trains. Over a period of twenty years, 360 train cars will be produced annually. There is no indication as to what direction the rolling stock industry shall take after their production is finished. Once the orders stop, it will be difficult to maintain or pass on the technical expertise without actual works. There is a high chance that those hard-earned skills will be lost again. 3) Local Production of Components and Parts It is a big challenge to increase the rate of local contents when electronic components and parts are not manufactured in South Africa. At this time, it is not clear if it is acceptable to purchase elements produced in other countries and assemble them in South Africa, or if the elements have to be manufactured in South Africa to be considered locally produced. Depending on the answer, Japanese companies will need to adopt a completely different approach.
4.3.2 Signal
(1) Current State
1) Status by Industry To understand the current state and issues of the railway signal industry in South Africa, the Study Team selected 10 local companies to find out which of the four industries, namely, manufacturing, installation/construction, engineering, and maintenance that they belong. Table 4-14 shows the results.
Table 4-14 Signal-related Companies by Job Function
Name of company Manufacturing Construction Engineering Maintenance works
Siemens Bombardier
Alstom Thales Actom
Mehleketo Hatch
Arcus GIBB Mott Macdonald
Lebone (Notes) Manufacturing: Local production or assembly of imported goods Installation/Construction: Installation of facilities, construction, testing Engineering: Planning, design, construction management, maintenance management, etc. Maintenance: Maintenance works, accidents restoration and support, hazard response and assistance Source: Compiled by Study Team

4-36
The signal industry in South Africa does not have a system that clearly divides companies into four functions. In general, they are divided into manufacturing/construction and consulting.
A local company Mehleketo is a unique example. Although its main business is consulting, it manufactures and installs signaling equipment not intended for foreign manufacturing companies. It also provides maintenance and hazard restoration assistance. Actom is a local manufacturing company. It not only installs, constructs, and tests the equipment that it manufactures and assembles but also actively participates in consulting business.
As shown by these examples, the companies in these four industries are securing personnel who can perform different functions in order to stabilize business operation. This is probably due to changes in the volume of customers’ orders and seasonal fluctuation.
Regarding the large projects being planned by the railway operators, it is true that local companies are wary about the risk of a drop in demand after they have finished the production of one big order.
2) Status of Localization in Manufacturing Industry The Study Team classified the signaling facilities in South Africa into field equipment and CTC equipment/ system equipment, such as interlocking device, to find out the status of localization by domestic and foreign manufacturers. Table 4-15 is a summary of the survey results.
Table 4-15 Localization of Signaling Equipment and Devices
Source: Compiled by Study Team
Equipment/device Localization Future trend
System
Interlocking device
Electronic type Import and assembly (Siemens/Bombardier)
Localization of software data
Hybrid type Rely on import (Siemens/GEC/Alstom)
Plan to upgrade to electronic type
Centralized train control (CTC)
Import and assembly
Automatic train protection system (ATP)
No Plan to introduce system (rely on import)
Field equipm
ent Signaling equipment
Conventional type
Yes (Actom / Mehleketo)
LED type Localization is planned (Actom)
Track circuit
Insulated Yes (some materials rely on import)
Non-insulated Rely on import (ERBTechnology)
Axle counter
Thales Rely on import (Actom) Possibility of localization if demand increases
Siemens Rely on import
Switch Yes (Actom has 95% share in South Africa)
Level crossing equipment Yes Cable Yes Box and housing Yes Freight train monitoring system
Yes (Ansys / Inteletrack)

4-37
a) Field Equipment Major local signal manufacturer, such as Actom and Mehleketo, are producing almost all the field equipment (signaling equipment, switch, level crossing equipment, box and housing, etc.) locally. In particular, Actom, which has technical collaboration with Alstom, is already producing high-quality switches locally and has 95% of the market share in South Africa.
Even among the field equipment, approaches to the localization of track circuit and axle counter, which are both train detection equipment, are different.
First, the track circuit is divided into the insulated type (Jeumont type) and non-insulated type. Except for the specially imported parts (special condenser and track relay), most of the equipment of the insulated type is manufactured and assembled locally using domestic parts. Since the domestic and overseas demand for these special parts is low, fulfilling the safety requirements will make the production very costly. Therefore, these parts are imported. The non-insulated type must rely entirely on import due to technical and cost reasons.
On the other hand, since the scale of the axle counter market until now has been small and the cost is high, Thales and Alstom have avoided localization. In reality, even though Actom is in a collaborative relationship with Alstom, it has not succeeded in mastering the technologies transferred. Instead, it is content with the status as the only sales agent of axle counters manufactured by Thales.
However, railway operators (TRANSNET and PRASA) have indicated a change in policy recently to switch from track circuit to axle counter. This raised the possibility that axle counter will be targeted for local production in the future. It is because axle counter is resistant to lightning damage, which occurs frequently in Gauteng province, and it can be installed at low cost in long sections. b) System Equipment South Africa lags behind in the technical level of system equipment, such as electronic interlocking device. At this time, it is using the old hybrid type-interlocking device, which shall be upgraded as soon as possible.
The vital components of the interlocking device are all imported but the non-vital components are mostly produced domestically.
Siemens, Bombardier, and Thales are the major companies delivering interlocking devices to South Africa. Siemens imports both the hardware and software of the device from Germany. Only the peripheral parts for transmission (optical fiber and cable) are manufactured and assembled locally. On the other hand, Bombardier imports both the hardware and software of the device and assembles them locally.
South Africa is debating the pros and cons of whether to produce software locally from the perspectives of the cost of development by local software engineers and the performance of the developed software (cost performance).
In this backdrop, Siemens is taking initiatives to pursue localization. Rather than the software itself, it is limiting localization to the compilation of software control data, which is important for the interlocking device. By doing so, it hopes to improve software quality.
The centralized train control (CTC) system for the new model trains and the automatic train protection (ATP) system, which is expected to be introduced in the future, will probably go through the same process as the interlocking device with regard to localization.
3) Status of Signaling Consulting Industry The signaling consulting industry in South Africa is facing a very difficult environment. TRANSNET awards most of its contracts to its affiliated consulting company (Transnet Capital

4-38
Projects) and very few to outside consulting companies. The mining companies already have contracts with the RCE Consultants. Railway operator PRASA is awarding contracts to private consulting companies, which are locked in fierce competition. The major consulting companies are as follows:
- Arcus Gibb (major company) - Hatch (major company) - Actom - Lebone Engineering - R&H Railway Consultants - MottMacDonald - Siyaya (joint venture agreement with DB International) - Transnet Capital Projects (former Protecon) - RCE Consultants Table 4-16 shows the members of joint venture teams that have been awarded orders from TRANSNET, PRASA, and Gautrain in the past.
Table 4-16 Signal Engineering Group
Group Leading Company JV Company Client
Group A Mott MacDonald
Lebone TRANSNET PRASA ESKOM
Bombela GAUTRAIN Group B
Hatch Actom Mehleketo
PRASA
Group C Lebone Bombela
SARCC TRANSNET
Group D R&H
Group E Arcus Gibb Actom PRASA Group F Aurecon Ansaldo
Group G Actom
Acrus Gibb
PRASA Hatch
Worley Parsons
Source: Compiled by Study Team
What the Study Team can discern from Table 4-16 about the major consulting companies in South Africa is that the two local leaders Arcus Gibb and Hatch are collaborating with Actom in different projects while Mott MacDonard and Bombela are collaborating with Lebone Engineering in the Gautrain project, and there is no consultancy specializing in telecommunications.
Transnet Capital Projects is handling the consulting of TRANSNET projects singlehandedly. It plans to maintain and improve technical capabilities by working on development and upgrade plans. (2) Challenges
1) Strengthening Construction Capability Actom and Mehleketo are the two major local companies in the industry that construct signaling facilities in South Africa. In the past turnkey construction projects, they have experiences

4-39
collaborating with Siemens, Bombardier, and Thales. Although both companies have certain levels of expertise in constructing conventional signaling facilities, skilled engineers are in severe shortage. The two companies combined have only 10 registered certified signal engineers. In the future, the construction companies will be required to establish construction systems to handle the new development projects ordered by railway operators (TRANSNET, PRASA, etc.). Therefore, it is necessary to take measures to improve the technical capabilities of technical personnel in order to master the construction and testing methods of the newly introduced modern facilities and enhance the current construction capabilities. 2) Promoting Local Production In South Africa’s railway signal industry, if a foreign company and a local company form a collaborating group and appropriately share manufacturing and construction in a conventional project, it is relatively easy to achieve the localization rate (50%) required because of the high labor value. It is understood that these companies are experienced with the general issues of localization.
However, the requirements by railway operators in recent bidding have reached higher levels. The Study Team continues to enter a phase in which system equipment, field equipment, and software development requiring advanced technical capabilities, for which localization was not required until now, will be subject to localization requirements. As a condition to pursue localization, it is necessary to not only ensure quality improvement and no cost constraints but also determine whether there will actually be steady and continuous demand in the future.
To tackle the situation, South Africa needs to develop a system to increase the volume of hardware and software, which had relied completely on imports so far, in phases and work towards localization. It is an important task to provide education and training programs domestically and abroad in order to enhance the technical capabilities of personnel and pass on technologies.
As explained above, local companies are pursuing localization at this time within the limited scope of technical transfer from foreign companies. Among the products that are made with advanced and latest technologies, local companies may have difficulty deciding which products are for localization, and how to master the technologies for localization.
In addition, since PRASA recently announced the policy to emphasize maintenance in its bidding requirements, maintenance-related equipment shows potential for localization. 3) Response to Technical Transfer and Skills Training From the perspective of maintaining and improving the construction capabilities of local companies, since foreign contractors will have to rely on local construction companies to carry out construction works and perform testing, ideas to develop a system that can maintain and enhance such construction capabilities are being sought. A condition of the railway operators is to require foreign contractors to contribute a portion of the contract amount to the technical transfer and skills training of local companies. It will be a challenge to figure out how to provide specific skills training to local companies so that they can acquire the necessary skills for installing new equipment and machinery and conducting tests, in which they have no practical experience. 4.3.3 Electric Power
(1) Current State
Main equipment, such as substation, is procured from the leading foreign companies shown below. Upgrades and replacements are carried out by domestic companies.

4-40
1) AC Circuit Breaker The main equipment of substation facilities are procured from major manufacturers, such as Siemens, ASEA, AEG, Alstom, Delle Alstom, Areva, and so on. 2) Transformer The under 5MVA transformer used for the rectifier for DC substation are from manufacturers such as ASEA, GEC, AEG, ABB, Powertech, WEG, Hawker Siddeley Africa, etc. The 20MVA class transformers for 25kV AC substation are delivered by NEI Transformer, GEC, ABB, and Powertech as single-phase transformers. The 50kV transformers are supplied and managed by a utility company (Eskom). 3) Rectifier The rectifiers for DC substation use are procured from manufacturers such as Semikron, AEG, etc. 4) DC High-speed Circuit Breaker Most of the high-speed circuit breakers for output at DC substations are the open-air type. They are manufactured by Ansaldo/EMC and ABB. 5) Overhead Contact Line and Other Maintenance Parts The wayside cables are supplied by MTech, the fixing brackets from Quel Engineering and EBM, and the insulators from Speedcrafts, etc. To cooperate in the effort to nurture small and medium-sized businesses (BEE businesses) in South Africa, TRANSNET purchases other maintenance parts from small and medium-sized businesses in South Africa through its material procurement department. Examples are Boipelo Engineering, Active Power Projects, Gakennoshi, Power Projects, Conco, Ampcor, LHM, etc. These small and medium-sized businesses purchase parts and materials from ABB, Alstom, Semikron, and other major manufacturers. (2) Challenges
Over forty years have passed since the period around 1970 when electrification was promoted. The time has come when aging of the main equipment at substations becomes noticeable. It is believed that the technical level at the time when the substations were constructed was sufficient for local production. Daily inspection and maintenance have been carried out. The life cycles of main equipment have been designated (25 or 50 years) and overhaul is contracted out to major manufacturers. Although the maintenance products are procured from domestic companies, the domestic companies are importing component parts from major manufacturers. Such practice delays the succession of technologies, making it a challenge to improve the technical skills of upgrading facilities, inspection, and maintenance. Upgrade and replacement are carried out by domestic companies. It is advisable for them to improve their technical abilities. 4.3.4 Civil Engineering
(1) Current State
1) Construction Companies South Africa has large construction companies, such as Murray & Roberts, Grinaker LTA, Group Five, Stock Building, etc. They participate in many construction projects. Besides the domestic construction projects, they also made inroads into other African countries and participate in ODA projects at various places. In recent years, they also took part in railway projects. Murray & Roberts participated in the construction of Gautrain and Grinaker LTA is taking part in the Metrorail extension project (in progress) in the Durban area.

4-41
2) Track Maintenance /Construction Companies The major players in South Africa are the three local companies Lennings, Plasserail, and SIMS. Lening and Plasserail have been maintaining and constructing tracks for over fifty years. They also manufacture track maintenance equipment in-house. SIMS procures track maintenance equipment from Plasserail and DESEC (manufactures track maintenance equipment, Finland). The size of South Africa’s track maintenance business is approximately 500 million ZAR annually. 3) Concrete Sleeper The three major local concrete sleeper manufacturers in South Africa are Infraset, Rail2Rail, and GPT. Among the three, Inftaset has 60% share, Rail2Rail 20–25%, and GPT15–20%. The construction company Grinaker LTA also manufactures concrete sleepers.
The market size of concrete sleepers is approximately 24 million ZAR (60,000 sleepers) per month and approximately 300 million ZAR per year. The market size of track materials, including rails and sleepers, is approximately 1.2 billion ZAR per year.
4) Fastening Device The major player is Pandrol SA. It has 98% of the market share of fastening device in South Africa. In particular, it has 100% of the market share of E-Clip and Fist, and 95% of the bolt fixation type. Although many companies can manufacture the bolt fixation-type fastening device, all of them are small, resulting in the monopoly of Pandrol SA. In FY 2011, Pandrol SA delivered 3.5 million fastening devices to TRANSNET and PRASA.
Since only one iron and steel company (Arcelor Mittal) supplies the steel for making fastening devices, the quality and price of the steel material can be swayed substantially. 5) Ballastless Track The only major player is Tubular Track. It developed the ballastless track in 1986–2000. The track was first used at a PRASA Metrorail station. Today eighteen stations are using the Tubular Track. There is a plan to use it in forty more stations in the future. Its construction cost is almost the same as the ballast track. However, since it needs almost no maintenance, it is more economical than the ballast track. Furthermore, the track formation width is narrower compared to the ballast track. (2) Issues
1) Small Supporting Base The track construction, track maintenance, and track material manufacturing industries in South Africa have a small base. Investment in track construction and track maintenance has been limited until now. The scale of the supporting base is sufficient at this time; however, when TRANSNET and PRASA increase investment in track construction and track maintenance, even if the supporting base has the technologies to meet the demand, it will have shortage of technical personnel, track maintenance equipment, and business capital. 2) Raising the Education Level of Employees Since the skill level of local workers is low, many companies see the need to raise the level of technical personnel, such as enhancing technical capabilities through OJT. Some companies have also established training departments to enhance the technical capabilities of employees. 3) Shortage of Construction Equipment Without the specialized equipment and machinery, track construction and track maintenance cannot be carried out. The price of each unit of the track machines is high (about 15 million ZAR). Even if TRANSNET and PRASA suddenly order more track construction and track

4-42
maintenance, the machine manufacturers may have difficulty responding quickly or securing sufficient funds. 4) Fund Shortage Since the railway-related market had been small until now, many companies are also small. They do not have sufficient capital to expand operation. 4.3.5 Common Issues and Solutions
(1) Shortage of Human Resources in Industries
Shortage of skilled labor and unstable orders are common issues faced by the four industries of rolling stock, signaling, electric power, and civil engineering. These are not just problems of the railway industry; they are the biggest employment-related policy issues in South Africa. While South Africa is actively taking measures in line with the National Skills Development Framework (NSDF), this is also a chance for Japan to be proactive in offering assistance.
Besides public assistance, as Japanese companies move forward with localization, they will contribute to the training of human resources on a company basis. This is conducive not only to favorable BEE evaluation but also to the cultivation of a trustful relationship with local companies. (2) Unstable Orders
Instability in orders is common to the four industries. Ultimately, TRANSNET and PRASA are the only two companies placing orders to the railway industry in South Africa. Since their procurements are not regular, the market is not stable, making it difficult for the manufacturers and related businesses to make business plans. In fact, even when the Study Team asked local manufacturers about the market sizes of their industries during our interviews, most said that it is difficult to give an answer to “market size” in a conventional sense because it all depends on whether there is any bidding or not.
Regarding this issue, the South African government also recognized that “Short-term and unstrategic procurement practices in relation to major areas of public capital expenditure, which both raises costs and limits prospects for localization.” It is hoped that PICC will pursue strategic procurement in the future. (3) Shortage of Corporate Funds
Local companies, which made up the supporting industries, are mostly small and medium-sized companies. Even when there is a chance for large-scale bidding, these companies may be constrained in their response due to shortage of funds. In light of this, the Department of Trade and Industry is working to enhance its corporate incentive system. It will also be a very effective strategy for Japanese companies to offer financial assistance when they form partnerships with local companies. This is a strategy that shares commonality with assistance in human resources training mentioned in (1) above. (4) Requirement for Localization
The requirement for high-level localization in the rolling stock industry is also a big challenge. It is necessary to conduct a comprehensive review of the BEE and PPPFA systems, and gather and analyze information to find solutions. In this regard, it is extremely important to form alliances with local companies.

4-43
4.4 Current State of Job Skills Training and Issues
4.4.1 Education System in South Africa
Public education in South Africa uses a 7-5-4 system. As shown in Table 4-17, it is composed of 7 years of primary school, 5 years of high school, and 4 years of university. They are divided into three categories: General education, Higher Education (HE), and Further Education and Training (FET). General Education is under the jurisdiction of the Department of Basic Education (DBE), and HE and FET are under the jurisdiction of the Department of Higher Education and Training (DHET). The DHET also established the Sector Education and Training Authority (SETA) to support occupational training for different sectors.
To complement public education, especially occupational training, the in-house education at companies and private educational providers play an important role.
Table 4-17 Educational System in South Africa Age Class Grade Remarks
― Non-Compulsory
Education
Higher Education
Master 3
・At the end of Grade 12, a student will take a Matric examination. If the student passes the examination, then he/she can graduate from high school and obtain the qualification to enter a university.
・ A student over 16
years old can attend the FET (no other prerequisites).
Master 2 Master 1
Bachelor 4 Bachelor 3 Bachelor 2 Bachelor 1
18
High School
Grade 12 17 Grade 11 16 Grade 10 15
Compulsory Education
Grade 9 14 Grade 8 13
Primary School
Grade 7 12 Grade 6 11 Grade 5 10 Grade 4 9 Grade 3 8 Grade 2 7 Grade 1
Source: Compiled by Study Team (1) Jurisdiction of the Department of Basic Education (DBE)
DBE is in charge of primary school and high school. The students are divided into 12 grades, from Grade 1 (age 7) to Grade 12 (age 18). However, compulsory education is only offered up to Grade 9. At the end of Grade 12, students take the Matric examination. If they pass, they can graduate from high school and be qualified to attend universities and FET.
According to the results of the national assessment for language and mathematics taken by students in Grade 3, Grade 6, and Grade 9, only 27–38% of the students obtain the minimum acceptable marks. DBE aims to raise the percentage of students to at least 60%.
However, many students drop out of the compulsory education without having acquired the necessary basic skills for employment. This is a reason for the high unemployment rate1.
1 Based on local interviews of private education and training providers

4-44
(2) Jurisdiction of the Department of Higher Education and Training (DHET)
1) Higher Education (HE) The universities in South Africa are classified into the traditional university, university of technology, and comprehensive university for teachers. They are similar to the university, technical university, and teacher’s college in Japan but there are also differences2. South Africa has 23 universities, including 11 traditional universities, 6 universities of technology, and 6 comprehensive universities. 2) Further Education and Training (FET) Fifty FET colleges have been established to provide Vocational and Continuing Education and Training (VCET) to students upon their graduation from university.
3) Sector Education and Training Authority The Sector Education and Training Authority was established in 1998 to unify under DHET the education and training that had been carried out independently by each industry until then.
According to SETA, an estimated 4.3 million people are currently unemployed. More than half of the graduates who completed 12 years of education do not have sufficient occupational skills to get work in any industry.
At present, 23 industries have established SETA3. The Transport Education and Training Authority (TetaSETA) was established for railway-related industries. The TRANSNET Training Board was established under TetaSETA as one of the committees. For the manufacturing-related industries, the Manufacturing, Engineering and Related Services Sector Education and Training Authority (MerSETA) was established.
(3) Education and Training at Private Companies
Immigration of artisans overseas, aging workforce, and shortage of newly hired after the abolition of Apartheid have contributed to a shortage of skilled workers in both the public and private sectors, causing a big problem. Besides the abovementioned FET, many companies are providing education in-house4. Such in-house education is often administered by providers specialized in education and training.
The abovementioned FET is for people seeking employment. As for in-house education, it is often a venue for providing the necessary reeducation and retraining of experienced workers5. The SETA is responsible for checking the contents of job training plans and monitoring their implementation.
In the railway sector, TRANSNET has established the School of Engineering (SOE) and PRASA has established the Training Academy to provide job training.
SOE has about 2,100 students. It allocates approximately 18 million ZAR annually into job training. It also commissions GE, EMD, and other companies as well as RIBS University (Johannesburg), Regenesses University (Midrand), and University of Pretoria to provide part of its education program6.
2 See the following URL for details. http://www.ieasa.studysa.org/resources/Study_SA_11/In%20leaps%20and%20bounds%20Growing.pdf 3 A proposal to consolidate 21 industries has been submitted (as of October 2012). 4 The Study Team interviewed over ten companies. Most of them have some kind of in-house training. 5 Based on local interviews of over 10 manufacturers 6 Based on local interviews at SOE

4-45
SOE offers education not only to TRANSNET but also to PRASA and railway operators in the Zambia Railways, National Railways of Zimbabwe, Mozambique Ports and Railways, Swaziland Railway, and Botswana Railways7.
At the PRASA Training Academy, about 250 people received training. The education program covers both existing technologies and new technologies. As an example of the latter, the Siemens provided education and training to 130 technical workers and 70 operational staff when it delivered a new signaling system8 to PRASA.
As mentioned in 2.2.2(4)5), pursuant to the Skills Development Act (SDA) and Skills Development Levies Act (SDLA), employers who meet certain conditions must pay 1% of its annual payroll amount to a SETA as skills development levies (SDL). If SETA accepts the plans and the education and training results that an employer reports, the employer can get a refund of some of the SDL. Apart from this, SETA also gives out grants. Of course, implementation of education and training pursuant to the SDA is beneficial to the BEE score.
4.4.2 Skills Qualification System
Solving the unemployment problem is the most urgent issue in South Africa. In this backdrop, the Skills Development Act was enacted in 19989. In accordance with this law, the National Skills Development Strategy (NSDS) and the Accelerated and Shared Growth Initiative for South Africa (ASGISA) explained in 2.2.2(1) are being implemented.
As explained above, both the public and private sectors are devoting great efforts to job training. From the employment promotion point of view, it is necessary to accredit objectively acquired skills. For this reason, the South African Qualification Authority (SAQA) was established as a public skills qualification organization to provide official certification in accordance with the National Qualifications Framework (NQF). Table 4-18 shows the NQF levels and education system.
In this way, if the job skill is objectively qualified, a job seeker will have greater possibility. The qualification is also useful for employers in understanding the capabilities of the job seeker. However, from an employer’s point of view, there is also the drawback that an employee may leave for better compensation after the company has used its financial resources to sponsor the employee to receive education and training to acquire the qualification. As a countermeasure, a local manufacturer is said to be giving better compensation to employees who become certified10.
The certification of qualification is conducted by SAQA through SETA. However, since it takes about half a year (as in September 2012) between the completion of education and training and the certification, the process of certification shall be sped up.11.
7 Same as above 8 Based on local interviews at PRASA 9 See 2.2.2(4)5) “Skills Development” 10 Based on local interviews at a railway rolling stock material manufacturer 11 Based on local interviews at TRANSNET

4-46
Table 4-18 NQF Levels and Education System
NQF Level Band Qualification Type
8–10 7 6 5
Higher Education and Training
Post-doctoral research degrees Doctorates Masters degrees Professional Qualifications Honors degrees National first degrees Higher diplomas National diplomas National certificates
4 3 2
Further Education and Training
1 General Education and
Training Grade 9 National certificates
Source: SAQA website [http://www.saqa.org.za/show.asp?include=structure/nqf/overview01.html#1.] 4.4.3 Issues in Job Skills Training
In addition to the drain of skilled engineers to other countries and the retirement of older workers, the training and supply of new personnel have also been slow. The scarcity of human resources is the biggest problem facing the railway industry in South Africa. This is, almost without exception, the concern that the Study Team heard in interviews during the Survey, no matter whether it was the public or private sector, or what type of business.
Under such circumstances, South Africa is actively promoting the National Skills Development Strategy, as seen above. In recent years, there is strong realization of the importance to train instructors for education and training. In our interview at DOT, the expression “to train teachers’ teachers” for the railway industry was used to emphasize the importance of teaching personnel. In reality, as shown by the examples of SOE and Training Academy, respectively, TRANSNET and PRASA are employing not only internal resources but also soliciting the help of other manufacturers and universities. This underscores the need for nurturing teaching personnel.
Specifically, vigorous efforts are being made to establish the first railway-engineering faculty in South Africa at the Vaal University of Technology in Gauteng province. South Africa’s railway sector is growing and it is expected to create high demand for technical personnel to work in operation, maintenance, and so on. Given the challenge to supply high-quality human resources to meet the demand, the University will open South Africa’s first railway faculty for the 2014–2015 academic year. Professor Ndege at the University is spearheading the preparation.
The University is aware of the success of the JICA project at Jomo Kenyatta University of Agriculture and Technology in Kenya12. It has high expectation for Japan to be proactive in offering assistance to the opening of the new faculty13.
12 Technical cooperation project (human resources development department) ID (former)5151061E0, cooperation period: 1978 - 2000. 13 Based on local interviews (Vaal University of Technology and DOT)

4-47
4.5 State of Locomotive Maintenance
To understand the issues pertaining to the maintenance of rolling stock, the Study Team conducted a survey from August 28 to September 17 of 2012 and interviewed concerned parties at the car depots of TRANSNET Rail Engineering (TRE) where the electric locomotives delivered by Mitsui/Toshiba are maintained. The survey results are as follows:
4.5.1 Common Factors in TRE Maintenance
(1) Overview of TRE
TRANSNET purchased locomotives for the use of its affiliated company, TRANSNET Freight Rail (TFR). Approximately 1,400 units of electric locomotives between 1969 and 1990 and approximately 1,100 units of diesel electric locomotives between 1965 and 1993 were procured by TRANSNET. In line with its policy of using locomotives for 50 years, TFR has been using Series 6E (age of locomotives approximately 40 years) and Series 7E (age of locomotives approximately 30 years) for a long time.
According to the 2011 TFR annual report, TFR is anticipating increase in freight transport volume in the next four years (9.0% increase in the Iron Ore Line and 3.2% in general freight). It has purchased about 180 units of the latest Series 19E and 15E electric locomotives with an AC traction system and about 150 units of the Class 43 diesel electric locomotives.
Besides maintaining these locomotives, freight trains, and other equipment used by TFR, TRE also maintains PRASA coaches (for commuter trains and long-distance passenger trains).
Figure 4-20 are examples of electric locomotives.
(a) Series 19E electric locomotive (b) Series 15E electric locomotive
Source: Photos taken by Study Team Figure 4-20 Examples of Electric Locomotives
(2) Depot System and Subjects of Survey
TRE has depots at 132 locations in South Africa. Besides storing trains, 27 locations have inspection and repair functions. Among them, the ones at Koedoespoort, Broemfontein, Durban, Salt River, Germiston, and Uitenhage are workshops that can perform overhaul, upgrade, and refurbishment. The other 21 depots conduct regular inspection.
Each of the 21 depots performing regular inspection is responsible for the maintenance of a certain type of locomotive. Depending on the workload and type of locomotive, a regular-inspection depot may contract with a workshop to have the work done on a certain locomotive or equipment. The workshops do not have a specific locomotive type for which they are responsible. They carry out maintenance and overhaul based on the orders received from the depots and outside customers.
Among the 21 depots that perform regular inspection, the Study Team conducted survey at the
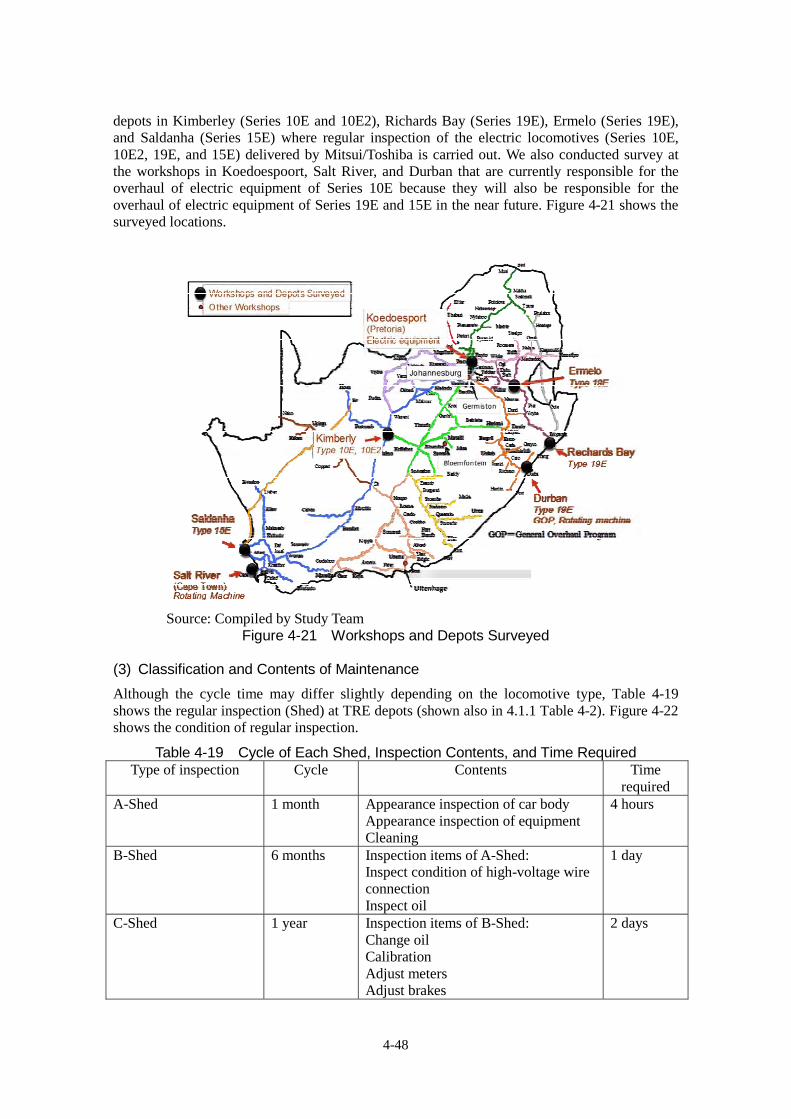
4-48
depots in Kimberley (Series 10E and 10E2), Richards Bay (Series 19E), Ermelo (Series 19E), and Saldanha (Series 15E) where regular inspection of the electric locomotives (Series 10E, 10E2, 19E, and 15E) delivered by Mitsui/Toshiba is carried out. We also conducted survey at the workshops in Koedoespoort, Salt River, and Durban that are currently responsible for the overhaul of electric equipment of Series 10E because they will also be responsible for the overhaul of electric equipment of Series 19E and 15E in the near future. Figure 4-21 shows the surveyed locations.
Source: Compiled by Study Team
Figure 4-21 Workshops and Depots Surveyed
(3) Classification and Contents of Maintenance
Although the cycle time may differ slightly depending on the locomotive type, Table 4-19 shows the regular inspection (Shed) at TRE depots (shown also in 4.1.1 Table 4-2). Figure 4-22 shows the condition of regular inspection.
Table 4-19 Cycle of Each Shed, Inspection Contents, and Time Required Type of inspection Cycle Contents Time
required A-Shed 1 month Appearance inspection of car body
Appearance inspection of equipment Cleaning
4 hours
B-Shed 6 months Inspection items of A-Shed: Inspect condition of high-voltage wire connection Inspect oil
1 day
C-Shed 1 year Inspection items of B-Shed: Change oil Calibration Adjust meters Adjust brakes
2 days

4-49
D-Shed or MOP(Mini Overhaul Program)
6 years (3 years for Series 19E and 15E)
Overhaul by removing the electric equipment and mechanical equipment (including bogie) from the car body
1 month
D-Shed or GOP (General Overhaul Program)
12 years Overhaul by removing the electric equipment and mechanical equipment (including bogie) from the car body Refurbishment Repainting of car body, etc.
2 months
(Note) “Shed” is used to indicate the type of inspection. Source: Compiled by Study Team
(a) Body Ascending (b) Maintenance of Axle and Wheel
Source: Photos taken by Study Team Figure 4-22 Conditions of Regular Inspection
(4) Maintenance System
The General Manager at the headquarters is in charge of the maintenance of locomotives nationwide. Under the General Manager, there is a Senior Fleet Maintenance Manager (SFMM) for each locomotive type. Figure 4-23 is an organization chart of the workshop and Figure 4-24 is an organization chart of a depot. Under the SFMM, there is a Fleet Maintenance Manager in the depot for each type of locomotive. Under the Fleet Maintenance Manager, there is a Business Manager in charge of maintenance works.

4-50
Source: Compiled by Study Team
Figure 4-23 Organization Chart of Workshop

4-51
CEO
National Rotating Business General Manager
Rotating Business LocalBusiness Manager at Salt
River
Rotating Business LocalBusiness Manager at
Durban
National Locomotive Business General Manager
Local Locomotive Business Manager at
DurbanLocomotive Business Manager at Salt River
Customer Manager
Engineering Manager
Quality AssuranceManager
XXE Locomotive Fleet Operation Manager
Planning Control Office (PCO)
Supervisor
Artisan
Technical Worker
Other business units:Wheel / Auxuillury / Wagon etc.
Factory Locomotive Business Organization
Logistic Manager
CME
Supervisor
Artisan
Technical Worker
Source: Compiled by Study Team
Figure 4-24 Organization Chart of Depot

4-52
Figure 4-25 shows the system for implementing general maintenance in a depot. A supervisor under the Business Manager forms a team to perform maintenance works.
Depending on the type of locomotive that the depot is responsible for maintaining, a depot generally has over three maintenance and inspection teams. Each team is made up of 7–10 members, including a supervisor, artisans, and technical workers.
Source: Compiled by Study Team
Figure 4-25 Composition of Maintenance Team (5) Planning and Implementation of Maintenance Works
TRANSNET group is using the Systems, Applications and Products in Data Processing (SAP) to manage the production, cost, and training history of the company across-the-board.
Maintenance works are planned using SAP. It automatically prepares a weekly work plan for each Shed. Based on this plan, the Fleet Manager or Business Manager prepares an implementation plan and inputs it into the SAP. Based on this weekly implementation plan, the Production Control Office (PCO) of each depot outputs a detailed daily work plan and the necessary work instructions and checklist for each Shed and gives them to the Business Manager and Supervisor responsible for implementing the maintenance. Based on the information and instructions of the supervisor, the artisans and technical workers carry out the maintenance works.
After the maintenance works are finished, the workers send the work results to PCO and PCO inputs the work results into the work records. (6) Managing Work Records
The workers perform maintenance works according to the checklist that PCO outputs from the SAP. When the works are complete, the supervisor conducts a secondary inspection of only the key items.
When there is a problem, the TRE workers and engineers will work together to identify the cause. When it is necessary to replace component parts, TRE will make a request to PCO and pay for the component parts. PCO will issue the work procedures and the workers under an artisan will make the replacement following the instructions of an engineer or supervisor. After the replacement, the engineer will compile a Non Conformance Report (NCR) and submit it to PCO. PCO will input the report into SAP. Based on this information, the 3-month rolling stock record sheet and check sheet, which contain 3 months of work records and failure records issued by PCO, are made into a database to enable the engineers, supervisors, and workers to perform searches. The engineer will use the 3-month rolling stock record sheet to analyze the characteristics of a particular car and identify the key items for the next maintenance. However, no analysis of the cause of failure is performed.
Technical worker
Planning and management of inspection by locomotive type
Operation control Quality control
Technical worker
Technical worker
1 team
Artisan
Artisan
Artisan
Supervisor Business manager

4-53
(7) Managing Work Process
Every morning, the supervisor or manager will conduct a work meeting based on the detailed daily work plan generated by PCO to follow up on any adjustment or delay in the work process. (8) Work Instructions
Based on the detailed daily work plan generated by PCO, the supervisor gives oral instructions to workers on the day’s works in the morning meeting every day.
(9) Education and Training
TRE has a system called the School of Engineering (SOE), which provides education in three phases, as shown in Table 4-20. The attendance record is managed by SAP.
Table 4-20 SOE system of TRE
Trainee Contents of education
Before joining the company
- Students are recruited and offered education before entering the company. They received stipend for living expenses during the training. Upon completion of training, they are admitted to TRE. The ones who choose to join other companies are required to return the stipend for living expenses.
Within 3 years after being hired
- It is an education curriculum offered to workers within 3 years after being hired. The contents of education include general education on rolling stock system (phases 1 2 3 4, a total of 173 days) and specific curricula on locomotives.
Current worker - Individual training programs on special skills (welding, crane, soldering, etc.) are offered.
Source: Compiled by Study Team Figure 4-26 shows the scenes of a lecture and practical training session.
(a) Lecture (b) Practical training session
Source: Photos taken by Study Team Figure 4-26 Scenes of Training at SOE
There is no refresher courses after the completion of training, only on-the-job training at the workplace. Therefore, there is no way to verify if the skills have been retained or not. Among the workers, however, the candidates for manager positions receive manager education from internal and external instructors.

4-54
(10) QC Activities
Quality control (QC) activities are carried out by each section at the workplace. As shown in Figure 4-27, each section is carrying out activities, as shown by the contents of activities under the themes “Quality,” “Speed,” “Cost,” and “Safety” posted on the walls at the sections’ workplaces.
Source: Photo taken by Study Team Figure 4-27 Postings of QC Activities
4.5.2 Current State and Challenges of Various Workshops and Car Depots
(1) Current State
We conducted survey at three workshops in Koedoespoort, Salt River, and Durban and at four depots in Kimberley, Richards Bay, Ermelo, and Saldanha.
Every site where we conducted the survey had adequate functions (workspace, number of pits, and number of cranes) necessary for performing maintenance. The workshops are doing overhauls of rotating equipment (main motor) and have adequate facilities to do repairs. However, the workshops have facilities for DC motors but no facilities at all for AC traction motors. Each depot has facilities to lift the car body and enough pits. However, the recommended replacements of electric equipment on a regular basis and other preventive maintenance have not been carried out.
Table 4-21 is a comparison of the main items.

4-55
Table 4-21 Maintenance Conditions at Various Workshops and Depots (a) Workshops
Items of Survey Koedoespoort Workshop Salt River Workshop
*Only surveyed the rotating equipment building
Durban Workshop *Only surveyed the locomotive rehabilitation
building
Overview
Number of buildings for rolling stock warehousing
Overhaul/repair: 1 building Series 16E Series 18E refurbishment: 1 building Series 43 assembly line: 1 building Testing line: 1 building
Rotating equipment reassembling line: 2 buildings Rotating equipment storage: 1 building
Repair line: 4 buildings Painting line: 1 building Warehouse: 1 building
Number of electric locomotives in possession
The workshops are not assigned any particular rolling stock because they are rehabilitation workshops. They perform MOP and GOP according to the requests from depots.
Responsible for: [EL] Series 6E, 7E, 10E, 10E1, 10E2, and 18E [DEL] Class 34, 37, and 38
Responsible for: [EL] Series 9E [DEL] Class 34 Has DC motor made by GE in Africa
Responsible for: [EL] Series 7E, 7E1, 7E2, 7E3, 8E, 10E, 10E1, and 10E2 [DEL] None
Usage of electronic parts
Has COE Control of old locomotives/maintenance of high-voltage equipment. Can perform repairs
No COE Does not handle most electric equipment
Does not handle Has repair shop for electric equipment but does not handle electronic equipment
Work contents
A-, B-, C-Shed No No No
D-Shed Yes Yes Yes
Overhaul of control equipment
Yes Some(mainly outsource) Some (request other workshops to perform some works)
Overhaul of high-voltage electric equipment
Yes Some(mainly outsource) Some (request other workshops to perform some works)

4-56
Items of Survey Koedoespoort Workshop Salt River Workshop
*Only surveyed the rotating equipment building
Durban Workshop *Only surveyed the locomotive rehabilitation
building
Overhaul of bogie Yes Yes Yes
Overhaul of motor Yes Yes Yes
Overhaul of car body Yes Yes Yes
Organization
Number of employees 290 workers for rotating equipment alone 120 workers for rotating equipment alone 215 workers (locomotive rehabilitation workshop alone)
Name and number of Organizations
Generally as shown in Figure 4-, may differ by workshop
Facility-related
Facility/equipment for maintenance
Wheel reprofiling machine
Yes Yes Yes
Sheet metal painting facility
Yes Yes Yes
Motor testing facility Yes Yes (DC motor only) Yes (DC motor only)
Testing facility for high-voltage electric equipment
Yes No No
Testing facility for control-type electric equipment
Yes No No
Equipment cleaning facility
Yes Yes Yes

4-57
Items of Survey Koedoespoort Workshop Salt River Workshop
*Only surveyed the rotating equipment building
Durban Workshop *Only surveyed the locomotive rehabilitation
building
Washing machines (purpose and scale)
Dry ice washing machine, cleaning machine, cleaning with water at high pressure
The rotating machine removes resin using water with high-pressure and grinding machine
Dry ice washing machine, cleaning machine, cleaning with water at high pressure
Hydraulic Press No Yes No (has wheel in workplace)
Welding Has large welding facility Same as left Small scale, has manual welding facility
Maintenance facility for AC equipment
No
Other facilities - Except those for the manufacture of electric motor frame, all manufacturing facilities for rotating equipment are available. Rehabilitation covers the entire electric car, except the car body.
All other facilities for manufacturing rotating equipment are available except for those required for the manufacture of electric motor frame (workplace for rotating equipment).
Environm
ent
Number of dust-proof buildings
No
Electrostatic Environment
No electrostatic area
Main
tenan
ce fu
nctio
n
Drawings, Manuals Can use the IEM system to access drawings and manuals from the TFR server
Maintenance Plan, Overhaul Plan
Business Manager uses SAP to prepare OH schedule.

4-58
Items of Survey Koedoespoort Workshop Salt River Workshop
*Only surveyed the rotating equipment building
Durban Workshop *Only surveyed the locomotive rehabilitation
building
Evidence-related
Record of scheduled maintenance and inspection, inspection report, check sheet, fault data, and record of repairs
Stored in binders by individual vehicle at the Production Planning Office (PCO). Fault data are inputted into SAP.
Record and notice of analyses and countermeasures for failures
(1) When rolling stock malfunctions: Verify the failure -> The engineer and supervisor will investigate the failure and review countermeasures->Record the results of countermeasures on Non Conformance Report->Submit the report to PCO where the data is inputted into SAP
No department to facilitate peer group review of the viability of countermeasures
- No department to facilitate peer group review of the viability of countermeasures
- - (3) Notification of repairs: QA prepares the Non Conformance Report (NCR). Worker groups conduct quality meeting every week to investigate the causes of failures and implement countermeasures.
Trouble-shooting Each workplace has its own trouble-shooting information but no summarized information as a whole.
Same as left IEM is storing trouble-shooting information.
Main
tenan
ceteam Map of skill Yes

4-59
Items of Survey Koedoespoort Workshop Salt River Workshop
*Only surveyed the rotating equipment building
Durban Workshop *Only surveyed the locomotive rehabilitation
building
Plan of education and training
There is an SOE inside the workshop. SAP is used to make education and training plans. The SOE prepares and implements education plans.
Same as left The SOE is on the workshop premises in the Umbilo area of Durban. SAP is used to make education and training plans. The SOE prepares and implements education plans.
Record of education and training
Store education record in the SAP
Map of techniques such as welding, soldering, crane, forklift
Submit special education plan using SAP and provide education according to the plan. Store record in SAP.
Acquisition of qualification
No particular qualification. Only certificate of completion
Management by Target
Use SAP to manage the skills target
Others The SOE provides education to newly hired and current employees. The SOE curriculum for current employees includes general education on rolling stock system (PHASE1 2 3 4, total of 173 days) in the first year upon joining the company and individual curriculum for each locomotive type and curriculum of special skills.

4-60
Items of Survey Koedoespoort Workshop Salt River Workshop
*Only surveyed the rotating equipment building
Durban Workshop *Only surveyed the locomotive rehabilitation
building
Condition of repaired parts
Kinds Almost all the electric and mechanical parts of the old locomotives are repaired and stored.
The rotating equipment, MA/MG, and compressors of old locomotives that can be repaired by the workshop are stored at the workshop. The GE motor parts are stored by GE at the Koedoespoort workshop.
Stores parts for the overhaul of locomotives and replacement parts. Does not store small equipment, such as electrical devices, etc.
Condition of storage Used parts are stored together with new parts. Same as left Mainly new parts
Others Can conduct detailed study and restoration of circuit boards
- -
Condition of spare parts
Kinds At COE, the main parts are stored in the warehouse as the assets of each manufacturer. Whenever TRE needs to use the parts, it will pay for them. The manufacturer will then replenish the parts.
The workshop stores parts for the rotating equipment. The GE motor parts that have long lead-time are stored at Koedoespoort. The workshop will only request the necessary quantity.
The workshop stores mainly spare parts for the overhaul of the locomotive as a whole. The spare parts for individual equipment are stored at RM, RSE, and electrical equipment shops.
Condition of storage The overall storage condition is not clear. Organized and stored in large warehouse Organized and stored in large warehouse
Name of company of procurement
Old locomotive parts are mostly procured from local manufacturers and distributors.
The workshop obtains most of the Series 9E parts from ACTON, diesel electric locomotive parts from GE, and bearings from NSK or NTN in Japan.
The workshop purchases most of the spare parts through local manufacturers and distributors. Only the spare parts of Series 10E are bought through ACTON.

4-61
Items of Survey Koedoespoort Workshop Salt River Workshop
*Only surveyed the rotating equipment building
Durban Workshop *Only surveyed the locomotive rehabilitation
building
Outsource
Name of company of procurement
Various locomotive manufacturers, local manufacturers, and distributors
The spare parts of rotating equipment are mostly bought from ACTON and GE. The others are from manufacturers and distributors in South Africa. Bearings are bought from NSK and NTN in Japan.
Only the spare parts of the rotating equipment of Series 10E are purchased from ACTON. The others are procured from local manufacturers and distributors in South Africa. The pantograph is from its RSE department and Siemens. The VESVCB is from Siemens and ACTOM. The compressors are from its RM department. The brakes are from its RSE department. The braking resistors are from Telema. Some of the electric parts are from Mitsui.
Name of company doing inspection
TRE does the inspection but depending on its workload, it might ask local manufacturers or distributors to do the inspection. They are ACTON (rotating equipment), Electra (refurbishment of the IBGT of Series 10E), etc.
The inspection of rotating equipment is mostly done by ACTON and GE. The others are inspected by local manufacturers and distributors in South Africa.
The workshop asks ACTON to inspect the rotating equipment of Series 10E and 10E2 and local manufacturers and distributors to inspect the others. Pantograph: RSE and Siemens. VESVCB: Siemens and ACTOM. Compressor: its RM department. Brake: its RSE department. Braking resistor: Telema. Some electric parts: Mitsui.

4-62
Items of Survey Koedoespoort Workshop Salt River Workshop
*Only surveyed the rotating equipment building
Durban Workshop *Only surveyed the locomotive rehabilitation
building
Kind of equipment for repair to be outsourced
Toshiba asks TRE to repair the motors of Series 19E. It will be done at Koedoespoort. TRE does the repairs of the others but depending on the workload and cost, it might ask local manufacturers or distributors to do the repair.
The workshop does not outsource repairs of the rotating equipment of old locomotives. If the workload is too high, it will contract the work to other workshops in the company.
The workshop only asks ACTON to repair Series 10E. It does not outsource the others.
Name of company doing the repair
ACTON (rotating equipment), Electra (refurbishment of IBGT for Series 10E), etc.
The workshop mainly asks ACTON and GE to do the repair of rotating equipment. The others are repaired by local manufacturers and distributors in South Africa It uses NSK and NTN for repairing the bearing.
For the repair of rotating equipment, the workshop only purchases parts from ACTON for Series 10E and 10E2. The others are purchased from local manufacturers and distributors in South Africa. <Main companies for repairs> Pantograph: its RSE department and Siemens. VESVCB: Siemens and ACTOM. Compressor: its RM department. Brake: its RSE department. Braking resistor: Telema. Some electric parts: Mitsui

4-63
(b) Depots
Items of Survey Kimberley Depot Richards Bay Depot Ermelo Depot Saldanha Depot
Overview
Number of electric locomotives in possession
[EL] Series 6E, 7E, 7E2, 8E, 10E, 10E2, and 18E [DEL] Class 3, 34, and 35 Approximately 195 locomotives
[EL] Series 7E1, 7E3, 7E4, 11E, and 19E [DEL] Class 34, 35, 36, 37, and 39 Approximately 313 locomotives
[EL] Series 10E and19E [DEL] Class 34 and 37 Approximately 224 locomotives
[EL] Series 9E and 15E [DEL] Class 34 and 43 Total of 156 locomotives
Usage of electronic parts Has COE Can maintain and repair the control equipment of old locomotives
No COE Can maintain and repair some high-voltage equipment of old locomotives
No COE Can maintain and repair some high-voltage equipment of old locomotives
No COE Can maintain and repair from high-voltage equipment to control system of old locomotives
Work contents
A-, B-, C-, D-Shed Yes Yes Yes Yes
Overhaul of control equipment
Yes No No Yes
Overhaul of high-voltage electric equipment
Yes Yes Yes Yes
Overhaul of bogie Some (mainly outsource) Some (mainly outsource) Some (mainly outsource) Some (mainly outsource)
Overhaul of motor Some (mainly outsource) Some (mainly outsource) Some (mainly outsource) Some (mainly outsource)
Overhaul of car body Some (only replacement of equipment)
Some (only replacement of equipment)
Some (only replacement of equipment)
Some (only replacement of equipment))

4-64
Items of Survey Kimberley Depot Richards Bay Depot Ermelo Depot Saldanha Depot
Organization
Number of employees 107 (total number of workers and managers)
N/A N/A 100
Name and number of Organizations
As generally shown in Figure 4-, may differ by depot
Facilities-related
Facility /equipment for maintenance
Wheel reprofiling machine No No Yes Yes
Motor testing facility No No No No
Testing facility for high-voltage electric equipment
Yes Yes Yes Yes
Testing facility for control-type electric equipment
Yes Yes Yes Yes
Equipment cleaning facility Yes Yes Yes Yes
Washing machine (purpose and scale)
Dry ice washing machine, cleaning machine, cleaning with water at high pressure
Hydraulic press No No No No (for freight train use only)
Welding Small welding facility (outsource large welding)

4-65
Items of Survey Kimberley Depot Richards Bay Depot Ermelo Depot Saldanha Depot
Maintenance facility for AC equipment
No
Other facilities - - - Detailers take care of the rooftop equipment. PC has been set up to work on making Shed works paperless.
Environm
ent
Number of dust-proof buildings
No
Electrostatic environment No electrostatic environment
Main
tenan
cefu
nctio
n
Drawings, manuals Can use the IEM system to access drawings and manuals from TFR server
Maintenance plan, overhaul plan
Business Manager uses SAP to prepare OH schedule.
Evidence-related
Record of scheduled maintenance and inspection, inspection report, check sheet, fault data and record of repairs
Store in binders by individual vehicle at the Production Planning Office (PCO). Fault data are inputted into SAP.
Record and notice of analyses and countermeasures for failures
When rolling stock malfunctions: Verify the failure The engineer and supervisor will investigate and review countermeasures for the rolling stock Record the results of countermeasures on Non Conformance Report Submit the report to PCO where the data is inputted into SAP
No department to facilitate peer group review of the viability of countermeasures
- - -

4-66
Items of Survey Kimberley Depot Richards Bay Depot Ermelo Depot Saldanha Depot
Trouble-shooting Each workplace has its own trouble-shooting information but no summarized information as a whole.
Uses trouble-shooting sheet to resolve problems
Same as left
Same as left
Maintenance team
Map of skill Yes
Plan of education and training
There is a SOE inside the workshop. SAP is used to make education and training plans. The SOE prepares and implements education plans.
SAP is used to make education and training plans. The SOE prepares and implements education plans.
The depot receives directions from outside personnel in charge of education and lets its trainees go to Ermelo or other designated classrooms to receive education.
The depot has set up a new SOE. It uses SAP to make education and training plans. The SOE prepares and implements education plans.
Record of education and training
Stores education record in SAP Same as left Stores education record in paper form
Same as left
Map of techniques such as welding, soldering, crane, forklift
Submit special education plan using SAP and provide education according to the plan. Store record in SAP.
Acquisition of qualification No particular qualification. Only certificate of completion
Management by Target Use SAP to manage the skills target
Others SOE provides education to newly hired and current employees. The SOE curriculum for current employees includes general education on rolling stock system (PHASE1 2 3 4, total of 173 days) in the first year upon joining the company and individual curriculum for each locomotive type and curriculum of special skills.

4-67
Items of Survey Kimberley Depot Richards Bay Depot Ermelo Depot Saldanha Depot
Condition of repaired item
s
Kinds The electric and mechanical parts of old locomotives are repaired and stored.
The electric and mechanical parts of old locomotives are repaired and stored. Repair of the new Series 19E locomotives is done by the manufacturer.
Same as left The electric and mechanical parts of old locomotives are repaired and stored. Repair of the new Series 15E locomotives is done by the manufacturer.
Condition of storage Used parts are stored together with the new parts.
Others Can conduct detailed study and restoration of circuit boards
- - -
Condition of spare parts
Kinds Stores main component parts Series 18E and other old locomotives: Stores used units, including main equipment
Stores main component parts Series 19E: pantograph, others Other old locomotives: Stores used units, including main equipment
Stores main component parts Series 19E: pantograph, others Series 10E and other old locomotives: Stores used units, including main equipment
Stores main component parts Series 15E: IGBT unit, motor, main transformer (2 units), pantograph, and others Series 9E: Stores almost all units, including used parts
Condition of storage Stores in mid-sized warehouse Temporarily stores in maintenance shop because the workshop is in the process of building an additional warehouse
Stores in mid-sized warehouse, some stored in a messy condition
Organizes and stores in large warehouse

4-68
Items of Survey Kimberley Depot Richards Bay Depot Ermelo Depot Saldanha Depot
Name of company of procurement
ACTON performs all the maintenance and repairs, including Series 10E and 7E, of rotating equipment, including the replacement of bearing. Other parts are also purchased from local manufacturers and distributors.
The electrical parts of Series 19E are procured from Toshiba. The parts procured from South Africa are purchased directly from the manufacturers. The spare parts of other old locomotives are mostly procured from local manufacturers.
Same as left The electrical parts of Series 15E are procured from Toshiba. The parts procured from South Africa are purchased directly from the manufacturers. Most of the parts of Series 9E are procured from ACTON. The engines and other parts of DEL are procured from locomotive manufacturers.
Outsource
Kinds of parts procured Various parts, including electrical and mechanical parts
Series 19E: rotating equipment, HSCB, and others Other old locomotives: Various parts, including electric and mechanical parts
Same as left Series 15E: IGBT unit, motor, main transformer, and others Series 9E: rotating equipment, brake, MA/MG, thyristor, pantograph, etc.
Name of company of procurement
Various parts are procured from local manufacturers and distributors: ACTON (rotating equipment), Knorr (brake), WabTec (electric equipment), etc. The rotating equipment of Series 10E is from ACTON and IGBT is from Electra (Italy). Since Toshiba’s lead-time is long, it seldom receives any order.
Series 19E: The electric parts are procured from Toshiba. Other mechanical parts are procured directly from local manufacturers and distributors. Other old locomotives: All parts are procured from local manufacturers and distributors, ACTON (rotating equipment), Knorr (brake), WabTec (electrical equipment), and Sécheron (HSCB), etc.
Same as left Series 15E: Toshiba (electric parts), Knorr (brake), VCB (ALSTOM), RSD (bogie), etc. Series 9E: ACTON (rotating equipment), Knorr (brake), LHM (MA/MG), ALSTOM (thyristor, diode), Siemens (pantograph), etc. DEL: Various manufacturers (engine), etc.

4-69
Items of Survey Kimberley Depot Richards Bay Depot Ermelo Depot Saldanha Depot
Kinds of tests and inspection to be outsourced
May outsource the inspection of individual equipment, including electric and mechanical equipment
Series 19E: plans to outsource the inspection of rotating equipment, HSCB, and others Other old locomotives: May outsource the inspection of various parts, including electric and mechanical parts
Same as left Series 15E: IGBT unit, motor, main transformer, and others Series 9E: rotating equipment, brake, MA/MG, thyristor, diode, pantograph, etc.
Name of company performing inspection
The various parts are handled internally at TRE. Depending on the workload, the depot may ask local manufacturers and distributors to do the inspection: ACTON (rotating equipment), Knorr (brake), Electra (refurbishment of IGBT and electrical equipment)
Series 19E: The depot asks Toshiba to inspect the electric parts and other local manufacturers and distributors to inspect the mechanical parts. Other old locomotives: The various parts are inspected internally at TRE. Depending on the workload, the depot may ask local manufacturers and distributors to do the inspection: ACTON (rotating equipment), Knorr (brake), WabTec (electrical equipment), and Secheron (HSCB), etc.
Same as left Series 15E: Directly requests the manufacturer to do the inspection. Series 9E: ACTON (rotating equipment), Knorr (brake), LHM (MA), ALSTOM (thyristor, diode, etc.), Siemens (pantograph), etc. DEL: Various manufacturers (engine), etc.

4-70
Items of Survey Kimberley Depot Richards Bay Depot Ermelo Depot Saldanha Depot
Kind of equipment for repair to be outsourced
The repairs are done at Koedoespoort or Durban. When it is not possible, a public bidding is held to decide on a manufacturer.
Series 19E: Requests Toshiba to repair the electric equipment and UCW to repair the mechanical equipment during the warranty period. No decision has been made for repairs after the end of the warranty period. Other old locomotives: The repairs are done at Koedoespoort or Durban. When it is not possible, a public bidding is held to decide on a manufacturer.
Same as left Series 15E: Requests Toshiba to repair the electric equipment and UCW to repair the mechanical equipment during the warranty period of electric locomotives. Also requests repairs after the warranty period (outside the contract). Series 9E: Salt River Workshop repairs the rotating equipment; if not possible, ACTON will be asked to do the repair.
Name of company performing the repair
Pantograph: RSE department, Siemens, etc. Rotating equipment: ACTON. Brake: Knorr, MA/MG: LHM, Thyristor diode: ALSTOM, Power unit: Electra, etc. DEL: Various manufacturers (engine), etc.
(1) Series 19E: Toshiba and UCW (2) Other old locomotives: Pantograph: RSE department, Siemens, etc. Rotating equipment: ACTON, Brake: Knorr, MA/MG: LHM, thyristor diode: ALSTOM, Power unit: Electra, etc. (3) DEL: Various manufacturers (engine), etc.
Same as left (1) Series 15E: Toshiba and UCW (2) Series 9E: Pantograph: RSE department and Siemens, Rotating equipment: ACTON, Brake: Knorr, MA/MG: LHM, Thyristor diode: ALSTOM, etc. (3) DEL: Various manufacturers (engine), etc.
Source: Compiled by Study Team

4-71
(2) Challenges
The Study Team identified problems and issues from the results of this Survey.
1) Problems in the Maintenance of Electric Locomotives a) Insufficient Maintenance Facilities The new-type electric locomotives introduced after 2008 use inverter as the driving device and an AC system. As is the case in conventional DC system, without adequate maintenance facilities, faulty parts will spread in systems on a locomotive, making it impossible to repair. Thus, it will not be possible to secure the number of electric locomotives for operation, thus seriously interrupting train operation.
TRE has sufficient facilities and experience for the maintenance of electric locomotives (EL) with a DC system and diesel electric locomotives (DEL). It also has a plan to set up facilities for AC main motors in the future. However, none of the workshops or depots has any plan to install facilities for maintaining electrical equipment of the new-type electric locomotives besides the main motor. b) Lack of Maintenance Technology Since all the equipment (control system and power semi-conductor) of the new-type EL uses the latest technologies, their maintenance method and diagnostic/repair method are different from the conventional locomotives. In particular, a greater part of the control system relies on software. TRE needs to acquire the latest technologies and accumulate technological expertise through technical assistance from the manufacturers. However, at this time, TRE only has contracts with manufacturers for 2–3 months training, showing insufficient cooperation with the manufacturers in acquiring and accumulating the latest technologies. c) Lack of Maintenance Items Similar to the conventional EL, the new-type EL also needs to have proper maintenance as recommended by the manufacturer. Through verification of the check sheet used at A–D-Shed and interviews of TRE personnel, the Study Team found that the following maintenance items have not been implemented:
- Measurement of the operating voltage (reference value) of electric relay/contactor - Measurement of power source-related voltage - Measurement of breaker-related cutoff standard - Verification of the operation of sensor and other stand alone units (voltage/electric
current/temperature/rotation frequency of main motor/speed) - Verification of control sequence - Verification of control protection sequence - Control sequence test as the final verification before start of high voltage - Measurement of condenser capacity and tan δ - Inspection for soldering cracks, etc. - Measurement of the light volume of optical fiber - Verification of the soundness of protective circuit The electric equipment of a locomotive has circuits to protect the equipment in case of failure in order to minimize damage. In Japan, after maintenance and before the restart of voltage to the main motor again, it is a standard procedure to verify the soundness of the protective circuit mounted on the train car. However, TRE does not have such verification procedure. d) Verification of Mechanical Cracks TRE verifies cracks on the bogie, main motor frame, coupler, and others by checking the color. However, it does not inspect for axle cracks, with the commonly used magnetic particle testing

4-72
and ultrasonic testing. Axle cracks can lead to derailment and other serious accidents. An example of axle damage was the derailment of a freight train on the Tsugaru-kaikyo Line in Japan on December 6, 2000. It was caused by damage to the axle. e) Cleaning It is necessary to clean electrical parts in order to maintain insulation and prevent poor contact.
During our survey at the Richards Bay depot, the Study Tean found that the contact points of electrical parts (IGBT unit) of the Series 19E electric locomotive were dark after about eight months in service. According to the results of our Survey conducted at various depots, cleaning was not carried out sufficiently. The inside of electrical parts of the new-type EL is inspected visually and some parts are only cleaned with a brush. Table 4-22 shows the status and issues related to the maintenance of electric locomotives.
Table 4-22 Status and Issues related to the Maintenance of Electric Locomotives
Item New-type locomotive
(AC main motor) Old-type locomotive
(DC main motor)
Maintenance facility Has plan for main motor only
Installed
Maintenance technology Not sufficient Sufficient Maintenance item Not sufficient Not sufficient Testing facility Not available Part of it not available Analysis of failures and causes
Not sufficient Not sufficient
Spare parts Not sufficient Not sufficient
Source: Compiled by Study Team
2) Issues related to Spare Parts a) Shortage of Spare Parts due to Long Lead Time of Overseas Procurement It takes over 8 months for TRE to import electronic parts from overseas manufacturers, making it impossible for it to do repair quickly. b) Inability to Manufacture or Procure due to Abolition of Spare Parts or Closure of Factories It is not possible to manufacture or procure the necessary parts for repair if the parts are abolished or if the factory is closed. c) Insufficient Measures to Facilitate Long-term Storage The electronic parts of the latest electric locomotives must be stored at an appropriate area where there is protection against dust, moisture, and statics in order to prevent degradation. Their functions must be verified on a regular basis. However, TRE does not store the electronic parts properly for long term, such as storing the electronic circuit boards and others in antistatic bags.
3) Issues related to Failures a) Insufficient Analysis of the Causes of Failures Analyzing the causes of failures properly, such as by utilizing fault data, makes it easier to identify the causes and speed up repairs. However, even if the train stops due to failure, there is still leeway in the train operation diagram and no obligation to report the details to the government. There is an established mindset that “it’s fine as long as the repair is done.” TRE has not sufficiently utilized the fault data to analyze the causes of failures.

4-73
b) Insufficient Preparation for Trouble-shooting It is necessary to resolve accurately and speedily the troubles when they occur so as not to interrupt the operation plan of the locomotives. As a maintenance company, TRE needs to take measures to learn trouble-shooting methods from the equipment manufacturers in order to prepare for the expiration of the warranty period.
However, TRE is relying on the manufacturers to do the trouble-shooting at this time. It has not taken any of the abovementioned measures. c) Insufficient Effort to Enhance the Efficiency of Failure Investigation Due to the introduction of non-contact main circuit and inverter control, the latest locomotives use many electronic devices (electronic parts). These electronic devices have complicated circuits and are equipped with black boxes. Without the help of the manufacturers, it is difficult to investigate the failures. During the warranty period, TRE is depending on the manufacturers to conduct failure investigation when the electronic equipment fails. However, manufacturers vary in their services after the warranty period. TRE shall take initiatives to ensure efficient investigation of failures after the end of the warranty period such as by adopting special testing equipment with the help of the manufacturers. d) Insufficient Succession of Maintenance Technology and Technology Certification TRE is taking measures to encourage veteran technicians to pass on the skills to young technicians. However, due to insecurity about losing one’s job once the expertise has been taught, the succession of maintenance technology has not made much progress. Apart from this, TRE is requesting equipment manufacturers to give certification to its employees for the skills and technologies that they have acquired. Besides GE, the manufacturers have not issued any certificates. 4.5.3 Measures for Improving the Maintenance of Locomotives
(1) Assistance in Raising the Current Maintenance Level
South Africa is a resource-rich country. The locomotive industry, which provides the means to transport resources, is viewed as an important and growing industry. Improving the technology of a locomotive maintenance company, such as TRE, is vital to maintaining and extending the useful life of locomotives.
The following initiatives can help to enhance the level of maintenance at TRE, which is currently carrying out mainly an after-the-fact kind of maintenance. It is important to provide the necessary inspection steadily to improve efficiency.
1) Provide the Latest Maintenance Facilities and Technologies - Provide maintenance facilities and technical guidance for the electric equipment of the latest
electric locomotives - Provide testing facilities and technical guidance to enhance the efficiency of maintenance
operation - Dispatch engineers to provide guidance in maintenance technology - Invite TRE engineers and operators to Japan to receive education and training - Provide support and guidance locally to help revise maintenance items 2) Provide Solutions to Various Issues related to Spare Parts - Expand the methods of storing spare parts inside and outside of South Africa TRE has been working with manufacturers to keep inventory of some of the spare parts that have long lead-time overseas or in South Africa. This method shall expand the overall level.

4-74
- Help research suppliers of alternative products and new suppliers Support research to find alternative products and new suppliers for abolished parts or after the closure of factory
- Provide guidance in product management to enable long-term storage of electronic parts 3) Provide Technology for Analyzing Failures - Supervise and support analysis to identify the causes of failures - Supervise and support trouble-shooting - Help obtain special testing equipment and manuals for investigating failures - Supervise and support failure analysis using the abovementioned special testing equipment 4) Provide Support in Devising Mechanism to Pass on Maintenance Technologies - Support the preparation of manuals to record the expertise and knowledge of veteran
workers Support the formation of a job appraisal system to give incentive to veteran workers to compile manuals documenting their expertise and knowledge by making them fully understand the merits of passing on the maintenance technologies to the young generation.
- Cooperate in the issuance of certificates by manufacturers Manufacturers shall cooperate with TRE to issue certificates to TRE workers who have received certain education and training. (2) Support Deterioration Investigation and Prevention Maintenance
TRE approaches maintenance after the fact, which is to repair the equipment after it fails.
The policy of TFR is to use locomotives for fifty years in an economic manner. In order to enhance the transport capacity of resources and general freight, the following assistance will be effective:
- For the electronic parts, it is effective to study the samples of items that have been identified as not having been sufficiently inspected on a regular basis
- Based on the research findings in Japan, it is effective to conduct deterioration study for electrolytic capacitor, printed circuit board, AVR, insulated amplifier, and optical parts.
- It is also necessary to consider alternatives of abolished parts. By identifying the symptoms of deterioration through deterioration study, it is possible to consider preventive maintenance such as by finding alternative parts at an early stage.
Since TRE does not have any experience in deterioration study, such studies can help it make preventive maintenance plans and use locomotives more efficiently by receiving support in preventive maintenance activities based on deterioration studies.