data bulletin september 2017 - financial conduct authority · data bulletin september 2017 in...
TRANSCRIPT

Data BulletinSeptember 2017
In focus:• Latest trends in the retirement income market• Highlights from the FCA and Practitioner Panel Survey 2017
Issue 10

2
Financial Conduct AuthorityData Bulletin: Issue 10 – September 2017
Jo HillDirector of Market Intelligence, Data and Analysis
Welcome to our tenth issue of the Data Bulletin. In this bulletin we focus on two themes. Firstly, we look at the latest trends in the retirement income market data from October 2016 to March 2017. Our last update was in issue 8, which was published in February 2017. This time we now have two years’ worth of data, which has been valuable in highlighting trends in the retirement income market since the pension reforms.Secondly, we provide a summary update of our annual firm feedback questionnaire. This covers fieldwork conducted from March to April 2017, and was published in full on our website in July 2017. In previous years, the FCA Practitioner Panel conducted a separate survey to understand what the industry thinks about the FCA. In response to your feedback, this year we worked together to ask firms to complete a single survey.If you have any feedback or suggestions about future data you are interested in, please let us know at [email protected]. You can also complete our anonymous user survey. This provides us with feedback and gives us an insight into how you use the Data Bulletin, all of which helps us to focus future editions to areas of most interest.Jo Hill Director of Market Intelligence, Data and Analysis
Contents3 Section 1: Latest trends in the retirement income market11 Section 2: Highlights from the FCA and Practitioner Panel Survey 201718 In case you missed them
Introductionfrom the editor
Introduction

This followed a significant peak in business at the start of the new tax year (April to September 2016)
fall in the overall number of pension pots accessed between October 2016 and March 2017, from the previous six month period
8%
3
Financial Conduct AuthorityData Bulletin: Issue 10 – September 2017
Section 1
Accessing pension pots
Key findings
This was driven by
21% fall in the number of annuities purchased
11% fall in the number of full cash withdrawals from the previous six month period
9%increase in the overall number of pension pots accessed compared with the same period last year (October 2015 to March 2016)
Much of the growth in the overall number of pension pots accessed from a year ago is due to the number of full cash withdrawals, which grew by
from the same period last year
While the number of annuity sales fell by
16%
18%
to their lowest level since the pension freedoms were introduced
The market for drawdown grew by
from the same period last year
It remains at broadly the same level following the spike in activity in the previous six months
More than twice as many pots are moving into drawdown than annuities
4%

4
Financial Conduct AuthorityData Bulletin: Issue 10 – September 2017
This section looks at the latest trends in the retirement income market since the introduction of pension freedoms.1 It is based on the latest data covering the six month period between October 2016 and March 2017.2 We focus on the different ways both new and existing customers access their pension pots and how they use regulated advisers. Our previous
update covering the period April to September 2016 was featured in issue 8 of our Data Bulletin published in February 2017. This latest update follows the interim findings from the Retirement Outcomes Review. This is the first major comprehensive study into how the retirement income market is changing since the pension freedoms, which was published in July 2017.3 The full data used to produce
the analysis can be found in the data tables that are published alongside the bulletin. In previous editions we collected retirement income returns from providers on a quarterly basis. However as we are now collecting data covering a full six month period, we have restated the data from the previous editions. This will enable us to make a consistent comparison.
Section 1:Latest trends in the retirement income marketOctober 2016 – March 2017
Section 1
1. This only reflects what consumers are doing with one DC pension pot and does not reflect their overall wealth to fund retirement income. To see analy-sis of what other savings consumers have to fund their retirement see the Retirement Outcomes Review.2. Our latest tranche of data is based on the returns from 55 firms representative of all retirement solutions and pension providers. This covers 95% of the market for DC scheme providers. All data collected refers to the number of pots accessed and used, rather than the number of consumers, as some consumers may have multiple pension pots. 3. https://www.fca.org.uk/publications/market-studies/retirement-outcomes-review
Oct 2016 - Mar 2017 % change from
previous period (Apr - Sept 2016)
% change from same period last year (Oct 2015 - Mar 2016)
Total pots accessed for the first time to take an income or fully withdraw 276,761 ▼ -8% ▲ 9%
Annuities purchased 33,561 ▼ -21% ▼ -16%
New income drawdown policies entered into and not fully withdrawn 83,687 0% ▲ 4%
Pots where first partial uncrystallised fund pension lump sum (UFPLS) payment taken and not fully withdrawn
8,707 ▲ 16% ▲ 29%
Full cash withdrawals (by new customers) 150,806 ▼ -11% ▲ 18%

5
Financial Conduct AuthorityData Bulletin: Issue 10 – September 2017
In detail
There has been a significant fall in the number of annuities purchased compared to the previous six month period. Between October 2016 and March 2017, 33,561 annuities were purchased. This is 8,810 (21%) fewer than the 42,371 purchased between April and September 2016. The vast majority of this fall was among customers aged 55-64 (4,411 fewer) and 65-74 (4,208 fewer). There have been falls in the number of annuities purchased across almost all pot sizes, except for those £250,000 and above. Notably there was a particularly large fall among smaller pot sizes (£10,000 - £29,000).
The number of plans entering partial drawdown products is broadly at the same level as in the previous six month period between April and September 2016. During this time 83,450 partially withdrawn products were entered into. There has been a 4% increase from the same period last year (October 2015 to March 2016) when partial drawdown was entered into on 80,182 plans.
The majority of this growth comes from those aged 65+. They entered partial drawdown on 2,959 more plans between October 2016 and March 2017 than in the same period last year. This is partly offset by a small fall in the overall number of partial drawdown plans entered into by those aged 55-64 over the same period, most significant for those with pot sizes £10,000-£49,000.
Partial UFPLS payments taken and not fully withdrawn continued their steady increase between October 2016 to March 2017.
The number of full cash withdrawals made by new customers between October 2016 to March 2017 fell by 17,959 (11%) from the previous six month period. This is almost entirely concentrated among those with low value pot sizes (less than £29,000). However compared to the same period last year, the number of full cash withdrawals increased by 22,898 (18%).
Section 1
6
Financial Conduct AuthorityData Bulletin: Issue 10 – September 2017
Consumer choices
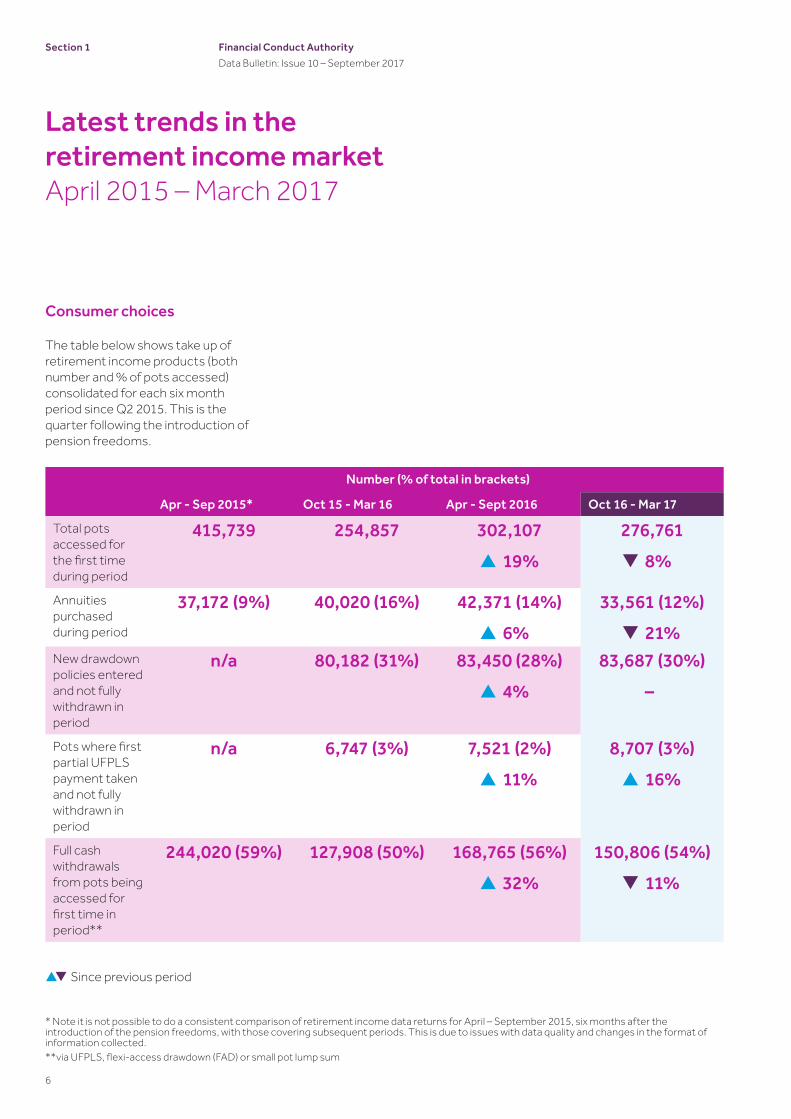
The table below shows take up of retirement income products (both number and % of pots accessed) consolidated for each six month period since Q2 2015. This is the quarter following the introduction of pension freedoms.
Section 1
Latest trends in the retirement income marketApril 2015 – March 2017
Number (% of total in brackets)
Apr - Sep 2015* Oct 15 - Mar 16 Apr - Sept 2016 Oct 16 - Mar 17
Total pots accessed for the first time during period
415,739 254,857 302,107 ▲19%
276,761 ▼8%
Annuities purchased during period
37,172 (9%) 40,020 (16%) 42,371 (14%) ▲6%
33,561 (12%) ▼21%
New drawdown policies entered and not fully withdrawn in period
n/a 80,182 (31%) 83,450 (28%) ▲4%
83,687 (30%) –
Pots where first partial UFPLS payment taken and not fully withdrawn in period
n/a 6,747 (3%) 7,521 (2%) ▲11%
8,707 (3%) ▲16%
Full cash withdrawals from pots being accessed for first time in period**
244,020 (59%) 127,908 (50%) 168,765 (56%) ▲32%
150,806 (54%) ▼11%
* Note it is not possible to do a consistent comparison of retirement income data returns for April – September 2015, six months after the introduction of the pension freedoms, with those covering subsequent periods. This is due to issues with data quality and changes in the format of information collected.**via UFPLS, flexi-access drawdown (FAD) or small pot lump sum
▲▼Since previous period

7
Financial Conduct AuthorityData Bulletin: Issue 10 – September 2017
There was an initial spike in pension access activity in the six months after the introduction of the pension freedoms in April 2015. Subsequently the market seems to have settled down. There was a gradual decline in the total number of pension pots being accessed for the first time over the next two quarters (October 2015 to March 2016).
In the following six month period, between April and September 2016, there was another peak in retirement income sales. This coincided with the start of a new tax year and was driven by a 32% increase in the number of full cash withdrawals. However this was not as significantly reflected in drawdown numbers, which increased by 4% from the previous six month period.
During the period between October 2015 and September 2016, drawdown products outsold annuities at a relatively stable rate of 2:1. The number of new drawdown policies entered into remained stable in the following six month period between October 2016 and March 2017. However there was a significant fall in the number of annuities purchased during this period, reaching the lowest level since the pension freedoms were introduced. This suggests more people are entering into new drawdown plans than are purchasing an annuity.
The number of full cash withdrawals has declined in the latest six month period to 150,806. However they are still the most used method by consumers to access small pension pots accounting for 54% of all pots accessed and 86% of pots less than £10,000.
Section 1
of pension pots accessed between October 2016 and March 2017
Full cash withdrawals account for
54%
Figure 1 – Number of pots accessed by product type since April 2015
37,1
72
244,
020
127,
908 16
8,76
5
150,
806
6,74
7
7,52
1
8,70
7
40,0
20
42,3
71
33,5
61
80,1
82
83,4
50
83,6
87
Apr - Sept 2015* Oct 2015- Mar 2016 Apr- Sept 2016 Oct 2016 - Mar 2017
*Figures on drawdown and UFPLS were not collected in the same format between July and September 2015 and therefore have been omitted for this period.
nPots where first partial UFPLS payment not taken and not fully withdrawn in periodnAnnuities purchased during periodnNew drawdown policies entered and not fully withdrawn in periodnFull cash withdrawal from pots being accessed for the first time in periodl Total pots accessed for the first time
415,739
254,857
302,107
276,761

8
Financial Conduct AuthorityData Bulletin: Issue 10 – September 2017
Product purchases by pot size and age
October 2016 - March 2017Figures 2 and 3 show how access to pension pots between October 2016 and March 2017 varied by pot size and age.
Figure 2 shows that the majority of people with small pot sizes below £29,000 tend to access their pots by making full cash withdrawals. This accounts for the majority of pension pots accessed.
The propensity to withdraw reduces with pot size. For pot sizes above £30,000 people increasingly prefer to enter drawdown policies rather than make full cash withdrawals from their pension pot. Therefore while over half of pots (54%) accessed between October 2016 and March 2017 were fully withdrawn, these are mostly small with the large majority below £30,000.
Figure 3 shows that between October 2016 and March 2017 most consumers aged below 65 chose to make full cash withdrawals or partial drawdowns from their pensions pots rather than a regular income stream through an annuity. However a greater proportion of those aged 65+ chose to take an annuity.
Section 1
Figure 2 – Composition of product purchases made between October 2016 to March 2017 by pot size
Figure 3 – Composition of product purchases made between October 2016 to March 2017 by age
98,490 73,625 35,435 36,998 22,724 9,489
86% 60% 31% 20% 12% 6% 54%
2%
4%
4%
4%
3%
5%
3%
8%
23%
45%
56%66%
81%
30%
4%
14%20% 20% 18%
9%12%
nFull cash withdrawalsn UFPLS
n Drawdownn Annuities
n Total number of pots accessed
n Annuitiesn Drawdown
n UFPLSnFull cash withdrawals
n Total number of pots accessed
Less than£10,000
Under 55 55-64 65-74 75+ All pot sizes
£10,000 - £29,000
£30,000 - £49,000
£50,000 - £99,000
£100,000 - £249,000
£250,000 and above
All pot sizes
3,913 192,945 75,281 4,621
60% 59% 42% 42% 54%
3%
3% 2%
3%
34%29%
32% 37%
30%
6% 8%
23%19%
12%

9
Financial Conduct AuthorityData Bulletin: Issue 10 – September 2017
Consumer behaviour
During the latest six month period (October 2016 and March 2017), 57% of drawdown customers used their existing provider. This is consistent with the previous six months between April and September 2016, and in line with the steady growth in the drawdown market.
In the same period, 55% of annuity purchases were made by existing customers. This is a reduction from the previous six months when 60% of annuities sales were to existing customers.
There were also 32,333 pensions with guaranteed annuity rates (GARs) that were accessed between October 2016 and March 2017. In 58% of cases the GAR option was not taken up. Of these, around two thirds (67%) were encashed. This compares with 53% of pensions with GARs that were not taken up in the previous period.
Table 1- Consumer behaviour – switching and take up of pensions with guaranteed annuity rates(GARs) between October 2015 and March 2017
Section 1
Retirement income market data October 2015 - March 2017
Number (% of total)
Oct 2015-Mar 2016 Apr-Sept 2016 Oct 2016-Mar 2017
Choosing existing provider
Drawdown: 47,042(59%)
47,730(57%)
47,758(57%)
Annuity purchases: 23,406(58%)
25,252(60%)
18,412(55%)
Pensions with guaranteed annuity rates (GARs)
28,826 33,366 32,333
of which not taken up 62% 53% 58%

Use of regulated advisers4
The data received from our sample of firms show that customers’ use of regulated advisers differs across each product type and by pension pot size. Around a third (34%) of customers purchasing annuities use regulated advisers according to the data for the latest period between October 2016 and March 2017. This has fallen from two fifths (40%) in the same period last year.
The highest levels of adviser use continues to be for customers going into drawdown. This has remained steady at 69%. This means that around 30% of customers accessing their pension pots through drawdown since October 2015 did not take advice. The percentage of drawdown
accessed by existing customers of firms has remained relatively static. This could suggest that customers who access pots early without taking advice may be accepting drawdown from their current pension provider without shopping around. Changes in this percentage could have a big impact on the total advice proportion across the sector.
There was a fall in adviser use among those making full withdrawals from their pension, from 44% between April and September 2016 to 38% in the latest six month period (October 2016 to March 2017).
10
Financial Conduct AuthorityData Bulletin: Issue 10 – September 2017
Section 1
69%of customers used an adviser when going into drawdown
Figure 4 – Percentage of product purchases and withdrawals where provider has recorded use of a regulated adviser (October 2015 - March 2017)
nOct 2015-Mar 2016 n Apr-Sep 2016 nOct 2016-Mar 2017
Annuities Drawdown * UFPLS Full withdrawal **
4. .Some providers cannot determine whether customers used advice when accessing their pots and have instead provided data on whether customers used advice when taking out the original pension.* Where pots were not fully withdrawn. ** Full withdrawals have a different base and includes new and existing customers fully withdrawing in the period.
40%
34% 34%
69% 69% 69%
39%
45%
30% 32%
44%38%
11
Financial Conduct AuthorityData Bulletin: Issue 10 – September 2017
The FCA conducts an annual survey to gather the industry’s views of the FCA’s effectiveness as a regulator across a range of topics:
• our performance including against our objectives
• communication
• trust in the FCA
• enforcement
• international issues
In previous years, the Practitioner Panel has conducted their own survey to understand what the industry thinks. In response to your feedback, this year the FCA has joined forces with the Practitioner Panel to ask firms to complete a single survey.
In this issue of the Data Bulletin we highlight some of the key findings. You can find further information and a full breakdown of the themes explored in the full report.
The latest wave of the survey was conducted by Kantar Public on behalf of the FCA and the Panel. Fieldwork took place between March and April 2017. In total, 2,080 firms completed the survey, constituting a response rate of 21%.
We would like to thank those who took the time to complete the questionnaire, or took part in a follow-up interview.
.
This section provides a summary of the FCA and Practitioner Panel Survey published in July 2017
Section 2:FCA and Practitioner Panel Survey – 2017 ReportOverview
Section 2

Performance of the FCA as a regulator
Firms were asked to rate their satisfaction with their FCA relationship and how effective the FCA has been in regulating the financial services industry in the last year. The rating scale ran from 1 to 10, with 1 being extremely dissatisfied and 10 being extremely satisfied. The results are shown in Figure 5.
Over three quarters (77%) of firms are highly satisfied, scoring more than 7 out of 10, with the relationship they have with the FCA. This is an 8 percentage point increase from the previous year. There was a drop in the proportion of firms that provided low satisfaction ratings (1 to 3 out of 10 from 5% in the previous year to 3%.) As a result, average satisfaction levels among firms have increased from those in the previous year (from 7.2 to 7.5 out of 10). However scores were lower among fixed firms5 compared with flexible firms6 (6.9 compared with 7.5).
On the FCA’s effectiveness as a regulator, there has also been an increase from three fifths (60%) in the previous year to two thirds (68%) in the proportion of firms giving a high rate (scoring at least 7 out of 10). There were also falls in the proportion of firms providing low effectiveness ratings from 8% in the previous year to 5% this year. As a result average effectiveness ratings increased from 6.7 to 7.0.
Performance against our objectives
As shown in Figure 6, there has been an improvement in perception of the FCA’s oversight and ability to deliver on its statutory objectives between 2016 and 2017. However firms appear less confident in the FCA’s ability to achieve the third operational objective to promote effective competition in the interest of consumers.
Financial Conduct AuthorityData Bulletin: Issue 10 – September 2017
Section 2
5..Fixed portfolio firms are a small population of firms (out of the total number regulated by the FCA) that, based on factors such as size, market presence and customer footprint, require the highest level of supervisory attention. These firms are allocated a named individual supervisor and are proactively supervised using a continuous assessment approach.6..Flexible portfolio firms are proactively supervised through a combination of market-based thematic work and programmes of communication, engagement and education activity aligned with the key risks identified for the sector in which the firms operate. These firms use the FCA Customer Contact Centre as their first point of contact as they are not allocated a named individual supervisor.
of firms gave high satisfaction scores (7 to 10) for their relationship with the FCA77%
n 1 to 3 (low) n 4 to 6 n 7 to 10 (high)
Base: All firms : 2017 (2,080); 2016 (3,357); 2015 (4,055); 2014 (3,146); 2013 (1,470); 2010 (4,187); 2008 (4,407)
20%26%26%30%
38%49%
43%
69%69%64%
45%
32%
45%
77%
Figure 5 - Satisfaction with relationship with the FCA (2008 - 2017)
2008 2010 2013 2014 2015 2016 2017
6.1 5.4 5.9 6.9 7.1 7.2 7.5Mean
13% 19% 16% 6% 5% 5% 3%
n 2016 n 2017
Figure 6 – Level of confidence that the FCA’s oversight of the industry will deliver on the following statutory objectives (% very/ fairly confident)
79%74%
79%78% 78%75%
60%56%
Ensuring financial markets function well
Consumer protection Protecting integrity of financial systems
Promoting effective competition
12

13
Financial Conduct AuthorityData Bulletin: Issue 10 – September 2017
Contact and communication
When asked to consider their level of satisfaction with communications from the FCA, firms were on average satisfied scoring 7 out of 10 (Figure 7).
This is a slight improvement from 2016 when 64% gave a high score (at least 7 out of 10) and five per cent gave a low score (3 or less out of 10). Average satisfaction scores among firms remains largely unchanged (7.0, compared with 6.9 in 2016).
In general, as shown in Figure 8, fixed firms had a more positive outlook on FCA communication than flexible firms. The only aspect in which fixed firms are less positive is on the timeliness of FCA communications.
The vast majority of firms (92%) also felt the level of interaction to be ‘about right’. These results are broadly comparable to those seen in 2016. A notable change this year is the drop in the proportion of fixed firms saying that the level of contact was ‘too much’, from 14% in 2016 to 6% in 2017.
Section 2
Fixed
Fixed
Fixed
Fixed
Fixed
Fixed
Flexible
Flexible
Flexible
Flexible
Flexible
Figure 7 – After all the information that you have seen, heard or read about the FCA, how satisfied are you with the communication from the FCA?
3%
30%
67%
Mean7.0
n7 to 10 (high) n 4 to 6 n1 to 3 (low)
nDisagree n Neither agree or disagree n Agree
Base: All firms (2,080)
Base: All firms: Fixed (73); Flexible (2,007)
Figure 8 – Agreement with the statements about FCA communications, by firm type
Overall, the FCA’s communications to my firm are timely
Overall, the FCA’s communications to my firm are useful
Overall, the FCA’s communications to my firm are clear
Overall, the FCA’s expectations of your firm have been articulated clearly
Overall, the FCA’s communications contain the right level of detail to be useful to my firm
12%
18%4%
9%1%
5%
5%
20%
9%
23%
11%
26%
5%
8%
4%
10%
9%
10%
22%
77%
90%
76%20%
91%
72%
86%
68%
80%
64%
62%

14
Financial Conduct AuthorityData Bulletin: Issue 10 – September 2017
Overall trust in the FCA
As was the case last year, the majority of firms (77%) reported that their level of trust in the FCA had stayed the same over the previous 12 months. However, a slightly higher proportion of firms reported that their trust has increased – 18%, compared with 13% in 2016.
The results for trust in FCA supervisors and staff were less clear. Around two fifths of firms tended to agree with trust based statements. However, a significant proportion neither agreed nor disagreed, or responded ‘don’t know’ (Figure 9).
Section 2
Figure 9 – Agreement with statements about FCA supervisors/staff
46%
21%
17%
16%
44%
19%
12%
25%
45%
28%
11%
16%
44%
24%
8%
25%
43%
22%
22%
13%
42%
20%
18%
20%
Base: All firms: 2016 (3,357); 2017 (2,080)
nAgreenDisagree
n Neither agree or disagreenDon’t know
2016
FCA supervisors/staff have sufficient experience
FCA supervisors/ staff exercise good judgement
FCA supervisors/ staff have sufficient knowledge to
understand my firm
2017 2016 2017 2016 2017

Financial Conduct AuthorityData Bulletin: Issue 10 – September 2017
Transparency
Transparency of FCA regulations is a key element of trust. Just over half of firms (53%) agreed that ‘FCA regulation is transparent’. This is a slight improvement since 2016 when 48% agreed. Agreement is higher among fixed firms (65%) than flexible firms (53%).
Understanding of regulation and regulatory burden
Figure 10 shows that two thirds of firms (66%) agreed that they had a clear understanding of the distinction between the FCA’s regulatory objectives and those of the Prudential Regulation Authority (PRA) (this figure was 94% among fixed portfolio firms).
Half (50%) felt that the FCA and PRA were suitably coordinated in their regulation. Just over a third (36%) felt that the FCA coordinated effectively with international regulators. Where firms did not agree with these statements they tended to record a neutral answer rather than disagreeing.
Data or information requests
Almost two thirds (66%) of firms felt the level of requests from the FCA were about right and 13% felt there were more than seemed necessary.
However the split in responses markedly differs between the 73 fixed firms that responded to the survey and the 2,007 flexible firms that responded. For example, only 28% of fixed firms felt the number of requests were about right. This is significantly up from only 12% in 2016. Overall 18% of firms felt there were a lot of requests but for understandable reasons, and 13% felt there were more than seemed necessary. Fixed firms were more likely to report that there were a lot of requests but for understandable reasons (58%) compared to only 17% of flexible firms. This may reflect the fact that fixed firms are likely to receive more information requests.
Section 2
53%of firms agree that FCA regulation is transparent
20%disagree
Base: All firms giving an answer other than ‘Not applicable’ – ‘Clear understanding’ (1,896); ‘Appropriately co-ordinated‘ (1,529);’Co-ordinates effectively’ (1,781)
Figure 10 – Agreement with statements about the FCA and other regulators
My firm has a clear understanding of the distinction between the FCA’s regulatory objectives and those of the PRA
The FCA and PRA are appropriately co-ordinated in their supervision of our firm, taking into account their respective regulatory objectives
The FCA co-ordinates effectively with international regulators
n Disagree n Neither agree or disagree n Agree
66%8%
4% 46%
26%
50%
2% 62% 36%
15

16
Financial Conduct AuthorityData Bulletin: Issue 10 – September 2017
Enforcement
Most firms took some action when they were aware of relevant enforcement action. Only seven per cent of firms said that they took no action as a result. The most common actions taken by firms are included in Figure 11 for example, discussing the action at a board meeting (54% of flexible firms).
Section 2
Figure 11 – Percentage of firms that took an action as a result of enforcement activity
Discussed the specific issues at a board meeting
Carried out a review of your conduct risks
Sent communications to all relevant staff
Implemented a specific review of your own business
Called meeting(s) specifically to discuss the issue
Introduced or changed training modules
Reviewed your firm’s remuneration structures and processes
Made a change to your business model
Base: All firms who were aware of enforcement activity over the last two years relevant to their business: Fixed (64); Flexible (647)
nFixed n Flexible
84%
54%
79%
48%
81%
45%
74%
35%
68%
32%
61%
25%
30%
17%
21%
14%
of firms agreed that enforcement procedures were a credible deterrent (compared to 65% in 2016)
73%

17
Financial Conduct AuthorityData Bulletin: Issue 10 – September 2017
International Issues
All firms were asked what they consider the FCA’s objectives should be during the process of the UK exiting the EU. Seven in ten firms (70%) responded. The verbatim responses were reviewed and grouped together into common answers (Figure 12). The results show the most common concern is ensuring stability and clarity.
Section 2
Figure 12 – What do you think the FCA’s objectives should be during the process of exiting the EU?
Minimise upheaval/ disruption/ change for UK firms
Provide clear guidance about new regulation/ changes to regulation
Ensure that the UK market remains attractive/ competitive/ effective
Protect consumers/maintain consumer confidence
Protect/ support the financial services industry/ firms
Remove EU regulations that are bad for the UK industry
13%
12%
11%
10%
7%
6%
Base: All firms (2,080)

18
Financial Conduct AuthorityData Bulletin: Issue 10 – September 2017
Financial Conduct Authority25 The North Colonnade Canary Wharf London E14 5HSTelephone: +44 (0)20 7066 1000Website: www.fca.org.uk
© Financial Conduct Authority 2017 All rights reserved
Next stepsIn future issues we want to make sure we give you the information that you would find most useful, so if you have any comments or suggestions for future content please contact us at: [email protected]
Get the facts If you would like to subscribe/unsubscribe from the Data Bulletin please visit: fca.org.uk/firms/data-bulletin-subscription-form
Data Bulletin Underlying data used in this bulletin. www.fca.org.uk/publications/data/ data-bulletin-issue-10
In case you missed themHere are some other data sets we have published recently that you may find interesting:
Mortgage lending statistics (2017 Q1) We have been tracking mortgage lending trends since 2007. Our latest data show that the amount of new lending was down in Q1 2017 to £60.4bn, compared to Q4 2016 (£62.8bn). From the previous quarter there has been a 5.1 percentage point fall in the value of new loans for house purchases as a proportion of the value of all loans advanced in the period, from 66.05% to 60.93%, driven by a decrease in the first-time-buyer (FTB) category. See all the latest findings at www.fca.org.uk/firms/mortgage-lending-statistics
The next mortgage lending statistics are due to be published on 12 September 2017.
Retirement Outcomes Review (2017)We published the interim findings of the Retirement Outcomes Review, which looks at how the retirement income market has changed since the pension freedoms were introduced in April 2015. The Review particularly focused on consumers who do not take advice. The Review found that consumers have welcomed the pension freedoms. Over one million defined contribution pension pots have been accessed since the reforms. The Retirement Outcomes Review can be found here: www.fca.org.uk/publications/market-studies/retirement-outcomes-review
The FCA and the FCA Practitioner Panel Survey 2017We published, together with the FCA Practitioner Panel, the findings from our joint 2017 survey of FCA-regulated firms. The survey gives a view across the financial services sector of the FCA’s performance as a regulator. The survey can be found here: www.fca.org.uk/news/press-releases/fca-practitioner-panel-joint-survey- industry-views