data analytics with splunk and sumo logic - amazon s3 · pdf filedata analytics with splunk...
TRANSCRIPT

Data Analytics with Splunk and Sumo Logic
Version 08-18-2016 Copyright © 2014-2016 Aviatrix Systems, Inc. All rights reserved.
Introduction Aviatrix Controller and all its managed gateways can be configured to forward logs to well known log
management systems, such as Splunk, Sumo Logic, Elastic Search and remote syslog.
In addition to standard information on syslog, Aviatrix also provides capability for user VPN connections, VPN
user TCP sessions and security rule violation packets.
Log Management System can be used to sift through the Aviatrix logs and get the meaningful trend charts
that helps monitor the network connectivity and user VPN sessions. The following sections provides
examples how to parse the Aviatrix logs on Splunk and Sumo Logic to display useful analytics of data
collected from Aviatrix Controller and gateways.
Aviatrix Log Format for Log Management Systems Three types of Aviatrix log key words can be identified by the Log Management System for further analysis:
AviatrixVPNSession: Logs sent by the Controller contains the information such as VPN user name, the VPN gateway IP address and
name where the user connects to, client virtual IP address, connection duration, total received bytes, total
transmitted bytes, and login and logout time. Two logs will be generated for each VPN connection. One is
when the connection is established, the other when it’s disconnected.
Example logs:
Connect log:
Aug 17 22:07:39 ip-172-31-46-24 cloudx_cli: AviatrixVPNSession: User=Splumo, Status=active,
Gateway=splunksumo, GatewayIP=52.52.76.149, VPNVirtualIP=192.168.0.6, Login=2016-08-17 22:07:38,
Logout=N/A, Duration=N/A, RXbytes=N/A, TXbytes=N/A
Disconnect log:
Aug 17 22:26:37 ip-172-31-46-24 cloudx_cli: AviatrixVPNSession: User=Splumo, Status=disconnected,
Gateway=splunksumo, GatewayIP=52.52.76.149, VPNVirtualIP=192.168.0.6, Login=2016-08-17 22:07:38,
Logout=2016-08-17 22:26:37, Duration=0:0:18:59, RXbytes=2.1 MB, TXbytes=9.03 MB
AviatrixUser: Logs with this prefix come from each VPN gateway managed by the controller. The log contains the
information for the TCP session, such as Inbound and outbound interface, source IP address, destination IP
address, TTL value, protocol name, and packet length. The log record is for each packet that passes through
the VPN connection from the client to the destination.
Two example logs:
Aug 17 22:15:47 ip-10-100-0-60 kernel: [14167.983249] AviatrixUser:IN= OUT=eth0 SRC=192.168.0.6
DST=68.67.154.85 LEN=64 TOS=0x00 PREC=0x00 TTL=63 ID=28916 DF PROTO=TCP SPT=50428 DPT=443
WINDOW=65535 RES=0x00 SYN URGP=0
Aug 17 22:15:47 ip-10-100-0-60 kernel: [14167.968275] AviatrixUser:IN= OUT=eth0 SRC=192.168.0.6
DST=10.100.0.2 LEN=66 TOS=0x00 PREC=0x00 TTL=254 ID=13309 PROTO=UDP SPT=64775 DPT=53 LEN=46
AviatrixRule: Logs with this prefix come from each gateway managed by the controller. Any packet that triggers the
security policy rule will generate a log record of this type with the first 100 bytes of the packet. It contains the
information such as gateway IP address, inbound and outbound interface, MAC address, TTL value, protocol
name, source IP address, destination IP address and packet length.
Two example logs:
syslog:Aug 4 21:46:28 ip-10-31-0-47 kernel: [ 1111.107393] AviatrixRule 10.31.0.47 A:IN=eth0 OUT=tun0
MAC=0a:06:c3:e3:d0:4f:0a:d2:ef:22:68:61:08:00 SRC=52.40.185.222 DST=192.168.43.6 LEN=40 TOS=0x00
PREC=0x00 TTL=62 ID=798 DF PROTO=TCP SPT=443 DPT=56505 WINDOW=231 RES=0x00 ACK FIN URGP=0
syslog:Aug 4 21:46:32 ip-10-31-0-47 kernel: [ 1115.091011] AviatrixRule 10.31.0.47 A:IN=eth0 OUT=tun0
MAC=0a:06:c3:e3:d0:4f:0a:d2:ef:22:68:61:08:00 SRC=98.136.189.19 DST=192.168.43.6 LEN=334 TOS=0x00
PREC=0x00 TTL=40 ID=5452 DF PROTO=TCP SPT=443 DPT=56203 WINDOW=368 RES=0x00 ACK PSH URGP=0
Configuration Workflow Make sure the latest version of Aviatrix software is installed before you start to configure the controller. You
should see the alert for software upgrade on the menu bar of the controller if a newer version is available.
Click Upgrade and wait for the upgrade to complete.
Follow the steps below to enable the logging for Splunk and Sumo Logic.
1. Launch the web browser and input the URL of your controller

2. Once logged in, navigate to Settings > Loggings
3. On the right hand side, enable the logging for Splunk by clicking the status button area. A new panel
will appear for you to input Splunk IP Address and Splunk Server Listening Port. Click Enable when
you are done.
4. Enable the logging for Sumo Logic by clicking the status button area. A new panel will appear for you
to input Access ID and Access Key. Click Enable when you are done.
5. To enable AviatrixRule logging, select packet logging when configuring gateway security policies. This
is done by clicking the gateway of interests at Gateway panel.
6. To verify if the logs are delivered to the specified Splunk and Sumo Logic servers, make a user VPN
connection through any gateway managed by the controller. At the prompt on Search bar of Splunk
and Sumo Logic, type Aviatrix* and you shall see the Aviatrix logs.
Filtering Aviatrix Logs for Log Management Systems AviatrixVPNSession logs contains the information pertinent to VPN connection statistics, such as the
connection duration, total received bytes, total transmitted bytes, the user name, login time and logout time.
To search such logs on Splunk or Sumo Logic, at the prompt of the Search bar, type AviatrixVPNSession*. The
search result will show you all the logs for VPN connections.
To search for the source and destination IP addresses for the VPN connections, you need to search the logs
prefixed with AviatrixUser. It contains the information pertinent to the packet sent from the source IP
address SRC and the destination IP address DST.
The following gives you some examples to filter the logs further for the trend charts on Splunk and Sumo
Logic respectively.
Filtering Aviatrix Logs for Splunk The fields of Aviatrix logs can be extracted automatically by Splunk. Below are examples of how to display
collected information visually.
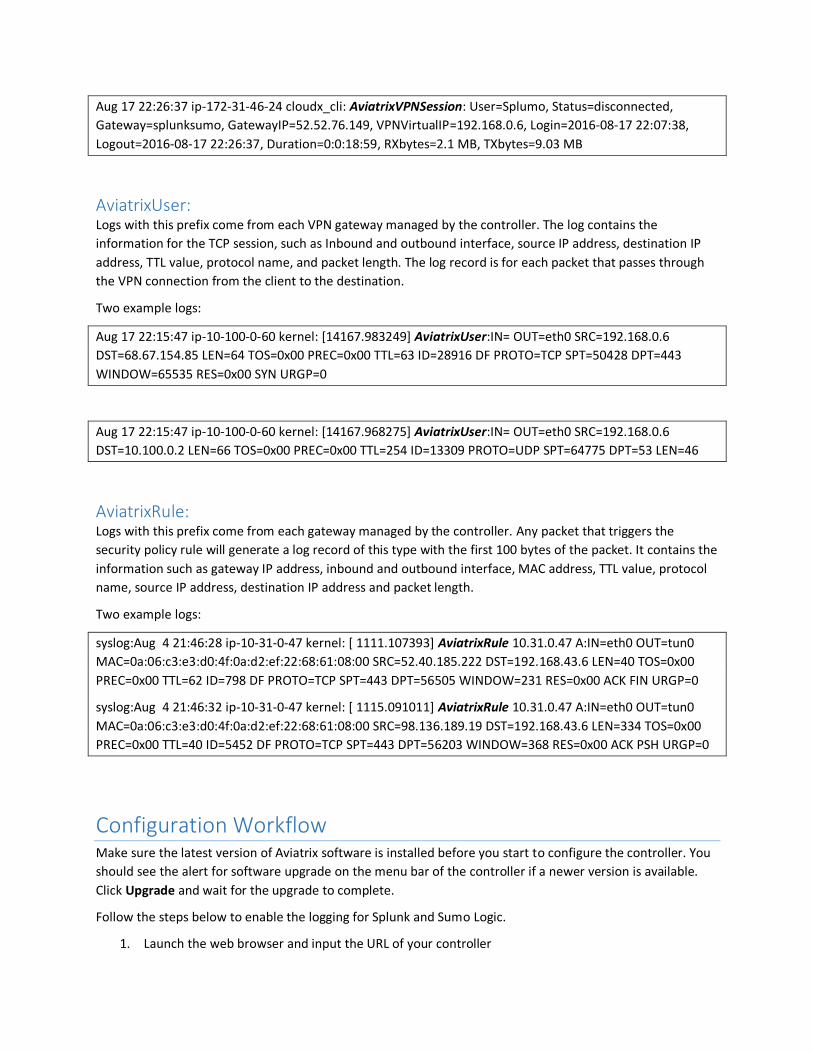
Chart to display total connection per user For the chart to show the total connection time by User, compute the total time of Duration in seconds and
then sum it up for each User.
For example:
sourcetype=ControllerSysLog AviatrixVPNSession* | eval secs=strptime(Duration, "%H:%M:%S")-
strptime("00:00:00", "%H:%M:%S") | stats sum(secs) as Time(Sec) by User |sort Time(Sec) desc limit=10
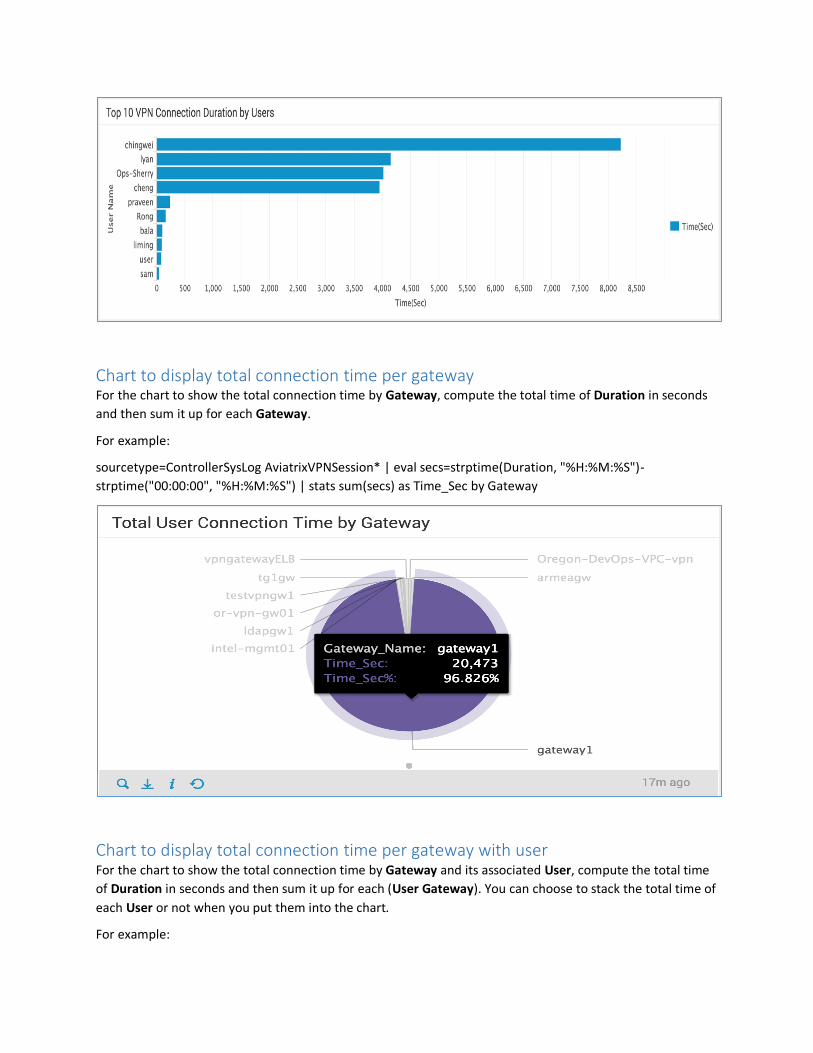
Chart to display total connection time per gateway For the chart to show the total connection time by Gateway, compute the total time of Duration in seconds
and then sum it up for each Gateway.
For example:
sourcetype=ControllerSysLog AviatrixVPNSession* | eval secs=strptime(Duration, "%H:%M:%S")-
strptime("00:00:00", "%H:%M:%S") | stats sum(secs) as Time_Sec by Gateway
Chart to display total connection time per gateway with user For the chart to show the total connection time by Gateway and its associated User, compute the total time
of Duration in seconds and then sum it up for each (User Gateway). You can choose to stack the total time of
each User or not when you put them into the chart.
For example:

sourcetype=ControllerSysLog AviatrixVPNSession* | eval secs=strptime(Duration, "%H:%M:%S")-
strptime("00:00:00", "%H:%M:%S") | chart sum(secs) as Time_Sec by Gateway User
Chart to display total packet count by destination For the chart to show the total packet count by destination IP address, get the count of DST over the time
range of your selection.
For example:
AviatrixUser*| chart count by DST|sort count desc | head 10

Chart to display total packet count by SRC and DST For the chart to show the total packet count by SRC and its associated DST, get the total count of each DST
for each SRC. You can choose to stack the total count of each DST or not when you put them into the chart.
For example:
AviatrixUser*| chart count by SRC DST
Filtering Aviatrix Logs for Sumo Logic
Chart to display total connection by per user For the chart to show the total connection time by User, compute the total time of Duration in seconds and
then sum it up for each User.
For example:
(((_sourceCategory=syslog )
AND "AviatrixVPNsession"))
AND !"Duration : N/A"
|parse "(User=*," as User_Name|parse "Duration=*:*:*:*," as hour,minute,second, millis|
hour*3600+minute*60+second as durationSec | sum(durationSec) as Total_Sec User_Name | sort Total_Sec
desc

Chart to display total connection time per gateway For the chart to show the total connection time by Gateway, compute the total time of Duration in seconds
and then sum it up for each Gateway.
For example:
(((_sourceCategory=syslog )
AND "Aviatrix VPN session"))
AND !"Duration : N/A"
|parse "Gateway=*," as Gateway_Name| parse "Duration=*:*:*:*," as hour,minute,second, millis|
hour*3600+minute*60+second as durationSec | sum(durationSec) as Total_Sec Gateway_Name | sort
Total_Sec desc

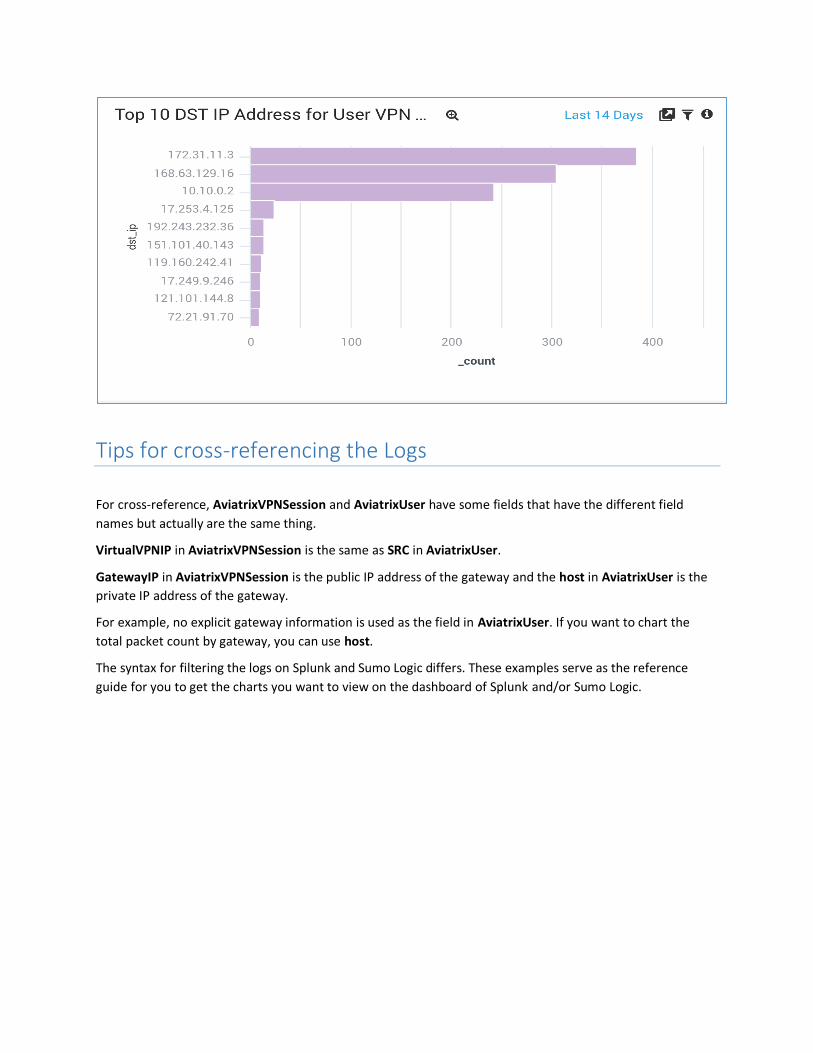
Chart to display total packet count by DST For the chart to show the total packet count by destination IP address, get the count of DST over the time
range of your selection.
For example:
AviatrixUser*| parse "DST=* L" as dst_ip| count by dst_ip | sort by _count desc | limit 10
Tips for cross-referencing the Logs
For cross-reference, AviatrixVPNSession and AviatrixUser have some fields that have the different field
names but actually are the same thing.
VirtualVPNIP in AviatrixVPNSession is the same as SRC in AviatrixUser.
GatewayIP in AviatrixVPNSession is the public IP address of the gateway and the host in AviatrixUser is the
private IP address of the gateway.
For example, no explicit gateway information is used as the field in AviatrixUser. If you want to chart the
total packet count by gateway, you can use host.
The syntax for filtering the logs on Splunk and Sumo Logic differs. These examples serve as the reference
guide for you to get the charts you want to view on the dashboard of Splunk and/or Sumo Logic.