data analytics an information resource for professional ... · data that you haven't...
TRANSCRIPT

DATA ANALYTICSAn Information Resource for IFAC Members
November 2018

What is Data Analytics?
Data analytics is a broad term that encompasses many diverse techniques and processes of drawing insights from historical data over time. Today the term is most often used to describe the analysis of large volumes of data and/or high-velocity data, which presents unique computational and data-handling challenges.
2

Why is Data Analytics Important?
3
Advanced Data Analytics
Cost reduction Faster, better decision making
Revenue growth
Margin improvement
New products and services
Risk and controls

Types of Data Analytics
Descriptive, Diagnostic, Predictive, Prescriptive4
4
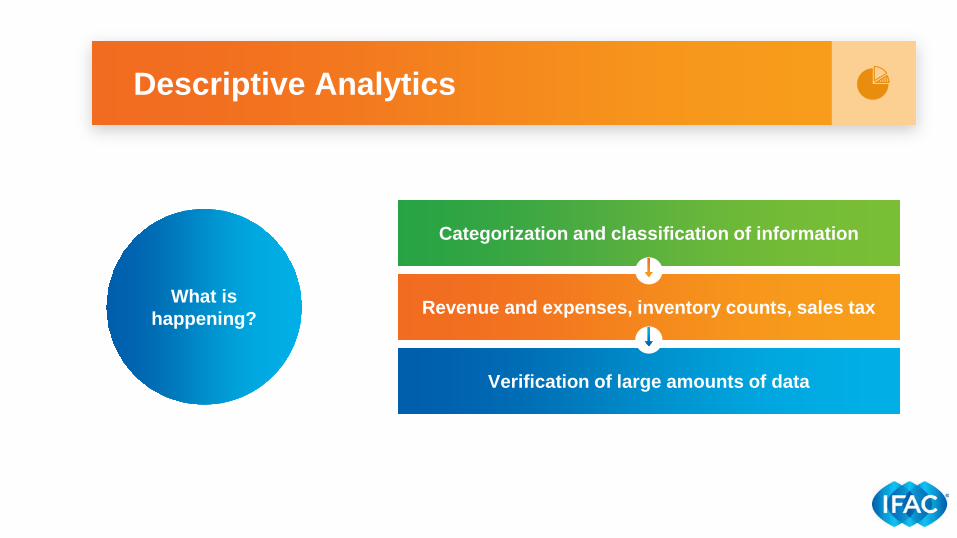
Descriptive Analytics
5
Revenue and expenses, inventory counts, sales tax
Categorization and classification of information
Verification of large amounts of data
What is happening?

Diagnost ic Analytics
6
Analyze variances, calculate historical performance
Monitor changes in data
Build reasonable forecasts
Why did it happen?

Predict ive Analytics
7
Identify patterns in forecasts
Assess likelihood of future outcomes
Act as trusted advisor to business leaders
What is going to happen?

Prescript ive Analytics
8
Raise concerns for potential poor choices
Make recommendations for future growth
Valuable insight has significant impact on business
What should happen?
Data Analytics and Financial Reporting/Audit

Data Analytics in Financial Reporting
▪ Together with automation, analytics enables better risk understanding across thousands of data points in P&L reporting
▪ Data analytics can improve the co-operation with external auditors to detect patterns and trends, and identify process improvements that can increase efficiency and enhance audit quality
▪ Uncover valuable insights within the financials, and better manage risk across the organization
▪ The automation of large parts of audit plans using analytics can also make the internal audit function more efficient and effective
10
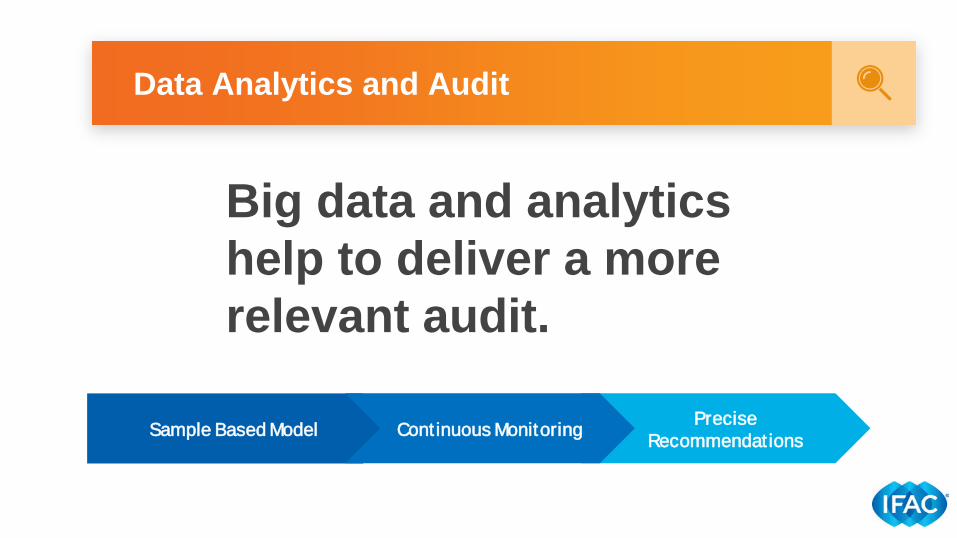
Data Analytics and Audit
11
Precise Recommendat ionsSample Based Model Cont inuous Monitoring
Big data and analytics help to deliver a more relevant audit.

Data Analytics and Business

Data Analytics in Business
Utilize insights to transform business models
13
Businesses use real-time data to empower decision making
Gain deeper insights into client behaviors and potential opportunities and risks
Business Use Cases
In an effort to help their finance team shift from reporting the business to becoming effective partners in running the business, Adobe has been investing in the workflows needed to integrate disparate data sources and deliver actionable business intelligence.
Here are a few key lessons they've learned.

1. Turn digital data into insight and draw conclusions that help drive the business.
• Traditional metrics to track a promotion targeting first-time buyers might be the number of new customers and resulting revenue. But as a result of your shift to digital — you now have access to data that you haven't previously tracked:― Who are those customers? ― Would they have purchased without the promotion, anyway? ― What is their journey from interest to purchase?
• Handled correctly, data insight could be an opportunity to build customer loyalty and drive new sales.

In the previous scenario, which part of your organization would you expect to recognize the business insight in the data and bring it to your attention? Finance? Sales? Marketing? Customer support?
2. To start, data needs to be visible to different parts of an organization. But making use of it requires collaboration and communication. That often requires a cultural shift. It's about each and every team believing they have the permission, influence and respect they need to think beyond the confines of their traditional roles and take broader responsibility for the business.

3. Figuring out how to act on your data insight should always lead from the perspective of the customer.
• This would lead to questions like:― How are our customers using our products?― What features provide them with the most value?― How can we help our customers learn more about our products?― What are the differences in usage and value by customer
segments?
• And, of course, it might lead you to look at your data in new ways to see if you have additional information about your new customers, or if they are using the product in unexpected ways.
AmEx looks for indicators that can really predict loyalty and uses big data to develop sophisticated predictive models to analyze historical transactions and 115 variables to forecast potential churn. The company believes it can now identify 24% of Australian accounts that will close within the next four months.
The Coffee Club collects point-of-sale data on the time of day of purchases, the day of the week, other items purchased in the same transaction, and traffic count versus average spend. They also cross-reference with other datasets. It was found, for example, that a drizzle of rain on Saturdays would increase traffic in stores, but heavy rain on Sundays would deter customers from shopping centresites.

H&M continually needed to cut prices to clear out unsold inventory in its 4,288 stores around the world. In an effort to better stock individual stores with merchandise local clientele desires, H&M is using big data and Artificial Intelligence (AI) to analyze returns, receipts and loyalty card data to tailor the merchandise for each store whether located in Sweden, the United Kingdom or the United States

Mint.com uses big data to provide users information about their spending by category and have a look where they spent their money in a given week, month or year.
A free web-based personal financial
management service

Infinity realized it had years of adjusters' reports that could be analyzed and correlated to instances of fraud. It built an algorithm out of that project and used the dark data underutilized information assets that have been collected for single purpose and then archived to reap $12 million in subrogation recoveries.
Kimberly-Clark generates a lot of complex data such as sales and marketing spend, store performance, and purchasing information from several sources that resided in inflexible systems that made it difficult to use. By consolidating the data with a platform powered by Tableau, Amazon Redshift, and Panoply, it is now accessible to more professionals within the organization and they are saving time (eight hours weekly) and money ($250,000 over the course of two years) from spending less time collecting and sorting data, and more time interpreting it.

Harnessing the Power of Data

NewVantage Partners surveyed senior business and technology executives from leading Fortune 1000 companies to understand how they are investing in and deriving business value from their Big Data investments.
2018 Big Data Executive Survey

Of the 60 Fortune 1000 or industry leading firms represented in the 2018 survey,
77.2%97.2%
are from the financial services industry
indicated that their company is investing in Big Data and AI

While investment in Big Data and AI initiatives appear to be widespread (97.2% of respondents), investment levelsappear to be relatively modest for most organizations at this time.
12.7%
27.0%60.3%
Greater than $500M
Under $50M$50M -$500M

65.2%Of firms are investing to
improve customer service
23.2%Of those firms cite improved
customer service as top priority
84.1%Of firms are investing in
this objective
36.2%Of those firms cite this objective as top priority
The survey results indicate that developing advanced analytics to support improved business decision making was identified as the
highest priority, and generated the highest success rate

80.9% of executives agree that cultural challenges (people + process) represent the greatest challenge to overcome in achieving their goal of a data driven culture not technology (19.1%).
48.5%
32.4%
19.1%
People
Technology
Process
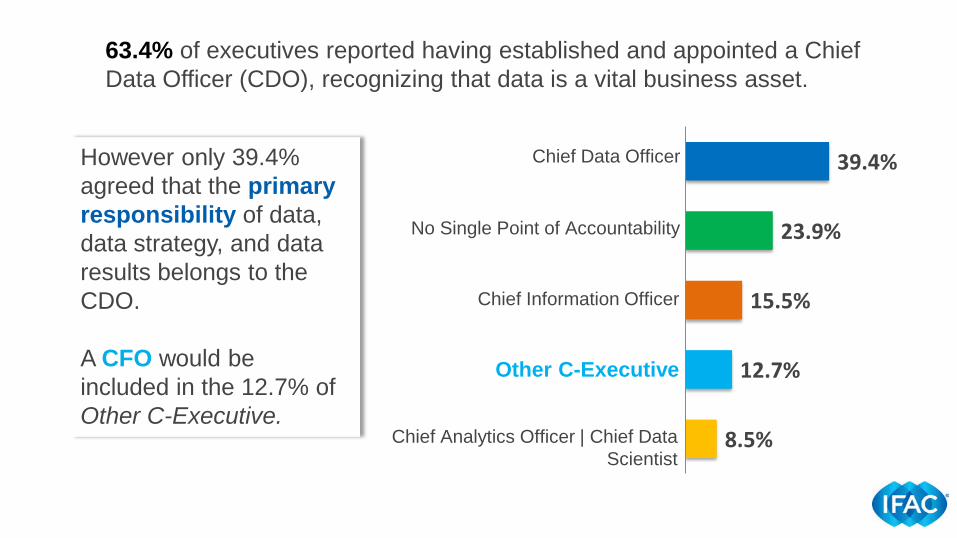
63.4% of executives reported having established and appointed a Chief Data Officer (CDO), recognizing that data is a vital business asset.
However only 39.4% agreed that the primary responsibility of data, data strategy, and data results belongs to the CDO.
A CFO would be included in the 12.7% of Other C-Executive.
39.4%
23.9%
15.5%
12.7%
8.5%
Chief Data Officer
No Single Point of Accountability
Chief Information Officer
Other C-Executive
Chief Analytics Officer | Chief Data Scientist

Why Some Companies are turning to Chief Data Officers

“To truly appreciate the increasing need for the CDO’s role, one must first understand that 90% of the world’s data was created in the past two years alone. That’s a lot of information for a company to suddenly organize, secure and make sense of, let alone make strategic decision on.” Matthew Thomas, CDO, Pandera Systems (a leader in
helping firms deliver analytics and automated decision capabilities)

CDO – Typical Responsibilities
▪ Control and secure data▪ Maximize data’s value with accessibility throughout an
organization while continuing to maintain this controlled state
▪ Provide decision-ready data to other executives to improve cycle times and cost on capital project considerations
▪ Manage the information necessary to run the business

Other Use Cases of Data Analytics for Accountants
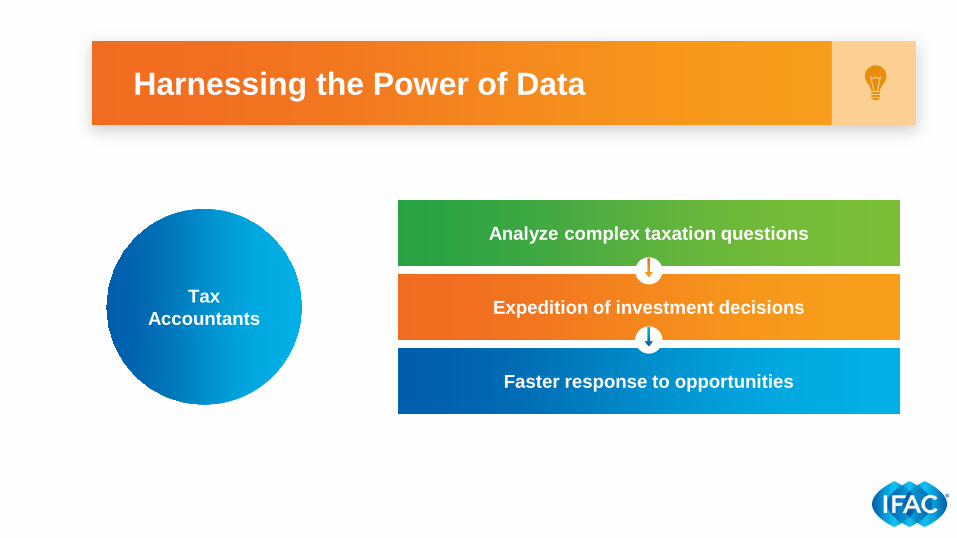
Harnessing the Power of Data
36
Expedition of investment decisions
Analyze complex taxation questions
Faster response to opportunities
Tax Accountants

Harnessing the Power of Data
37
Build analytical models
Find behavioral patterns
Identify investment opportunities
Accountants as
Investment Advisors

Interesting Resources
1. The Next CFO TVCFO vs. CDO @ L'Oréal: a data showdown(Source: Mazars)
2. Unlocking the value of data: CFO role re-defined(Source: KPMG)

39
Data Analytics Webinar
Access Webinar Here

Copyright © 2018 by the International Federation of Accountants (IFAC). All rights reserved. Written permission from IFAC is required to reproduce, store or transmit, or to make other similar uses of this document, save for where the document is being used for individual, non-commercial use only. Contact [email protected].