data analysis using r and the r-commander (rcmdr) · pdf filedata analysis using r and the...
TRANSCRIPT

Data analysis using R and the R-commander(Rcmdr)
Graeme D. HutchesonManchester University

Chapter 1
R and the Rcmdr
R provides a powerful and comprehensive system for analysing data andwhen used in conjunction with the R-commander (a graphical user interface,commonly known as Rcmdr) it also provides one that is easy and intuitive touse. Basically, R provides the engine that carries out the analyses and Rcmdrprovides a convenient way for users to input commands. The Rcmdr programenables analysts to access a selection of commonly-used R commands using asimple interface that should be familiar to most computer users. It also servesthe important role of helping users to implement R commands and developtheir knowledge and expertise in using the command line — an importantskill for those wishing to exploit the full power of the program.
1.1 InstallationThe following section explain how R and the Rcmdr user-interface can beinstalled on a number of computer platforms. As Rcmdr is an add-on packagefor R, it needs to be installed after the main R software. Once R has beeninstalled and is running, Rcmdr can then be installed from the R-console.It is not necessary to go into a lot of detail here about installing R and theRcmdr as there are many excellent descriptions of this available on-line1 andin a number of published books (see, for example Horton and Kleinman,2011; Fox and Weisberg, 2011; Zuur et al., 2009). Some minimal instructionsare, however, provided below.
1.1.1 Installing RInformation about installing R can be found on the web at the R homepagehttp://www.r-project.org/ which provides lots of information about the R
1As R and the Rcmdr are constantly evolving and developing, along with the computerplatforms it is installed on, details about installation may be subject to change. Users aretherefore recommended to get the most up to date information about installing the softwarefor their particular computing platform directly from the internet (see, for example, http://www.r-project.org/ and http://www.Rcmdr.com).
1
2 1. R AND THE RCMDR
project and also directs users to one of the CRAN sites (the Comprehensive RArchive Network) that have been set up on many servers across the world inorder for users to download the software. CRAN provides all files necessaryto install R on a number of different computing platforms (Linux, MacOSX and Windows) along with detailed information about installation and alsooffers manuals and contributed documentation in a number of langauges andfor a number of specific disciplines.
Linux/Unix
On the CRAN site, select theDownload R for Linux link. R is available fora number of distributions (for example, Debian, RedHat, Suse and Ubuntu)and users who are familiar with Linux should have little difficulty in installingthe basic R package using the detailed instructions provided on-line. Onceinstalled, the program is run by entering ‘R’ into a terminal.
MacOS X
On the CRAN site, select the Download R for MacOS X link. To installthe basic R package, double-click the R-x.y.z.pkg file (x.y.z indicates thecurrent software version — these numbers change with updates). To use theRcmdr GUI, two other packages, found in the tools directory, should also beinstalled. These are the gfortran-x.y.z.dmg and the tcltk-x.y.z-x11.dmgpackages which can both be installed by double-clicking. Once installed, Ris run via the program-finder.
Windows
On the CRAN site, select the Download R for Windows link. The basicR package can be installed from the R-x.y.z-win.exe file (x.y.z indicatesthe current software version — these numbers change with updates). The Rprogram can then be run from the R-icon on the desktop, which is provided aspart of the standard installation procedure. Windows allows the R programto run in one big window, or in a number of separate windows (the outputdepicted in this book uses multiple windows). The selection of which to usecan be made during the installation process (from the customized startupoptions) or by using the ‘GUI preferences...’ option from the R-console.
When the R program is run (on all platforms), a window opens up (theR-console) which provides an interface to the R language. At first glance, theR-console looks remarkably unimpressive, as it just offers a small window withsome text and a command-line prompt (see Figure 1.1). The text providessome basic information about the program, it’s version number, informationabout the license and how it can be cited (see the citation( ) command).The text also gives some information about getting some help and some ofthe demonstration programs that can be run directly from the command line.

1.1. INSTALLATION 3
Figure 1.1: The R-console provides a simple interface that allows text com-mands to be entered into R (enter them on the command line after the >prompt. Note that the console shown here is one available on the Linuxoperating system — consoles for other operating systems may look slightlydifferent and have different pull-down menu options, but all offer the samebasic functionality.
The comprehensive help system will be of particular interest to new users andcan be activated by typing help.start( ) into the R-console, or by using thepull-down Help menu.
R-console
help.start( )
This is a particularly useful method of accessing help as it operates through aweb-browser and offers a whole range of services including access to manuals,documentation on packages that have been loaded, frequently asked questionsand a key-word search utility to search all of the available help files. We cansee R in action by running one of the suggested commands from the openingtext. The demo( ) command offers a number of demonstrations depending onwhich packages have been loaded. Typing demo( ) into the R-console displaysa list of them. A basic installation of R includes a number of demonstrationssuch as ‘catching and handling errors’, examples from linear and generalizedlinear models’ and a demonstration of the graphical capabilities of R. Asan example, the graphics demonstration can be run by simply entering the
4 1. R AND THE RCMDR
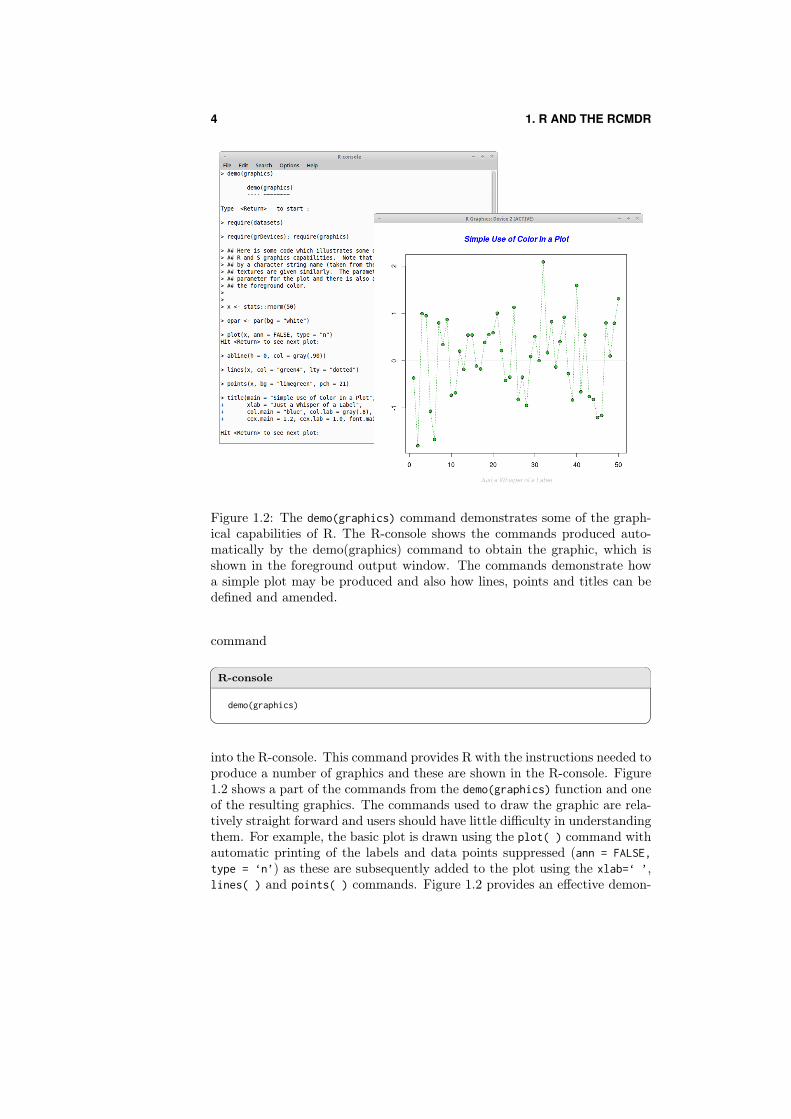
Figure 1.2: The demo(graphics) command demonstrates some of the graph-ical capabilities of R. The R-console shows the commands produced auto-matically by the demo(graphics) command to obtain the graphic, which isshown in the foreground output window. The commands demonstrate howa simple plot may be produced and also how lines, points and titles can bedefined and amended.
command
R-console
demo(graphics)
into the R-console. This command provides R with the instructions needed toproduce a number of graphics and these are shown in the R-console. Figure1.2 shows a part of the commands from the demo(graphics) function and oneof the resulting graphics. The commands used to draw the graphic are rela-tively straight forward and users should have little difficulty in understandingthem. For example, the basic plot is drawn using the plot( ) command withautomatic printing of the labels and data points suppressed (ann = FALSE,type = ‘n’) as these are subsequently added to the plot using the xlab=‘ ’,lines( ) and points( ) commands. Figure 1.2 provides an effective demon-

1.1. INSTALLATION 5
stration of the great level of control that the user has over the graphic andshows how the size, colour and opacity of the labels, points and lines canall be controlled. Although these commands are easy to understand andmodify, the use of a text-based interface can be quite alien to new users, whoare often more used to a mouse-driven environment. Although very powerfuland versatile, text-based commands can prove to be a barrier for some usingthe program, at least at first. There are, however, a number of interfacesthat have been developed for R to allow mouse-driven menu selections to beused (for a comprehensive list of these, see http://www.sciviews.org/_rgui/).This book makes extensive use of one of these graphical user interfaces —the R-commander (Rcmdr), a program that provides an interface for R thatenables commands to be selected using a mouse-driven point-and-click menusystem.
1.1.2 Installing the R-commanderRcmdr is a graphical interface for R which is written and maintained byJohn Fox (Fox, 2005, 2012a). Full details about the program and it’s instal-lation are readily available on-line (see http://socserv.mcmaster.ca/jfox/Misc/Rcmdr). A simple procedure for installing the Rcmdr is to run the com-mand
R-console
install.packages( )
in the R-console2. This command will direct you to a CRAN mirror whichwill list the packages that are currently available for installation. There area great many available and users should scroll down to the Rcmdr packageand then select OK. The Rcmdr interface will then be installed into the samedirectory structure as used in the original installation of R. Once installed,the Rcmdr can be loaded by issuing the command
R-console
library(Rcmdr)
in the R-console3. In addition to the standard packages that are loaded inthe base version of R, the Rcmdr makes use of functions from a number of
2It is also possible to install Rcmdr using the pull-down menus that are available insome R-console programs (for example, in the version for windows). The command-linetechnique shown here is one that works on all platforms and accomplishes the same thingas the menus.
3The Rcmdr may also be loaded using a pull-down menu (in windows; Packages, Loadpackage...). The command-line method is shown here, as it applies to all consoles.

6 1. R AND THE RCMDR
Figure 1.3: The R-commander (Rcmdr) console. Rcmdr is loaded using thelibrary(Rcmdr) command in the R-console. This command automaticallyloads a number of additional packages that are required including some thatare not part of the base distribution — for example, car (Fox and Weis-burg, 2011), MASS (Venables et al., 2012), nnet (Ripley, 2012) and survival(Therneau, 2012).
other packages and will offer to install these if they haven’t already beeninstalled on your system. Once all the packages have been installed, Rcmdrwill load and provide the interface shown in Figure 1.3.
The Rcmdr interface has a number of parts that are worth describinghere. The menus positioned at the top (File, Edit, Data, Statistics, etc.)allow users to access a number of functions including those that deal withscripts and files, the manipulation of datasets, statistical analyses, graphs,model manipulation, loading packages and plugins and a help menu. A fulldescription of these options is not required here as this is provided in theRcmdr help menu...
Rcmdr menus

1.1. INSTALLATION 7
R commanderHelp O
Introduction to the R Commander. . .
Below the drop-down menus is a tool bar which shows the active data set,buttons that allow the data to be viewed and edited, and information aboutthe model that is currently being considered. Figure 1.3 shows no active dataset or model as the Rcmdr has just started and no data has been loaded ormodels run yet. Below the toolbar is the script window where commandsgenerated by the GUI are copied. This window is a simple text editor thatallows the commands to be edited, copied and saved. R commands can alsobe run directly from the script window by indicating the test and then usingthe Submit button. Below the script window is the Output Window thatshows the text output (graphs are output to a separate window). At thebottom is a small window that displays error messages in red text, warningsin green, and other messages in dark blue.
1.1.3 Installing to a USB/CD drive
A very useful feature of R and the Rcmdr, is that they can be installed to andrun directly from a USB stick or a CD. This enables users to have control overtheir software and also enables it to be used on computers where an R systemis not installed (or is not up-to-date). The ability to run the software via aUSB drive is an important feature for many R users, particularly those whouse additional packages that are not part of the base installation. This featureis also important for those who use networked computers where individualusers are unable to update or install software. For example, the closed-systems operated by many Universities do not allow users to update or installtheir own software. In this case, someone wanting to use the most up-to-dateversion of R, or a package that is not part of the installed system cannot doso. However, by installing R on a USB drive, users can easily run their ownversion of R and access any additional packages4.
It is probably most useful to have a Windows-based implementation of Ron a USB drive as this operating system is ubiquitous in the workplace and awindows-version of R can also be run on a Linux machine through the winesoftware (see http://www.winehq.org). Installing R to a CD/USB drive is veryeasy, and just involves instructing the installation program where to installthe files (this information is explicitly asked for during installation). Onceinstalled to a certain directory, any additional packages are also installed tothis directory structure and are saved to the USB drive. R is run from a USB
4The ability to run R from a USB drive/CD also has a number of advantages for thoseteaching or demonstrating statistics. The lecturer can run their own software on almostany system and the participants in the class can also be provided with copies of the softwarethat can be run directly from a CD. The inclusion of a spreadsheet package that can alsorun directly from a CD or USB drive provides a complete data analysis system that isportable (see ?).
8 1. R AND THE RCMDR
drive or CD through the Rgui.exe program that is located in the followingdirectory of your USB/CD drive
R-x.y.zbin
i386Rgui.exe
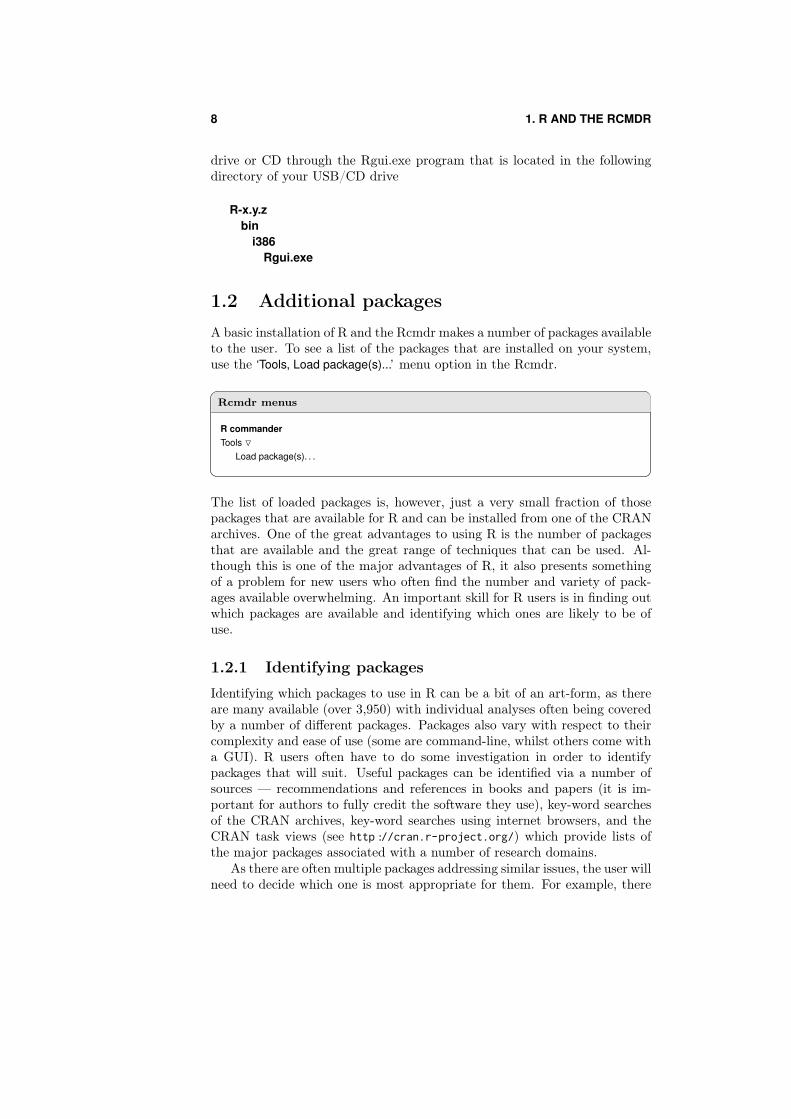
1.2 Additional packages
A basic installation of R and the Rcmdr makes a number of packages availableto the user. To see a list of the packages that are installed on your system,use the ‘Tools, Load package(s)...’ menu option in the Rcmdr.
Rcmdr menus
R commanderTools O
Load package(s). . .
The list of loaded packages is, however, just a very small fraction of thosepackages that are available for R and can be installed from one of the CRANarchives. One of the great advantages to using R is the number of packagesthat are available and the great range of techniques that can be used. Al-though this is one of the major advantages of R, it also presents somethingof a problem for new users who often find the number and variety of pack-ages available overwhelming. An important skill for R users is in finding outwhich packages are available and identifying which ones are likely to be ofuse.
1.2.1 Identifying packages
Identifying which packages to use in R can be a bit of an art-form, as thereare many available (over 3,950) with individual analyses often being coveredby a number of different packages. Packages also vary with respect to theircomplexity and ease of use (some are command-line, whilst others come witha GUI). R users often have to do some investigation in order to identifypackages that will suit. Useful packages can be identified via a number ofsources — recommendations and references in books and papers (it is im-portant for authors to fully credit the software they use), key-word searchesof the CRAN archives, key-word searches using internet browsers, and theCRAN task views (see http://cran.r-project.org/) which provide lists ofthe major packages associated with a number of research domains.
As there are often multiple packages addressing similar issues, the user willneed to decide which one is most appropriate for them. For example, there

1.2. ADDITIONAL PACKAGES 9
are a number of packages for running exploratory factor analysis. A searchon CRAN (search using the keywords ‘factor analysis’) and Google (usingthe keywords ‘R factor analysis’) identifies a number of packages includingbfa (Murray, 2012), DandEFA (Manukyan et al., 2012), FAiR (Goodrich,2012), FAMT (Causeur et al., 2012), ifa (Viroli, 2012), FactoMineR (Hussonet al., 2012b), and links to many websites containing other packages anddocumentation related to factor analysis. The user has to decide which ofthese packages are most appropriate by reading the manuals and vignettesand also trying out the examples that accompany most packages.
1.2.2 R packages
Once a package has been identified, it is easy to install from the R-consoleusing the install.packages( ) command (this is demonstrated above for in-stalling the Rcmdr package). This command directs the user to a CRANmirror site where the package of interest can be selected from a list. Thispackage is then installed to the same directory structure as the R program(i.e., when running R from a USB drive, the package is installed to theUSB). Once the package has been installed, it is available to the user andcan be loaded using the library( ) command in the R-console (for example,library(FAiR) will load the FAiR package and library(FactoMineR) will loadthe FactoMineR package), or by selecting the package via the ‘Tools, Loadpackage(s)...’ pull-down menu in the Rcmdr console (see above). The instal-lation process also installs all help and data files associated with the package— these are available via the menu options in Rcmdr. Once a package isinstalled it is available for all subsequent sessions — it does not need to beinstalled again.
1.2.3 Rcmdr Plugins
In addition to the R packages available on CRAN, there are a number ofplugins that have been optimised specifically for use with the Rcmdr (Fox,2007). These plugins add additional functions and procedures by typicallyadding menu items that can be accessed directly from the Rcmdr interface.These plugins are installed in the same way as for other R packages (via theinstall.packages( ) command in the R-console) and can be loaded via the R-console or by using the Rcmdr menus ‘Tools, Load Rcmdr plugin(s)...’. Loadingan Rcmdr plugin will also load all help and data menu options associatedwith that package.
As an example, the Rcmdr plugin FactoMineR (Husson et al., 2012a) isshown in Figure 1.4. This plugin loads the R package FactoMineR (Hussonet al., 2012b) and adds an extra menu to the Rcmdr. This plugin makes someof the functions of the FactoMineR package available via a mouse-drivenmenu system. Figure 1.4 shows that, for the data available a number ofprocedures can be selected including Principal Components Analysis (PCA),Correspondence Analysis (CA) and General Procrustes Analysis (GPA).

10 1. R AND THE RCMDR
Figure 1.4: The RcmdrPlugin FactoMineR. This plugin adds an extra menuto the Rcmdr allowing convenient access to the techniques implemented bythe FactoMineR package. Other RcmdrPlugins add additional menu groupsor add items to already existing menus.
There are other plugins available for Rcmdr that accomplish a numberof different tasks from providing access to analytical techniques such as sur-vival and time series analyses (Fox, 2012b; Hodgess, 2012), to complimentpublished books (for example, the HH and IPSUR plugins, Heiberger, 2012;Kerns, 2012), to provide easy access to graphical techniques (for exampl„mosaic, association and Kaplan-Meier plots, Neuwirth, 2012; Sou and Na-gashima, 2012), teaching demonstrations (Fox, 2012c) and even providingoutput in LATEX and html formats (Andronic, 2012). These plugins are con-tinually being developed and added to and users are encouraged to regularlyinvestigate which are available.
1.2.4 Updating packages
An installation of R can include a number of separate packages and pluginsand it is important that these are kept up-to-date. This is easily achievedfrom the R-console using the ‘Packages, Update packages...’ pull-down menuor the update.packages( ) command. . . issued in the R-console or the RcmdrScript Window.
R-console/Rcmdr script window
update.packages( )
This command will compare all packages and Rcmdr Plugins that have beeninstalled on your computer with those that are available on CRAN. The useris then given the option to update any packages where updates are available.

1.3. USING AN EDITOR 11
1.3 Using an editorThis book promotes the use of R and the Rcmdr as a system for data analysis,with R providing the statistical engine for the techniques and the Rcmdrallowing users to run these via a simple interface. Although these programs,when used together, provide an effective method for data analysis, userswill often want to edit and save the R commands. In order to do this, adedicated text editor is a valuable addition to the system as it enables codeto be more easily formatted, copied, manipulated and saved. Although anytext editor can be used (you can use which ever one you are most familiarwith), it is worthwhile looking for one where an interface for R has alreadybeen developed5.
It is useful at this point to give a quick description of how an editor canbe used in conjunction with R and the Rcmdr. The editor used for this ex-ample is Gedit, which is an open-source text editor originally developed forthe Linux desktop, but is now also available for MacOS X and Windows (seehttp://projects.gnome.org/gedit/). Gedit is particularly effective whenused in conjunction with R as it has an extension that enables R commandsto be processed from within the editor. The extension for R, which is calledRgedit, is available free from the web at http://rgedit.sourceforge.net/. Ascreenshot of Rgedit is provided in Figure 1.5 and shows the basic Gedit texteditor with the addition of a menu that allows R commands to be processed.This is a basic editor that allows text to be cut and pasted, formatted, ma-nipulated and saved. Single lines or blocks of text can be sent from the editordirectly to the R-console which will run the commands.
Rgedit can be used to input and run ‘raw’ R commands, but it is particu-larly useful when used in conjunction with the Rcmdr. The R-code requiredto run the analyses and processes selected using the Rcmdr menu system areautomatically copied to the Script Window. For example, a normal distribu-tion can be plotted using the Rcmdr menu system. The graphic is displayedin a separate window and the R commands required to plot the graphic arecopied to the Script Window. These commands in the script window arethe ‘raw’ R commands that are required to plot the graphic — the graphiccan be recreated by simply copying the commands to the R-console, Rcmdrscript window or a text editor.
The Rcmdr menu system gives very few choices for the production of thisgraphic and just provides a standard output based on a number of defaults.The default settings might not, however, be appropriate for everyone, as thetitles may need changing, or the type of graph and the size of the axes mayrequire altering and annotations may also need to be added. This should notcause a problem, however, as graphics can be easily amended by editing the
5A comprehensive list of editors available for all platforms that are integrated with Ris provided at http://sciviews.org/_rgui/projects/Editors.html. Users are encouraged toinvestigate these for themselves and decide on the one that best suits their requirements.

12 1. R AND THE RCMDR
Figure 1.5: Using R via a text editor. The editor shown here is Gedit withthe Rgedit extension that adds additional functionality to the editor. Rcommands can be written or cut and pasted into the editor and manipulated(for example, adding comments and explanations - text after the # char-acters on each line are ignored by R). Commands such as library(Rcmdr)and names(ExampleData) can be run directly from within the editor using thededicated R menu options.
commands in the script window. Which commands can be edited and theoptions available can be found using R’s help system. An easy way to viewthe options available for the plot( ) is through the help(plot) command.
Rcmdr Script Window
help(plot)
The help(plot) command opens up a browser window and provides a lotof information about how the plot function works and how it can be changed.For example, how to change the type of plot (eg., plotting points, lines orbars similar to a histogram) and the labelling. There are also a number ofother aspects of the plot that can be changed and information about this iscontained in the help files. The graphic of the normal distribution shownabove can be changed by simply editing the commands in the script window

1.3. USING AN EDITOR 13
Rcmdr menu
R commanderDistributions O
Continuous distributions .
Normal distribution .
plot normal distribution. . . . . .
Rcmdr Script Window
.x <- seq(-3.291, 3.291, length.out=100)plot(.x, dnorm(.x, mean=0, sd=1),xlab="x", ylab="Density",main=paste("Normal Distribution:
Mean=0, Standard deviation=1"),type="l")abline(h=0, col="gray")remove(.x)
output window
(preferably after copying them to an appropriate editor). The following showsa slightly edited set of commands and the resulting graphic produced whenthe commands are submitted to R (in the Rcmdr script window you can editthe code, highlight all lines using a mouse and then submit this).
The commands that produce the plot of the normal distribution are nottoo hard to understand and amend. The initial command ‘.x <- seq(-3.291,3.291, length.out=100)’ defines a variable (.x) with 100 equally-spaced val-ues between -3.291 and 3.291. These values are then plotted along withthe density derived from the dnorm function (plot(.x, dnorm(.x, mean=0,sd=1)). The axes are then labelled using the xlab= and ylab= functions anda title provided using the main= command. The type of graph is changedto a histogram through the type="h" command. A line graph is chosen asthe type of graph type="l") and a coloured horizontal line is added at Y=0(abline(h=0, col="dark red")). Finally, the vaiable .x is removed, as it isno longer required. Users should experiment with changing the graphic inorder to get it into a format that is appropriate for their own research.

14 1. R AND THE RCMDR
Rcmdr Script Window
.x <- seq(-3.291, 3.291, length.out=100)plot(.x, dnorm(.x, mean=0, sd=1),xlab="New X-label", ylab="New Y-label",main=paste("An edited graphic"),
type="h")abline(h=0.3, col="dark red")remove(.x)
output window
Once the graphic is acceptable, the code can then be saved, so that arecord is kept of the analysis enabling it to be re-run later and amended ifneeded. It is a good idea to add enough comments to the code so that it isobvious what has been done. Fully-commented code for the amended graphicshown above might look something like...
Rcmdr Script Window
# Plotting the normal distribution.# a demonstration graphic for the Rcmdr book.## First, obtain 100 equally-spaced data points between -3.291 and +3.291# and save to the object .x
.x <- seq(-3.291, 3.291, length.out=100)## calculate the density function for each point (when mean=0 and sd=1) using ’dnorm’# plot this for each data point
plot(.x, dnorm(.x, mean=0, sd=1),## add labels and titles
xlab="New X-label", ylab="New Y-label",main=paste("An edited graphic"),
## make the graphic look like a histogram (if points are required, try type="p")
type="h")## add a horizontal line at Y=0.3, colour it dark red# see http://research.stowers-institute.org/efg/R/Color/Chart/# for a comprehensive list of colours available for R.
abline(h=0.3, col="dark red")## clean up the workspace by removing the .x variable
remove(.x)
The resulting graphic can now be saved to a number of formats using

1.4. CONCLUSION 15
the ‘Graphs, save graph to file’ menu option in Rcmdr and cut and pastedinto documents. It is, however, preferable to save the code that producedthe graph rather than a jpeg or png image as the code enables the graphicto be reproduced and amended. Graphics can be further edited, if re-quired, using other options that are available within R (for example, chang-ing the axes, line colours, margins, etc.), or by using additional packagessuch as TikzDevice (Sharpsteen and Bracken, 2012) that allows graphics tobe saved in PGF/Tikz format (Tantau, 2010) and edited using a LATEXenvironment (see, for example, http://en.wikibooks.org/wiki/LaTeX, http://www.latex-project.org/guides/ and the books by, Lamport, 1994; Knuth,1986; Kopka and Daly, 2003; Syropoulos et al., 2002)6.
The use of the Rcmdr in conjunction with an editor provides a powerfulsystem for data analysis — one that allows common analyses to be run quicklyand efficiently through the use of a GUI and also enables these analyses tobe amended through the direct editing of R code. Dealing directly with Rcode is a useful skill for many analysts and is one that is encouraged by thecombined use of the Rcmdr with an editor.
1.4 ConclusionR is the most comprehensive and popular statistical package in use today.The open-source framework it is designed around allows researchers fromaround the world to share code and ideas and contribute to the project. Itcan be argued that this community and the sharing of code and ideas isessential for the development of statistical methodology (see ?) and drivesmany of the developments within the field. Knowledge of R and its manylibraries is fast becoming essential for statistics and should form part of anyanalyst’s toolkit.
Although R has been unfairly criticised with respect to ‘ease of use’ andthe steep learning curve it presents new users, this criticism does not applywhen the programme is used in conjunction with a graphical user interface.This book presents a system of analysis where R is used in conjunction withthe R-commander interface and demonstrates that data analysis is easy fornew users using this combination and also helps advanced users to developtheir knowledge and skills with R. The author has taught many studentsstatistics using just R and the Rcmdr and strongly recommends that thissystem for all users - novice and experienced.
6All graphics in this book were procuded using the TikZ package (Tantau, 2010) inconjunction with the tikzDevice R library (Sharpsteen and Bracken, 2012) and the Qtikzsoftware to edit (http://www.hackenberger.at/blog/ktikz-editor-for-the-tikz-language/.)