data analysis and measurement: dancing in the night sky
TRANSCRIPT
EG-2003-02-05-LARC
Data Analysis and Measurement:Dancing in the Night Sky
An Educator Guide with Activities in Mathematics, Science, and Technology
™
Educational Product
Educators Grades 6-8
Data Analysis and Measurement: Dancing in the NightSky is available in electronic format through NASASpacelink - one of NASA’s electronic resourcesspecifically developed for the educationalcommunity. This publication and other educationalproducts may be accessed at the followingaddress: http://spacelink.nasa.gov/products
A PDF version of the educator guide for NASACONNECT™ can be found at the NASA CONNECT™web site: http://connect.larc.nasa.gov
www.cnu.edu
www.epals.com www.riverdeep.net
www.nec.com
http://quest.arc.nasa.gov
NASA CONNECT™ is produced by the NASA Center for Distance Learning, a component of the Office ofEducation at NASA’s Langley Research Center, Hampton, VA. The NASA Center for Distance Learning is operatedunder cooperative agreement NCC-1-02039 with Christopher Newport University, Newport News, VA.Use of trade names does not imply endorsement by NASA.
www.aiaa.org
www.cgcs.org
www.ntcm.org
www.nasa.gov

NASA CONNECT™ is a production of the NASA Langley Research Center, Hampton, VA. All Rights Reserved. Broadcast and off-air rights are unlimited and aregranted in perpetuity with the following stipulations: NASA CONNECT™ shall not be used for commercial purposes; used, in whole or in part, to endorse acommercial product; stored, in whole or in part, in a commercial database; altered electronically, mechanically, or photographically without the expressedand prior written permission of NASA. This publication is in the public domain and is not protected by copyright. Permission is not required for duplication.
Program Overview
Summary and Objectives . . . . . . . . . . . . . . . . . . . . . . 5
Student Involvement . . . . . . . . . . . . . . . . . . . . . . . . . . 5
Cue Card Questions. . . . . . . . . . . . . . . . . . . . . . . . . . . 5
Hands-On Activity . . . . . . . . . . . . . . . . . . . . . . . . . . . . 5
Free Fall Web Activity . . . . . . . . . . . . . . . . . . . . . . . . . 5
Resources. . . . . . . . . . . . . . . . . . . . . . . . . . . . . . . . . . . . . . 5
Hands-On Activity
Background. . . . . . . . . . . . . . . . . . . . . . . . . . . . . . . . . . . . 6
Activity 1: Where To See an Aurora . . . . . . . . . . . . . . 7
National Standards . . . . . . . . . . . . . . . . . . . . . . . . . . . . 7
Instructional Objectives . . . . . . . . . . . . . . . . . . . . . . . . 8
Vocabulary . . . . . . . . . . . . . . . . . . . . . . . . . . . . . . . . . . . . 8
Preparing for the Activity . . . . . . . . . . . . . . . . . . . . . . . 8
Student Materials . . . . . . . . . . . . . . . . . . . . . . . . . . . . 8
Teacher Materials . . . . . . . . . . . . . . . . . . . . . . . . . . . . . 8
Time . . . . . . . . . . . . . . . . . . . . . . . . . . . . . . . . . . . . . . . . . 8
Focus Questions . . . . . . . . . . . . . . . . . . . . . . . . . . . . . 8
The Activity . . . . . . . . . . . . . . . . . . . . . . . . . . . . . . . . . . . . 9
Extensions . . . . . . . . . . . . . . . . . . . . . . . . . . . . . . . . . . . 9
Activity 2: How High Up Are Auroras . . . . . . . . . . 10
National Standards . . . . . . . . . . . . . . . . . . . . . . . . . . 10
Instructional Objectives. . . . . . . . . . . . . . . . . . . . . . 10
Vocabulary . . . . . . . . . . . . . . . . . . . . . . . . . . . . . . . . . 11
Preparing for the Activity . . . . . . . . . . . . . . . . . . . . 11
The Activity . . . . . . . . . . . . . . . . . . . . . . . . . . . . . . . . . 12
Student Worksheets
Where To see an Aurora . . . . . . . . . . . . . . . . . . . . . . . 14
How High Up Are Auroras . . . . . . . . . . . . . . . . . . . . 15
Cue Card Questions . . . . . . . . . . . . . . . . . . . . . . . . . . . 17
Teacher Materials
Cue Card Answers . . . . . . . . . . . . . . . . . . . . . . . . . . . . 18
Aurora Web Activity
National Standards. . . . . . . . . . . . . . . . . . . . . . . . . . . . 20
Instructional Objectives . . . . . . . . . . . . . . . . . . . . . . . 20
Resources
Books, Pamphlets, and Periodicals . . . . . . . . . . . . . 21
Web Sites . . . . . . . . . . . . . . . . . . . . . . . . . . . . . . . . . . . . . 21
Registered users of NASA CONNECT™ mayrequest an American Institute of Aeronautics andAstronautics (AIAA) classroom mentor. For moreinformation or to request a mentor, [email protected].
Captioning provided by NEC Foundation of America
Data Analysis and Measurement:Dancing in the Night Sky
An Educator Guide with Activities in Mathematics, Science, and Technology
Acknowledgments: Special thanks to Summer 2002 Educators in Residence, Dr. Sten Odenwald, Educators inResisdence, Chris Giersch, Bill Williams, and The National Council of Teachers of Mathematics (NCTM).
™


2002-2003 NASA CONNECT™ Series
Data Analysis and Measurement: Dancing in the Night Sky
5http://connect.larc.nasa.gov
EG-2003-02-05-LaRC
In Data Analysis and Measurement: Dancing in theNight Sky, students will learn about the AuroraBorealis or Northern Lights. They will learn themany legends and myths that have revolved aroundthe aurora throughout the history of mankind.Students will also discover how NASA scientists andengineers use satellite technology to measure andanalyze aurora data. They will see how Norwegian
scientists apply the concepts of data analysis andmeasurement to study the Northern Lights by usingground-based instruments and sounding rockets.By conducting hands-on and web activities,students will make connections between NASAresearch and the mathematics, science, andtechnology they learn in their classrooms.
SUMMARY AND OBJECTIVES
Cue Card Questions
Norbert, NASA CONNECT’s™ animated co-host,poses questions throughout the broadcast.
These questions direct the instruction andencourage students to think about theconcepts being presented. When viewinga videotaped version of NASA CONNECT™,
educators have the option to use the CueCard Review, which gives students an
opportunity to reflect and record their answers onthe Cue Cards (p.15). NASA CONNECT’s™ co-host,Jennifer Pulley, will indicate an appropriate time topause the videotape and discuss the answers to thequestions.
Hands-On Activity
The hands-on activity is teacher created and isaligned with the National Council of Teachers ofMathematics (NCTM) Standards, the NationalScience (NSE) Standards, and the InternationalTechnology Education Association (ITEA) Standards.
Students will apply the concepts of data analysisand measurement to plot the auroral oval in thenorthern hemisphere and determine the height ofthe northern lights using Carl Stormer’striangulation method.
Free Fall Web Activity
The Aurora Web Activity is aligned with the NationalCouncil of Teachers of Mathematics (NCTM)Standards, the National Science (NSE) Standards, andthe International Technology Education Association(ITEA) Standards. Using a free, exciting, and object-oriented programming environment called Squeak,students will work collaboratively to investigate thepossibility of auroras on other planets. To access theAurora Web Activity, go to the NASA CONNECT™web site at <http://connect.larc.nasa.gov>.
STUDENT INVOLVEMENT
Teacher and student resources support, enhance,and extend the NASA CONNECT™ program. Books,periodicals, pamphlets, and web sites provideteachers and students with background informationand extensions. In addition to the resources listed inthis educator guide, the NASA CONNECT™ web site
<http://connect.larc.nasa.gov> offers onlineresources for teachers, students, and parents.
RESOURCES
Program Overview

2002-2003 NASA CONNECT™ Series
EG-2003-02-05-LaRC
6 http://connect.larc.nasa.gov
Data Analysis and Measurement: Dancing in the Night Sky
BACKGROUND
Hands-On Activity
The most spectacular example of the way that theSun and Earth are invisibly connected is thephenomenon of the Aurora Borealis (northernlights) and the Aurora Australis (southern lights).Auroras are the beautiful curtains of colored lightthat are commonly seen in the Arctic and Antarcticregions of Earth, which have a long history ofsightings by humans for over 3,000 years. Formillennia, people have watched them and worriedabout what ill omens they represented – war, death,or the wrath of God. It wasn’t until the mid–1800sthat scientists finally began to discover many oftheir mysteries. Like lightning and earthquakes, theywere natural events, not supernatural ones. Thanksto intensive study by research satellites during theSpace Age, auroras have been substantially de-mystified, even as their ethereal beauty hasremained to dazzle and inspire awe.
Auroral intensity varies from night to night andduring a single night, with best viewing usually fromlate evening through the early morning hours.Strong auroras can be seen in the continentalUnited States, particularly in the north duringsunspot maximum years. Although auroras arebeautiful to view, they can seriously disrupt radiocommunications, radio navigation, some defense-related radar systems, and power transmission lines.Current created by changing magnetic fieldsaccompanying an aurora causes corrosion in pipes,including the Trans-Alaskan pipeline.
By the turn of the 20th century, scientists actuallycreated artificial auroras in their laboratories. Oncetelevision and the fluorescent lamp were invented, itwas obvious how auroras worked. Auroras aresimilar to color television images. In the picturetube, a beam of electrons controlled by electric andmagnetic fields strikes the screen, making it glow incolors. What scientists still didn’t understand waswhat triggered auroras. Some thought it was fromdirect currents of particles from the Sun itself, anexplanation you will still find in current textbooks!
Other scientists thought it was more complicatedthan that. The current standard explanation follows:
Auroral light is produced by a high-vacuumelectrical discharge is powered by interactionsbetween the Sun and Earth. The Sun is a plasma or agas of charged particles that is so hot its outermostpart blows away as solar wind. Consisting ofcharged particles, this tenuous gas travels to Earth inabout three days. Because the Earth’s magnetic fieldprevents the solar wind from penetrating ouratmosphere, its solar particles stream around ourplanet, encasing Earth and its magnetic field withina comet-shaped cavity called the magnetosphere.
Energetic electrons colliding with oxygen andnitrogen molecules in the atmosphere cause thedelicate colors. The brightest and most commonauroral color, a brilliant yellow-green, is produced byoxygen atoms at roughly a 100–km altitude. Highaltitude oxygen atoms (about 300 km) produce rare,all red auroras. Ionized nitrogen molecules produceblue light; neutral nitrogen molecules createpurplish-red lower borders and ripple edges. Theatmosphere of oxygen and nitrogen acts as a 3Dtelevision screen that displays the awesome danceof charged particles from the Sun as they interactwith the Earth’s magnetic field.
When a major storm buffets Earth’s magnetic field, itcauses some parts of this field to rearrange itself, likerubber bands pulled to their breaking point andreleasing energy that causes powerful currents ofparticles to flow from distant parts of the magneticfield into the atmosphere. These particles did notcome directly from the Sun, but were alreadytrapped in the magnetic field like flies in a bottle.The particles flow along the magnetic field into thePolar regions and collide with nitrogen and oxygenatoms in the atmosphere. They never reach theground, although it sometimes seems as thoughthey do!

2002-2003 NASA CONNECT™ Series
Data Analysis and Measurement: Dancing in the Night Sky
7http://connect.larc.nasa.gov
EG-2003-02-05-LaRC
Mathematics (NCTM) Standards
• Understand and use ratios and proportions torepresent quantitative relationships.
• Model and solve contextualized problems usingvarious representations such as graphs, tables, andequations.
• Understand relationships among units and convertfrom one unit to another within the same system.
• Solve problems involving scale factors using ratiosand proportion.
• Build new mathematical knowledge throughproblem solving.
• Organize and consolidate mathematical thinkingthrough communication.
• Communicate mathematical thinking coherentlyand clearly to peers, teachers, and others.
• Use representations to model and interpretphysical, social, and mathematical phenomena.
Science (NSE) Standards
• Unifying Concepts and Processes
• Physical Science
• Earth and Space Science
• Science in Personal and Social Perspectives
Technology (ITEA) Standards
The Nature of Technology
• Systems thinking involves considering how everypart relates to others.
Design
• Design involves a set of steps, which can beperformed in different sequences and repeated asneeded.
Abilities for a Technological World
• Make two-dimensional and three-dimensionalrepresentations of the designed solutions.
Use and maintain products and systems
• Use information provided in manuals, protocols, orby experienced people to see and understand howthings work.
Abilities for a technical world
• Design and use instruments to gather data.
The design world
• The use of symbols, measurements, and drawingspromotes clear communication by providing acommon language to express ideas.
NATIONAL STANDARDS
Many inhabitants of northern regions claim thatthey can hear the crackling sound of an aurorawhen it is particularly bright and active. At firstscientists dismissed this belief as merely folklorebecause sound waves cannot travel through thevery thin air where the auroras are produced andreach the ground. Modern research, however, has
found another explanation that has to do withelectric charges near the ground that produce thesound right where you are standing! So the nexttime you see an aurora, be very quiet and enjoythe celestial dance of light.
Activity 1: Where To See an Aurora(Recommended for grade level 6-7)

2002-2003 NASA CONNECT™ Series
EG-2003-02-05-LaRC
8 http://connect.larc.nasa.gov
Data Analysis and Measurement: Dancing in the Night Sky
The student will
• find and plot locations on maps using geographiccoordinates.
• draw conclusions based on graphical information.
• convert centimeters to kilometers using a givenscale.
INSTRUCTIONAL OBJECTIVES
latitude – a geographic coordinate measured fromthe equator with positive values going north andnegative values going south.
longitude – a geographic coordinate measuredfrom the prime meridian (0˚ degrees longitude) thatruns through Greenwich, England, with positivevalues going east and negative values going west
VOCABULARY
PREPARING FOR THE ACTIVITY
Student MaterialsMetric rulerColored pencilsStudent Activity Sheet 1Atlas
Teacher Materials
Teacher resource map
Time
Discussing the activity 5 minutesPreparing the activity 5 minutesConducting the activity 30 minutes
Focus Questions1. What do you know about auroras (northern
lights)?2. Where would you expect to be able to see an
aurora?3. Why are the auroras viewed close to the North
and South Poles?
2002-2003 NASA CONNECT™ Series
Data Analysis and Measurement: Dancing in the Night Sky
9http://connect.larc.nasa.gov
EG-2003-02-05-LaRC
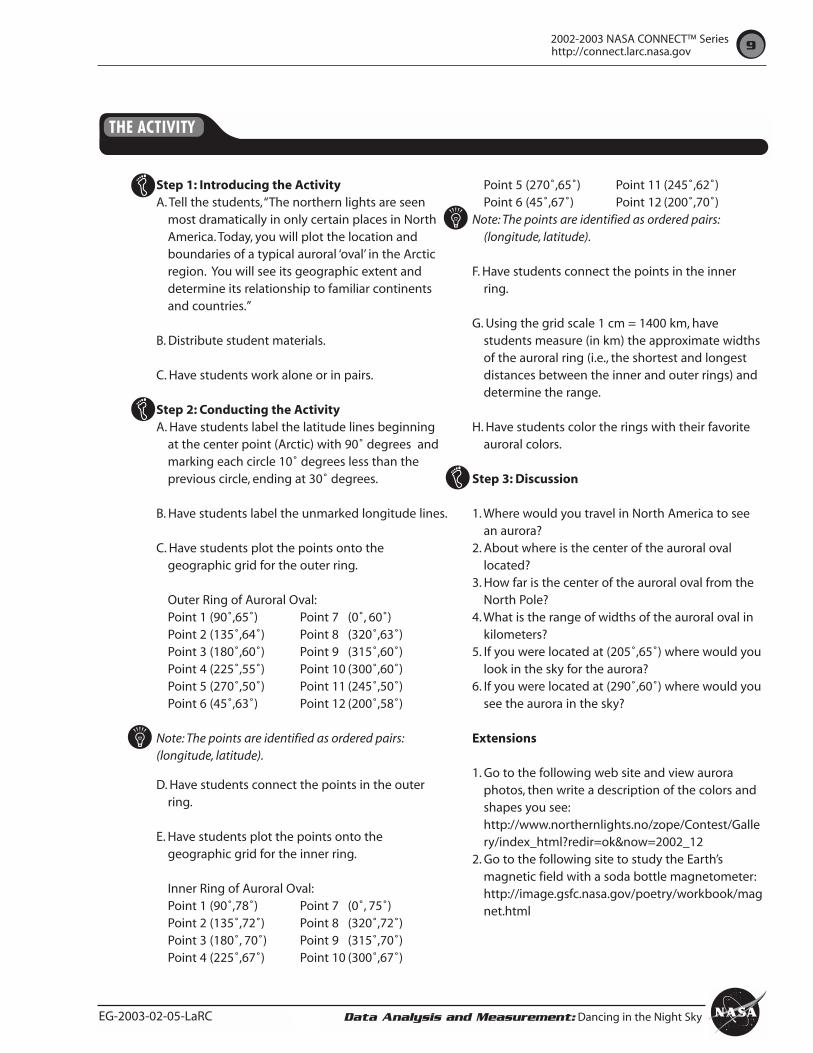
Step 1: Introducing the ActivityA. Tell the students,“The northern lights are seen
most dramatically in only certain places in NorthAmerica. Today, you will plot the location andboundaries of a typical auroral ‘oval’ in the Arcticregion. You will see its geographic extent anddetermine its relationship to familiar continentsand countries.”
B. Distribute student materials.
C. Have students work alone or in pairs.
Step 2: Conducting the ActivityA. Have students label the latitude lines beginning
at the center point (Arctic) with 90˚ degrees andmarking each circle 10˚ degrees less than theprevious circle, ending at 30˚ degrees.
B. Have students label the unmarked longitude lines.
C. Have students plot the points onto thegeographic grid for the outer ring.
Outer Ring of Auroral Oval:Point 1 (90˚,65˚) Point 7 (0˚, 60˚)Point 2 (135˚,64˚) Point 8 (320˚,63˚)Point 3 (180˚,60˚) Point 9 (315˚,60˚)Point 4 (225˚,55˚) Point 10 (300˚,60˚)Point 5 (270˚,50˚) Point 11 (245˚,50˚)Point 6 (45˚,63˚) Point 12 (200˚,58˚)
Note: The points are identified as ordered pairs:(longitude, latitude).
D. Have students connect the points in the outerring.
E. Have students plot the points onto thegeographic grid for the inner ring.
Inner Ring of Auroral Oval:Point 1 (90˚,78˚) Point 7 (0˚, 75˚)Point 2 (135˚,72˚) Point 8 (320˚,72˚)Point 3 (180˚, 70˚) Point 9 (315˚,70˚)Point 4 (225˚,67˚) Point 10 (300˚,67˚)
Point 5 (270˚,65˚) Point 11 (245˚,62˚)Point 6 (45˚,67˚) Point 12 (200˚,70˚)
Note: The points are identified as ordered pairs:(longitude, latitude).
F. Have students connect the points in the innerring.
G. Using the grid scale 1 cm = 1400 km, havestudents measure (in km) the approximate widthsof the auroral ring (i.e., the shortest and longestdistances between the inner and outer rings) anddetermine the range.
H. Have students color the rings with their favoriteauroral colors.
Step 3: Discussion
1. Where would you travel in North America to seean aurora?
2. About where is the center of the auroral ovallocated?
3. How far is the center of the auroral oval from theNorth Pole?
4. What is the range of widths of the auroral oval inkilometers?
5. If you were located at (205˚,65˚) where would youlook in the sky for the aurora?
6. If you were located at (290˚,60˚) where would yousee the aurora in the sky?
Extensions
1. Go to the following web site and view auroraphotos, then write a description of the colors andshapes you see:http://www.northernlights.no/zope/Contest/Gallery/index_html?redir=ok&now=2002_12
2. Go to the following site to study the Earth’smagnetic field with a soda bottle magnetometer:http://image.gsfc.nasa.gov/poetry/workbook/magnet.html
THE ACTIVITY

2002-2003 NASA CONNECT™ Series
EG-2003-02-05-LaRC
1 0 http://connect.larc.nasa.gov
Data Analysis and Measurement: Dancing in the Night Sky
Mathematics (NCTM) Standards
• Develop an initial conceptual understanding ofdifferent uses of variables.
• Build new mathematical knowledge throughproblem solving.
• Analyze and evaluate the mathematical thinkingand strategies of others.
• Select, apply, and translate among mathematicalrepresentations to solve problems.
• Draw and construct representations of two- andthree- dimensional geometric objects and theircompositions.
• Use geometric ideas to solve problems in, and gaininsights into, other disciplines and other areas ofinterest.
• Use trigonometric relationships to determinelengths and angle measures.
Science (NSE) Standards
• Unifying Concepts and Processes
• Earth and Space Science
• Science and Technology
Technology (ITEA) Standards
Relationship Among Technologies and theconnections between Technology and other fields
• Knowledge gained from other fields of study has adirect effect on the development of technologicalproducts and systems.
• Technological process promotes the advancementof science and mathematics.
Apply design process
• Apply a design process to solve problems in andbeyond the laboratory–classroom.
• Use and maintain products and systems.
• Use computers and calculators in variousapplications.
Abilities for a Technological World
• Design and use instruments to gather data.
The Design World
• The use of symbols, measurements, and drawingspromotes clear communication by providing acommon language to expression.
• Energy cannot be created or destroyed; however, itcan be converted from one form to another.
NATIONAL STANDARDS
The student will
• use trigonometry to determine the height oftriangles.
• make a conjecture based on calculations.
• practice error analysis.
• use a scientific calculator to solve problemsinvolving trigonometry.
INSTRUCTIONAL OBJECTIVES
Activity 2: How High Up Are Auroras? (Recommended for grade level 8)

2002-2003 NASA CONNECT™ Series
EG-2003-02-05-LaRC Data Analysis and Measurement: Dancing in the Night Sky
11http://connect.larc.nasa.gov
altitude – the perpendicular distance from a vertexto a line containing that base; also called the height
base – the length of one of the sides of a polygon.
conjecture – a guess based on observations orexperimentation
isosceles triangle – a triangle with two congruentor equal sides
magnetosphere – the Earth’s protective shield,made up of invisible lines of a magnetic field thatradiate out into space from the poles; themagnetosphere deflects the solar wind from directlyhitting the Earth, protecting the planet fromradiation
sunspot - a dark, cooler spot on the Sun’s surface;charged particles are emitted from these areas. Thediameter of an average sunspot is about the samediameter as that of the Earth.
vertex angle – the angle opposite the base
VOCABULARY
PREPARING FOR THE ACTIVITY
Student MaterialsprotractorcompassStudent Activity Sheet 2scientific calculator
Teacher MaterialsStudent activity (problem) sheets – parts 1 and 2answer key
TimeDiscussing the activity 5 minutesPreparing the activity 5 minutesConducting the activity 30 minutes
Focus Questions
1. What do you know about auroras (northernlights)?
2. Where would you expect to be able to see anaurora?
3. Why are the auroras best viewed close to theNorth and South Poles?
Isosceles Triangle
base
vertex angle
Altitude
Magnetosphere
2002-2003 NASA CONNECT™ Series
EG-2003-02-05-LaRC
1 2 http://connect.larc.nasa.gov
Data Analysis and Measurement: Dancing in the Night Sky
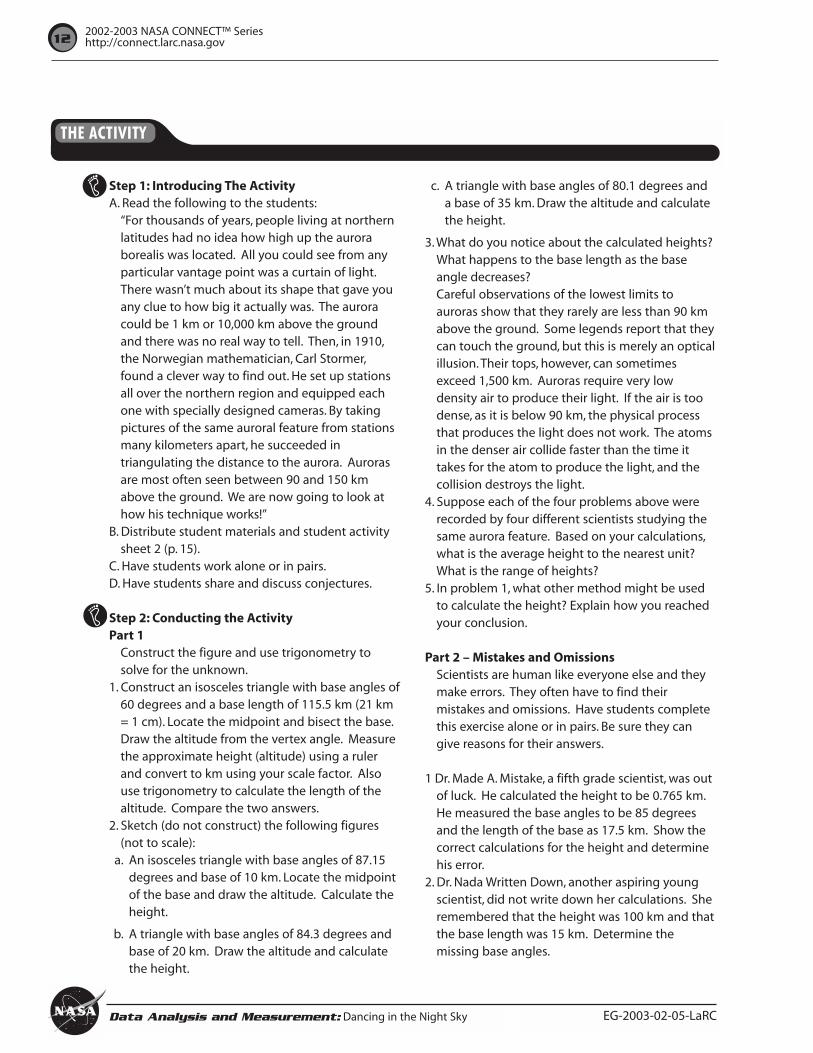
Step 1: Introducing The ActivityA. Read the following to the students:
“For thousands of years, people living at northernlatitudes had no idea how high up the auroraborealis was located. All you could see from anyparticular vantage point was a curtain of light.There wasn’t much about its shape that gave youany clue to how big it actually was. The auroracould be 1 km or 10,000 km above the groundand there was no real way to tell. Then, in 1910,the Norwegian mathematician, Carl Stormer,found a clever way to find out. He set up stationsall over the northern region and equipped eachone with specially designed cameras. By takingpictures of the same auroral feature from stationsmany kilometers apart, he succeeded intriangulating the distance to the aurora. Aurorasare most often seen between 90 and 150 kmabove the ground. We are now going to look athow his technique works!”
B. Distribute student materials and student activitysheet 2 (p. 15).
C. Have students work alone or in pairs.D. Have students share and discuss conjectures.
Step 2: Conducting the ActivityPart 1
Construct the figure and use trigonometry tosolve for the unknown.
1. Construct an isosceles triangle with base angles of60 degrees and a base length of 115.5 km (21 km= 1 cm). Locate the midpoint and bisect the base.Draw the altitude from the vertex angle. Measurethe approximate height (altitude) using a rulerand convert to km using your scale factor. Alsouse trigonometry to calculate the length of thealtitude. Compare the two answers.
2. Sketch (do not construct) the following figures(not to scale):
a. An isosceles triangle with base angles of 87.15degrees and base of 10 km. Locate the midpointof the base and draw the altitude. Calculate theheight.
b. A triangle with base angles of 84.3 degrees andbase of 20 km. Draw the altitude and calculatethe height.
c. A triangle with base angles of 80.1 degrees anda base of 35 km. Draw the altitude and calculatethe height.
3. What do you notice about the calculated heights?What happens to the base length as the baseangle decreases?Careful observations of the lowest limits toauroras show that they rarely are less than 90 kmabove the ground. Some legends report that theycan touch the ground, but this is merely an opticalillusion. Their tops, however, can sometimesexceed 1,500 km. Auroras require very lowdensity air to produce their light. If the air is toodense, as it is below 90 km, the physical processthat produces the light does not work. The atomsin the denser air collide faster than the time ittakes for the atom to produce the light, and thecollision destroys the light.
4. Suppose each of the four problems above wererecorded by four different scientists studying thesame aurora feature. Based on your calculations,what is the average height to the nearest unit?What is the range of heights?
5. In problem 1, what other method might be usedto calculate the height? Explain how you reachedyour conclusion.
Part 2 – Mistakes and OmissionsScientists are human like everyone else and theymake errors. They often have to find theirmistakes and omissions. Have students completethis exercise alone or in pairs. Be sure they cangive reasons for their answers.
1 Dr. Made A. Mistake, a fifth grade scientist, was outof luck. He calculated the height to be 0.765 km.He measured the base angles to be 85 degreesand the length of the base as 17.5 km. Show thecorrect calculations for the height and determinehis error.
2. Dr. Nada Written Down, another aspiring youngscientist, did not write down her calculations. Sheremembered that the height was 100 km and thatthe base length was 15 km. Determine themissing base angles.
THE ACTIVITY

2002-2003 NASA CONNECT™ Series
EG-2003-02-05-LaRC Data Analysis and Measurement: Dancing in the Night Sky
13http://connect.larc.nasa.gov
3. Dr. Flipped D. Numbers is having a tough timefiguring out where the mistake is in thecalculations. The base length was 33.5 km and thebase angles were 80.5 degrees. The height that hedetermined was 191.45 km. How could he havemade this mistake?
Step 3: Discussion
1. How can error analysis help students have a betterunderstanding of problem solving?
2. We have used trigonometry to estimate the heightof auroras. How else might one applytrigonometric principles to problem solving?
Extensions
1. Apply direct measurement of angles and length todetermine height using a clinometer and thetangent ratio.http://www.globe.org.uk/activities/toolkit/toolkit.pdf

2002-2003 NASA CONNECT™ Series
EG-2003-02-05-LaRC
14 http://connect.larc.nasa.gov
Data Analysis and Measurement: Dancing in the Night Sky
Name : Date:
270o 90o
180o
0o
Student WorksheetsActivity 1: Where to See an Aurora
Outer Ring of Auroral Oval:Point 1 (90,65) Point 7 (0, 60)Point 2 (135,64) Point 8 (320,63)Point 3 (180,60) Point 9 (315,60)Point 4 (225,55) Point 10 (300,60)Point 5 (270,50) Point 11 (245,50)Point 6 (45,63) Point 12 (200,58)
Inner Ring of Auroral Oval:Point 1 (90,78) Point 7 (0, 75)Point 2 (135,72) Point 8 (320,72)Point 3 (180, 70) Point 9 (315,70)Point 4 (225,67) Point 10 (300,67)Point 5 (270,65) Point 11 (245,62)Point 6 (45,67) Point 12 (200,70)
Approximate Width:Shortest distance kmLongest distance km
Range km
Grid Scale: 1 cm = 1400 km

2002-2003 NASA CONNECT™ Series
EG-2003-02-05-LaRC Data Analysis and Measurement: Dancing in the Night Sky
15http://connect.larc.nasa.gov
Name : Date:
Student WorksheetsActivity 2: How High up are Aurora?
Part 1
Construct the figure and use trigonometry to solvefor the given unknown.
1. Construct an isosceles triangle with base anglesof 60 degrees and a base length of 115.5 km (21km = 1 cm). Locate the midpoint and bisect thebase. Draw the altitude from the vertex angle.Measure the approximate height (altitude) usinga ruler and convert to km using your scale factor.Also use trigonometry to calculate the length ofthe altitude. Compare the two answers.
2. Sketch (do not construct) the following figures(not to scale):
a. An isosceles triangle with base angles of 87.15 degrees and base 10 km. Locate the midpoint of the base and draw the altitude. Calculate the height.
b. A triangle with base angles of 84.3 degrees and base 20 km. Draw the altitude and calculate the height.
c. A triangle with base angles of 80.1 degrees and a base of 35 km. Draw the altitude and calculate the height.
3. What do you notice about the calculatedheights? What happens to the base length as thebase angle decreases?
Careful observations of the lowest limits to aurora showthat they rarely are less than 90 km above the ground.Some legends report that they can touch the ground,but this is merely an optical illusion. Their tops, however,can sometimes exceed 1,500 km. Auroras require verylow density air in order to produce their light. If the airis too dense, as it is below 90 km, the physical processthat produces the light does not work. The atoms in thedenser air collide faster than the time it takes for theatom to produce the light, and the collision destroys thelight.
4. Suppose each of the four problems above wererecorded by four different scientists studying thesame aurora feature. Based on your calculations,what is the average height to the nearest unit?What is the range of heights?
5. In problem 1, what other method might be usedto calculate the height? Explain how you arrivedat your conclusion.
2002-2003 NASA CONNECT™ Series
EG-2003-02-05-LaRC
1 6 http://connect.larc.nasa.gov
Data Analysis and Measurement: Dancing in the Night Sky
Name : Date:
Student WorksheetsActivity 2: How High up are Aurora?
Part 2 – Mistakes and Omissions
Scientists are human like everyone else andthey make errors. They often have to find theirmistakes and omissions. Have studentscomplete this exercise alone or in pairs. Be surethey can give reasons for their answers.
1. Dr. Made A. Mistake, a fifth scientist, wasout of luck. He calculated the height tobe 0.765 km. He measured the baseangles to be 85 degrees and the lengthof the base of 17.5 km. Show the correctcalculations for the height anddetermine his error.
2. Dr. Nada Written Down, another aspiringyoung scientist, did not write down hercalculations. She remembered that theheight was 100 km and that the baselength was 15 km. Determine themissing base angles.
3. Dr. Flipped D. Numbers is having a toughtime figuring out where the mistake is inthe calculations. The base length was33.5 km and the base angles were 80.5degrees. The height that he determinedwas 191.45 km. How could he havemade this mistake?
2002-2003 NASA CONNECT™ Series
EG-2003-02-05-LaRC Data Analysis and Measurement: Dancing in the Night Sky
17http://connect.larc.nasa.gov
Cue CardsName:
Date:
Professor Alv Egeland, University of Oslo
1
2
3
How is a
magnetometer
used to measure
auroral activity?
In analyzing the
graph, what indicates
a great disturbance in
the Earth’s magnetic
field?
How are sounding
rockets useful to
scientists and
engineers?
1
2
3
Why do scientists use satellite images to monitor the auroras?
In analyzing the graph, what determines an increase in auroral activity?
What are the phases of an Aurora?
Dr. Nicky Fox, Senior Professional Staff Scientist, Johns Hopkins University/Applied Physics Laboratory

2002-2003 NASA CONNECT™ Series
EG-2003-02-05-LaRC
18 http://connect.larc.nasa.gov
Data Analysis and Measurement: Dancing in the Night Sky
Possible Answer: It appears that the greater the deviations from the geomagnetic
standard values, the greater the disturbances of the magnetic field, which, in turn,
creates greater auroral activity.
Possible Answer: Sounding rockets provide the only means of carrying scientific
instruments directly into the auroral regions. The rockets that are launched at the
rocket range are 10 to 20 meters in length and attain altitudes of about 350 km.
Cue Cards
Professor Alv Egeland, University of Oslo
1
2
3
How is a
magnetometer
used to measure
auroral activity?
In analyzing the
graph, what indicates
a great disturbance in
the Earth’s magnetic
field?
How are sounding
rockets useful to
scientists and
engineers?
1
2
3
Dr. Nicky Fox, Senior Professional Staff Scientist, Johns Hopkins University/Applied Physics Laboratory
Possible Answer: A magnetometer is an instrument that measures weak, short-term
variations in the strength of the Earth’s geomagnetic field. These variations are due to
electric currents in the upper atmosphere. The electrons and ions of the solar wind, which
also produces the aurora, cause these currents; so, a magnetometer measures a quantity
that is directly related to the northern lights. The stronger the magnetic variations, the
higher the auroral activity.
Teacher Materials
Why do scientists use satellite images to monitor the auroras?
In analyzing the graph, what determines an increase in auroral activity?
What are the phases of an Aurora?
Possible Answer: Scientists use satellite images to monitor the position of the various
auroral features. In particular, the latitudinal location of the equatorward edge of the
aurora determines the amount of activity. The chosen the aurora moves towards the
equator, the bigger the event.
Possible Answer: The closer the aurora moves towards the equator, the bigger the event.
Possible Answer: The Quiet Phase, the Growth Phase, the Onset Phase, The Expansion
Phase, the Maximum Area Phase, and the Recovery Phase.

2002-2003 NASA CONNECT™ Series
Data Analysis and Measurement: Dancing in the Night Sky
19http://connect.larc.nasa.gov
EG-2003-02-05-LaRC
This activity uses a free, exciting, multimedia, object-oriented programming environment called Squeakthat runs on 25 different computer platforms. Youcan download the plug-in for Squeak atwww.squeakland.org and then double-click thedownloaded icon for easy installation. Once you havethe Squeak plug-in installed, you can access theactivity at <http://connect.larc.nasa.gov/dansdomain.html> using either IE or Netscape as abrowser. Once the activity loads, click on the orangetab at the left, labeled Navigator, to make it pop upand then click on Escape Browser to remove thebrowser controls so you have more room. Also clickthe Navigator tab shut for more room. This activity isdesigned for use by students, teachers, and parentsin the school or home setting. Now you are ready tostart the activity.
The focus of this activity is for teams of students towork collaboratively to investigate the possibility ofauroras on other planets. Auroras have beenobserved on other planets, and they are believed toexist on still more planets. It is the student team’s jobto figure this out. They should start by reviewingwhat they learned about auroras on Earth from theNASA CONNECT™ broadcast and generate a list ofconditions that are required for auroras to exist. Itwould be best for the groups to create a table ormatrix of the necessary conditions so they cancompare Earth more easily to the other planets. Theywill find exploration tools waiting for them todiscover the conditions on the other planets so theycan fill in their table. Through comparison, the teamsshould be able to determine which other planetscould have auroras, and they should be encouragedto present their conclusions to their classmates.
There is an active book in the middle of the screen tohelp you understand what the tool measures and thetechnology involved in making the measurements.The students should read the active book forimportant information regarding the investigation.Included in the active book are mathematicsproblems to solve which require the students towork with numbers and units and understand ratios.Have fun and explore.
Aurora Web Activity

2002-2003 NASA CONNECT™ Series
EG-2003-02-05-LaRC
20 http://connect.larc.nasa.gov
Data Analysis and Measurement: Dancing in the Night Sky
NATIONAL STANDARDS
Mathematics (NCTM) Standards• Work flexibly with fractions, decimals, and percents
to solve problems.
• Understand and use ratios and proportions torepresent quantitative relationships.
• Understand the meaning and effects of arithmeticoperations with fractions, decimals, and integers.
• Represent, analyze, and generalize a variety ofpatterns with tables, graphs, words, and, whenpossible, symbolic rules.
• Understand both metric and customary systems ofmeasurement.
• Understand relationships among units and convertfrom one unit to another within the system.
• Solve problems involving scale factors, using ratioand proportion.
• Formulate questions, design studies, and collectdata about a characteristic shared by twopopulations or different characteristics within onepopulation.
• Apply and adapt a variety of appropriate strategiesto solve problems.
• Communicate mathematical thinking coherentlyand clearly to peers, teachers, and others.
• Analyze and evaluate the mathematical thinkingand strategies of others.
Science (NSE) Standards
• Abilities necessary to do scientific inquiry
• Structure of the Earth System
• Earth and the Solar System
Technology (ITEA) Standards
The Nature of Technology
• New products and systems can be developed tosolve problems or to help do things that could notbe done without the help of technology.
Abilities for a Technological World
• Use computers and calculators in variousapplications.
The students will
• review and solidify their understanding of aurorason Earth from the NASA CONNECT™ program,“Dancing in the Night Sky”.
• work collaboratively in groups based on theirreview to develop a list of the essential conditionsthat lead to auroras on Earth.
• work collaboratively in groups to determine whichother planets in our solar system could haveauroras, by–
• exploring properties of other planets using theSqueak project available at the NASA CONNECT™website
• using their list of essential conditions to solve thetask.
• working with numbers and ratios to solveproblems which compare various properties of theplanets.
• reporting the results of their investigation to theircolleagues.
INSTRUCTIONAL OBJECTIVES

2002-2003 NASA CONNECT™ Series
EG-2003-02-05-LaRC Data Analysis and Measurement: Dancing in the Night Sky
21http://connect.larc.nasa.gov
Hall, Calvin; Pederson, Daryl; Northern Lights: TheScience, Myth and Wonder of Aurora, SasquatchBooks, 2001.
Jago, Lucy; The Northern Lights: The True Story of theMan Who Unlocked the Secrets of the Aurora Borealis,Knopf, 2001.
Savage, Candace; Aurora: The Mysterious NorthernLights, Firefly, 2001.
Syun-Ichi, Akasofu; Aurora Borealis: The AmazingNorthern Lights, Alaska Geographic Society, 1979.
Todd, Flip; Aurora Borealis; A Photo Memory, ToddCommunications, 1999.
BOOKS, PAMPHLETS, AND PERIODICALS
Exploratorium "Auroras:Paintings in the Sky"
http://www.exploratorium.edu/learning_studio/auroras/
Archive of aurora photos by Jan Curtis:
http://www.geo.mtu.edu/weather/aurora/images/aurora/jan.curtis/
Archive of aurora photos by Dick Hutchinson:
http://www.ptialaska.net/~hutch/aurora.html
Space Weather Today:
http://www.spaceweather.com/
IMAGE real-time aurora images from space:
http://image.gsfc.nasa.gov/poetry/today/intro.html
http://www.sec.noaa.gov/IMAGE/
http://sprg.ssl.berkeley.edu/image/
NOAA Auroral Activity monitor:
http://www.sec.noaa.gov/pmap/index.html
CANOPUS real-time auroral monitor:
http://www.dan.spagency.ca/www/rtoval.htm#TOPOFPAGE
Current solar activity report:
http://www.dxlc.com/solar/
Alaska Science Aurora page for kids:
http://www.alaskascience.com/aurora.htm
Human Impacts of Space Weather:
http://image.gsfc.nasa.gov/poetry/weather01.html
Ask the Space Scientist:
http://image.gsfc.nasa.gov/poetry/ask/askmag.html
More classroom activities:
http://image.gsfc.nasa.gov/poetry/activities.html
The Northern Lights Essay Competition:
http://image.gsfc.nasa.gov/poetry/alaska/alaska.html
Figure This!
Offers Mathematics Challenges that middle schoolstudents can do at home with their families toemphasize the importance of a high-qualitymathematics education for all.
http://www.figurethis.org
Engineer Girl
Part of the National Academy of Engineering’sCelebration of Women in the Engineering project.The project brings national attention to theopportunity that engineering represents to peopleof all ages, but particularly to women and girls.
http://www.engineergirl.org
NCTM – National Council Teachers ofMathematics
http://www.nctm.org
WEB SITES
Resources