data analysis and interpretation - …shodhganga.inflibnet.ac.in/bitstream/10603/4835/14/14_chapter...
TRANSCRIPT
124
DATA ANALYSIS AND INTERPRETATION
This chapter deals with the analysis and interpretation. Primary data collection
was done through scientifically prepared questionnaire to measure the tangible and
intangible attributes of hotel industry. Totally 300 questionnaires were distributed to
the customers who had visited the target group of hotel branches at least five times,
based on the recommendation from the Supervisor and Waiters of Sree Annapoorna
Sree Gowrishankar Group of Hotels. Among the 300 distributed questionnaires only
280 (i.e. 166 from North Zone & 114 from south Zone) were found to be fit for
further analysis (where 14 from North Zone and 6 from South Zone were not fit
for further analysis) the collected data were coded, edited, consolidated and then
entered into the master table. Then, sub-tables were prepared from the master table.
The statistical package SPSS (11 version) was used for analysis and interpretation
tasks. The outputs are:
1. Percentage Analysis,
2. Z -Test,
3. Chi-Square Test,
4. ANOVA,
5. Cross Tables,
6. Correspondence Analysis,
7. Multiple Regression Analysis,
8. ‘Garrets Ranks’ were shown in this chapter.

253
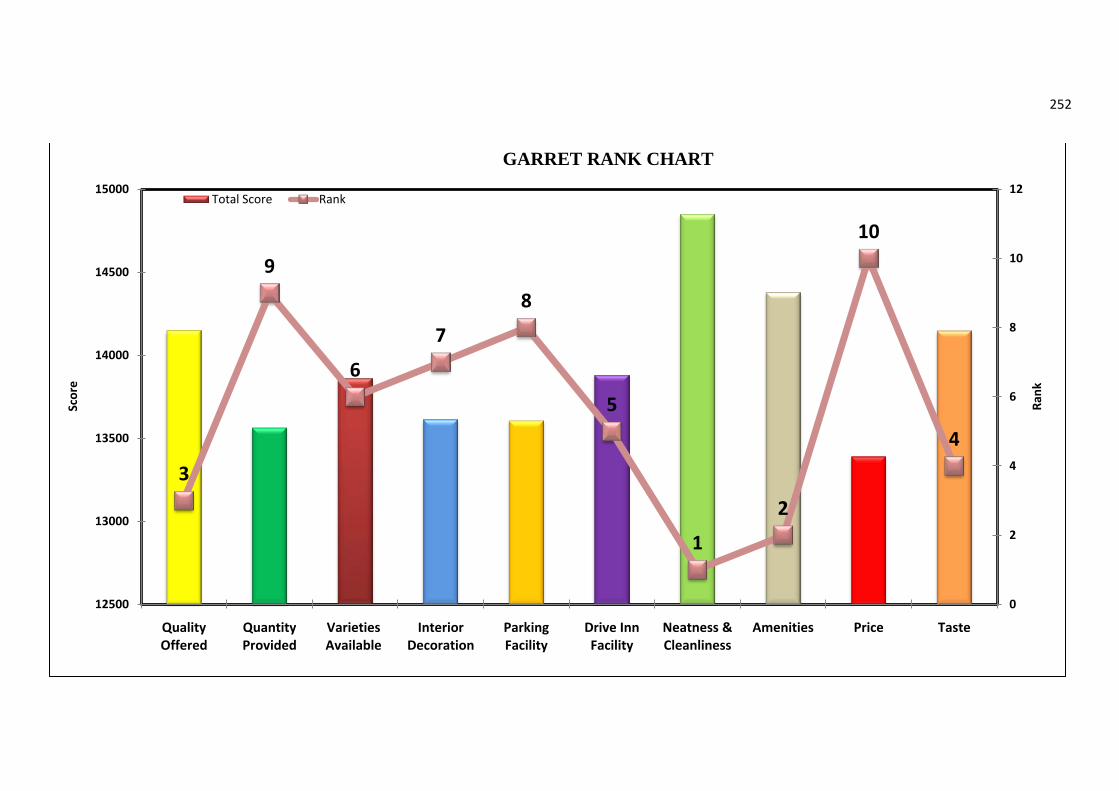
From the table it is understood that neatness and Cleanliness was given the
first rank, amenities was given the second rank and quality offered was given the
third rank.
Among the various attributes listed above the respondents have their own
preferences towards certain attributes, which they feel as a must. The hotels should
provide a Neat & Clean environment, because people are aware that only a hygienic
food and place will safeguard them from infections and germs, and essentially the
hotel has to provide lot of other amenities like parking space, toilets, waiting hall, to
attract and to retain the customers and finally when it comes to the quality the hotel
cannot compromise with a low quality, customers expect high quality products at a
cheaper price.
SASG has proved in the long run that Neatness and Cleanliness, Amenities
and Quality have been the success factor for all these years.
252
3
9
6
7
8
5
1
2
10
4
0
2
4
6
8
10
12
12500
13000
13500
14000
14500
15000
Quality Offered
Quantity Provided
Varieties Available
Interior Decoration
Parking Facility
Drive Inn Facility
Neatness & Cleanliness
Amenities Price Taste
Rank
Scor
e
Total Score Rank
GARRET RANK CHART

251
GARRET RANK TABLE: 1
Rate 1 2 3 4 5 6 7 8 9 10 Total Rank Score (X) 82 70 63 57 52 47 42 37 30 18
Quality Offered (F1) 37 24 19 30 35 30 24 28 25 28 14149 3 XF1 3034 1680 1197 1710 1820 1410 1008 1036 750 504 Quantity Provided (F2) 20 31 18 21 35 34 34 33 32 22 13564 9 XF2 1640 2170 1134 1197 1820 1598 1428 1221 960 396 Varieties Available (F3) 21 24 38 30 19 38 30 30 26 24 13862 6 XF3 1722 1680 2394 1710 988 1786 1260 1110 780 432 Interior Decoration (F4) 22 21 30 36 20 24 44 29 28 26 13613 7 XF4 1804 1470 1890 2052 1040 1128 1848 1073 840 468
Parking Facility (F5) 22 31 25 21 37 28 18 37 33 28 13605 8 XF5 1804 2170 1575 1197 1924 1316 756 1369 990 504 Drive Inn Facility (F6) 29 28 27 31 26 30 21 25 31 32 13881 5 XF6 2378 1960 1701 1767 1352 1410 882 925 930 576
Neatness & Cleanliness (F7) 36 42 28 32 28 24 30 14 15 31 14850 1 XF7 2952 2940 1764 1824 1456 1128 1260 518 450 558 Amenities (F8) 34 29 32 23 29 24 29 33 26 21 14378 2 XF8 2788 2030 2016 1311 1508 1128 1218 1221 780 378
Price (F9) 14 34 31 29 25 24 25 30 37 31 13390 10 XF9 1148 2380 1953 1653 1300 1128 1050 1110 1110 558 Taste (F10) 45 16 32 27 26 24 25 21 27 37 14148 4
XF10 3690 1120 2016 1539 1352 1128 1050 777 810 666

250
5.8 GARRETT RANK ANALYSIS
Introduction:
The respondents were asked to rank the various attributes, which they feel it is
required for the success of the hotel, and the attributes were Quality, Variety,
Neatness and Cleanliness, Quantity, Taste, Price, Interior Decoration and Waiters
service, Parking Facility, Drive-in Facility.
To find out which attribute attract more the respondents were asked to rate
(rank) the attributes. These rates were converted into percentile positioning using
100(R 0.5)PN−
=
Where, P = Percentile Position
R = Rank
N = No of items
Then for these percentile positions the percentile scores were taken from
Garrett’s Table. Taking scores as value of the variable and no of respondents as
frequencies the total score for each attribute was found on the basis of total scores the
ranks were given.
249
5.7 MULTIPLE REGRESSION ANALYSIS
Introduction:
Customer’s opinion towards Quality, Taste, Price, Quantity, Waiter Service,
Neatness and Cleanliness and other attributes were collected in comparison with other
hotels. The researcher had used regression tool to find out among all the other
attributes, which attribute have gained more or higher opinion in favour of SASG
compared to other hotels.
Multiple Regressions is applied to study the extent to which one dependent
variable is influenced by several other independent variables.
The researcher is interested in finding how the high opinion given on SASG
(40.3) (Maximum score for opinion can be 55Where the average is 40.3 hence it is
high opinion), influenced by Waiter Service, Price and Neatness and Cleanliness,
comparing with other hotels. By applying multiple regressions technique
The following Regression Equation is obtained
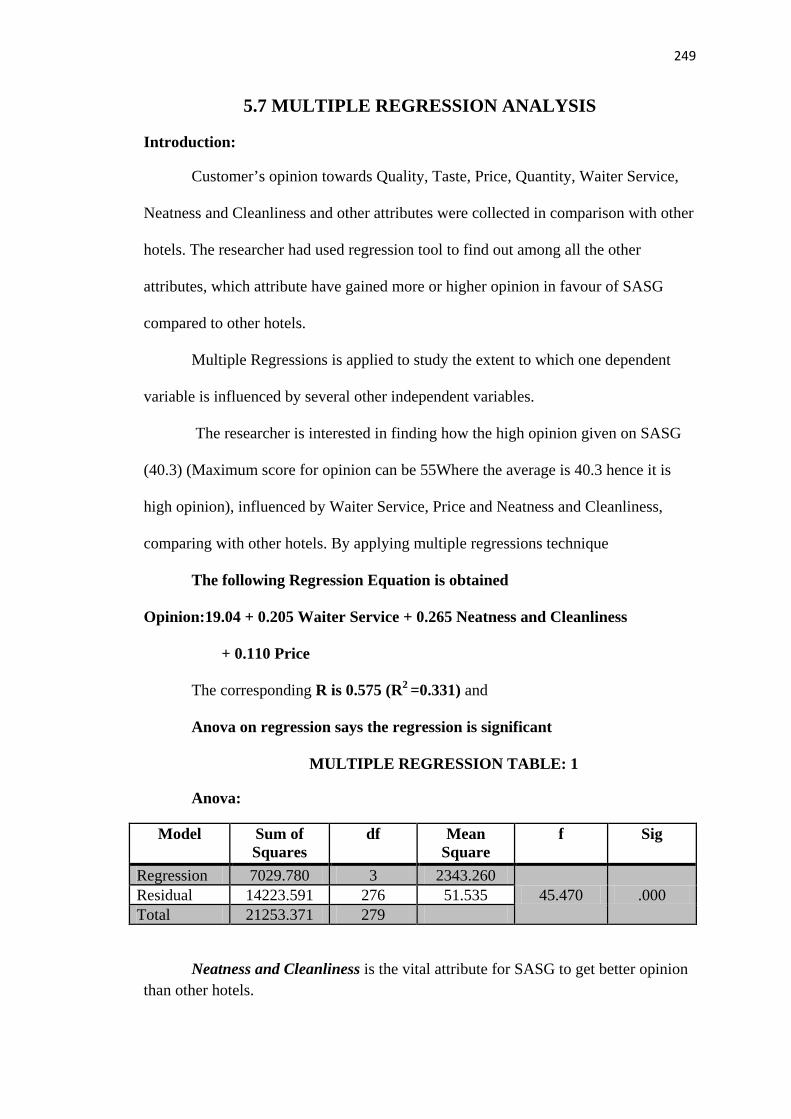
Opinion:19.04 + 0.205 Waiter Service + 0.265 Neatness and Cleanliness
+ 0.110 Price
The corresponding R is 0.575 (R2 =0.331) and
Anova on regression says the regression is significant
MULTIPLE REGRESSION TABLE: 1
Anova:
Model Sum of Squares
df Mean Square
f Sig
Regression 7029.780 3 2343.260 45.470 .000 Residual 14223.591 276 51.535
Total 21253.371 279
Neatness and Cleanliness is the vital attribute for SASG to get better opinion than other hotels.

231
5.6 CORRESPONDENCE TABLE ANALYSIS: 1
Introduction:
Correspondence analysis is an interdependent technique, applied for
dimensional reduction and perceptual mapping. It is a compositional technique based
on the association between the objects and a set of descriptive characteristics.
Correspondence Analysis portrays the correspondence of categories. This
correspondence is the basis for developing Perceptual mapping.
Respondents have their own opinion towards the quality on various branches.
BRANCHES / OPINION ON QUALITY
Branches / Opinion on Quality
Score in dimensions 1 2
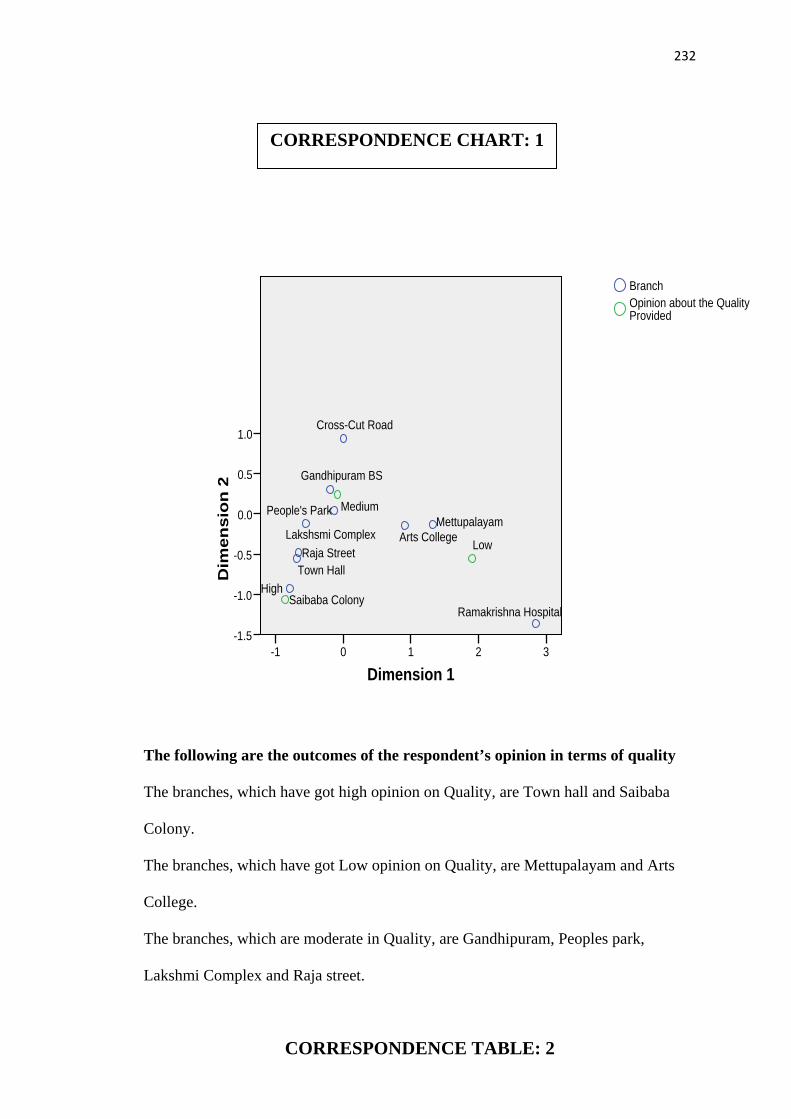
Raja Street -.665 -.484 Gandhipuram Bus-stand -.197 .308 Arts College .912 -.143 Saibaba Colony -.793 -.925 Lakshmi Complex -.558 -.113 TownHall -.686 -.556 Cross Cut Road .004 .936 Mettupalayam 1.322 -.128 Peoples park -.135 .046 RamaKrishna Hospital 2.848 -1.360 Low 1.906 -.553 Medium -.089 .236 High -.859 -1.064
232
Dimension 13210-1
Dim
ensi
on
2
1.0
0.5
0.0
-0.5
-1.0
-1.5
High
Medium
Low
Ramakrishna Hospital
People's ParkMettupalayam
Cross-Cut Road
Town Hall
Lakshsmi Complex
Saibaba Colony
Arts College
Gandhipuram BS
Raja Street
Opinion about the Quality Provided
Branch
The following are the outcomes of the respondent’s opinion in terms of quality
The branches, which have got high opinion on Quality, are Town hall and Saibaba
Colony.
The branches, which have got Low opinion on Quality, are Mettupalayam and Arts
College.
The branches, which are moderate in Quality, are Gandhipuram, Peoples park,
Lakshmi Complex and Raja street.
CORRESPONDENCE TABLE: 2
CORRESPONDENCE CHART: 1

233
Introduction:
The following correspondence analysis is tabulated to find out the closeness /
correspondence between the branches and the respondent’s opinion on varieties.
BRANCHES / OPINION ON VARIETIES
Branches / Opinion on Varieties
Score in dimensions 1 2
Raja Street -.617 -.467 Gandhipuram Bus-stand -.360 .331 Arts College 1.039 -.101 Saibaba Colony -.622 -.501 Lakshmi Complex -.640 -.628 TownHall -.108 .215 Cross Cut Road .365 .643 Mettupalayam .662 -2.097 Peoples park -.531 .132 RamaKrishna Hospital 2.396 -.528 Low 1.817 -.259 Medium -.190 .210 High -.676 -1.172

234
Dimension 13210-1
Dim
ensi
on 2
1
0
-1
-2
High
Medium
Low
Ramakrishna Hospital
People's Park
Mettupalayam
Cross-Cut Road
Town Hall
Lakshsmi Complex
Saibaba Colony
Arts College
Gandhipuram BS
Raja Street
Opinion about the Varieties Available
Branch
The following are the outcomes of the respondent’s opinion in terms of variety:
The branches, which have got high opinion on Variety, are Raja street, Saibaba
Colony, Lakshmi Complex.
The branches, which have got Low opinion on Variety, are Arts College,
Ramakrishna Hospital.
The branches, which are moderate in Variety, are Cross Cut Road, Gandhipuram,
Town Hall and Peoples Park.
CORRESPONDENCE TABLE: 2

235
CORRESPONDENCE TABLE: 3
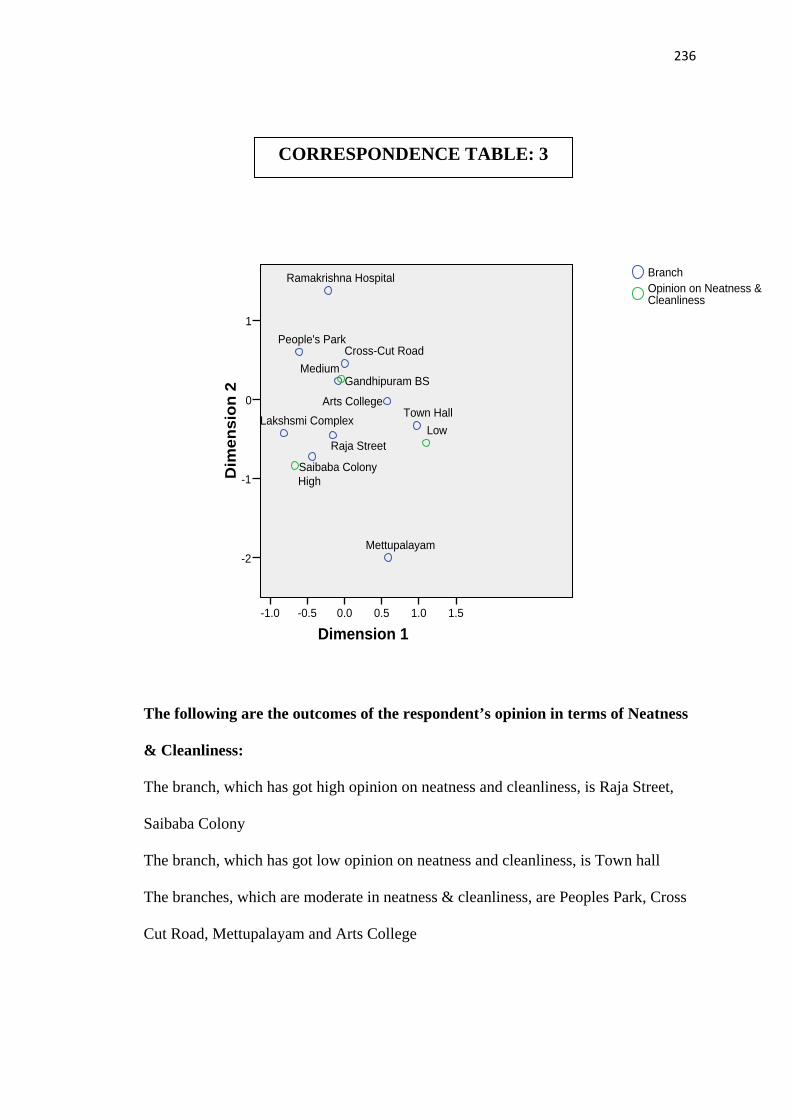
Introduction:
The following correspondence analysis is tabulated to find out the closeness /
correspondence between the branches and the respondent’s opinion on Neatness &
Cleanliness
BRANCHES / OPINION ON NEATNESS & CLEANLINESS
Branches / Opinion on Neatness & Cleanliness
Score in dimensions 1 2
Raja Street -.159 -.452 Gandhipuram Bus-stand -.084 .232 Arts College .577 -.023 Saibaba Colony -.437 -.721 Lakshmi Complex -.823 -.427 TownHall .968 -.328 Cross Cut Road -.001 .455 Mettupalayam .586 -2.001 Peoples park -.609 .599 RamaKrishna Hospital -.221 1.376 Low 1.100 -.550 Medium -.048 .258 High -.675 -.835
236
Dimension 11.51.00.50.0-0.5-1.0
Dim
ensi
on 2
1
0
-1
-2
High
Medium
Low
Ramakrishna Hospital
People's Park
Mettupalayam
Cross-Cut Road
Town HallLakshsmi Complex
Saibaba Colony
Arts College
Gandhipuram BS
Raja Street
Opinion on Neatness & Cleanliness
Branch
The following are the outcomes of the respondent’s opinion in terms of Neatness
& Cleanliness:
The branch, which has got high opinion on neatness and cleanliness, is Raja Street,
Saibaba Colony
The branch, which has got low opinion on neatness and cleanliness, is Town hall
The branches, which are moderate in neatness & cleanliness, are Peoples Park, Cross
Cut Road, Mettupalayam and Arts College
CORRESPONDENCE TABLE: 3

237
CORRESPONDENCE TABLE: 4
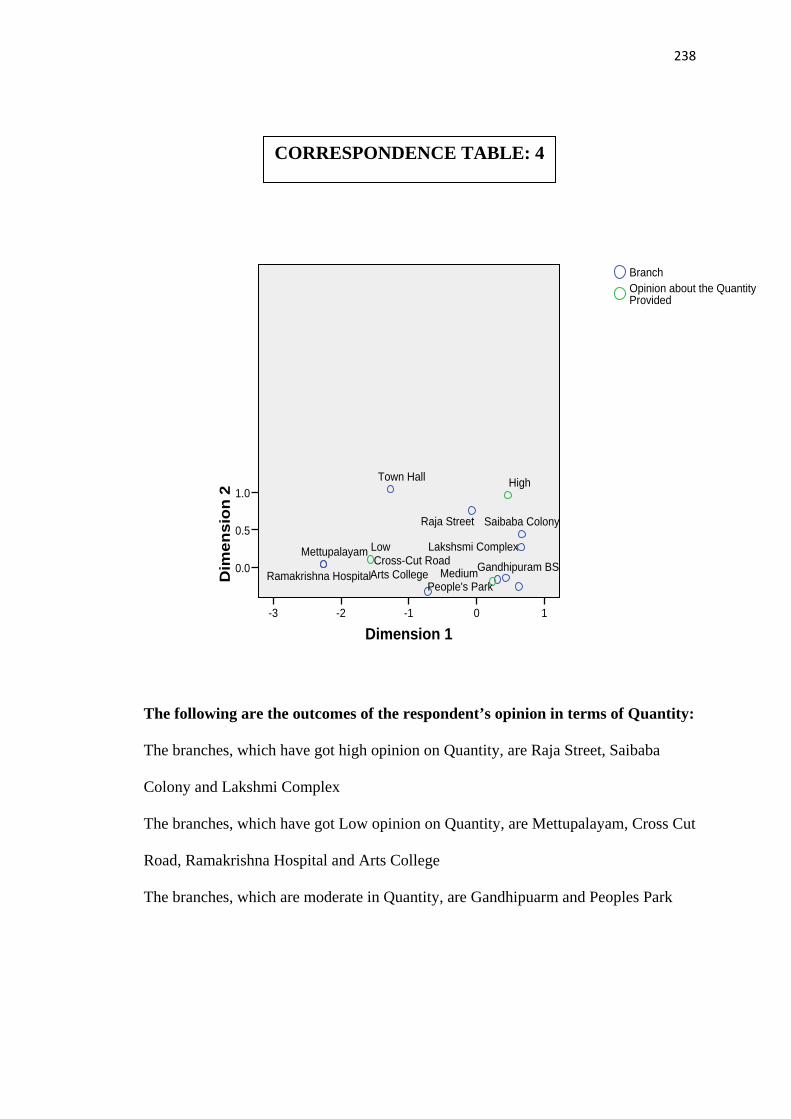
Introduction:
The following correspondence analysis is tabulated to find out the closeness / correspondence between the branches and the respondent’s opinion on Quantity.
BRANCHES / OPINION ON QUANTITY
Branches / Opinion on Quantity
Score in dimensions 1 2
Raja Street -.070 .753 Gandhipuram Bus-stand -.306 -.164 Arts College -.723 -.322 Saibaba Colony .666 .441 Lakshmi Complex .655 .266 TownHall -1.271 1.040 Cross Cut Road .430 -.142 Mettupalayam -2.260 .039 Peoples park .620 -.258 RamaKrishna Hospital -2.260 .039 Low -1.570 .104 Medium .236 -.191 High .459 .959
238
Dimension 110-1-2-3
Dim
ensi
on 2 1.0
0.5
0.0
High
Medium
Low
Ramakrishna HospitalPeople's Park
MettupalayamCross-Cut Road
Town Hall
Lakshsmi Complex
Saibaba Colony
Arts College Gandhipuram BS
Raja Street
Opinion about the Quantity Provided
Branch
The following are the outcomes of the respondent’s opinion in terms of Quantity:
The branches, which have got high opinion on Quantity, are Raja Street, Saibaba
Colony and Lakshmi Complex
The branches, which have got Low opinion on Quantity, are Mettupalayam, Cross Cut
Road, Ramakrishna Hospital and Arts College
The branches, which are moderate in Quantity, are Gandhipuarm and Peoples Park
CORRESPONDENCE TABLE: 4

239
CORRESPONDENCE TABLE: 5
Introduction:
The following correspondence analysis is tabulated to find out the closeness /
correspondence between the branches and the respondent’s opinion on Taste
BRANCHES / OPINION ON TASTE
Branches / Opinion on Taste
Score in dimensions 1 2
Raja Street -.279 .190 Gandhipuram Bus-stand .375 .018 Arts College -.785 -.232 Saibaba Colony .581 .322 Lakshmi Complex .582 .178 TownHall -.769 .344 Cross Cut Road .362 -.481 Mettupalayam -1.097 3.546 Peoples park .585 -.253 RamaKrishna Hospital -2.712 -.425 Low -1.714 -.015 Medium .233 -.210 High .211 1.007

240
Dimension 110-1-2-3
Dim
ensi
on 2
4
3
2
1
0
-1
High
Medium
Low
Ramakrishna HospitalPeople's Park
Mettupalayam
Cross-Cut Road
Town Hall Lakshsmi ComplexSaibaba Colony
Arts College
Gandhipuram BSRaja Street
Opinion about the TasteBranch
The following are the outcomes of the respondent’s opinion in terms of Taste:
The branches, which have got high opinion on Taste, are Lakshmi Complex and
Saibaba Colony
The branches, which have got Low opinion on Taste, are Townhall, Raja Street
andGandhipuram
The branches, which are moderate in Taste, are People Park and Cross Cut Road
CORRESPONDENCE TABLE: 5

241
CORRESPONDENCE TABLE: 6
Introduction:
The following correspondence analysis is tabulated to find out the closeness /
correspondence between the branches and the respondent’s opinion on Price
BRANCHES / OPINION ON PRICE
Branches / Opinion on Price
Score in dimensions 1 2
Raja Street -.485 .175 Gandhipuram Bus-stand -.126 -.345 Arts College .747 -.044 Saibaba Colony -.925 -.311 Lakshmi Complex -.847 .223 TownHall -.035 .496 Cross Cut Road .057 1.120 Mettupalayam 1.930 -.147 Peoples park -.007 .158 RamaKrishna Hospital 1.930 -.147 Low 1.137 -.167 Medium -.228 .261 High -.584 -.863

242
Dimension 12.01.51.00.50.0-0.5-1.0
Dim
ensi
on 2
1.5
1.0
0.5
0.0
-0.5
-1.0
High
Medium
Low
Ramakrishna Hospital
People's Park Mettupalayam
Cross-Cut Road
Town Hall
Lakshsmi Complex
Saibaba ColonyArts College
Gandhipuram BS
Raja Street
Opinion about the PriceBranch
The following are the outcomes of the respondent’s opinion in terms of Price:
The branches, which have got high opinion on Price, are Saibaba Colony and
Gandhipuram
The branches, which have got Low opinion on Price, are Peoples Park, Arts College,
Raja Street, Lakshmi Complex and Townhall
The branches, which are moderate in Price, are Mettupalayam and Ramakrishna
Hospital
CORRESPONDENCE TABLE: 7
CORRESPONDENCE TABLE: 6

243
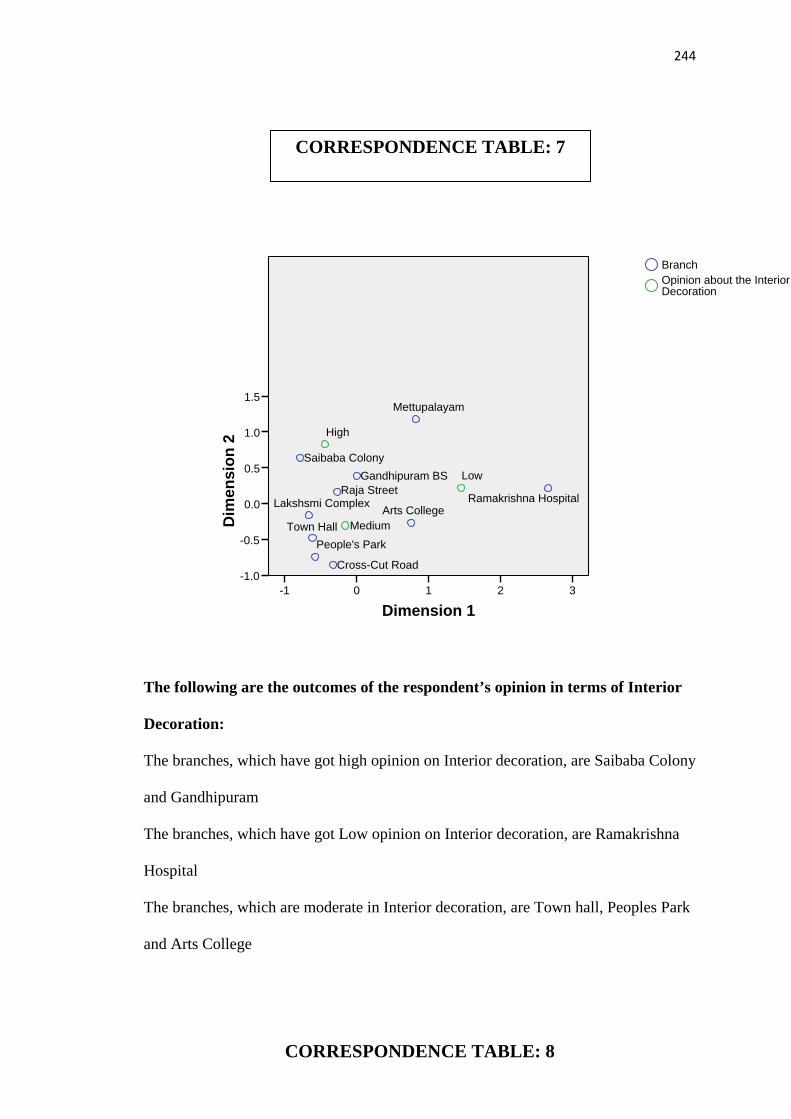
Introduction:
The following correspondence analysis is tabulated to find out the closeness /
correspondence between the branches and the respondent’s opinion on Interior
Decoration
BRANCHES / OPINION ON INTERIOR DECORATION
Branches / Opinion on
Interior Decoration
Score in dimensions 1 2
Raja Street -.273 .168 Gandhipuram Bus-stand .000 .389 Arts College .758 -.265 Saibaba Colony -.787 .640 Lakshmi Complex -.664 -.164 Town Hall -.616 -.478 Cross Cut Road -.328 -.855 Mettupalayam .824 1.179 Peoples park -.576 -.740 RamaKrishna Hospital 2.664 .217 Low 1.451 .221 Medium -.160 -.306 High -.443 .826
244
Dimension 13210-1
Dim
ensi
on 2
1.5
1.0
0.5
0.0
-0.5
-1.0
High
Medium
Low
Ramakrishna Hospital
People's Park
Mettupalayam
Cross-Cut Road
Town Hall
Lakshsmi Complex
Saibaba Colony
Arts College
Gandhipuram BSRaja Street
Opinion about the Interior Decoration
Branch
The following are the outcomes of the respondent’s opinion in terms of Interior
Decoration:
The branches, which have got high opinion on Interior decoration, are Saibaba Colony
and Gandhipuram
The branches, which have got Low opinion on Interior decoration, are Ramakrishna
Hospital
The branches, which are moderate in Interior decoration, are Town hall, Peoples Park
and Arts College
CORRESPONDENCE TABLE: 8
CORRESPONDENCE TABLE: 7
245
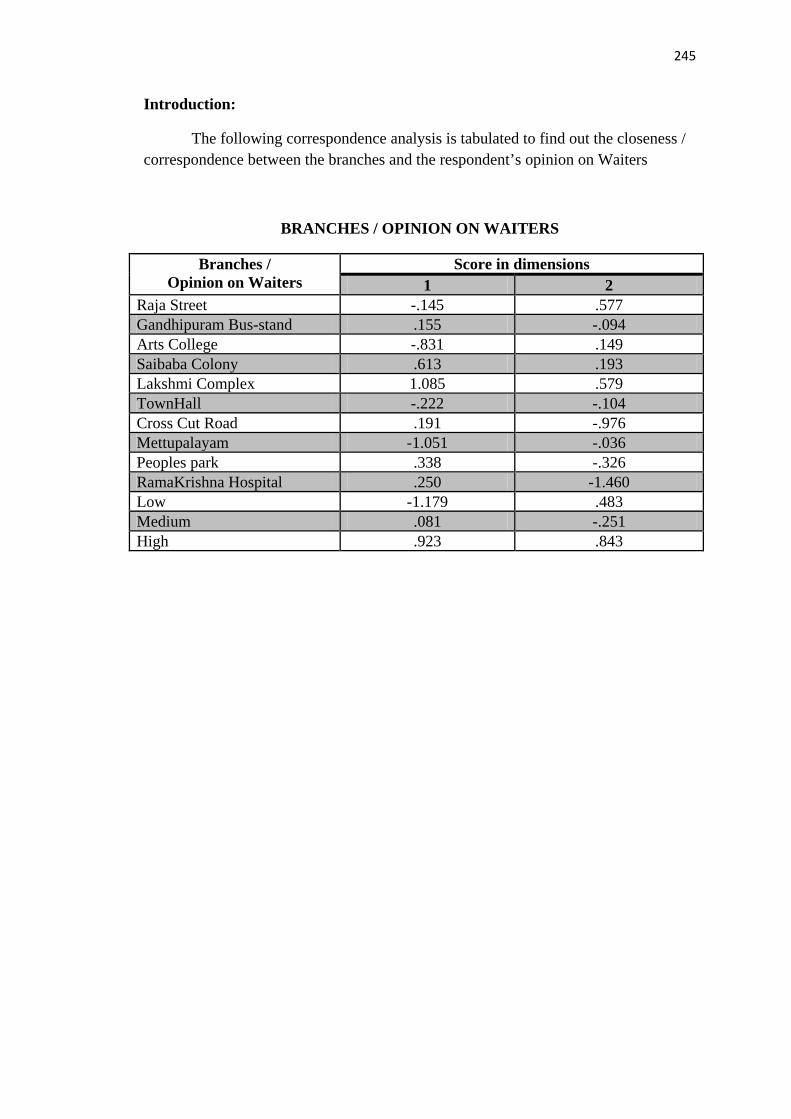
Introduction:
The following correspondence analysis is tabulated to find out the closeness / correspondence between the branches and the respondent’s opinion on Waiters
BRANCHES / OPINION ON WAITERS
Branches / Opinion on Waiters
Score in dimensions 1 2
Raja Street -.145 .577 Gandhipuram Bus-stand .155 -.094 Arts College -.831 .149 Saibaba Colony .613 .193 Lakshmi Complex 1.085 .579 TownHall -.222 -.104 Cross Cut Road .191 -.976 Mettupalayam -1.051 -.036 Peoples park .338 -.326 RamaKrishna Hospital .250 -1.460 Low -1.179 .483 Medium .081 -.251 High .923 .843
246
Dimension 11.51.00.50.0-0.5-1.0-1.5
Dim
ensi
on 2
1.0
0.5
0.0
-0.5
-1.0
-1.5
High
Medium
Low
Ramakrishna Hospital
People's Park
Mettupalayam
Cross-Cut Road
Town Hall
Lakshsmi Complex
Saibaba ColonyArts College
Gandhipuram BS
Raja Street
Opinion about the WaitersBranch
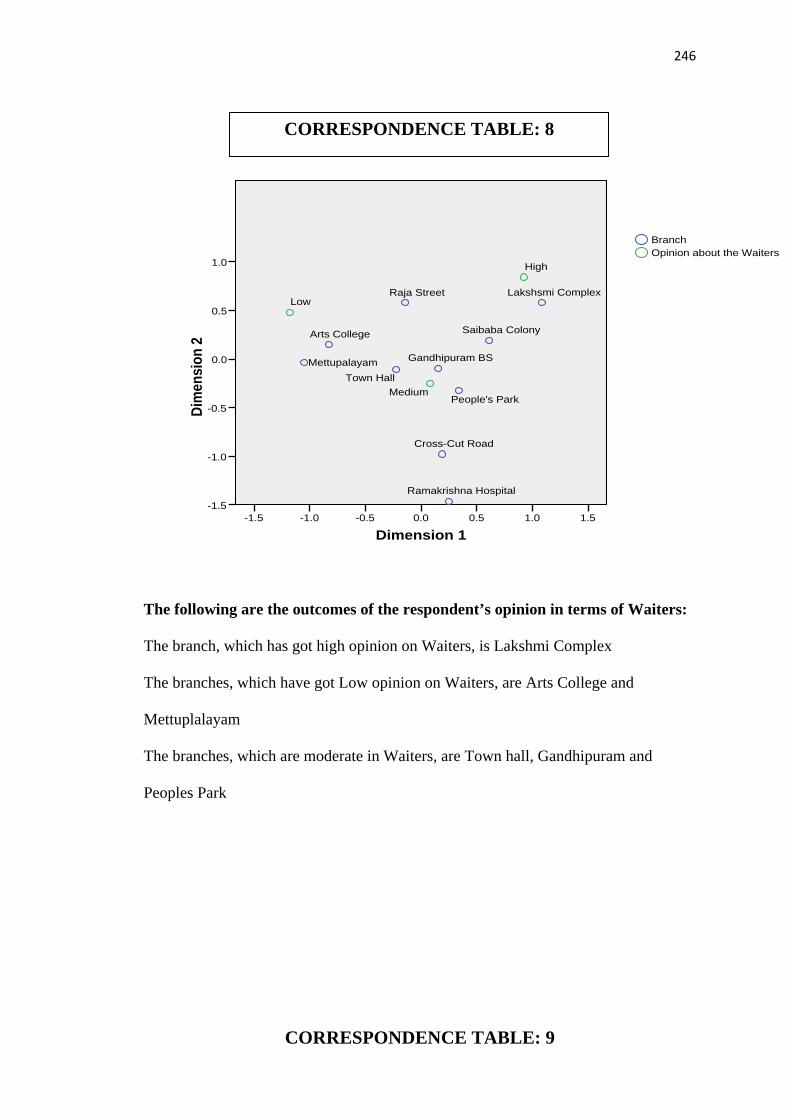
The following are the outcomes of the respondent’s opinion in terms of Waiters:
The branch, which has got high opinion on Waiters, is Lakshmi Complex
The branches, which have got Low opinion on Waiters, are Arts College and
Mettuplalayam
The branches, which are moderate in Waiters, are Town hall, Gandhipuram and
Peoples Park
CORRESPONDENCE TABLE: 9
CORRESPONDENCE TABLE: 8
247
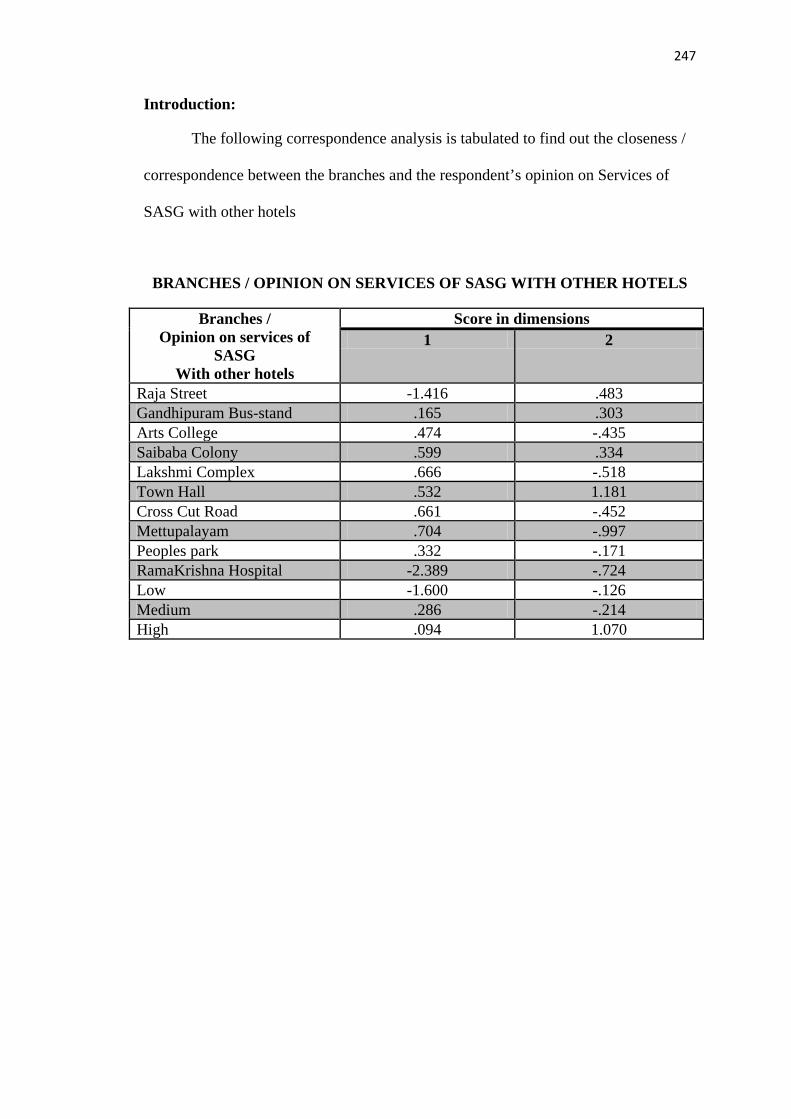
Introduction:
The following correspondence analysis is tabulated to find out the closeness /
correspondence between the branches and the respondent’s opinion on Services of
SASG with other hotels
BRANCHES / OPINION ON SERVICES OF SASG WITH OTHER HOTELS
Branches / Opinion on services of
SASG With other hotels
Score in dimensions 1 2
Raja Street -1.416 .483 Gandhipuram Bus-stand .165 .303 Arts College .474 -.435 Saibaba Colony .599 .334 Lakshmi Complex .666 -.518 Town Hall .532 1.181 Cross Cut Road .661 -.452 Mettupalayam .704 -.997 Peoples park .332 -.171 RamaKrishna Hospital -2.389 -.724 Low -1.600 -.126 Medium .286 -.214 High .094 1.070

248
Dimension 110-1-2-3
Dim
ensi
on 2
1.5
1.0
0.5
0.0
-0.5
-1.0
High Satisfacation
Medium SatisfacationLow Satisfacation
Ramakrishna Hospital
People's Park
MettupalayamCross-Cut Road
Town Hall
Lakshsmi Complex
Saibaba Colony
Arts College
Gandhipuram BSRaja Street
Opinion of SASG compared to other hotels
Branch
The following are the outcomes of the respondent’s opinion in terms of services
of SASG compared with other hotels:
The branches, which have got high opinion on Services of SASG, are Town hall and
Raja Street
The branches, which have got Low opinion on Services of SASG, are Arts College
and Ramakrishna Hospital
The branches, which are moderate in Services of SASG, are Peoples Park, Lakshmi
Complex and Saibaba Colony
CORRESPONDENCE TABLE: 9
226
5.5 CROSS TABLE ANALYSIS: 1
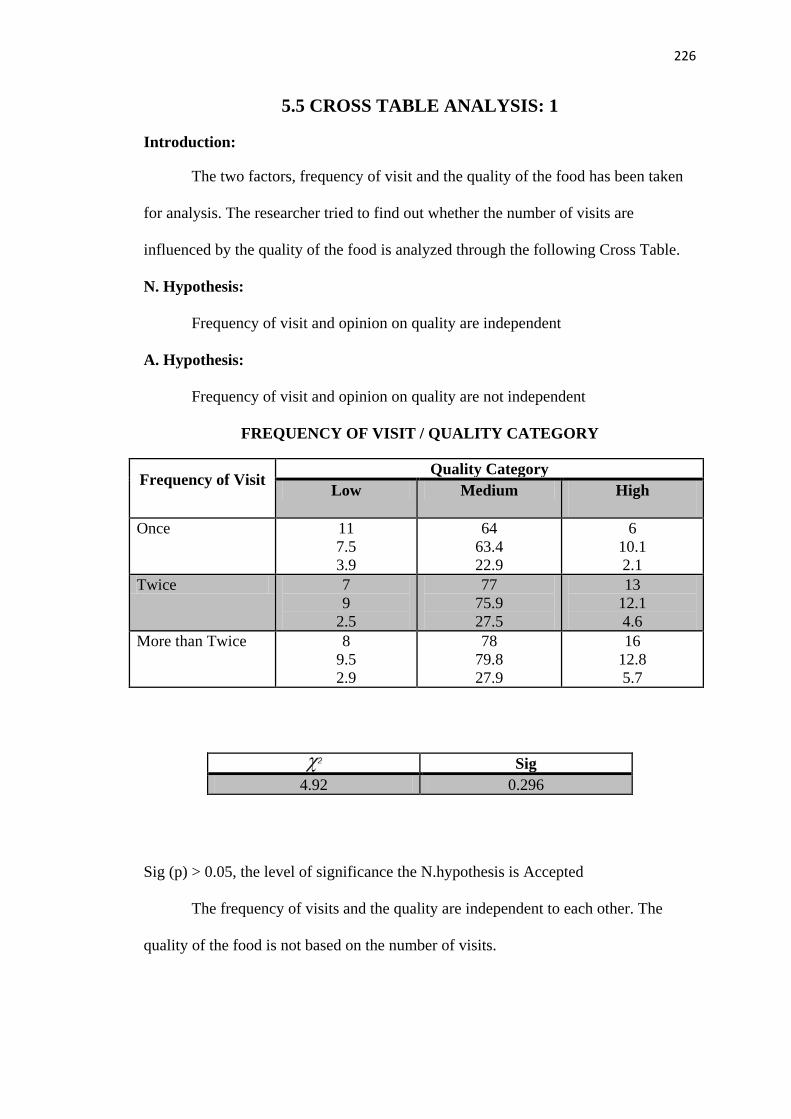
Introduction:
The two factors, frequency of visit and the quality of the food has been taken
for analysis. The researcher tried to find out whether the number of visits are
influenced by the quality of the food is analyzed through the following Cross Table.
N. Hypothesis:
Frequency of visit and opinion on quality are independent
A. Hypothesis:
Frequency of visit and opinion on quality are not independent
FREQUENCY OF VISIT / QUALITY CATEGORY
Frequency of Visit
Quality Category Low Medium High
Once 11
7.5 3.9
64 63.4 22.9
6 10.1 2.1
Twice 7 9
2.5
77 75.9 27.5
13 12.1 4.6
More than Twice 8 9.5 2.9
78 79.8 27.9
16 12.8 5.7
Sig (p) > 0.05, the level of significance the N.hypothesis is Accepted
The frequency of visits and the quality are independent to each other. The
quality of the food is not based on the number of visits.
Sig 4.92 0.296

227
CROSS TABLE: 2
Introduction:
The two factors, Favourite Branches and the parking facility have been taken
for analysis. The researcher tried to find out the level of satisfaction of the
respondents towards the parking facility of their favourite branches through the
following Cross Table.
FAVOURITE BRANCHES / PARKING FACILITY
Interpretation:
Favourite branches vs. their parking facility were taken for analysis. The
respondents are satisfied with the Gandipuram branch with respect to the parking
facility and at the same time the respondents were dissatisfied with parking facility of
Arts College.
Favourite Branches
Parking Facility Satisfied Moderate Dissatisfied
Raja Street 13 3 7 Gandhipuram Bus-stand 50 36 9 Arts College 33 13 19 Saibaba Colony 6 7 5 Lakshmi Complex 9 8 8 TownHall 8 0 3 Cross Cut Road 3 14 5 Mettupalayam 1 1 1 Peoples park 6 6 3 RamaKrishna Hospital 1 2 0

228
CROSS TABLE: 3
Introduction:
The two factors, Favourite Branches and the drive inn facility have been taken
for analysis. The researcher tried to find out the level of satisfaction of the
respondents towards the drive inn facility of their favourite branches through the
following Cross Table.
FAVOURITE BRANCHES / DRIVE INN FACILITY
Interpretation:
Favourite branches versus their drive inn facility were taken for analysis. The
respondents were satisfied with the Arts College with respect to the parking facility
and at the same time the respondents were dissatisfied with drive inn facility of
Gandipuram branch.
Favourite Branches
Drive – Inn Facility Satisfied Moderate Dissatisfied
Raja Street 7 2 14 Gandhipuram Bus-stand 14 28 53 Arts College 20 18 27 Saibaba Colony 9 2 7 Lakshmi Complex 4 7 14 TownHall 6 0 5 Cross Cut Road 0 15 7 Mettupalayam 2 0 1 Peoples park 3 7 5 RamaKrishna Hospital 2 1 0
229
CROSS TABLE: 4
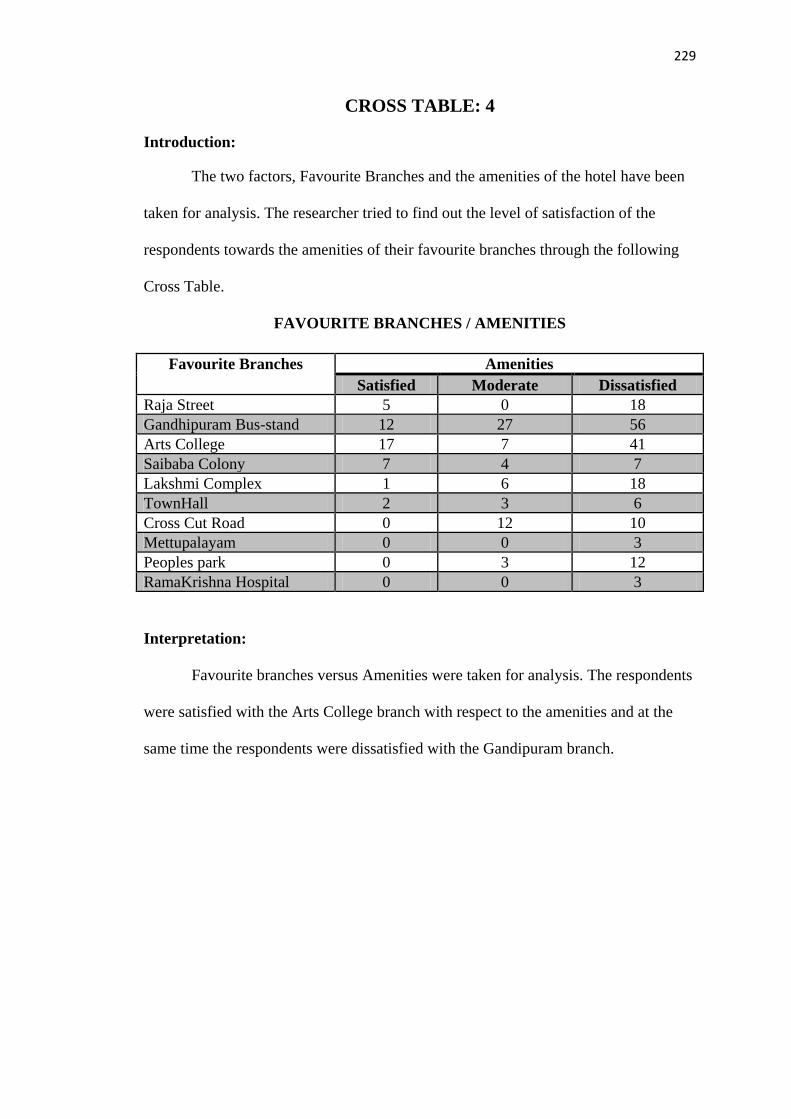
Introduction:
The two factors, Favourite Branches and the amenities of the hotel have been
taken for analysis. The researcher tried to find out the level of satisfaction of the
respondents towards the amenities of their favourite branches through the following
Cross Table.
FAVOURITE BRANCHES / AMENITIES
Interpretation:
Favourite branches versus Amenities were taken for analysis. The respondents
were satisfied with the Arts College branch with respect to the amenities and at the
same time the respondents were dissatisfied with the Gandipuram branch.
Favourite Branches
Amenities Satisfied Moderate Dissatisfied
Raja Street 5 0 18 Gandhipuram Bus-stand 12 27 56 Arts College 17 7 41 Saibaba Colony 7 4 7 Lakshmi Complex 1 6 18 TownHall 2 3 6 Cross Cut Road 0 12 10 Mettupalayam 0 0 3 Peoples park 0 3 12 RamaKrishna Hospital 0 0 3

230
CROSS TABLE: 5
Introduction:
The two factors, Favourite Branches and the bill payment have been taken for
analysis. The researcher tried to find out the respondents mode of bill payment in their
favourite t branches through the following Cross Table.
FAVOURITE BRANCHES / BILL PAYMENT
Interpretation:
The favourite branches / bill payment made were taken for analysis. The
respondents who preferred Gandhipuram branch had made their bill payment at the
table and the respondents of the same branch had paid at the cash counter too when
compared to other branches.
Favourite Branches Bill Payment At the Counter At the Table
Raja Street 20 3 Gandhipuram Bus-stand 85 10 Arts College 62 3 Saibaba Colony 13 5 Lakshmi Complex 22 3 TownHall 9 2 Cross Cut Road 22 0 Mettupalayam 3 0 Peoples park 14 1 RamaKrishna Hospital 3 0

205
5.2 Z - TEST ANALYSIS -1
Introduction:
The ten branches of SASG were divided into two zones viz. North and South.
Where the North Zone includes Gandhipuram, Saibaba Colony, Lakshmi Complex,
Cross Cut Road, Mettupalyam and Ramakrishna Hospital Branches and the south
Zone Includes Raja Street, Arts College, Town hall and Peoples Park Branches.
The respondents who had given their opinion on the various attributes were
tabulated; their Mean Value and Zo as well as significance level were measured.
Through the Z test the researcher was trying to find out the opinion given by
the North Zone as well as the south Zone towards the various attributes like quality,
Variety, Neatness and Cleanliness, Quantity, Taste, Price, Interior Decoration and
Waiter service.
N. Hypothesis :
Customers belonging to North and South Zone of Coimbatore gave on an
average the same opinion on the following attributes.
A.Hypothesis:
Customers belonging to North and South Zone of Coimbatore did not give on
an average the same opinion on the following attributes.

206
Z - TEST TABLE :1
Since Sig (p) <0.05, the level of significance, the N. hypothesis is rejected,
except for Neatness and Cleanliness.
The respondents belonging to North Zone gave on an average higher opinion
on Quality, Variety, Quantity, Taste, Price, Interior Decoration and Waiter service
than the south zone.
North Zone Branches had given more satisfaction to their customers than
South Zone branches. North Zone branches retain their customers more than South
Zone branches.
Z - TEST ANALYSIS -2
Attribute Personal Info Mean Zo Sig Remarks
Quality South Zone North Zone
40.32 42.67 2.107 0.036 Rejected
Variety South Zone North Zone
35.24 38.91 3.592 0.000 Rejected
Neatnessand Cleanliness
South Zone North Zone
36.76 39.02 1.897 0.059 Accepted
Quantity South Zone North Zone
36.67 41.90 3.748 0.000 Rejected
Taste South Zone North Zone
35.18 40.19 4.228 0.000 Rejected
Price South Zone North Zone
31.96 36.01 2.850 0.005 Rejected
Interior Decoration
South Zone North Zone
34.27 37.37 2.482 0.014 Rejected
Waiter service South Zone North Zone
34.40 37.64 2.581 0.017 Rejected
207
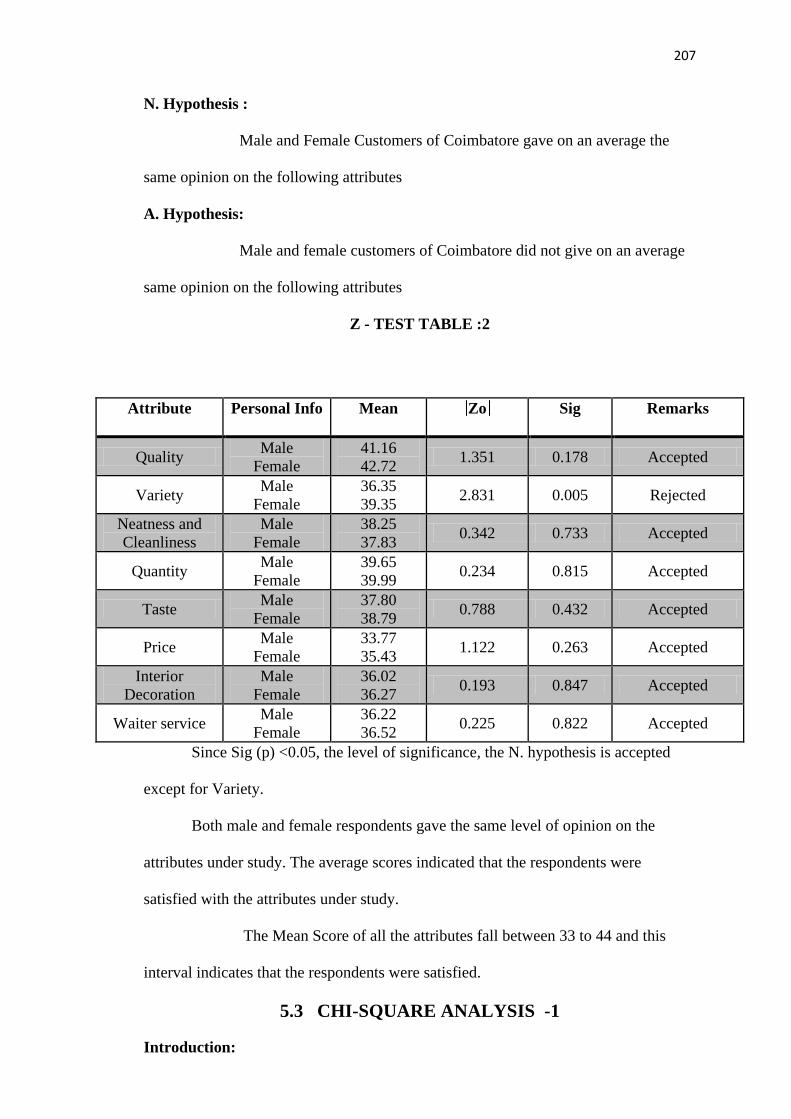
N. Hypothesis :
Male and Female Customers of Coimbatore gave on an average the
same opinion on the following attributes
A. Hypothesis:
Male and female customers of Coimbatore did not give on an average
same opinion on the following attributes
Z - TEST TABLE :2
Since Sig (p) <0.05, the level of significance, the N. hypothesis is accepted
except for Variety.
Both male and female respondents gave the same level of opinion on the
attributes under study. The average scores indicated that the respondents were
satisfied with the attributes under study.
The Mean Score of all the attributes fall between 33 to 44 and this
interval indicates that the respondents were satisfied.
5.3 CHI-SQUARE ANALYSIS -1
Introduction:
Attribute Personal Info Mean Zo Sig Remarks
Quality Male Female
41.16 42.72 1.351 0.178 Accepted
Variety Male Female
36.35 39.35 2.831 0.005 Rejected
Neatness and Cleanliness
Male Female
38.25 37.83 0.342 0.733 Accepted
Quantity Male Female
39.65 39.99 0.234 0.815 Accepted
Taste Male Female
37.80 38.79 0.788 0.432 Accepted
Price Male Female
33.77 35.43 1.122 0.263 Accepted
Interior Decoration
Male Female
36.02 36.27 0.193 0.847 Accepted
Waiter service Male Female
36.22 36.52 0.225 0.822 Accepted

208
Customer’s visits may not be similar; the customers may visit once in a week,
twice in a week, once in two weeks, once in a month or sometimes rarely. The
researcher had tried to find out, the majority’s opinion towards the number of visits
the hotels in general (not specifically SASG even it may be the other hotels).
N. Hypothesis:
The number of visits to the hotels was taken equally irrespective of time
duration.
A. Hypothesis:
The number of visits to the hotels was not taken equally irrespective of time
duration.
CHI - SQUARE TABLE :1
Reasons Observed Expected
Once in a week 57 56 Twice in a week 76 56 Once in two weeks 40 56 Once in a Month 57 56 Rarely 50 56
Since Sig (p) <0.05, the level of significance, the N.hypothesis is rejected.
From the table it is understood that majority of the respondents used to visit
the hotels preferably twice in a week (not specifically SASG even it may be the other
hotels).
This is due to the paucity of the time to have food at home, dual income and the need
of the day.
CHI-SQUARE ANALYSIS -2
Introduction:
Sig 12.393 0.015
209
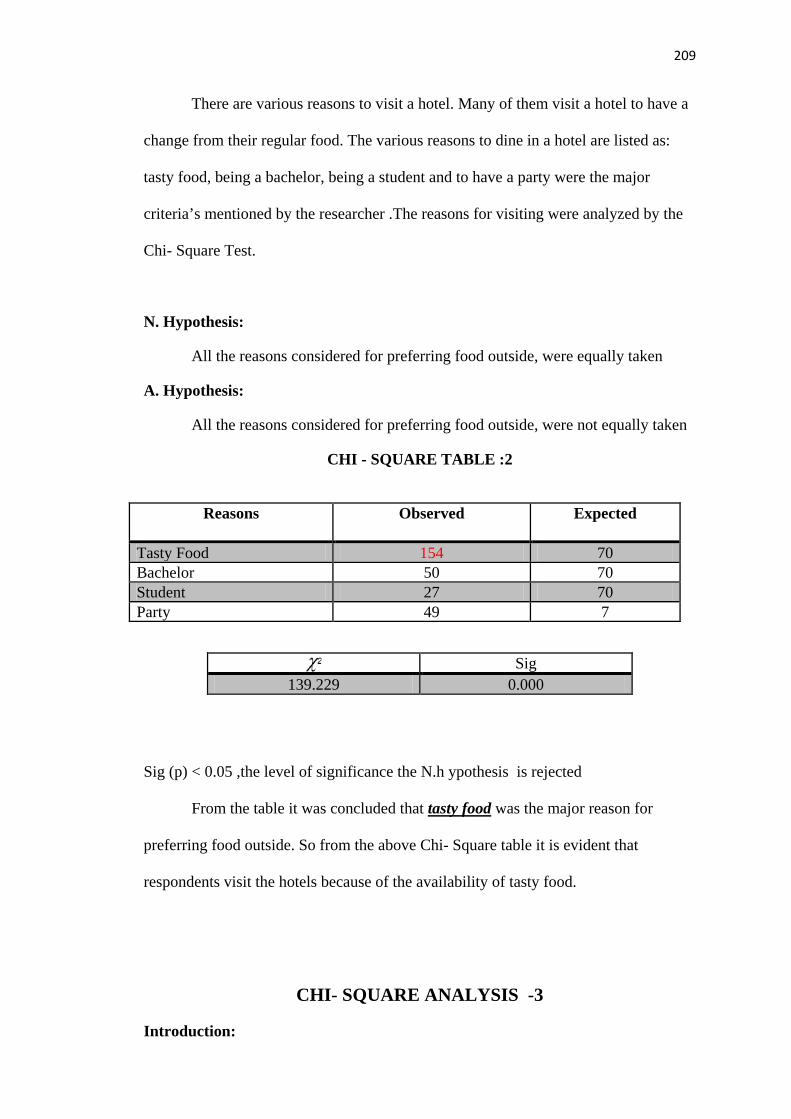
There are various reasons to visit a hotel. Many of them visit a hotel to have a
change from their regular food. The various reasons to dine in a hotel are listed as:
tasty food, being a bachelor, being a student and to have a party were the major
criteria’s mentioned by the researcher .The reasons for visiting were analyzed by the
Chi- Square Test.
N. Hypothesis:
All the reasons considered for preferring food outside, were equally taken
A. Hypothesis:
All the reasons considered for preferring food outside, were not equally taken
CHI - SQUARE TABLE :2
Reasons Observed Expected
Tasty Food 154 70 Bachelor 50 70 Student 27 70 Party 49 7
Sig (p) < 0.05 ,the level of significance the N.h ypothesis is rejected
From the table it was concluded that tasty food was the major reason for
preferring food outside. So from the above Chi- Square table it is evident that
respondents visit the hotels because of the availability of tasty food.
CHI- SQUARE ANALYSIS -3
Introduction:
Sig 139.229 0.000

210
There are various ways to get awareness about a product or service. Here the
analysis was made to find out the mode, which gave more awareness towards SASG
from the following reasons, which are: Radio, Television, Newspaper, Publicity,
Word of Mouth, friends and Relatives.
N. Hypothesis:
The various media of publicity were taken equally
A. Hypothesis:
The various media of publicity were not taken equally
CHI - SQUARE TABLE :3
Reasons Observed Expected
Radio 20 40 Television 26 40 News Paper 17 40 Publicity 96 40 Word of Mouth 60 40 Friends 42 40 Relatives 19 40
Sig (p)< 0.05, the level of significance the N. hypothesis is rejected
From the table it was concluded that publicity had played a major role in
attracting the customers. Publicity had created good awareness among the public
about the hotel.
CHI- SQUARE ANALYSIS -4
Introduction:
Sig 127.650 0.000

211
The customers are influenced by various persons / groups like spouse, family,
friends and colleagues etc. The researcher had tried to find out which particular group
has influenced mostly, to visit SASG.
N. Hypothesis:
Spouse, Family, Friends and colleagues all were equally considered as to
influence the respondents for visiting the hotel.
A. Hypothesis:
Spouse, Family, Friends and colleagues all were not equally considered to influence the respondents for visiting the hotel.
CHI - SQUARE TABLE :4
Reasons Observed Expected
Spouse 29 70 Family 106 70 Friends 115 70 Colleagues 30 70
Sig (p)< 0.05 , the level of significance the N. hypothesis is rejected
From the table it was concluded that friends were the most influencing group
for visiting the hotel.
CHI- SQUARE ANALYSIS -5
Introduction:
Sig 94.314 0.000

212
The customers used to visit the hotel with various persons / groups like spouse, family, friends and colleagues etc. Here the analysis was made to find out which person / group had accompanied the respondents mostly during their visit to SASG.
N. Hypothesis:
Spouse, Family, Friends and colleagues all were equally considered to accompany the respondents during their visits to the hotel.
A. Hypothesis:
Spouse, Family, Friends and colleagues all were not equally considered to accompany the respondents during their visits to the hotel.
CHI - SQUARE TABLE :5
Reasons Observed Expected
Spouse 35 70 Family 154 70 Friends 83 70 Colleagues 8 70
Sig (p) < 0.05, the level of significance the N. hypothesis is rejected
From the table it was concluded that majority of the respondents had visited
the hotel with their family members. Even though friends had influenced them
mostly, but their regular visit to the hotel was with their family members.
CHI- SQUARE ANALYSIS -6
Introduction:
Sig 175.629 0.000

213
Customers visit to SASG in a month may not be similar. Few of them visit
only once in a month, twice in a month and the rest may visit more than twice in a
month. The following Chi – Square analysis was made to get the exact result towards
the number of visits made by the respondents in a month
N. Hypothesis:
The number of visit to the hotel in a month was taken equally.
A. Hypothesis:
The number of visit to the hotel in a month was not taken equally.
CHI - SQUARE TABLE :6
Reasons Observed Expected
Once 81 93.3 Twice 97 93.3 More than Twice 102 93.3
Sig (p) < 0.05, the level of significance the N. hypothesis is accepted.
From the table it was concluded that the number of visits has equal chances in
visiting the hotels. There is no significant difference in the reasons, respondents had
equal chances in visiting the hotel, either it may be once, twice or more than twice in
a month.
CHI- SQUARE ANALYSIS -7
Introduction:
Sig 2.579 0.275

214
Customer’s time of visit to SASG may not be similar. The customers on their
choice may visit the hotel either in the morning, afternoon, evening, night or even
without fixing any time .It depends purely on the basis of their convenience. Here the
analysis is made to find out which is the most preferred time to visit the hotel.
N. Hypothesis:
The time of visit to the hotel were taken equally.
A. Hypothesis:
The time of visit to the hotel were not taken equally.
CHI - SQUARE TABLE :7
Reasons Observed Expected
Morning 45 56 Afternoon 65 56 Evening 68 56 Night 33 56 No Fixed Time 69 56
Sig (p) < 0.05, the level of significance the N. hypothesis is rejected
From the table it was concluded that the respondents have not fixed any time
to visit the hotel, they used to visit the hotel as and when they like.
CHI- SQUARE ANALYSIS -8
Introduction:
Sig 18.643 0.001
215
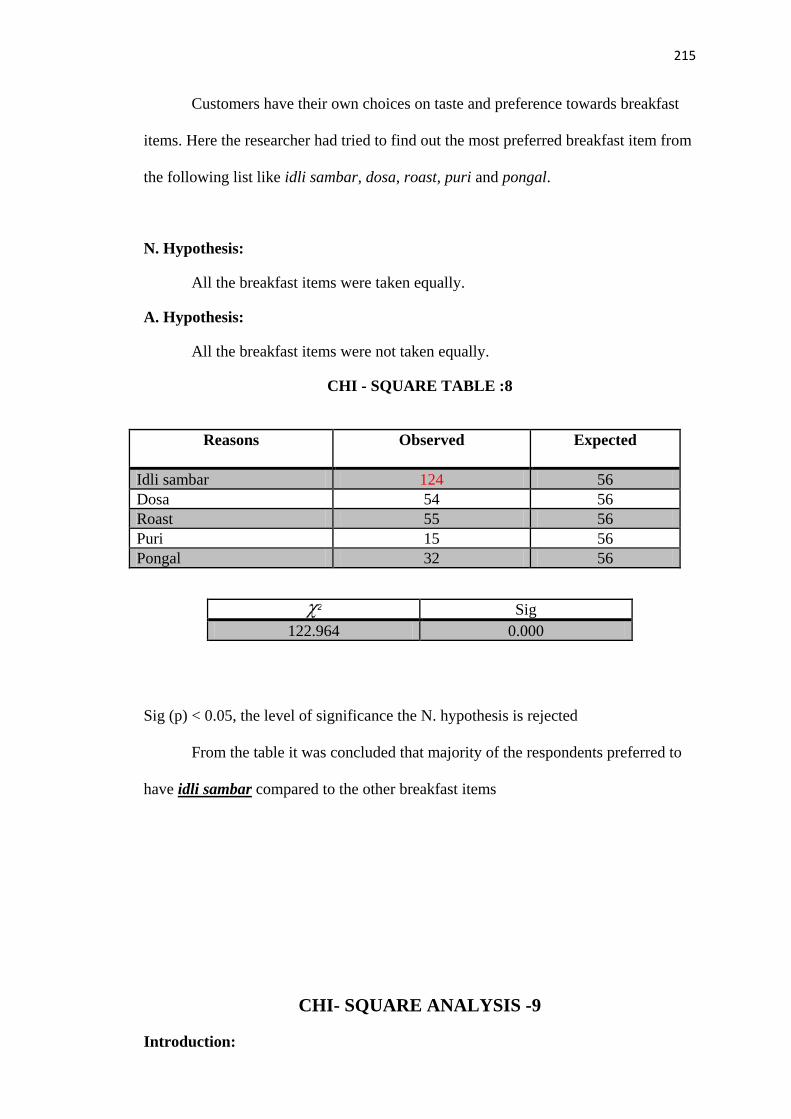
Customers have their own choices on taste and preference towards breakfast
items. Here the researcher had tried to find out the most preferred breakfast item from
the following list like idli sambar, dosa, roast, puri and pongal.
N. Hypothesis:
All the breakfast items were taken equally.
A. Hypothesis:
All the breakfast items were not taken equally.
CHI - SQUARE TABLE :8
Reasons Observed Expected
Idli sambar 124 56 Dosa 54 56 Roast 55 56 Puri 15 56 Pongal 32 56
Sig (p) < 0.05, the level of significance the N. hypothesis is rejected
From the table it was concluded that majority of the respondents preferred to
have idli sambar compared to the other breakfast items
CHI- SQUARE ANALYSIS -9
Introduction:
Sig 122.964 0.000

216
Customers have their own choices and favorite midday food items. The researcher tried to find out the most preferred midday item from the following list like meals, vegetable biriyani, curd rice, roti and parotta.
N. Hypothesis:
All the Mid Day Food items are preferred equally.
A. Hypothesis:
All the Mid Day Food items are not preferred equally.
CHI - SQUARE TABLE :9
Reasons Observed Expected
Meals 116 56 Vegetable Biriyani 77 56 Curd Rice 24 56 Roti 23 56 Parotta 40 56
Sig (p) < 0.05, the level of significance the N. hypothesis is rejected
From the table it was concluded that majority of the respondents preferred to
have Meals in the afternoon compared to the other mid day food items.
It is the general tendency of the South Indians to have meals in the afternoon.
CHI- SQUARE ANALYSIS -10
Introduction:
Sig 114.464 0.000
217
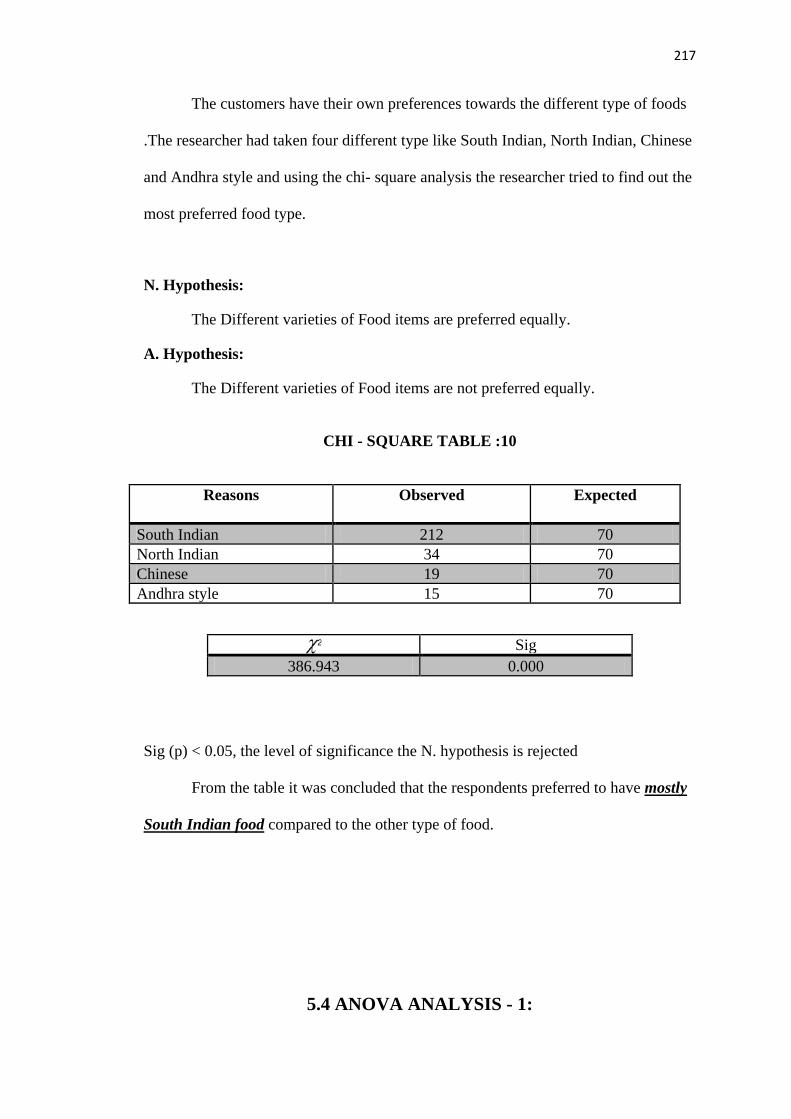
The customers have their own preferences towards the different type of foods
.The researcher had taken four different type like South Indian, North Indian, Chinese
and Andhra style and using the chi- square analysis the researcher tried to find out the
most preferred food type.
N. Hypothesis:
The Different varieties of Food items are preferred equally.
A. Hypothesis:
The Different varieties of Food items are not preferred equally.
CHI - SQUARE TABLE :10
Reasons Observed Expected
South Indian 212 70 North Indian 34 70 Chinese 19 70 Andhra style 15 70
Sig (p) < 0.05, the level of significance the N. hypothesis is rejected
From the table it was concluded that the respondents preferred to have mostly
South Indian food compared to the other type of food.
5.4 ANOVA ANALYSIS - 1:
Sig 386.943 0.000
218
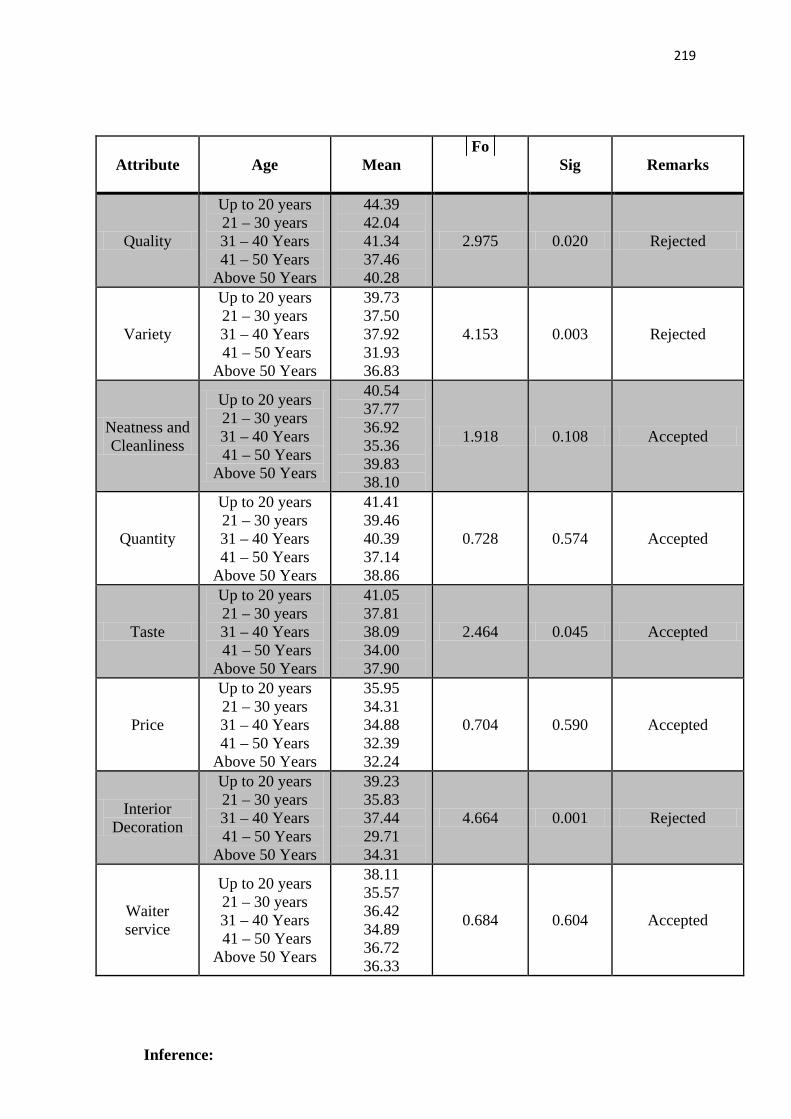
In the case of Age, Educational Qualification, Occupation and Annual Income
there are more than 2 group’s. Therefore by applying the ANOVA technique the
opinion given on the attributes understudy was analyzed
N. Hypothesis :
Respondents belonging to different age had given on an average same opinion
on the attributes Quality, Variety, Neatness and Cleanliness, Quantity, Taste, Price,
Interior Decoration and Waiter service under study
A. Hypothesis:
Respondents belonging to different age had not given on an average same
opinion on the attributes Quality, Variety, Neatness and Cleanliness, Quantity, Taste,
Price, Interior Decoration and Waiter service under study
ANOVA TABLE :1
219
Inference:
Attribute Age Mean Fo
Sig
Remarks
Quality
Up to 20 years 21 – 30 years 31 – 40 Years 41 – 50 Years
Above 50 Years
44.39 42.04 41.34 37.46 40.28
2.975 0.020 Rejected
Variety
Up to 20 years 21 – 30 years 31 – 40 Years 41 – 50 Years
Above 50 Years
39.73 37.50 37.92 31.93 36.83
4.153 0.003 Rejected
Neatness and Cleanliness
Up to 20 years 21 – 30 years 31 – 40 Years 41 – 50 Years
Above 50 Years
40.54 37.77 36.92 35.36 39.83 38.10
1.918 0.108 Accepted
Quantity
Up to 20 years 21 – 30 years 31 – 40 Years 41 – 50 Years
Above 50 Years
41.41 39.46 40.39 37.14 38.86
0.728 0.574 Accepted
Taste
Up to 20 years 21 – 30 years 31 – 40 Years 41 – 50 Years
Above 50 Years
41.05 37.81 38.09 34.00 37.90
2.464 0.045 Accepted
Price
Up to 20 years 21 – 30 years 31 – 40 Years 41 – 50 Years
Above 50 Years
35.95 34.31 34.88 32.39 32.24
0.704 0.590 Accepted
Interior Decoration
Up to 20 years 21 – 30 years 31 – 40 Years 41 – 50 Years
Above 50 Years
39.23 35.83 37.44 29.71 34.31
4.664 0.001 Rejected
Waiter service
Up to 20 years 21 – 30 years 31 – 40 Years 41 – 50 Years
Above 50 Years
38.11 35.57 36.42 34.89 36.72 36.33
0.684 0.604 Accepted

220
The different age group of respondents of SASG had given on an average same opinion on the following attributes Neatness and Cleanliness, Quantity, Price and Waiter service.
But the same group of respondents of SASG had not given on an average same opinion on the attributes like quality, Variety, taste and Interior Decoration.
This proves that the different age groups have their own liking and disliking towards SASG in terms of Quality, Variety, Taste and Interior Decoration.
Post Hoc Test
To find out which group had given different opinion than the other group
Post-Hoc test is applied.
POST – HOC TEST TABLE :1 From the above analysis the following inferences are made:
1. Respondents < 20 years of age have given higher opinion on Quality than 41
– 50 years age group
2. Respondents < 20 years of age have given higher opinion on Variety than 41 – 50 years age group
3. Respondents < 20 years of age have given higher opinion on Taste than 41 – 50 years age group
4. Respondents < 20 years of age have given higher opinion on Interior Decoration than 41 – 50 years age group
The difference between the other groups are not that much significant to discuss
ANOVA ANALYSIS - 2
Attributes Age
Mean Difference
Sig From To
Quality Up to 20 Years
41 – 50 Years 6.929
0.010
Variety Up to 20 Years
41 – 50 Years 7.804
0.001
Taste Up to 20 Years
41 – 50 Years 7.054
0.020
Interior Decoration
Up to 20 Years
41 – 50 Years 9.518 0.001
221
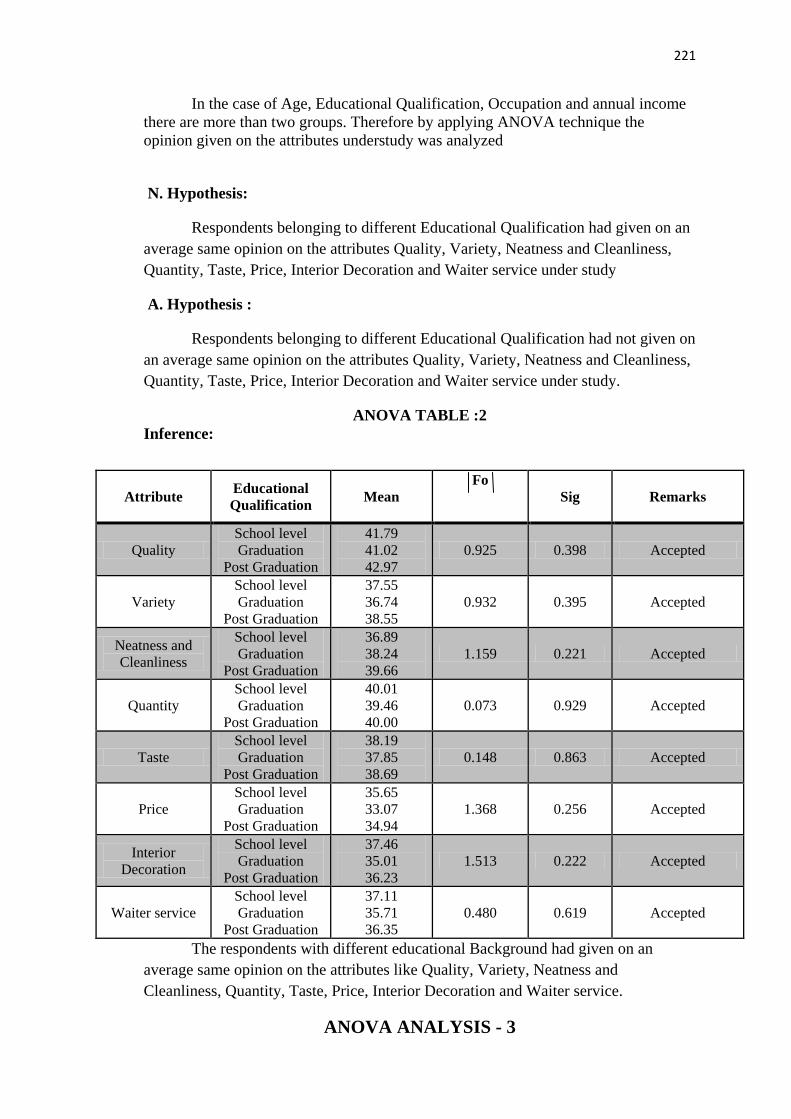
In the case of Age, Educational Qualification, Occupation and annual income there are more than two groups. Therefore by applying ANOVA technique the opinion given on the attributes understudy was analyzed
N. Hypothesis:
Respondents belonging to different Educational Qualification had given on an average same opinion on the attributes Quality, Variety, Neatness and Cleanliness, Quantity, Taste, Price, Interior Decoration and Waiter service under study
A. Hypothesis :
Respondents belonging to different Educational Qualification had not given on an average same opinion on the attributes Quality, Variety, Neatness and Cleanliness, Quantity, Taste, Price, Interior Decoration and Waiter service under study.
ANOVA TABLE :2 Inference:
The respondents with different educational Background had given on an average same opinion on the attributes like Quality, Variety, Neatness and Cleanliness, Quantity, Taste, Price, Interior Decoration and Waiter service.
ANOVA ANALYSIS - 3
Attribute Educational Qualification Mean
Fo Sig
Remarks
Quality School level Graduation
Post Graduation
41.79 41.02 42.97
0.925 0.398 Accepted
Variety School level Graduation
Post Graduation
37.55 36.74 38.55
0.932 0.395 Accepted
Neatness and Cleanliness
School level Graduation
Post Graduation
36.89 38.24 39.66
1.159 0.221 Accepted
Quantity School level Graduation
Post Graduation
40.01 39.46 40.00
0.073 0.929 Accepted
Taste School level Graduation
Post Graduation
38.19 37.85 38.69
0.148 0.863 Accepted
Price School level Graduation
Post Graduation
35.65 33.07 34.94
1.368 0.256 Accepted
Interior Decoration
School level Graduation
Post Graduation
37.46 35.01 36.23
1.513 0.222 Accepted
Waiter service School level Graduation
Post Graduation
37.11 35.71 36.35
0.480 0.619 Accepted
222
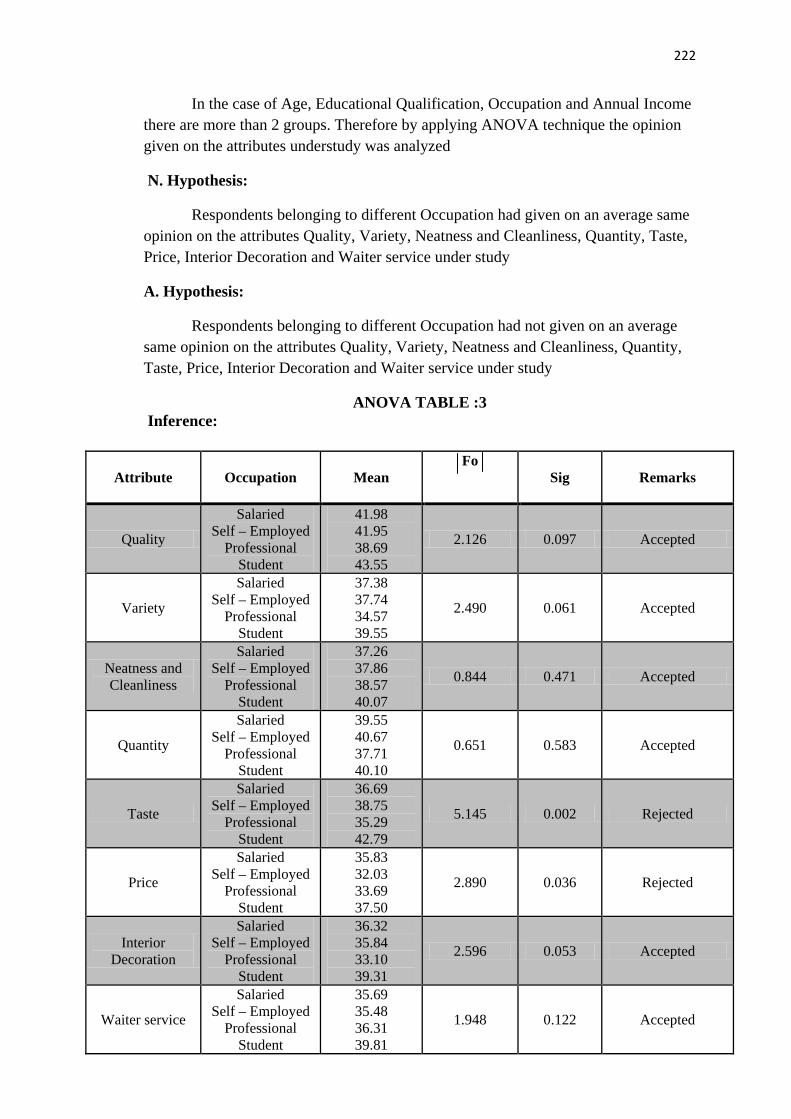
In the case of Age, Educational Qualification, Occupation and Annual Income there are more than 2 groups. Therefore by applying ANOVA technique the opinion given on the attributes understudy was analyzed
N. Hypothesis:
Respondents belonging to different Occupation had given on an average same opinion on the attributes Quality, Variety, Neatness and Cleanliness, Quantity, Taste, Price, Interior Decoration and Waiter service under study
A. Hypothesis:
Respondents belonging to different Occupation had not given on an average same opinion on the attributes Quality, Variety, Neatness and Cleanliness, Quantity, Taste, Price, Interior Decoration and Waiter service under study
ANOVA TABLE :3 Inference:
Attribute Occupation Mean Fo
Sig
Remarks
Quality
Salaried Self – Employed
Professional Student
41.98 41.95 38.69 43.55
2.126 0.097 Accepted
Variety
Salaried Self – Employed
Professional Student
37.38 37.74 34.57 39.55
2.490 0.061 Accepted
Neatness and Cleanliness
Salaried Self – Employed
Professional Student
37.26 37.86 38.57 40.07
0.844 0.471 Accepted
Quantity
Salaried Self – Employed
Professional Student
39.55 40.67 37.71 40.10
0.651 0.583 Accepted
Taste
Salaried Self – Employed
Professional Student
36.69 38.75 35.29 42.79
5.145 0.002 Rejected
Price
Salaried Self – Employed
Professional Student
35.83 32.03 33.69 37.50
2.890 0.036 Rejected
Interior Decoration
Salaried Self – Employed
Professional Student
36.32 35.84 33.10 39.31
2.596 0.053 Accepted
Waiter service
Salaried Self – Employed
Professional Student
35.69 35.48 36.31 39.81
1.948 0.122 Accepted
223
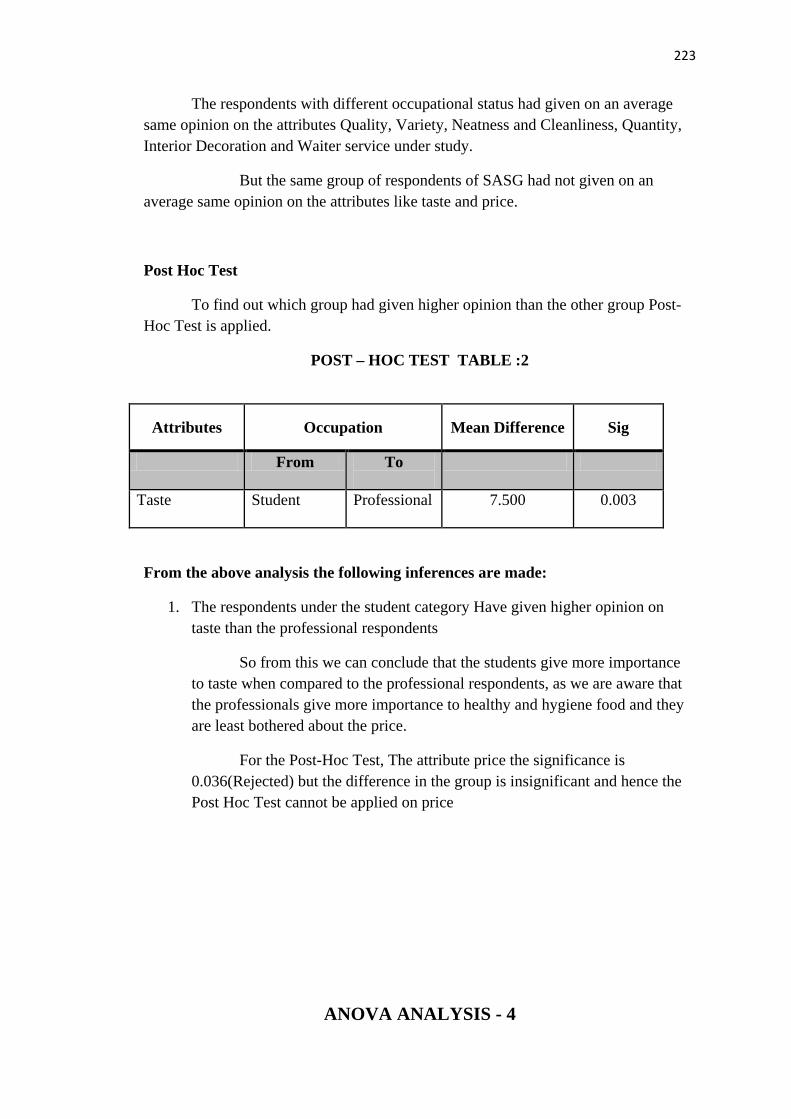
The respondents with different occupational status had given on an average same opinion on the attributes Quality, Variety, Neatness and Cleanliness, Quantity, Interior Decoration and Waiter service under study.
But the same group of respondents of SASG had not given on an average same opinion on the attributes like taste and price.
Post Hoc Test
To find out which group had given higher opinion than the other group Post-Hoc Test is applied.
POST – HOC TEST TABLE :2
Attributes Occupation Mean Difference Sig
From To
Taste Student Professional 7.500 0.003
From the above analysis the following inferences are made:
1. The respondents under the student category Have given higher opinion on taste than the professional respondents
So from this we can conclude that the students give more importance to taste when compared to the professional respondents, as we are aware that the professionals give more importance to healthy and hygiene food and they are least bothered about the price.
For the Post-Hoc Test, The attribute price the significance is 0.036(Rejected) but the difference in the group is insignificant and hence the Post Hoc Test cannot be applied on price
ANOVA ANALYSIS - 4

224
In the case of Age, Educational Qualification, Occupation and Annual Income there are more than two groups. Therefore by applying ANOVA technique the opinion given on the attributes understudy was analyzed
N. Hypothesis :
Respondents belonging to different level of Annual Incomes had given on an average same opinion on the attributes Quality, Variety, Neatness and Cleanliness, Quantity, Taste, Price, Interior Decoration and Waiter service under study
A. Hypothesis :
Respondents belonging to different level of Annual Incomes had not given on an average same opinion on the attributes Quality, Variety, Neatness and Cleanliness, Quantity, Taste, Price, Interior Decoration and Waiter service under study
ANOVA TABLE :4
Attribute
Annual Income
Mean
Fo
Sig
Remarks
Quality
Below 1 lakh 1 – 2 Lakhs 2 – 3 Lakhs
Above 3 Lakhs
41.39 42.15 41.48 41.85
0.723 0.539 Accepted
Variety
Below 1 lakh 1 – 2 Lakhs 2 – 3 Lakhs
Above 3 Lakhs
37.50 37.96 36.52 39.52
0.815 0.486 Accepted
Neatness and Cleanliness
Below 1 lakh 1 – 2 Lakhs 2 – 3 Lakhs
Above 3 Lakhs
36.96 37.92 39.23 42.24
2.807 0.040 Rejected
Quantity
Below 1 lakh 1 – 2 Lakhs 2 – 3 Lakhs
Above 3 Lakhs
39.98 39.50 40.96 41.18
0.192 0.902 Accepted
Taste
Below 1 lakh 1 – 2 Lakhs 2 – 3 Lakhs
Above 3 Lakhs
38.39 37.65 37.11 40.58
0.865 0.460 Accepted
Price
Below 1 lakh 1 – 2 Lakhs 2 – 3 Lakhs
Above 3 Lakhs
33.69 36.65 35.29 34.18
0.575 0.632 Accepted
Interior Decoration
Below 1 lakh 1 – 2 Lakhs 2 – 3 Lakhs
Above 3 Lakhs
36.15 39.27 36.38 32.88
1.959 0.121 Accepted
Waiter service
Below 1 lakh 1 – 2 Lakhs 2 – 3 Lakhs
Above 3 Lakhs
35.24 38.15 38.52 36.06
1.559 0.200 Accepted
Inference:

225
The respondents with different Annual income had given on an average same opinion on the following attributes Quality, Variety, Quantity, Taste, Price, Interior Decoration and Waiter service under study.
But the same group of respondents had not given on an average same opinion on the attribute Neatness and Cleanliness.
Post Hoc Test
To find out which income group had given a higher opinion towards neatness and Cleanliness than the other group Post-Hoc Test is applied.
POST – HOC TEST TABLE :3 Attribute Annual Income Mean Difference Sig
From To
Neatness and Cleanliness
Above 3 Lakhs
Below 1 Lakh
5.281 0.030
From the above analysis the following inferences are made:
1. The respondents under the above 3 lakhs had given higher opinion towards Neatness and Cleanliness than the respondents who have below 1 lakh income category
From the above analysis, it is inferred as that the higher income group is more concerned towards Neatness and Cleanliness than the lower income group.
172
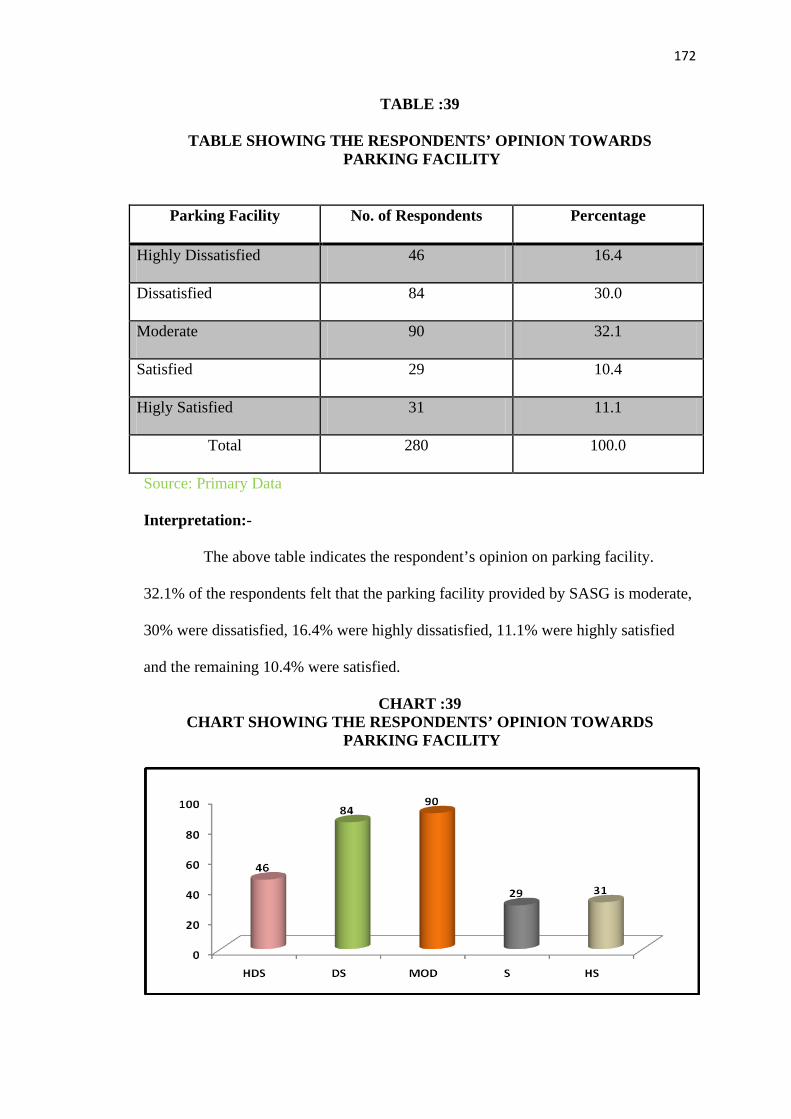
TABLE :39
TABLE SHOWING THE RESPONDENTS’ OPINION TOWARDS PARKING FACILITY
Parking Facility No. of Respondents Percentage
Highly Dissatisfied 46 16.4
Dissatisfied 84 30.0
Moderate 90 32.1
Satisfied 29 10.4
Higly Satisfied 31 11.1
Total 280 100.0
Source: Primary Data
Interpretation:-
The above table indicates the respondent’s opinion on parking facility.
32.1% of the respondents felt that the parking facility provided by SASG is moderate,
30% were dissatisfied, 16.4% were highly dissatisfied, 11.1% were highly satisfied
and the remaining 10.4% were satisfied.
CHART :39 CHART SHOWING THE RESPONDENTS’ OPINION TOWARDS
PARKING FACILITY
173
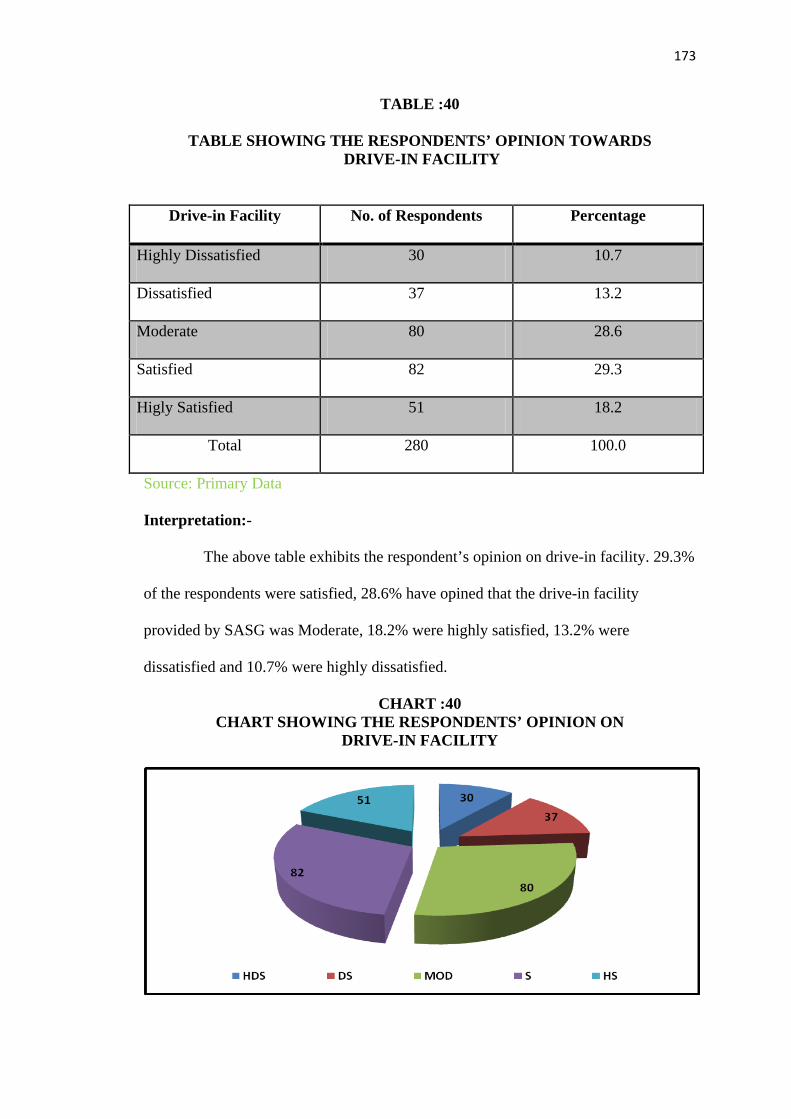
TABLE :40
TABLE SHOWING THE RESPONDENTS’ OPINION TOWARDS DRIVE-IN FACILITY
Drive-in Facility No. of Respondents Percentage
Highly Dissatisfied 30 10.7
Dissatisfied 37 13.2
Moderate 80 28.6
Satisfied 82 29.3
Higly Satisfied 51 18.2
Total 280 100.0
Source: Primary Data
Interpretation:-
The above table exhibits the respondent’s opinion on drive-in facility. 29.3%
of the respondents were satisfied, 28.6% have opined that the drive-in facility
provided by SASG was Moderate, 18.2% were highly satisfied, 13.2% were
dissatisfied and 10.7% were highly dissatisfied.
CHART :40 CHART SHOWING THE RESPONDENTS’ OPINION ON
DRIVE-IN FACILITY
174
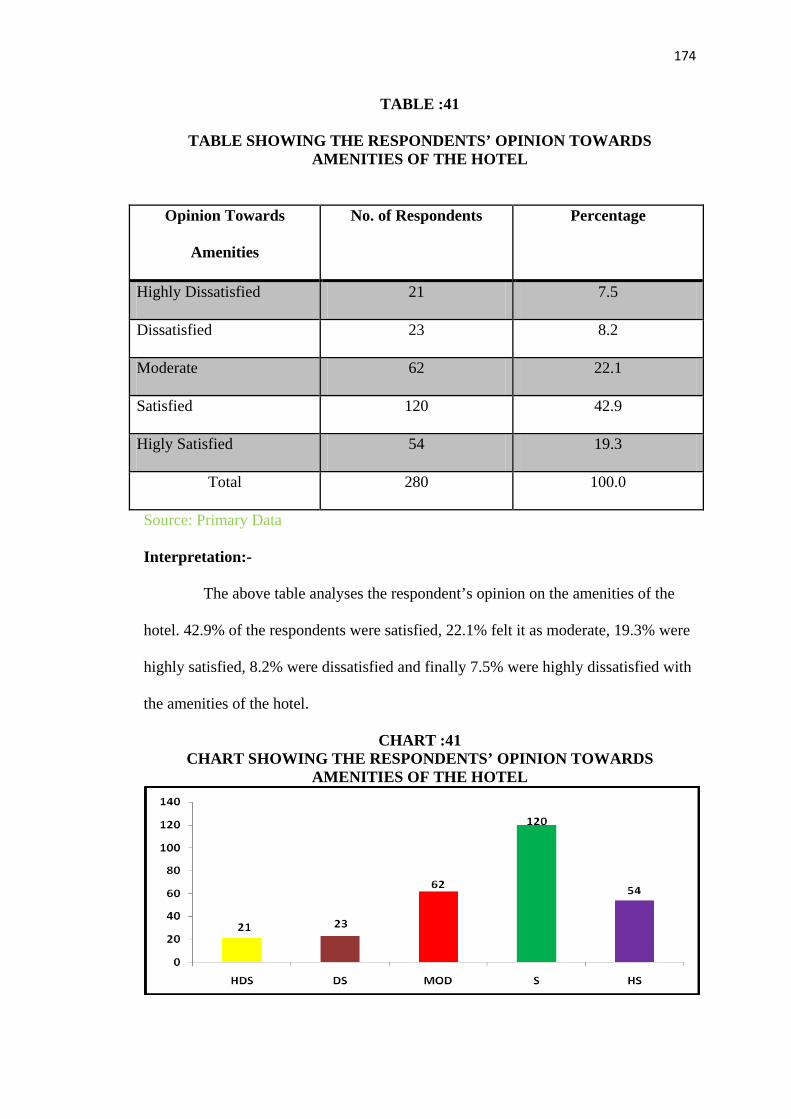
TABLE :41
TABLE SHOWING THE RESPONDENTS’ OPINION TOWARDS AMENITIES OF THE HOTEL
Opinion Towards
Amenities
No. of Respondents Percentage
Highly Dissatisfied 21 7.5
Dissatisfied 23 8.2
Moderate 62 22.1
Satisfied 120 42.9
Higly Satisfied 54 19.3
Total 280 100.0
Source: Primary Data
Interpretation:-
The above table analyses the respondent’s opinion on the amenities of the
hotel. 42.9% of the respondents were satisfied, 22.1% felt it as moderate, 19.3% were
highly satisfied, 8.2% were dissatisfied and finally 7.5% were highly dissatisfied with
the amenities of the hotel.
CHART :41 CHART SHOWING THE RESPONDENTS’ OPINION TOWARDS
AMENITIES OF THE HOTEL
175
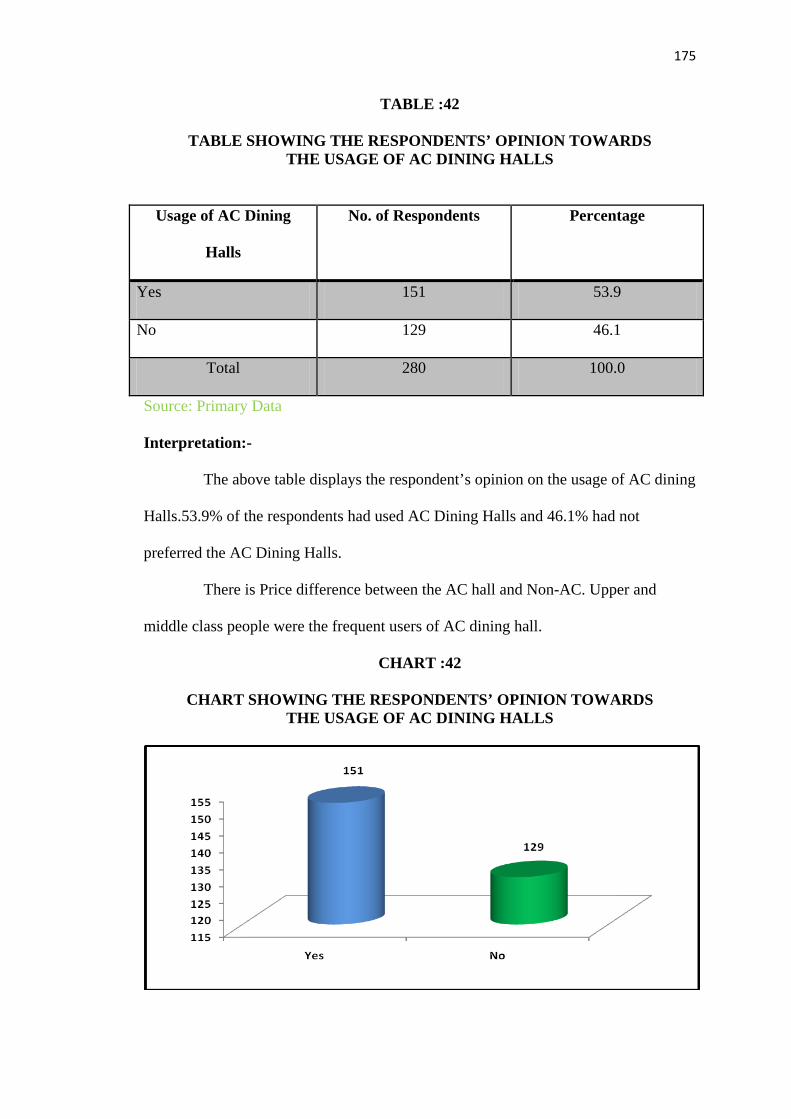
TABLE :42
TABLE SHOWING THE RESPONDENTS’ OPINION TOWARDS THE USAGE OF AC DINING HALLS
Usage of AC Dining
Halls
No. of Respondents Percentage
Yes 151 53.9
No 129 46.1
Total 280 100.0
Source: Primary Data
Interpretation:-
The above table displays the respondent’s opinion on the usage of AC dining
Halls.53.9% of the respondents had used AC Dining Halls and 46.1% had not
preferred the AC Dining Halls.
There is Price difference between the AC hall and Non-AC. Upper and
middle class people were the frequent users of AC dining hall.
CHART :42
CHART SHOWING THE RESPONDENTS’ OPINION TOWARDS THE USAGE OF AC DINING HALLS

176
TABLE :43
TABLE SHOWING THE RESPONDENTS’ TIME OF SWEET PURCHASE
Time of Sweet Purchase No. of Respondents Percentage
Festival’s 111 39.6
Party’s 56 20.0
Visiting Friend’s 56 20.0
Relatives Arrival 57 20.4
Total 280 100.0
Source: Primary Data
Interpretation:-
The above table indicates the respondent’s time of sweet purchase. 39.6% of
the respondents normally buy the sweets during Festivals, followed by 20.4% on
relative’s arrival, 20% for party and another 20% during visits to Friends and relatives
house.
CHART :43 CHART SHOWING THE RESPONDENTS’ TIME OF SWEET PURCHASE

177
TABLE :44
TABLE SHOWING THE RESPONDENTS’ OPINION ON PURCHASE OF SWEETS AND SAVORIES
Purchase of Sweets and
Savories
No. of Respondents Percentage
Yes 190 67.9
No 90 32.1
Total 280 100.0
Source: Primary Data
Interpretation:-
The above table exhibits the respondent’s opinion towards the
purchase of sweets and savories. 67.9% of the respondents normally buy both sweets
and savories during their purchase and 32.1% of the respondents buy either sweets or
savories and they don’t buy both at the same time.
CHART :44 CHART SHOWING THE RESPONDENTS’ OPINION ON
PURCHASE OF SWEETS AND SAVORIES

178
TABLE :45
TABLE SHOWING WAITING TIME OF THE RESPONDENTS
Waiting Time No. of Respondents Percentage
Less than 3 Minutes 83 29.6
3 – 5 Minutes 98 35.0
5 – 7 Members 27 9.6
7 - 10 Minutes 25 8.9
More Than 10 Minutes 47 16.8
Total 280 100.0
Source: Primary Data
Interpretation:-
The above table exhibits the respondent’s waiting time. The analysis shows
that 35% of the respondents had waited 3 – 5 minutes to get a place to sit, 29.6% of
the respondents waiting time was less than 3 Minutes, 16.8% of them had waited
more than 10 minutes 9.6% waiting time was 5 – 7 minutes and 8.9% of the
respondents had waited 7 – 10 minutes.
CHART :45 CHART SHOWING WAITING TIME OF THE RESPONDENTS
179
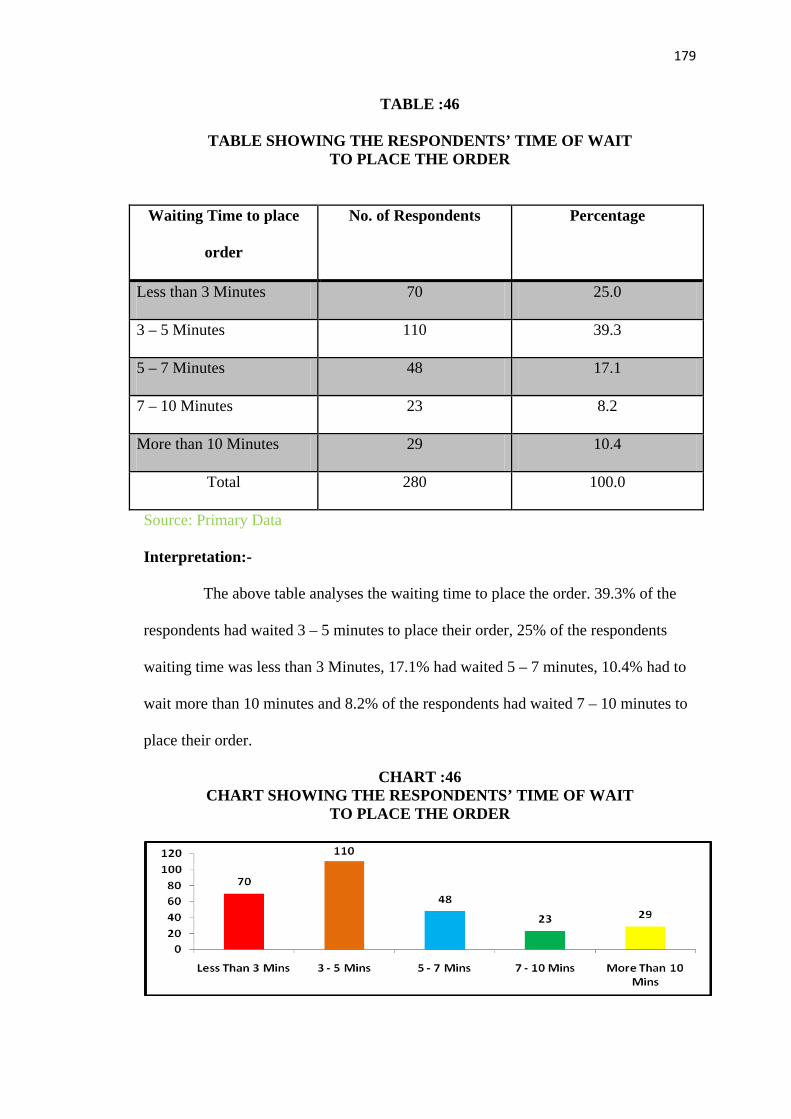
TABLE :46
TABLE SHOWING THE RESPONDENTS’ TIME OF WAIT TO PLACE THE ORDER
Waiting Time to place
order
No. of Respondents Percentage
Less than 3 Minutes 70 25.0
3 – 5 Minutes 110 39.3
5 – 7 Minutes 48 17.1
7 – 10 Minutes 23 8.2
More than 10 Minutes 29 10.4
Total 280 100.0
Source: Primary Data
Interpretation:-
The above table analyses the waiting time to place the order. 39.3% of the
respondents had waited 3 – 5 minutes to place their order, 25% of the respondents
waiting time was less than 3 Minutes, 17.1% had waited 5 – 7 minutes, 10.4% had to
wait more than 10 minutes and 8.2% of the respondents had waited 7 – 10 minutes to
place their order.
CHART :46 CHART SHOWING THE RESPONDENTS’ TIME OF WAIT
TO PLACE THE ORDER

180
TABLE :47
TABLE SHOWING THE RESPONDENTS’ TIME OF WAIT TO GET THE ORDERED ITEMS
Time of Wait No. of Respondents Percentage
Less than 3 Minutes 65 23.2
3 – 5 Minutes 96 34.3
5 – 7 Minutes 51 18.2
7 – 10 Minutes 28 10.0
More than 10 Minutes 40 14.3
Total 280 100
Source: Primary Data
Interpretation:-
The above table describes the respondents waiting time to get
the ordered items. 34.3% of the respondents had waited 3 – 5 minutes to get their
ordered items, 23.2% of the respondents waiting time was less than 3 Minutes, 18.2%
had waited 5 – 7 minutes, 14.3% had to wait more than 10 minutes and 10% of the
respondents waiting time ranges between 7 – 10 minutes to get their ordered items.
CHART :47 CHART SHOWING THE RESPONDENTS’ TIME OF WAIT
TO GET THE ORDERED ITEMS
181
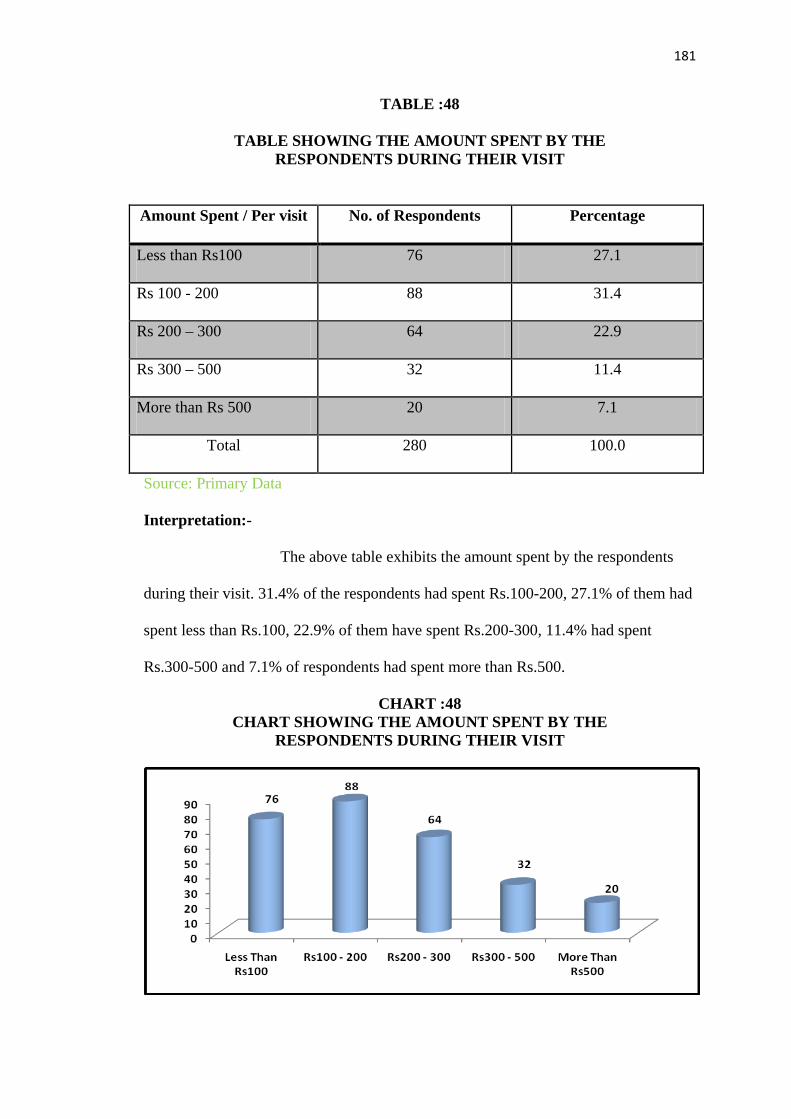
TABLE :48
TABLE SHOWING THE AMOUNT SPENT BY THE RESPONDENTS DURING THEIR VISIT
Amount Spent / Per visit No. of Respondents Percentage
Less than Rs100 76 27.1
Rs 100 - 200 88 31.4
Rs 200 – 300 64 22.9
Rs 300 – 500 32 11.4
More than Rs 500 20 7.1
Total 280 100.0
Source: Primary Data
Interpretation:-
The above table exhibits the amount spent by the respondents
during their visit. 31.4% of the respondents had spent Rs.100-200, 27.1% of them had
spent less than Rs.100, 22.9% of them have spent Rs.200-300, 11.4% had spent
Rs.300-500 and 7.1% of respondents had spent more than Rs.500.
CHART :48 CHART SHOWING THE AMOUNT SPENT BY THE
RESPONDENTS DURING THEIR VISIT
182
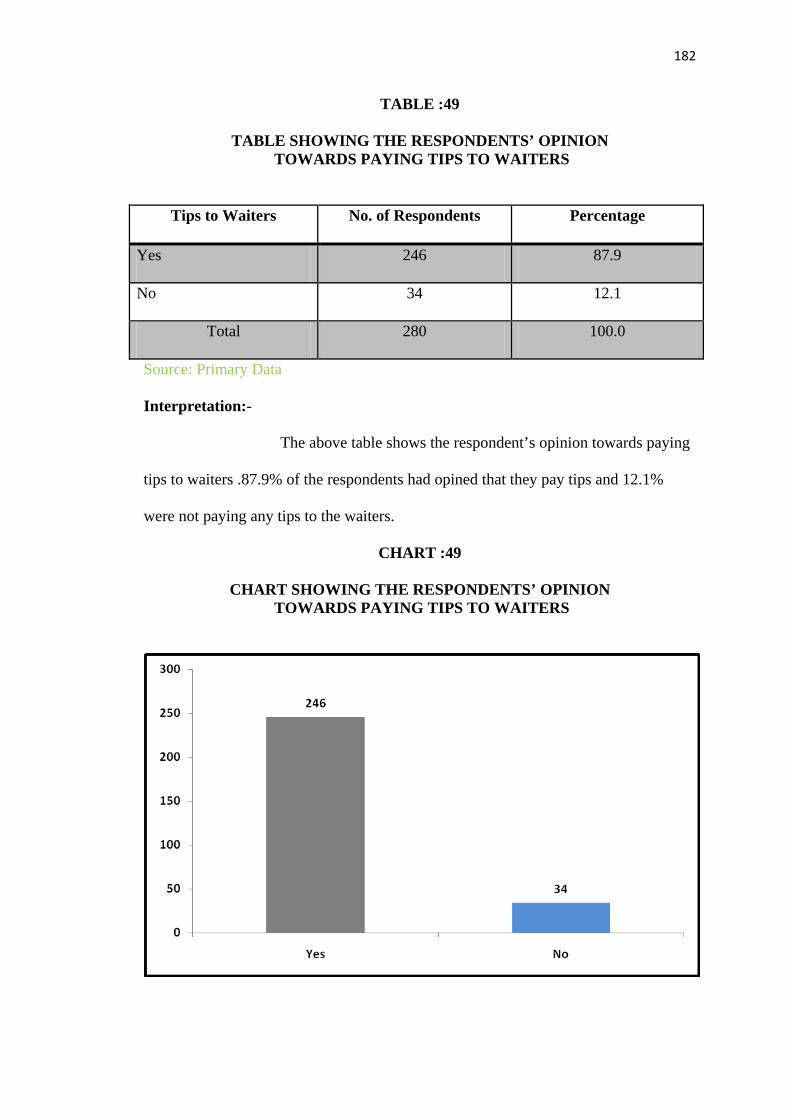
TABLE :49
TABLE SHOWING THE RESPONDENTS’ OPINION TOWARDS PAYING TIPS TO WAITERS
Tips to Waiters No. of Respondents Percentage
Yes 246 87.9
No 34 12.1
Total 280 100.0
Source: Primary Data
Interpretation:-
The above table shows the respondent’s opinion towards paying
tips to waiters .87.9% of the respondents had opined that they pay tips and 12.1%
were not paying any tips to the waiters.
CHART :49
CHART SHOWING THE RESPONDENTS’ OPINION TOWARDS PAYING TIPS TO WAITERS

183
TABLE :50
TABLE SHOWING THE TIPS PAID BY THE RESPONDENTS
Tips Amount Paid No. of Respondents Percentage
Less than Rs 2 58 20.7
Rs 2 - 5 105 37.5
Rs 5 – 10 49 17.5
Rs 10 – 20 24 8.6
More than Rs 20 10 3.6
Not Responded 34 12.1
Total 280 100.0
Source: Primary Data
Interpretation:-
The above table displays the amount paid by the respondents as
tips. 37.5% of the respondents had paid Rs.2 – 5 as tips, 20.7% had paid less than
Rs.2, 17.5% had paid Rs.5 – 10, 8.6% had paid Rs.10 – 20, 3.6% of the respondents
had paid more than 20 Rupees as tips and 12.1% of the respondents had not responded
for the same.
CHART :50 CHART SHOWING THE TIPS PAID BY THE RESPONDENTS
184
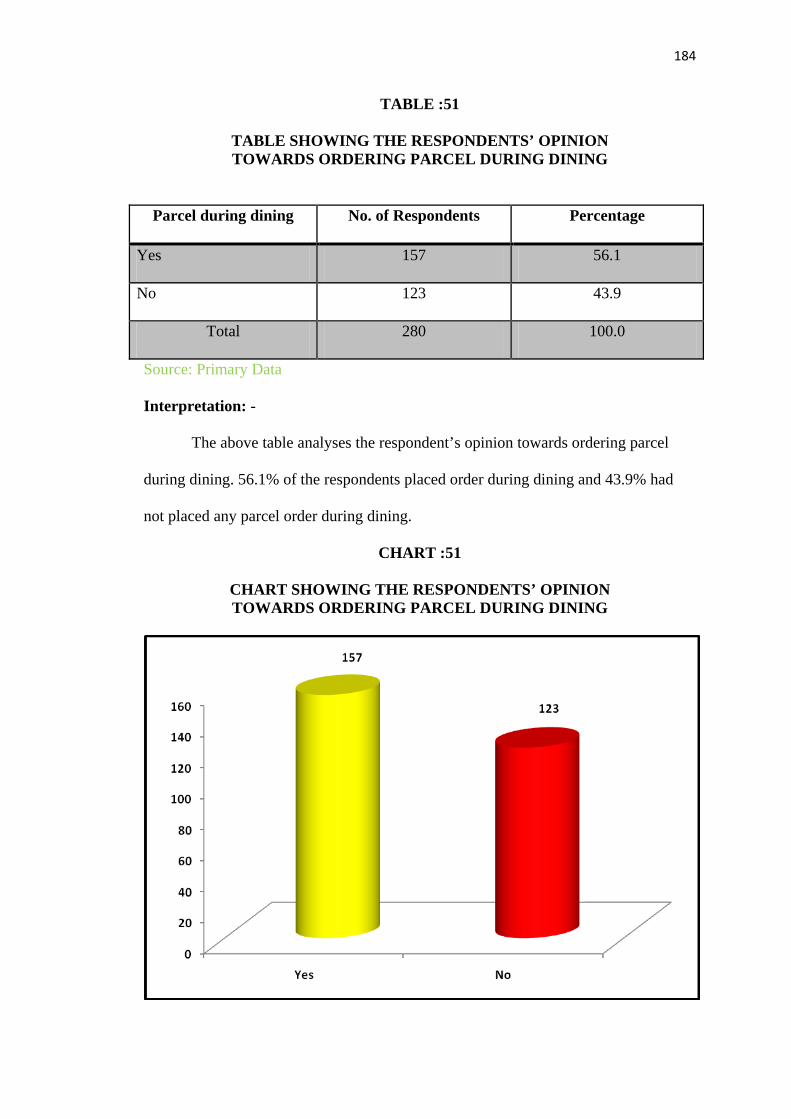
TABLE :51
TABLE SHOWING THE RESPONDENTS’ OPINION TOWARDS ORDERING PARCEL DURING DINING
Parcel during dining No. of Respondents Percentage
Yes 157 56.1
No 123 43.9
Total 280 100.0
Source: Primary Data
Interpretation: -
The above table analyses the respondent’s opinion towards ordering parcel
during dining. 56.1% of the respondents placed order during dining and 43.9% had
not placed any parcel order during dining.
CHART :51
CHART SHOWING THE RESPONDENTS’ OPINION TOWARDS ORDERING PARCEL DURING DINING

185
TABLE :52
TABLE SHOWING THE RESPONDENTS’ PLACE OF BILL PAYMENT
Bill Payment No. of Respondents Percentage
Dining Table 253 90.4
Cash Counter 27 9.6
Total 280 100.0
Source: Primary Data
Interpretation: -
The above table shows the respondent’s place of bill payment. 90.4% of the
respondents had a practice of paying the bill at the dining table and the remaining
9.6% of the respondents had paid through the cash counters.
TABLE :52
TABLE SHOWING THE RESPONDENTS’ PLACE OF BILL PAYMENT
186
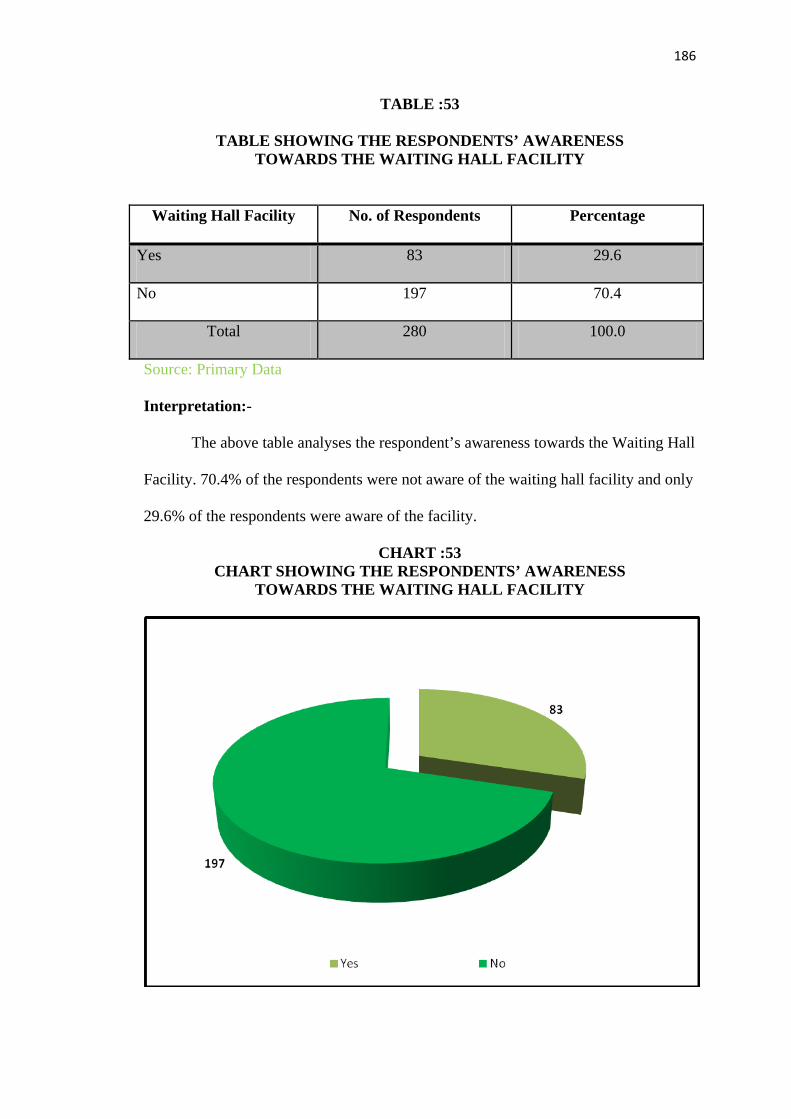
TABLE :53
TABLE SHOWING THE RESPONDENTS’ AWARENESS TOWARDS THE WAITING HALL FACILITY
Waiting Hall Facility No. of Respondents Percentage
Yes 83 29.6
No 197 70.4
Total 280 100.0
Source: Primary Data
Interpretation:-
The above table analyses the respondent’s awareness towards the Waiting Hall
Facility. 70.4% of the respondents were not aware of the waiting hall facility and only
29.6% of the respondents were aware of the facility.
CHART :53 CHART SHOWING THE RESPONDENTS’ AWARENESS
TOWARDS THE WAITING HALL FACILITY

187
TABLE :54
TABLE SHOWING THE RESPONDENTS’ AWARENESS TOWARDS THE DISCOUNTS
Awareness on Discounts No. of Respondents Percentage
Yes 109 38.9
No 171 61.1
Total 280 100.0
Source: Primary Data
Interpretation:-
The above table points out the respondent’s awareness towards the Discounts.
61.1% of the respondents were not aware of the discounts provided by the hotel and
only 38.9% of the respondents were aware of these discounts.
CHART :54
CHART SHOWING THE RESPONDENTS’ AWARENESS TOWARDS THE DISCOUNTS

188
TABLE :55
TABLE SHOWING THE TABLE RESERVATION BY RESPONDENTS
Table Reservation No. of Respondents Percentage
Yes 128 45.7
No 152 54.3
Total 280 100.0
Source: Primary Data
Interpretation: -
The above table represents the ‘table reservations’ done by the respondents.
54.3% of the respondents did not reserve table in advance. They visit the hotel as and
when the need arises, 45.7% of the respondents had a practice of booking the table in
advance to minimize the waiting time and to maximize the comfort.
TABLE :55 TABLE SHOWING THE TABLE RESERVATION BY RESPONDENTS

189
TABLE :56
TABLE SHOWING THE RESPONDENTS’ OPINION ON USAGE OF FAMILY ROOMS
Usage of
Family Room
No. of Respondents Percentage
Yes 163 58.2
No 117 41.8
Total 280 100.0
Source: Primary Data
Interpretation:-
The above table classifies the respondent’s usage of family rooms. 58.2% of
the respondents had opined that they had used family rooms whenever they visit with
their family, relatives and friends in good number and 41.8% of the respondents had
not used family rooms till now.
CHART :56 CHART SHOWING THE RESPONDENTS’ OPINION ON
USAGE OF FAMILY ROOMS
190
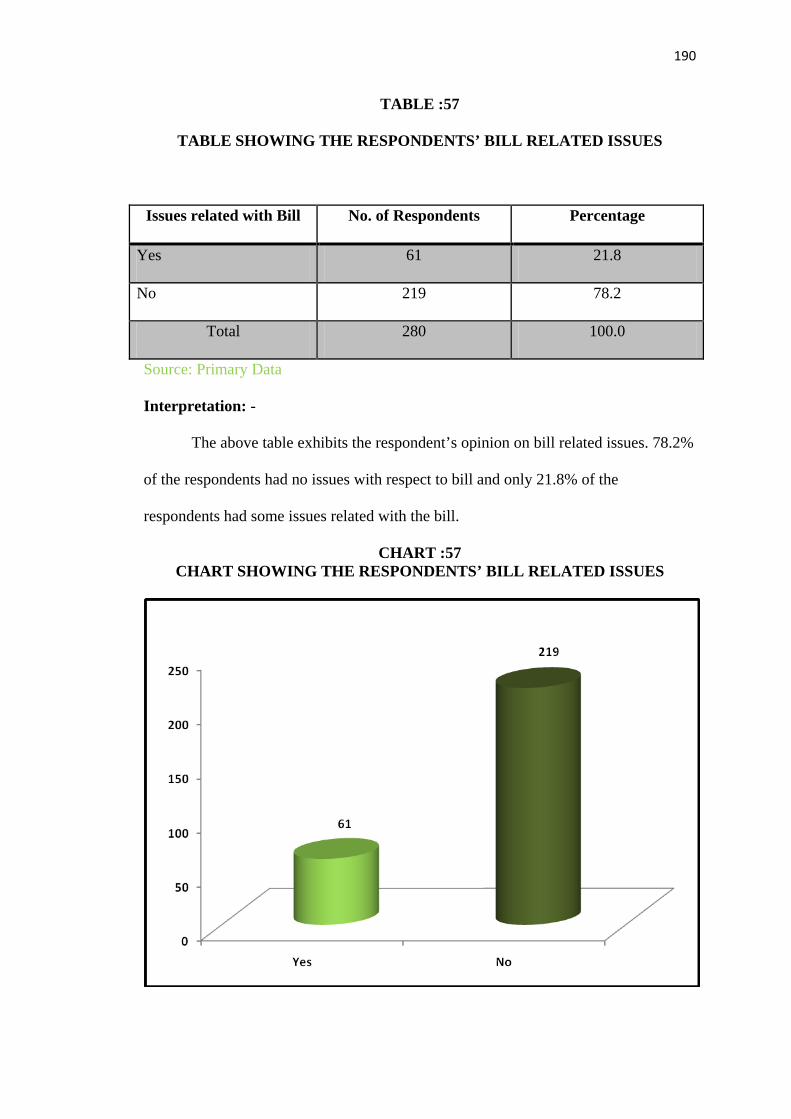
TABLE :57
TABLE SHOWING THE RESPONDENTS’ BILL RELATED ISSUES
Issues related with Bill No. of Respondents Percentage
Yes 61 21.8
No 219 78.2
Total 280 100.0
Source: Primary Data
Interpretation: -
The above table exhibits the respondent’s opinion on bill related issues. 78.2%
of the respondents had no issues with respect to bill and only 21.8% of the
respondents had some issues related with the bill.
CHART :57 CHART SHOWING THE RESPONDENTS’ BILL RELATED ISSUES
191
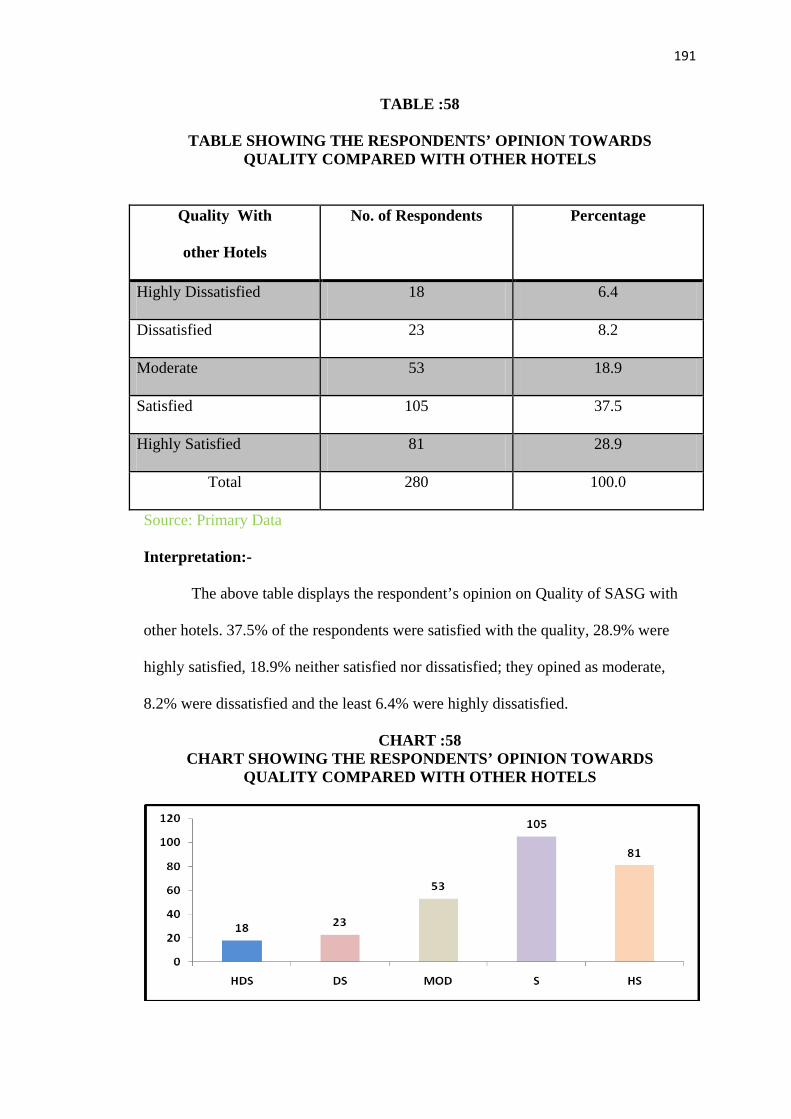
TABLE :58
TABLE SHOWING THE RESPONDENTS’ OPINION TOWARDS QUALITY COMPARED WITH OTHER HOTELS
Quality With
other Hotels
No. of Respondents Percentage
Highly Dissatisfied 18 6.4
Dissatisfied 23 8.2
Moderate 53 18.9
Satisfied 105 37.5
Highly Satisfied 81 28.9
Total 280 100.0
Source: Primary Data
Interpretation:-
The above table displays the respondent’s opinion on Quality of SASG with
other hotels. 37.5% of the respondents were satisfied with the quality, 28.9% were
highly satisfied, 18.9% neither satisfied nor dissatisfied; they opined as moderate,
8.2% were dissatisfied and the least 6.4% were highly dissatisfied.
CHART :58 CHART SHOWING THE RESPONDENTS’ OPINION TOWARDS
QUALITY COMPARED WITH OTHER HOTELS

192
TABLE :59
TABLE SHOWING THE RESPONDENTS’ OPINION TOWARDS VARIETY COMPARED WITH OTHER HOTELS
Variety With
other Hotels
No. of Respondents Percentage
Highly Dissatisfied 14 5.0
Dissatisfied 21 7.5
Moderate 51 18.2
Satisfied 122 43.6
Highly Satisfied 72 25.7
Total 280 100.0
Source: Primary Data
Interpretation:-
The above table interprets the respondent’s opinion on Variety of SASG
compared with other hotels. 43.6 % of the respondents were satisfied with the Variety,
25.7% were highly satisfied, 18.2% neither satisfied nor dissatisfied they have opined
as moderate, 7.5% were dissatisfied and the least 5% were highly dissatisfied.
CHART :59 CHART SHOWING THE RESPONDENTS’ OPINION TOWARDS
VARIETY COMPARED WITH OTHER HOTELS
193
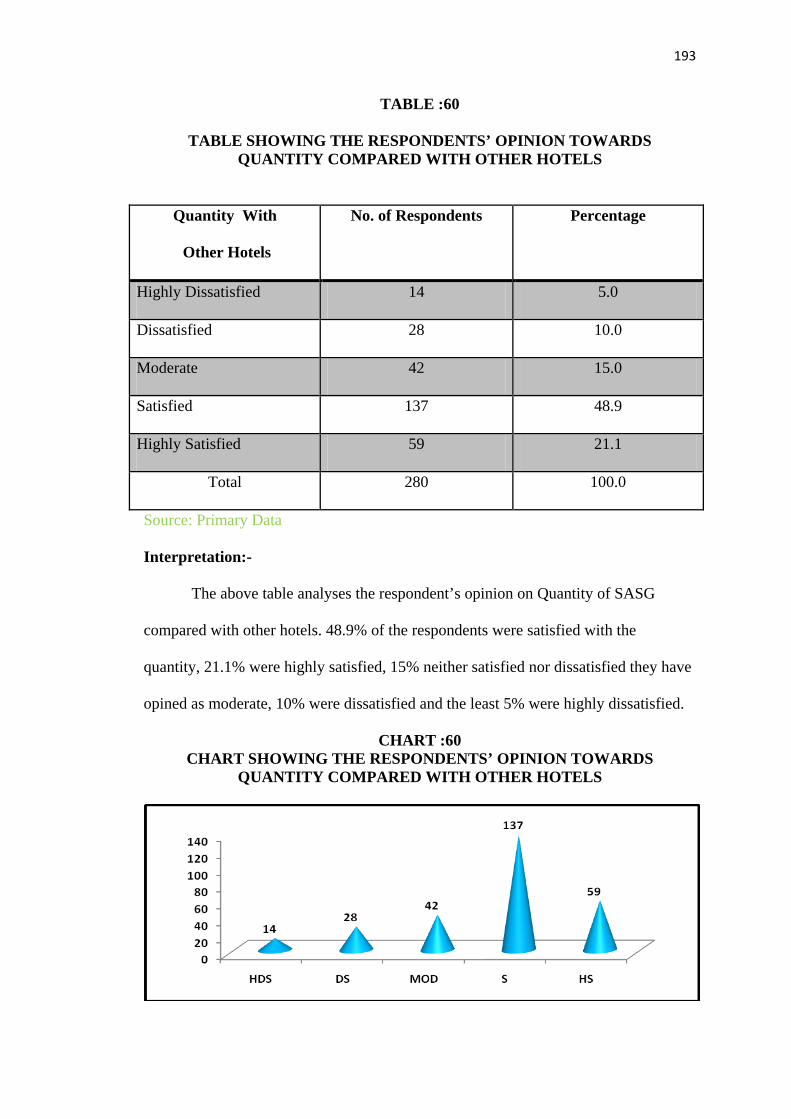
TABLE :60
TABLE SHOWING THE RESPONDENTS’ OPINION TOWARDS QUANTITY COMPARED WITH OTHER HOTELS
Quantity With
Other Hotels
No. of Respondents Percentage
Highly Dissatisfied 14 5.0
Dissatisfied 28 10.0
Moderate 42 15.0
Satisfied 137 48.9
Highly Satisfied 59 21.1
Total 280 100.0
Source: Primary Data
Interpretation:-
The above table analyses the respondent’s opinion on Quantity of SASG
compared with other hotels. 48.9% of the respondents were satisfied with the
quantity, 21.1% were highly satisfied, 15% neither satisfied nor dissatisfied they have
opined as moderate, 10% were dissatisfied and the least 5% were highly dissatisfied.
CHART :60 CHART SHOWING THE RESPONDENTS’ OPINION TOWARDS
QUANTITY COMPARED WITH OTHER HOTELS

194
TABLE :61
TABLE SHOWING THE RESPONDENTS OPINION TOWARDS NEATNESS & CLEANLINESS COMPARED WITH OTHER HOTELS
Neatness & Cleanliness
With other Hotels
No. of Respondents Percentage
Highly Dissatisfied 7 2.5
Dissatisfied 27 9.6
Moderate 59 21.1
Satisfied 116 41.4
Highly Satisfied 71 25.4
Total 280 100.0
Source: Primary Data
Interpretation:-
The above table displays the respondent’s opinion on Neatness and
Cleanliness of SASG with other hotels. 41.4% of the respondents were satisfied with
the Neatness & Cleanliness, 25.4% were highly satisfied, 21.1% neither satisfied nor
dissatisfied they have opined as moderate, 9.6% were dissatisfied and the least 2.5%
were highly dissatisfied.
CHART :61 CHART SHOWING THE RESPONDENTS’ OPINION TOWARDS
NEATNESS & CLEANLINESS COMPARED WITH OTHER HOTELS

195
TABLE :62
TABLE SHOWING THE RESPONDENTS OPINION TOWARDS TASTE COMPARED WITH OTHER HOTELS
Taste With
other Hotels
No. of Respondents Percentage
Highly Dissatisfied 13 4.6
Dissatisfied 19 6.8
Moderate 39 13.9
Satisfied 123 43.9
Highly Satisfied 86 30.7
Total 280 100.0
Source: Primary Data
Interpretation:-
The above table exhibits the respondent’s opinion on Taste of SASG with
other hotels. 43.9% of the respondents were satisfied with the Taste, 30.7% were
highly satisfied, 13.9% neither satisfied nor dissatisfied they have opined as moderate,
6.8% were dissatisfied and the least 4.6% were highly dissatisfied.
CHART :62 CHART SHOWING THE RESPONDENTS’ OPINION TOWARDS
TASTE WITH OTHER HOTELS

196
TABLE :63
TABLE SHOWING THE RESPONDENTS’ OPINION TOWARDS PRICE WITH OTHER HOTELS
Price With
other Hotels
No. of Respondents Percentage
Highly Dissatisfied 26 9.3
Dissatisfied 52 18.6
Moderate 53 18.9
Satisfied 90 32.1
Highly Satisfied 59 21.1
Total 280 100.0
Source: Primary Data
Interpretation:-
The above table interprets the respondent’s opinion on Price of SASG
compared with other hotels. 32.1% of the respondents were satisfied with the Price,
21.1% were highly satisfied, 18.9% neither satisfied nor dissatisfied they have opined
as moderate, 18.6% were dissatisfied and the least 9.3% were highly dissatisfied.
CHART :63 CHART SHOWING THE RESPONDENTS’ OPINION TOWARDS
PRICE COMPARED WITH OTHER HOTELS

197
TABLE :64
TABLE SHOWING THE RESPONDENTS’ OPINION TOWARDS INTERIOR DECORATION COMPARED WITH OTHER HOTELS
Interior Decoration With
other Hotels
No. of Respondents Percentage
Highly Dissatisfied 13 4.6
Dissatisfied 37 13.2
Moderate 73 26.1
Satisfied 100 35.7
Highly Satisfied 57 20.4
Total 280 100.0
Source: Primary Data
Interpretation:-
The above table classifies the respondent’s opinion on Interior Decoration of
SASG compared with other hotels. 35.7% of the respondents were satisfied with the
Interior Decoration, 20.4% were highly satisfied, 26.1% neither satisfied nor
dissatisfied they have opined as moderate, 13.2% were dissatisfied and the least 4.6%
were highly dissatisfied.
CHART :64 CHART SHOWING THE RESPONDENTS’ OPINION TOWARDS
INTERIOR DECORATION COMPARED WITH OTHER HOTELS
198
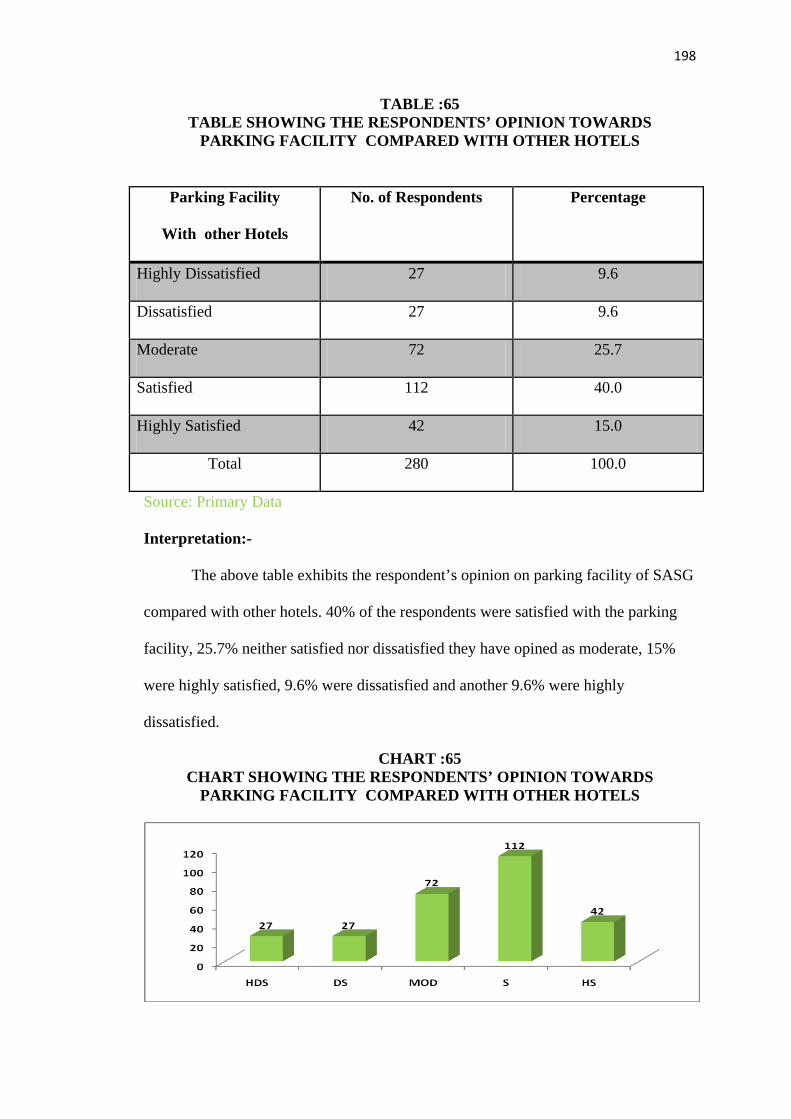
TABLE :65 TABLE SHOWING THE RESPONDENTS’ OPINION TOWARDS
PARKING FACILITY COMPARED WITH OTHER HOTELS
Parking Facility
With other Hotels
No. of Respondents Percentage
Highly Dissatisfied 27 9.6
Dissatisfied 27 9.6
Moderate 72 25.7
Satisfied 112 40.0
Highly Satisfied 42 15.0
Total 280 100.0
Source: Primary Data
Interpretation:-
The above table exhibits the respondent’s opinion on parking facility of SASG
compared with other hotels. 40% of the respondents were satisfied with the parking
facility, 25.7% neither satisfied nor dissatisfied they have opined as moderate, 15%
were highly satisfied, 9.6% were dissatisfied and another 9.6% were highly
dissatisfied.
CHART :65 CHART SHOWING THE RESPONDENTS’ OPINION TOWARDS
PARKING FACILITY COMPARED WITH OTHER HOTELS

199
TABLE :66
TABLE SHOWING THE RESPONDENTS’ OPINION TOWARDS SERVICES COMPARED WITH OTHER HOTELS
Services With
other Hotels
No. of Respondents Percentage
Highly Dissatisfied 13 4.6
Dissatisfied 17 6.1
Moderate 55 19.6
Satisfied 128 45.7
Highly Satisfied 67 23.9
Total 280 100.0
Source: Primary Data
Interpretation:-
The above table analyses the respondent’s opinion on services of SASG
compared with other hotels. 45.7% of the respondents were satisfied with the services,
23.9% were highly satisfied, 19.6% neither satisfied nor dissatisfied they have opined
as moderate, 6.1% were dissatisfied and another 4.6% were highly dissatisfied.
CHART :66 CHART SHOWING THE RESPONDENTS’ OPINION TOWARDS
SERVICES COMPARED WITH OTHER HOTELS
200
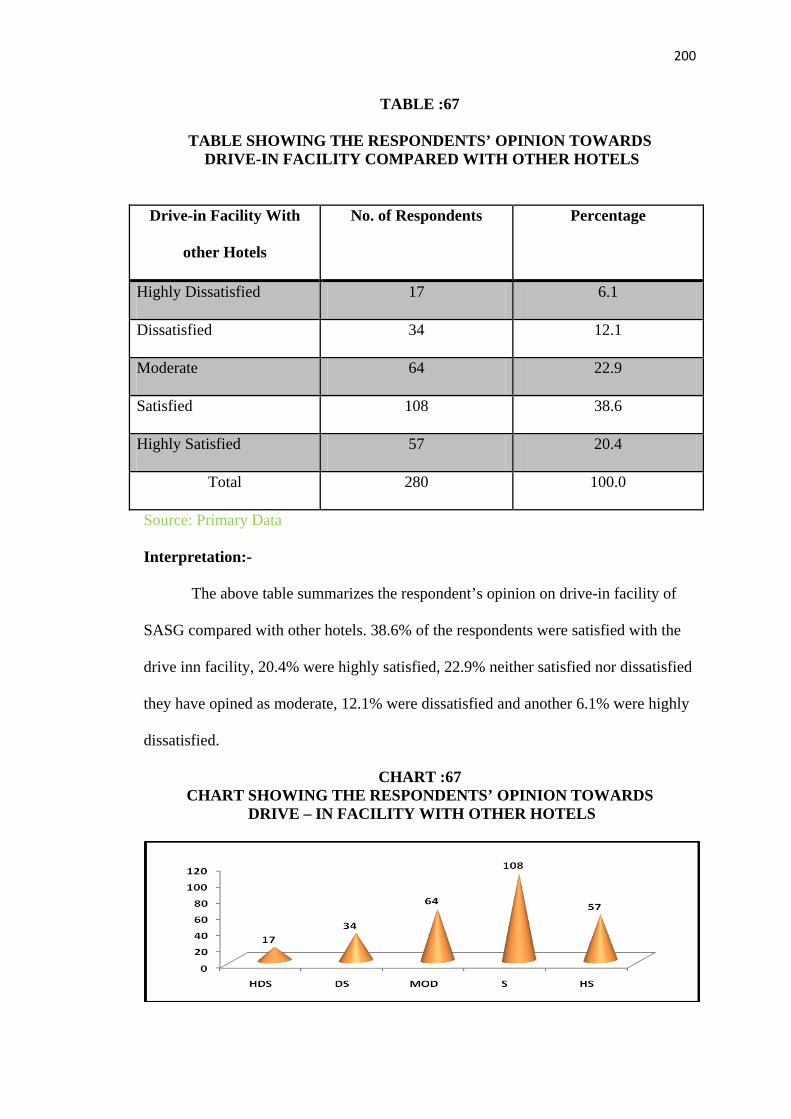
TABLE :67
TABLE SHOWING THE RESPONDENTS’ OPINION TOWARDS DRIVE-IN FACILITY COMPARED WITH OTHER HOTELS
Drive-in Facility With
other Hotels
No. of Respondents Percentage
Highly Dissatisfied 17 6.1
Dissatisfied 34 12.1
Moderate 64 22.9
Satisfied 108 38.6
Highly Satisfied 57 20.4
Total 280 100.0
Source: Primary Data
Interpretation:-
The above table summarizes the respondent’s opinion on drive-in facility of
SASG compared with other hotels. 38.6% of the respondents were satisfied with the
drive inn facility, 20.4% were highly satisfied, 22.9% neither satisfied nor dissatisfied
they have opined as moderate, 12.1% were dissatisfied and another 6.1% were highly
dissatisfied.
CHART :67 CHART SHOWING THE RESPONDENTS’ OPINION TOWARDS
DRIVE – IN FACILITY WITH OTHER HOTELS
201
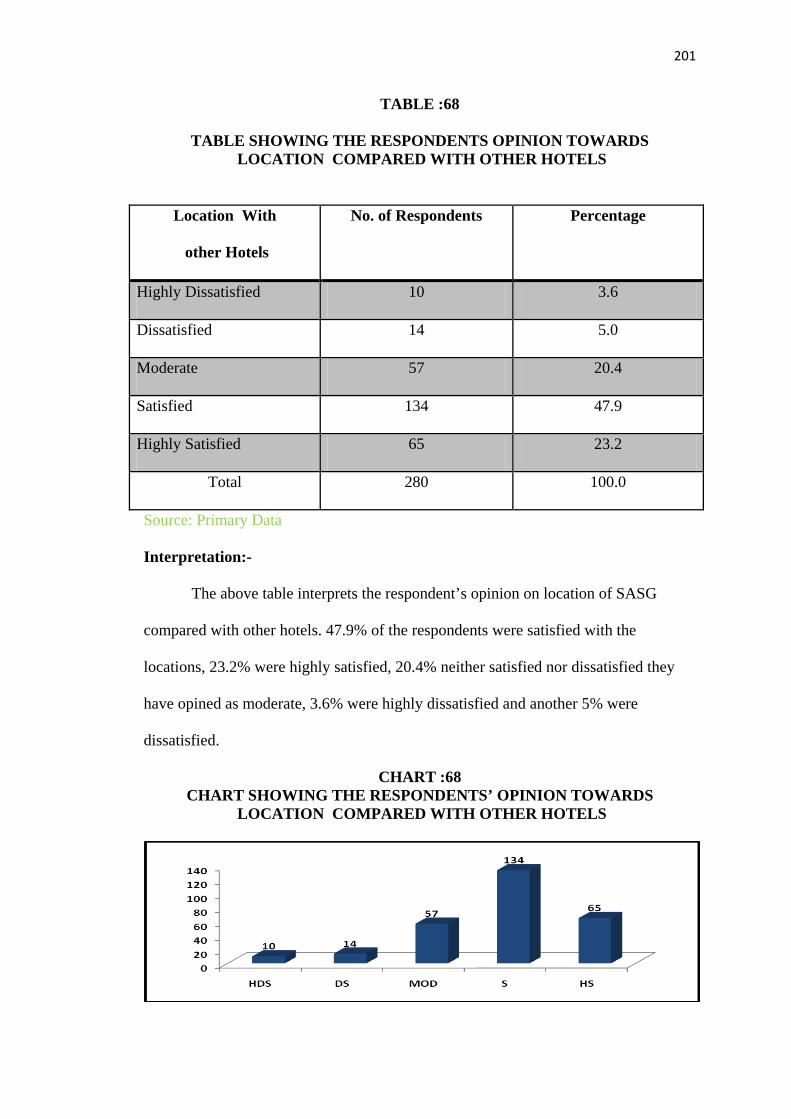
TABLE :68
TABLE SHOWING THE RESPONDENTS OPINION TOWARDS LOCATION COMPARED WITH OTHER HOTELS
Location With
other Hotels
No. of Respondents Percentage
Highly Dissatisfied 10 3.6
Dissatisfied 14 5.0
Moderate 57 20.4
Satisfied 134 47.9
Highly Satisfied 65 23.2
Total 280 100.0
Source: Primary Data
Interpretation:-
The above table interprets the respondent’s opinion on location of SASG
compared with other hotels. 47.9% of the respondents were satisfied with the
locations, 23.2% were highly satisfied, 20.4% neither satisfied nor dissatisfied they
have opined as moderate, 3.6% were highly dissatisfied and another 5% were
dissatisfied.
CHART :68 CHART SHOWING THE RESPONDENTS’ OPINION TOWARDS
LOCATION COMPARED WITH OTHER HOTELS

202
TABLE :69
TABLE SHOWING THE RESPONDENTS’ OPINION TOWARDS HEALTH RELATED ISSUES AFTER CONSUMING FOOD IN SASG
Health related Issues No. of Respondents Percentage
Yes 67 23.9
No 213 76.1
Total 280 100.0
Source: Primary Data
Interpretation:-
The above table exhibits the respondent’s opinion towards health related
issues after consuming food in SASG. Majority of the respondents i.e. 76.1% did not
have any health related issues after consuming food in SASG and 23.9% of them had
told that they had certain issues.
CHART :69 CHART SHOWING THE RESPONDENTS’ OPINION TOWARDS HEALTH
RELATED ISSUES AFTER CONSUMING FOOD IN SASG

203
TABLE :70
TABLE SHOWING THE RESPONDENTS’ OPINION TOWARDS FUTURE VISIT TO THE HOTEL
Future visit to the hotel No. of Respondents Percentage
Yes 234 83.6
No 46 16.4
Total 280 100.0
Source: Primary Data
Interpretation:-
The above table analyses the respondent’s opinion towards
future visit to the hotel. Majority of the respondents i.e. 83.6% of the respondents
were sure to visit SASG in the future and 16. 4% of the respondents told that they
would not visit again.
CHART :70 CHART SHOWING THE RESPONDENTS’ OPINION TOWARDS FUTURE
VISIT TO THE HOTEL
204
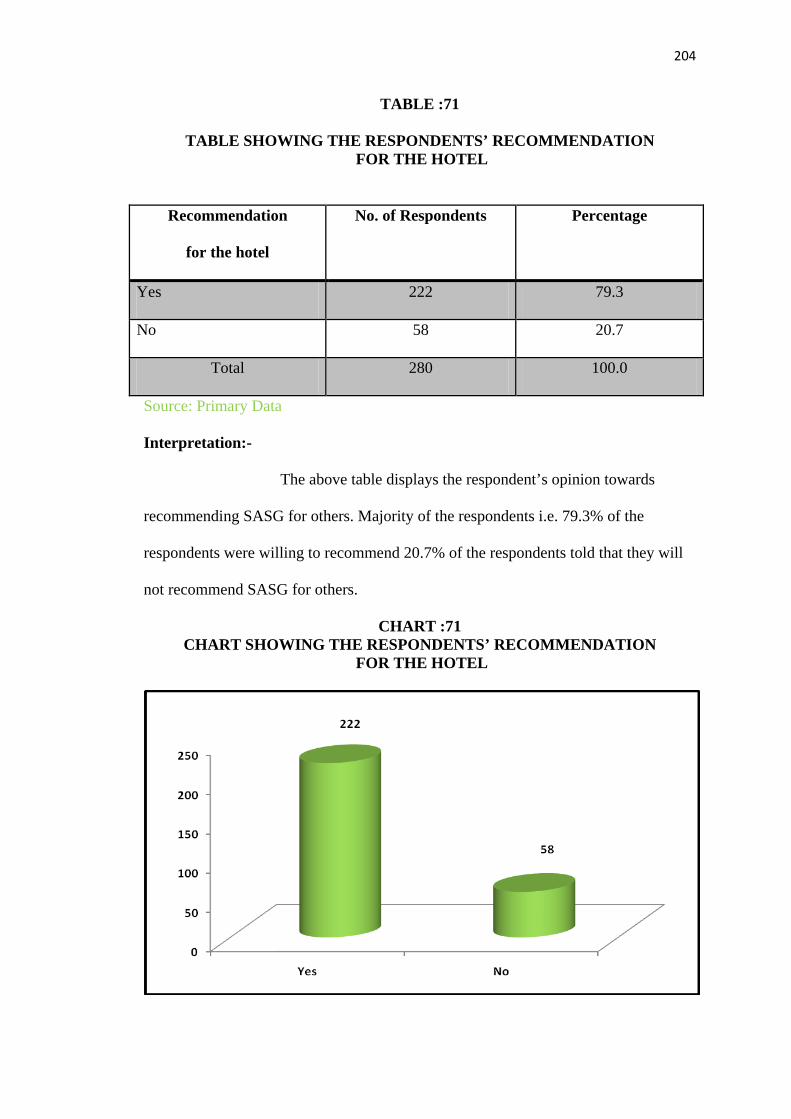
TABLE :71
TABLE SHOWING THE RESPONDENTS’ RECOMMENDATION FOR THE HOTEL
Recommendation
for the hotel
No. of Respondents Percentage
Yes 222 79.3
No 58 20.7
Total 280 100.0
Source: Primary Data
Interpretation:-
The above table displays the respondent’s opinion towards
recommending SASG for others. Majority of the respondents i.e. 79.3% of the
respondents were willing to recommend 20.7% of the respondents told that they will
not recommend SASG for others.
CHART :71 CHART SHOWING THE RESPONDENTS’ RECOMMENDATION
FOR THE HOTEL

156
TABLE NO: 31 TABLE SHOWING THE RESPONDENTS OPINION TOWARDS THE QUALITY
S.No
Attributes of Quality
Highly Satisfied Satisfied Moderate Dis Satisfied Highly Dissatisfied Total No. of Resp
Percentage
No. of Resp
Percent age
No. of Resp
Percent age
No. of Resp
Percent age
No. of Resp
Percent age
No. of Resp
Percent age
1 Coffee/Tea 138 49.3 119 42.5 15 5.4 1 0.4 7 2.5 280 100
2 Breakfast Items 78 27.9 177 63.2 13 4.6 3 1.1 9 3.2 280 100
3 Midday Items 69 24.6 142 50.7 44 15.7 4 1.4 21 7.5 280 100
4 Dinner Items 83 29.6 151 53.9 21 7.5 7 2.5 18 6.4 280 100
5 Chat Items 62 22.1 113 40.4 60 21.4 17 6.1 28 10.0 280 100
6 Salads/Juices 62 22.1 135 48.2 45 16.1 16 5.7 22 7.9 280 100
7 Ice creams 63 22.5 138 49.3 48 17.1 8 2.9 23 8.2 280 100
8 Chinese Items 55 19.6 99 35.4 60 21.4 34 12.1 32 11.4 280 100
9 North Indian Dishes 59 21.1 120 42.9 53 18.9 18 6.4 30 10.7 280 100
10 Sweets 78 27.9 125 44.6 44 15.7 12 4.3 21 7.5 280 100
11 Savories 58 20.7 133 47.5 44 15.7 9 3.2 36 12.9 280 100
Interpretation:
Most of the respondents are satisfied with the quality of the various items like Breakfast (63.2%), Midday Items (50.7%), Dinner Items (53.9%), Chat Items (40.4%), Salads (48.2%), Ice Creams (49.3%), Chinese Items (35.4%), North Indian (42.9%), Sweets (44.6%) and Savories (47.5%).
The customers are highly satisfied with the quality of Coffee & Tea with 49.3%.

157
CHART NO: 31 CHART SHOWING THE RESPONDENTS OPINION TOWARDS THE QUALITY
0
10
20
30
40
50
60
70
Coffee/Tea Breakfast Items
Midday Items Dinner Items Chat Items Salads/Juices Ice creams Chinese Items North Indian Dishes
Sweets Savories
HS S M DS HDS
158
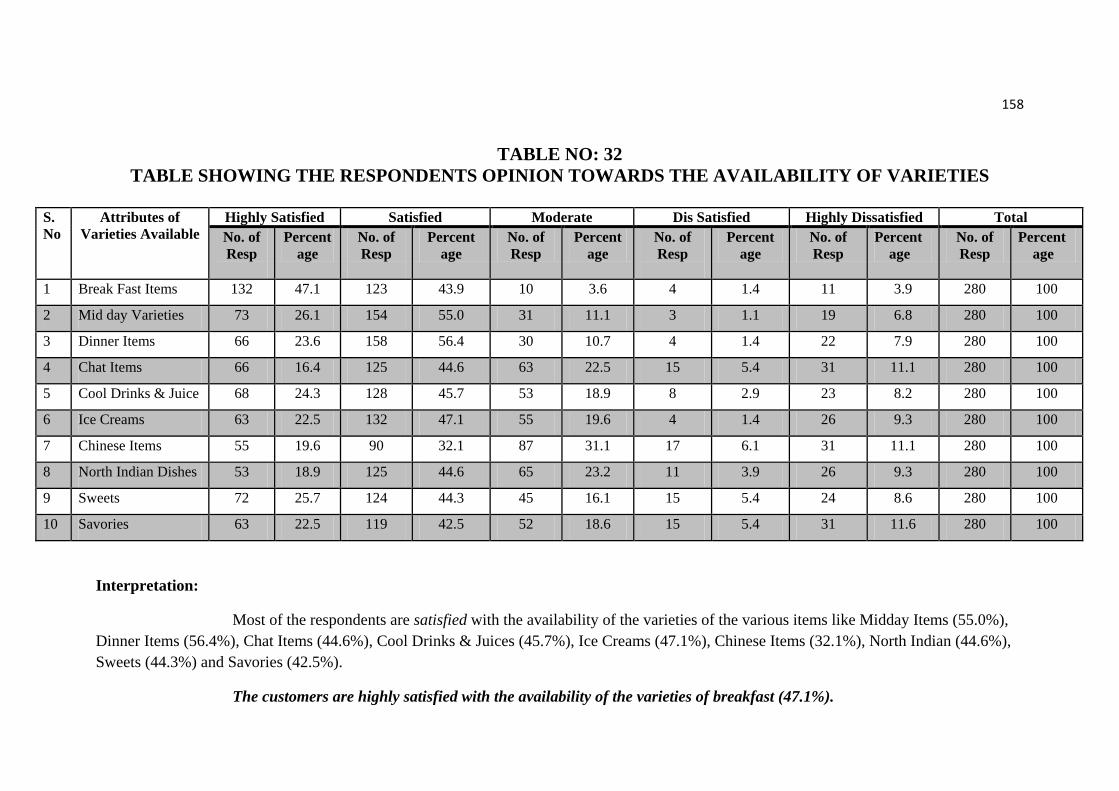
TABLE NO: 32 TABLE SHOWING THE RESPONDENTS OPINION TOWARDS THE AVAILABILITY OF VARIETIES
S.No
Attributes of Varieties Available
Highly Satisfied Satisfied Moderate Dis Satisfied Highly Dissatisfied Total No. of Resp
Percentage
No. of Resp
Percent age
No. of Resp
Percent age
No. of Resp
Percent age
No. of Resp
Percent age
No. of Resp
Percent age
1 Break Fast Items 132 47.1 123 43.9 10 3.6 4 1.4 11 3.9 280 100
2 Mid day Varieties 73 26.1 154 55.0 31 11.1 3 1.1 19 6.8 280 100
3 Dinner Items 66 23.6 158 56.4 30 10.7 4 1.4 22 7.9 280 100
4 Chat Items 66 16.4 125 44.6 63 22.5 15 5.4 31 11.1 280 100
5 Cool Drinks & Juice 68 24.3 128 45.7 53 18.9 8 2.9 23 8.2 280 100
6 Ice Creams 63 22.5 132 47.1 55 19.6 4 1.4 26 9.3 280 100
7 Chinese Items 55 19.6 90 32.1 87 31.1 17 6.1 31 11.1 280 100
8 North Indian Dishes 53 18.9 125 44.6 65 23.2 11 3.9 26 9.3 280 100
9 Sweets 72 25.7 124 44.3 45 16.1 15 5.4 24 8.6 280 100
10 Savories 63 22.5 119 42.5 52 18.6 15 5.4 31 11.6 280 100
Interpretation:
Most of the respondents are satisfied with the availability of the varieties of the various items like Midday Items (55.0%), Dinner Items (56.4%), Chat Items (44.6%), Cool Drinks & Juices (45.7%), Ice Creams (47.1%), Chinese Items (32.1%), North Indian (44.6%), Sweets (44.3%) and Savories (42.5%).
The customers are highly satisfied with the availability of the varieties of breakfast (47.1%).

159
CHART NO: 32 CHART SHOWING THE RESPONDENTS OPINION TOWARDS THE AVAILABILITY OF VARIETIES
0
20
40
60
80
100
120
140
160
180
Break Fast Item Midday Varieties
Dinner Items Chat Items Cool Drinks & Juice
Ice Cream Chinese Items North Indian Dishes
Sweets Savories
HS S M DS HDS

160
TABLE NO: 33 TABLE SHOWING THE RESPONDENTS OPINION TOWARDS NEATNESS & CLEANLINESS
S.No
Attributes of Neatness & Cleanliness
Highly Satisfied Satisfied Moderate Dis Satisfied Highly Dissatisfied Total No. of Resp
Percentage
No. of Resp
Percent age
No. of Resp
Percent age
No. of Resp
Percent age
No. of Resp
Percent age
No. of Resp
Percent Age
1 Vessels 119 42.5 109 38.9 33 11.8 3 1.1 16 5.7 280 100
2 Table 101 36.1 117 41.8 37 13.2 9 3.2 16 5.7 280 100
3 Floor 91 32.5 109 38.9 48 17.1 12 4.3 20 7.1 280 100
4 Waiters 81 28.9 115 41.1 51 18.2 9 3.2 24 8.6 280 100
5 Toilets 61 21.8 133 47.5 51 18.2 7 2.5 28 10.0 280 100
6 Towels 71 25.4 107 38.2 52 18.6 19 6.8 31 11.1 280 100
7 Napkins 68 24.3 112 40.0 50 17.9 23 8.2 27 9.6 280 100
8 Wash Area 83 29.6 108 38.6 46 16.4 14 5.0 29 10.4 280 100
9 Drinking Water 101 36.1 116 41.4 33 11.8 12 4.3 18 6.4 280 100
10 Furniture 95 33.9 99 35.4 40 14.3 19 6.8 27 9.6 280 100
Interpretation:
Most of the respondents are satisfied with the Neatness & Cleanliness of the hotel on various attributes items like Table (41.8%), Floor (38.9%), Waiters (41.1%), Toilets (47.5%), Towels (38.2%), Napkins (40.0%), Wash Area (38.6%), Drinking Water (41.4%), and Furniture (35.4%).
The customers are highly satisfied with the Neatness & Cleanliness of the vessels with 42.5%.
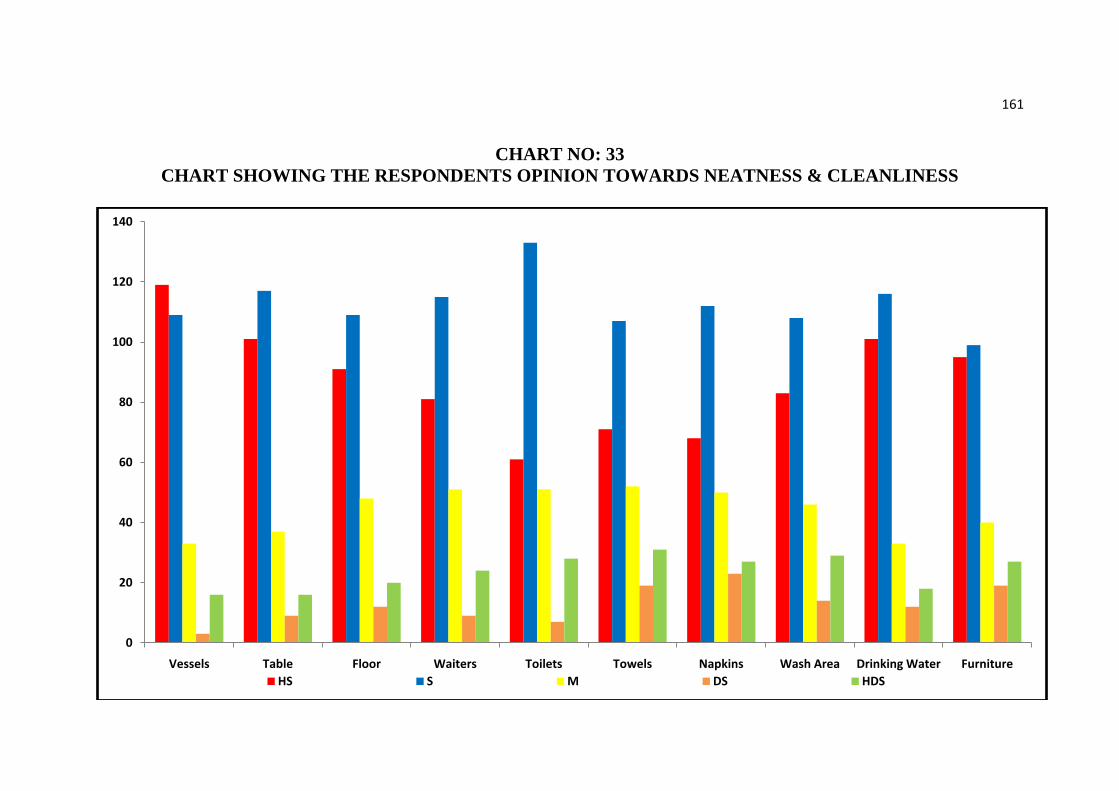
161
CHART NO: 33 CHART SHOWING THE RESPONDENTS OPINION TOWARDS NEATNESS & CLEANLINESS
0
20
40
60
80
100
120
140
Vessels Table Floor Waiters Toilets Towels Napkins Wash Area Drinking Water FurnitureHS S M DS HDS

162
TABLE NO: 34 TABLE SHOWING THE RESPONDENTS OPINION TOWARDS QUANTITY OFFERED
S.No
Attributes of Quantity
Highly Satisfied Satisfied Moderate Dis Satisfied Highly Dissatisfied Total No. of Resp
Percentage
No. of Resp
Percent age
No. of Resp
Percent age
No. of Resp
Percent age
No. of Resp
Percent age
No. of Resp
Percent age
1 Break Fast Items 93 33.2 123 43.9 36 12.9 10 3.6 18 6.4 280 100
2 Mid day Items 63 22.5 123 43.9 47 16.8 12 4.3 35 12.5 280 100
3 Dinner 66 23.6 134 47.9 38 13.6 15 5.4 27 9.6 280 100
4 Chat Items 56 20.0 109 38.9 55 19.6 19 6.8 41 14.6 280 100
5 Juice 68 24.3 108 38.6 53 18.9 16 5.7 35 12.5 280 100
6 Ice creams 68 24.3 113 40.4 49 17.5 18 6.4 32 11.4 280 100
7 Coffee / Tea 72 25.7 132 47.1 39 13.9 9 3.2 28 10.0 280 100
8 Sweets 74 26.4 115 41.1 48 17.1 13 4.6 30 10.7 280 100
9 Savories 68 24.3 118 42.1 45 16.1 14 5.0 35 12.5 280 100
10 Chinese Items 67 23.9 87 31.1 62 22.1 25 8.9 39 13.9 280 100
11 North Indian Items 64 22.9 105 37.5 53 18.9 17 6.1 41 14.6 280 100
Interpretation:
Most of the respondents are satisfied with the quantity offered by the hotel for the items like Breakfast (43.9%), Midday Items (43.9%), Dinner Items (47.9%), Chat Items (38.9%), Juices (38.6%), Ice Creams (40.4%), Coffee & Tea (47.1%), Sweets (41.1%), Savories (42.1%), Chinese Items (31.1%) and North Indian (37.5%).

163
CHART NO: 34 CHART SHOWING THE RESPONDENTS OPINION TOWARDS QUANTITY OFFERED
0
20
40
60
80
100
120
140
160
Break Fast Items
Midday Items Dinner Items Chat Items Juice Ice Creams Coffee / Tea Sweets Savories Chinese Items North Indian DishesHS S M DS HDS

164
TABLE NO: 35 TABLE SHOWING THE RESPONDENTS OPINION TOWARDS TASTE
S.No
Attributes of Taste Highly Satisfied Satisfied Moderate Dis Satisfied Highly Dissatisfied Total No. of Resp
Percentage
No. of Resp
Percent age
No. of Resp
Percent age
No. of Resp
Percent age
No. of Resp
Percent age
No. of Resp
Percent age
1 Break Fast Items 132 47.1 117 41.8 12 4.3 5 1.8 14 5.0 280 100
2 Mid day Varieties 90 32.1 121 43.2 40 14.3 3 1.1 26 9.3 280 100
3 Dinner Items 95 33.9 124 44.3 31 11.1 3 1.1 27 9.6 280 100
4 Chat Items 76 27.1 106 37.9 55 19.6 14 5.0 29 10.4 280 100
5 Cool Drinks 72 25.7 137 48.9 38 13.6 2 0.7 31 11.1 280 100
6 Juice 87 31.1 109 38.9 46 16.4 11 3.9 27 9.6 280 100
7 Chinese Items 68 24.3 110 39.3 47 16.8 21 7.5 34 12.1 280 100
8 North Indian Dishes 77 27.5 111 39.6 47 16.8 10 3.6 35 12.5 280 100
9 Sweets 95 33.9 121 43.2 27 9.6 6 2.1 31 11.1 280 100
10 Savories 76 27.1 136 48.6 32 11.4 9 3.2 27 9.6 280 100
Interpretation:
Most of the respondents are satisfied with the Taste of the various items like Midday Items (43.2%), Dinner Items (44.3%), Chat Items (37.9%), Cool Drinks & Juices (48.9%), Juice (38.9%), Chinese Items (39.3%), North Indian (39.6%), Sweets (43.2%) and Savories (48.6%).
The customers are highly satisfied with the Taste of the breakfast items (47.1%).

165
CHART NO: 35 CHART SHOWING THE RESPONDENTS OPINION TOWARDS TASTE
0
20
40
60
80
100
120
140
160
Break fast Items
Midday Varieties
Dinner Items Chat Items Cool Drinks Juice Chinese Items North Indian Dishes
Sweets Savories
HS S M DS HDS

166
TABLE NO: 36 TABLE SHOWING THE RESPONDENTS OPINION TOWARDS PRICE
S.No
Attributes of Price Highly Satisfied Satisfied Moderate Dis Satisfied Highly Dissatisfied Total No. of Resp
Percentage
No. of Resp
Percent age
No. of Resp
Percent age
No. of Resp
Percent age
No. of Resp
Percent age
No. of Resp
Percent age
1 Break Fast Items 27 9.6 20 7.1 41 14.6 89 31.8 103 36.8 280 100
2 Mid day Varieties 41 14.6 37 13.2 43 15.4 90 32.1 69 24.6 280 100
3 Dinner Items 35 12.5 25 8.9 49 17.5 95 33.9 76 27.1 280 100
4 Chat Items 41 14.6 37 13.2 48 17.1 92 32.9 62 22.1 280 100
5 Cool Drinks 44 15.7 18 6.4 54 19.3 109 38.9 55 19.6 280 100
6 Ice Creams 40 14.3 19 6.8 54 19.3 103 36.8 64 22.9 280 100
7 Chinese Items 42 15.0 35 12.5 47 16.8 104 37.1 52 18.6 280 100
8 North Indian Dishes 43 15.4 41 14.6 53 18.9 87 31.1 56 20.0 280 100
9 Sweets 42 15.0 24 8.6 45 16.1 111 39.6 58 20.7 280 100
10 Savories 45 16.1 23 8.2 42 15.0 110 39.3 60 21.4 280 100
Interpretation:
Most of the respondents are Dissatisfied with the price of the various items like Midday Items (32.1%), Dinner Items (33.9%), Chat Items (32.9%), Juices (38.9%), Ice Creams (36.8%), Chinese Items (37.1%), North Indian (31.1%), Sweets (39.6%) and Savories (39.3%).
The customers are highly Dissatisfied with the Price of the breakfast Items (36.8%).
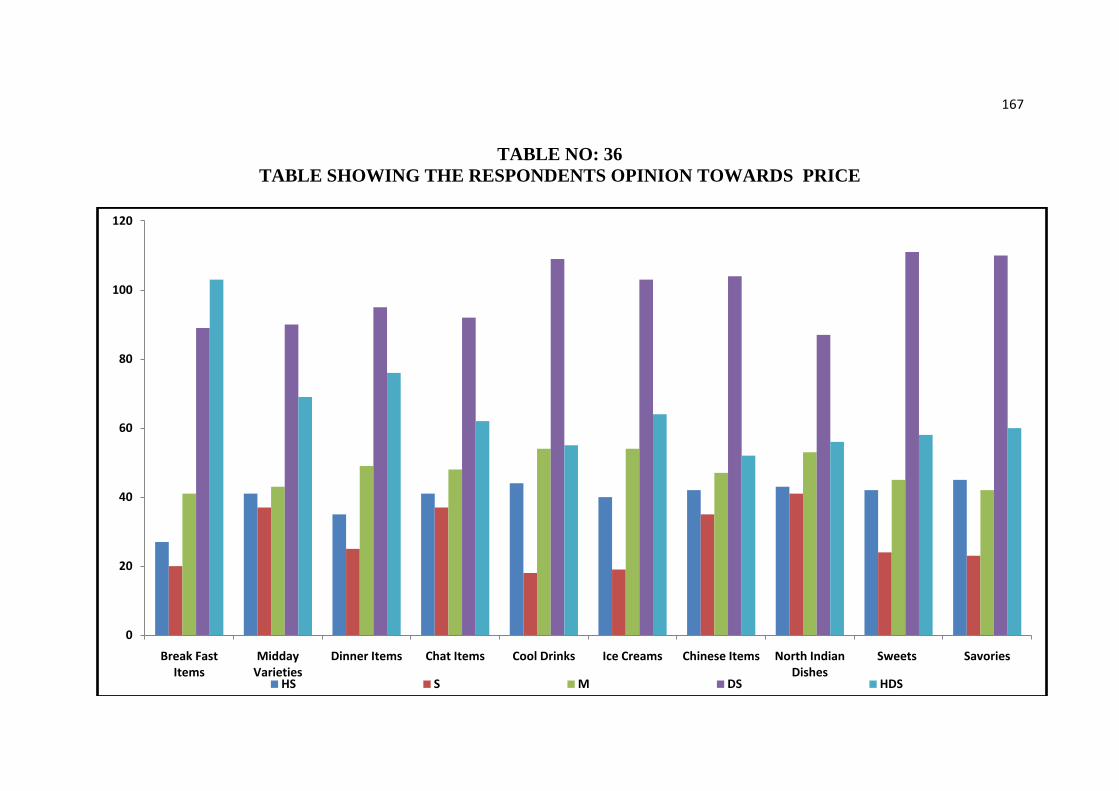
167
TABLE NO: 36 TABLE SHOWING THE RESPONDENTS OPINION TOWARDS PRICE
0
20
40
60
80
100
120
Break Fast Items
Midday Varieties
Dinner Items Chat Items Cool Drinks Ice Creams Chinese Items North Indian Dishes
Sweets Savories
HS S M DS HDS
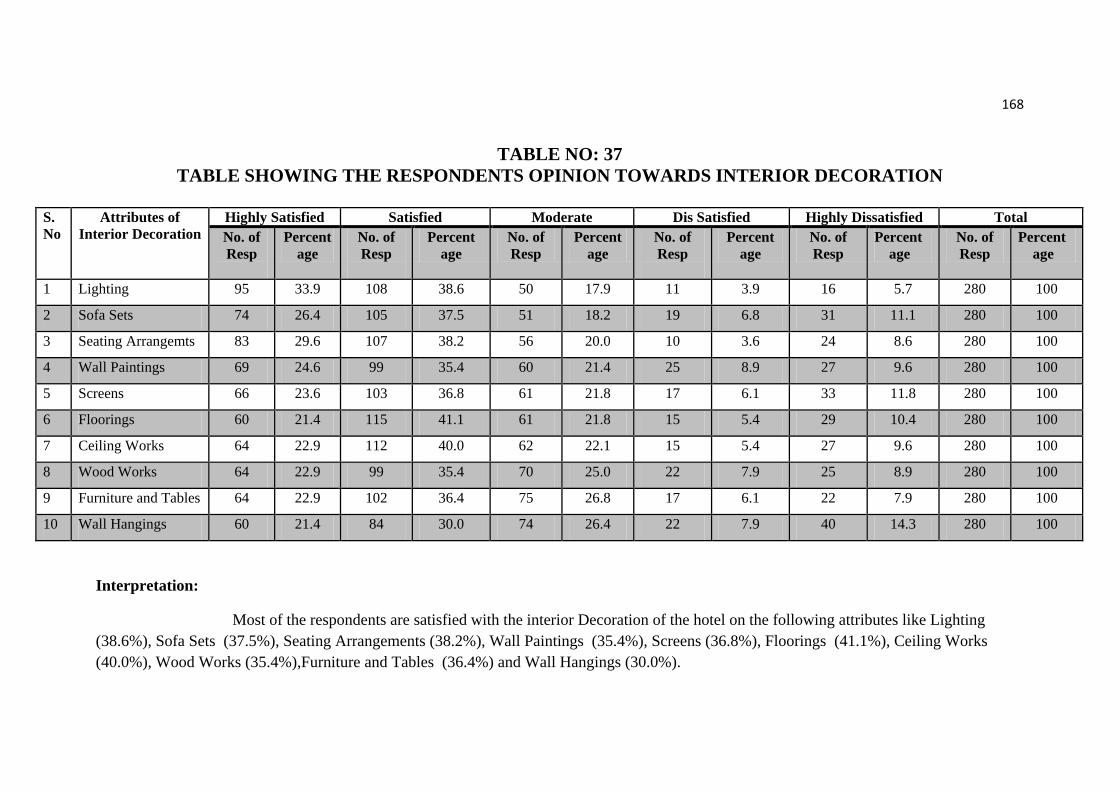
168
TABLE NO: 37 TABLE SHOWING THE RESPONDENTS OPINION TOWARDS INTERIOR DECORATION
S.No
Attributes of Interior Decoration
Highly Satisfied Satisfied Moderate Dis Satisfied Highly Dissatisfied Total No. of Resp
Percentage
No. of Resp
Percent age
No. of Resp
Percent age
No. of Resp
Percent age
No. of Resp
Percent age
No. of Resp
Percent age
1 Lighting 95 33.9 108 38.6 50 17.9 11 3.9 16 5.7 280 100
2 Sofa Sets 74 26.4 105 37.5 51 18.2 19 6.8 31 11.1 280 100
3 Seating Arrangemts 83 29.6 107 38.2 56 20.0 10 3.6 24 8.6 280 100
4 Wall Paintings 69 24.6 99 35.4 60 21.4 25 8.9 27 9.6 280 100
5 Screens 66 23.6 103 36.8 61 21.8 17 6.1 33 11.8 280 100
6 Floorings 60 21.4 115 41.1 61 21.8 15 5.4 29 10.4 280 100
7 Ceiling Works 64 22.9 112 40.0 62 22.1 15 5.4 27 9.6 280 100
8 Wood Works 64 22.9 99 35.4 70 25.0 22 7.9 25 8.9 280 100
9 Furniture and Tables 64 22.9 102 36.4 75 26.8 17 6.1 22 7.9 280 100
10 Wall Hangings 60 21.4 84 30.0 74 26.4 22 7.9 40 14.3 280 100
Interpretation:
Most of the respondents are satisfied with the interior Decoration of the hotel on the following attributes like Lighting (38.6%), Sofa Sets (37.5%), Seating Arrangements (38.2%), Wall Paintings (35.4%), Screens (36.8%), Floorings (41.1%), Ceiling Works (40.0%), Wood Works (35.4%),Furniture and Tables (36.4%) and Wall Hangings (30.0%).
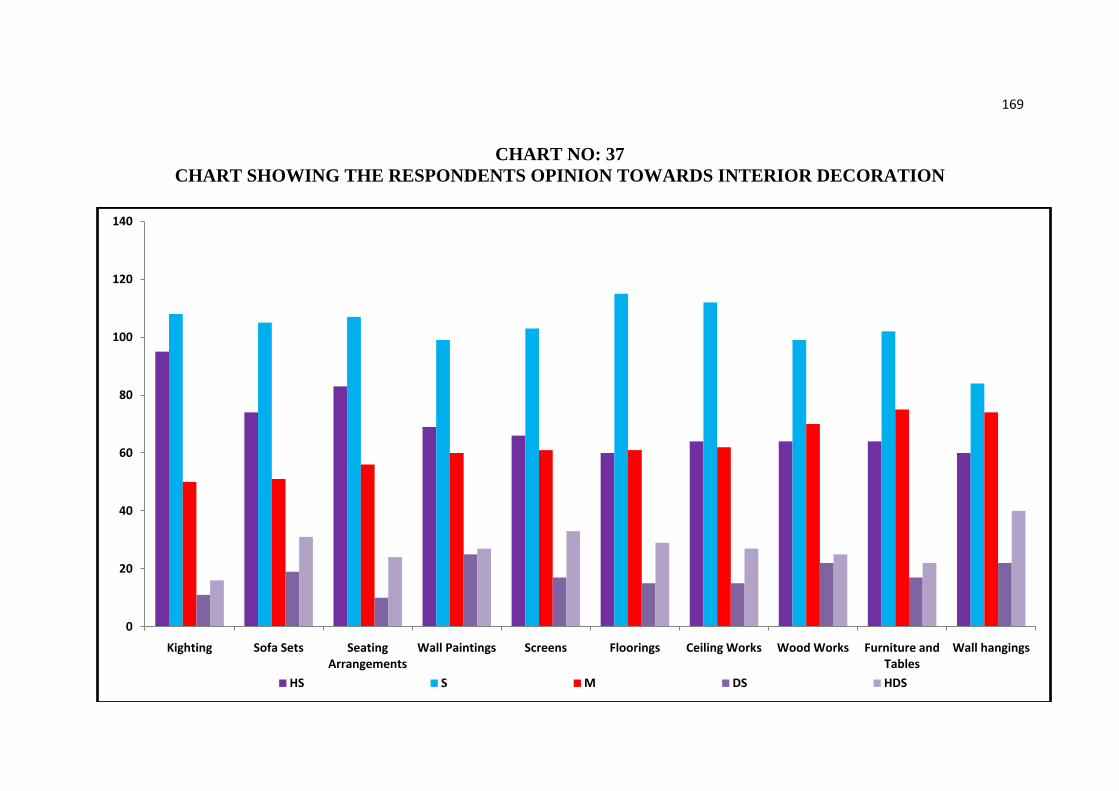
169
CHART NO: 37 CHART SHOWING THE RESPONDENTS OPINION TOWARDS INTERIOR DECORATION
0
20
40
60
80
100
120
140
Kighting Sofa Sets Seating Arrangements
Wall Paintings Screens Floorings Ceiling Works Wood Works Furniture and Tables
Wall hangings
HS S M DS HDS
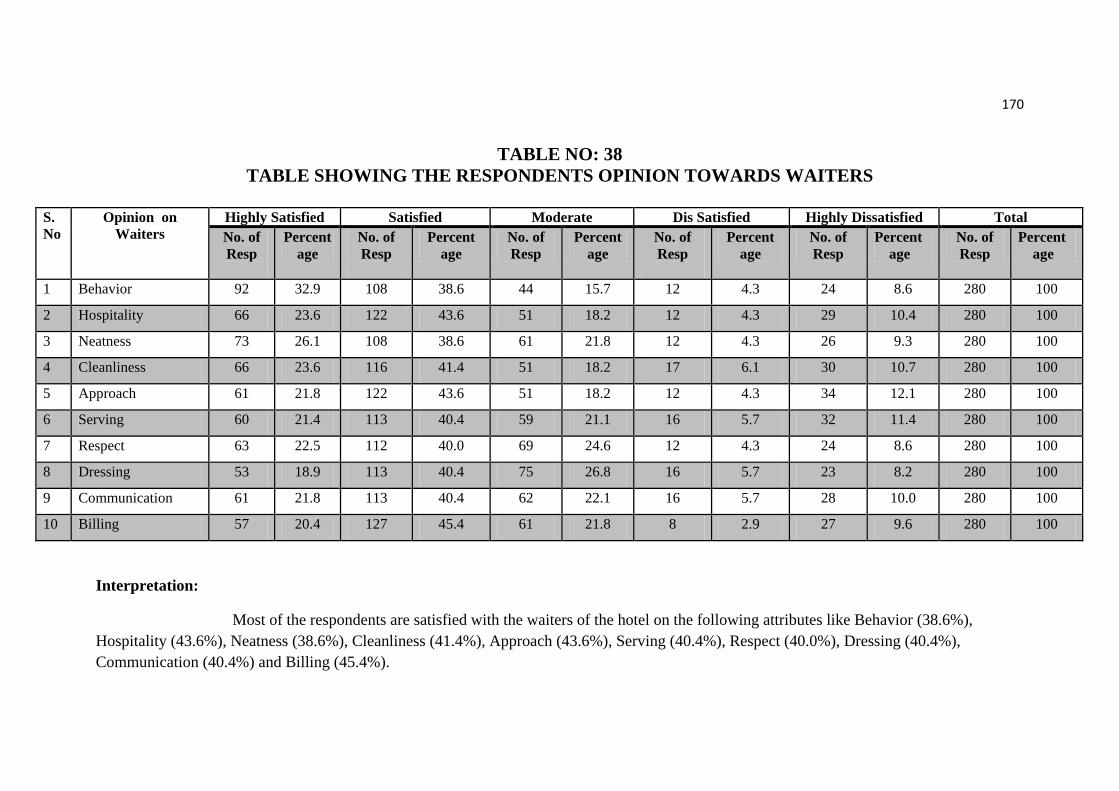
170
TABLE NO: 38 TABLE SHOWING THE RESPONDENTS OPINION TOWARDS WAITERS
S.No
Opinion on Waiters
Highly Satisfied Satisfied Moderate Dis Satisfied Highly Dissatisfied Total No. of Resp
Percentage
No. of Resp
Percent age
No. of Resp
Percent age
No. of Resp
Percent age
No. of Resp
Percent age
No. of Resp
Percent age
1 Behavior 92 32.9 108 38.6 44 15.7 12 4.3 24 8.6 280 100
2 Hospitality 66 23.6 122 43.6 51 18.2 12 4.3 29 10.4 280 100
3 Neatness 73 26.1 108 38.6 61 21.8 12 4.3 26 9.3 280 100
4 Cleanliness 66 23.6 116 41.4 51 18.2 17 6.1 30 10.7 280 100
5 Approach 61 21.8 122 43.6 51 18.2 12 4.3 34 12.1 280 100
6 Serving 60 21.4 113 40.4 59 21.1 16 5.7 32 11.4 280 100
7 Respect 63 22.5 112 40.0 69 24.6 12 4.3 24 8.6 280 100
8 Dressing 53 18.9 113 40.4 75 26.8 16 5.7 23 8.2 280 100
9 Communication 61 21.8 113 40.4 62 22.1 16 5.7 28 10.0 280 100
10 Billing 57 20.4 127 45.4 61 21.8 8 2.9 27 9.6 280 100
Interpretation:
Most of the respondents are satisfied with the waiters of the hotel on the following attributes like Behavior (38.6%), Hospitality (43.6%), Neatness (38.6%), Cleanliness (41.4%), Approach (43.6%), Serving (40.4%), Respect (40.0%), Dressing (40.4%), Communication (40.4%) and Billing (45.4%).

171
CHART NO: 38 CHART SHOWING THE RESPONDENTS OPINION TOWARDS WAITERS
0
20
40
60
80
100
120
140
Behavior Hospitality Neatness Cleanliness Approach Serving Respect Dressing Communication Billing
HS S M DS HDS

152
TABLE :27
TABLE SHOWING THE RESPONDENTS’ DECISION TO VISIT TO THE HOTEL
Visit to hotel No. of Respondents Percentage
Mostly Planned 144 51.4
Mostly Spontaneous 136 48.6
Total 280 100.0
Source: Primary Data
Interpretation:-
The above table exhibits the type of decision to visit the hotel. 51.4% of the
respondents had visited the hotel with prior planning and the remaining 48.6% of the
respondents had not planned and mostly their visits were spontaneous.
CHART :27 CHART SHOWING THE RESPONDENTS’ DECISION
TO VISIT TO THE HOTEL

153
TABLE :28
TABLE SHOWING THE RESPONDENTS’ PREFERRED FOOD
Preferred Food No. of Respondents Percentage
South Indian 212 75.7
North Indian 34 12.1
Chinese 19 6.8
Andhra Style 15 5.4
Total 280 100.0
Source: Primary Data
Interpretation:-
The above table displays the food preferred by the respondents. Majority of
the respondents preferred South Indian food items i.e. 75.7%, followed by North
Indian Food with 12.1%, Chinese with 6.8% and Andhra Style as the least by 5.4%.
CHART :28 CHART SHOWING THE RESPONDENTS’ PREFERRED FOOD

154
TABLE :29
TABLE SHOWING THE RESPONDENTS’ AWARENESS TOWARDS THE AVAILABILITY OF THE MENU CARD
Availability of Menu
Card
No. of Respondents Percentage
Yes 145 51.8
No 135 48.2
Total 280 100.0
Source: Primary Data
Interpretation:-
From the above table it is evident that 51.8% of the respondents had a habit
of asking the menu card and 48.2% of the respondents did not have the habit of asking
for the menu card.
CHART :29 CHART SHOWING THE RESPONDENTS’ AWARENESS TOWARDS
THE AVAILABILITY OF THE MENU CARD

155
TABLE :30
TABLE SHOWING THE RESPONDENTS’ OPINION TOWARDS NOTICING THE TODAY’S SPECIAL
Display of Today’s
special
No. of Respondents Percentage
Yes 214 76.4
No 66 23.6
Total 280 100.0
Source: Primary Data
Interpretation:-
From the above table it is clear that 76.4% of the respondents used to notice
and read the ‘today’s special’, which is displayed at the entrance and the remaining
23.6% did not notice the ‘today’s special’ board.
CHART :30 CHART SHOWING THE RESPONDENTS’ OPINION TOWARDS
NOTICING THE TODAY’S SPECIAL

151
TABLE :26 TABLE SHOWING THE RESPONDENTS’ FAVOURITE BRANCH
95
1825 22
3 3
23
65
11 15
0
10
20
30
40
50
60
70
80
90
100
Gandh(NZ) Saibaba(NZ) Lakshmi(NZ) Cross Cut(NZ) Mettup(NZ) Ramakrish(NZ) Raja Street(SZ) Arts College(SZ) Townhall(SZ) Peoples (SZ)
SOUTH ZONE BRANCHES
NORTH ZONE BRANCHES

125
5.1 PERCENTAGE ANALYSIS
TABLE :1
TABLE SHOWING THE RESPONDENTS’ AGE
Age No. of Respondents Percentage
Up to 20 Years 56 20.0
21 – 30 Years 103 36.8
31 – 40 Years 64 22.9
41 – 50 Years 28 10.0
Above 50 Years 29 10.4
Total 280 100.0
Source: Primary Data
Interpretation:-
From the above table it is clear that 36.8% of the employees fall under the age
group of 21 - 30 years, followed by 22.9% of employees under the age group of 31-
40 years, and the very next 20 % were under the age group of up to 20 years, 41–50
years age group were only 10%, and finally 10.4% of respondents were above 50
years of Age.
CHART :1 CHART SHOWING THE RESPONDENTS’ AGE
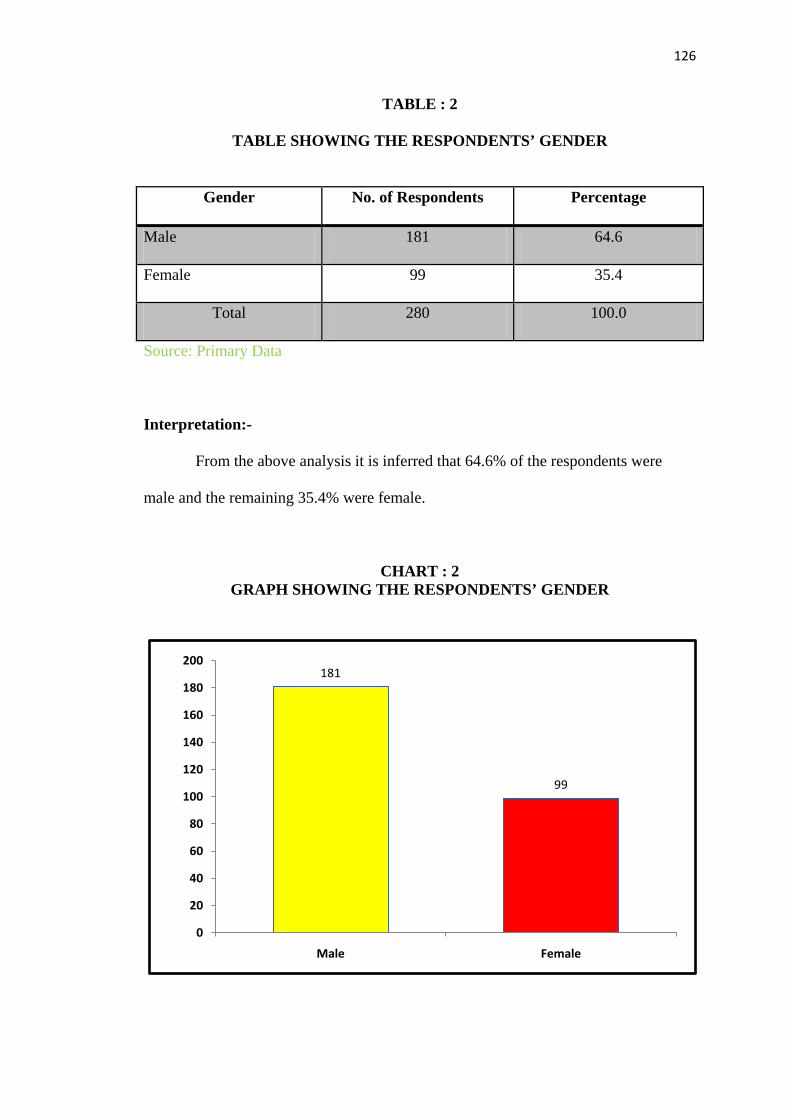
126
TABLE : 2
TABLE SHOWING THE RESPONDENTS’ GENDER
Gender No. of Respondents Percentage
Male 181 64.6
Female 99 35.4
Total 280 100.0
Source: Primary Data
Interpretation:-
From the above analysis it is inferred that 64.6% of the respondents were
male and the remaining 35.4% were female.
CHART : 2 GRAPH SHOWING THE RESPONDENTS’ GENDER
181
99
0
20
40
60
80
100
120
140
160
180
200
Male Female

127
TABLE : 3
TABLE SHOWING THE RESPONDENTS’ EDUCATIONAL QUALIFICATION
Educational
Qualification
No. of Respondents Percentage
School Level 95 33.9
Graduation 123 43.9
Post Graduation 62 22.1
Total 280 100.0
Source: Primary Data
Interpretation:-
The above analysis shows the respondent’s educational qualification; where
43.9 % of the respondents had completed their graduation, 33.9% had completed their
schooling and the remaining 22.1% have done their post graduation.
CHART : 3 CHART SHOWING THE RESPONDENTS’
EDUCATIONAL QUALIFICATION

128
TABLE : 4
TABLE SHOWING THE RESPONDENTS’ OCCUPATION
Occupation No. of Respondents Percentage
Salaried 93 33.2
Self - Employed 103 36.8
Professional 42 15.0
Student 42 15.0
Total 280 100.0
Source: Primary Data
Interpretation:-
The above table shows the respondents’ occupation. 36.8% of the
respondents were self-employed, 33.2% were salaried and the remaining 15% of
respondents were under the category professional and students.
CHART : 4 CHART SHOWING THE RESPONDENTS’ OCCUPATION
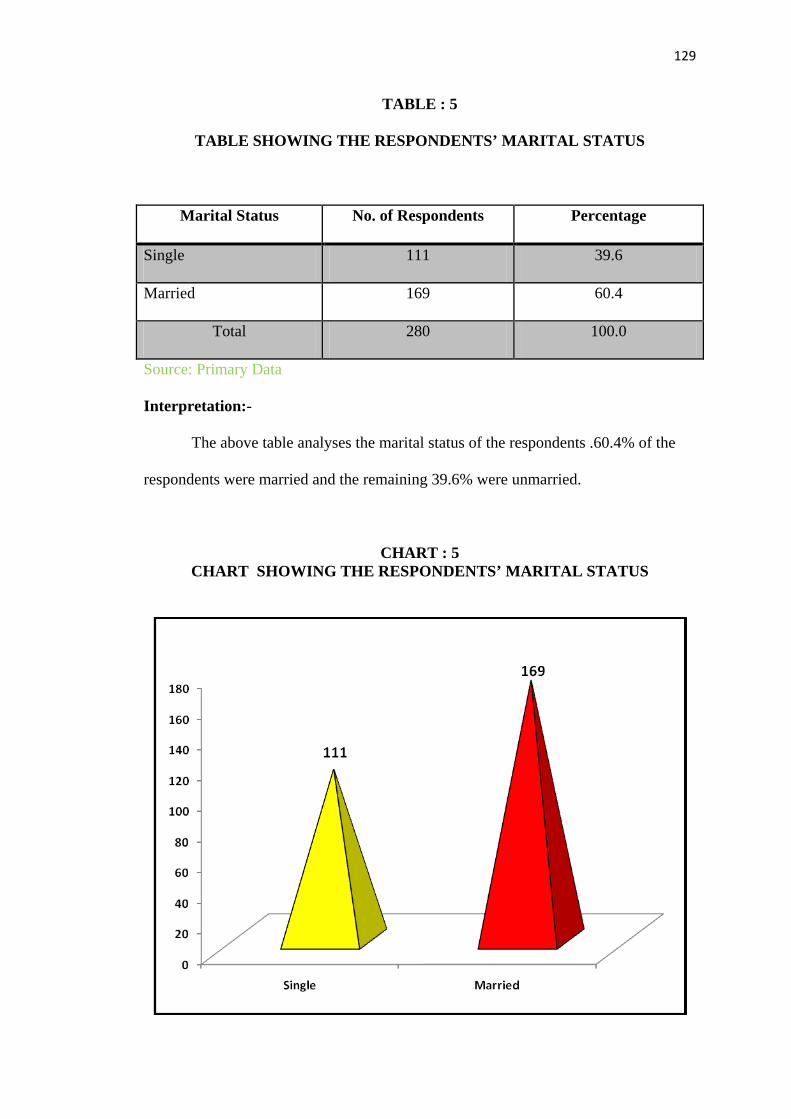
129
TABLE : 5
TABLE SHOWING THE RESPONDENTS’ MARITAL STATUS
Marital Status No. of Respondents Percentage
Single 111 39.6
Married 169 60.4
Total 280 100.0
Source: Primary Data
Interpretation:-
The above table analyses the marital status of the respondents .60.4% of the
respondents were married and the remaining 39.6% were unmarried.
CHART : 5 CHART SHOWING THE RESPONDENTS’ MARITAL STATUS

130
TABLE : 6
TABLE SHOWING THE RESPONDENTS’ FAMILY TYPE
Family Type No. of Respondents Percentage
Nuclear Family 172 61.4
Joint Family 108 38.6
Total 280 100.0
Source: Primary Data
Interpretation:-
The above table shows the type of family to which the respondents belong.
61.4% of the respondents live as nuclear family and 38.6 of them were in the joint
family system.
CHART : 6 CHART SHOWING THE RESPONDENTS’ FAMILY TYPE

131
TABLE : 7
TABLE SHOWING THE RESPONDENTS’ FAMILY SIZE
Size of the Family No. of Respondents Percentage
Up to 3 Members 108 38.6
3 – 6 Members 111 39.6
7 – 9 Members 38 13.6
Above 9 Members 23 8.2
Total 280 100.0
Source: Primary Data
Interpretation:-
The above table interprets the respondent’s family size, where 39.6% of the
respondents have a family size of 3-6 members, 38.6% were in the category of up to 3
members, 13.6% of respondents’ family size lies between 7-9 members and the
remaining 8.2% of the respondents’ family size was above 9 members.
CHART : 7 CHART SHOWING THE RESPONDENTS’ FAMILY SIZE

132
TABLE : 8
TABLE SHOWING THE NUMBER OF CHILDRENS IN THE FAMILY
No of Children’s
in the Family
No. of Respondents Percentage
One 78 27.9
Two 70 25.0
More than Two 26 9.3
None 106 37.9
Total 280 100.0
Source: Primary Data
Interpretation:-
The above table represents the number of children’s in the respondent’s
family. 37.9% of the respondents have no children at the time of data collection,
27.9% of them have only one child, 25 % of them have two children, and 9.3% of
respondents have more than two children’s in their family.
CHART : 8 CHART SHOWING THE NUMBER OF CHILDRENS IN THE FAMILY
0
20
40
60
80
100
120
One Two More than Two None
7870
26
106
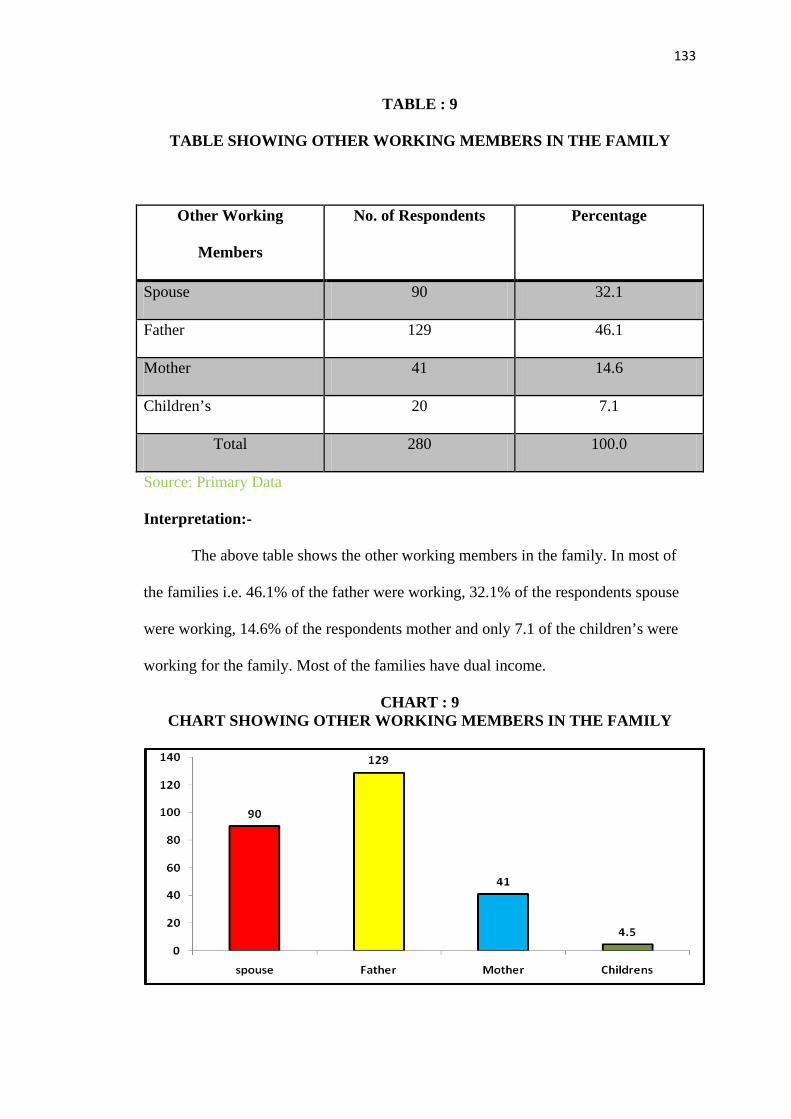
133
TABLE : 9
TABLE SHOWING OTHER WORKING MEMBERS IN THE FAMILY
Other Working
Members
No. of Respondents Percentage
Spouse 90 32.1
Father 129 46.1
Mother 41 14.6
Children’s 20 7.1
Total 280 100.0
Source: Primary Data
Interpretation:-
The above table shows the other working members in the family. In most of
the families i.e. 46.1% of the father were working, 32.1% of the respondents spouse
were working, 14.6% of the respondents mother and only 7.1 of the children’s were
working for the family. Most of the families have dual income.
CHART : 9 CHART SHOWING OTHER WORKING MEMBERS IN THE FAMILY
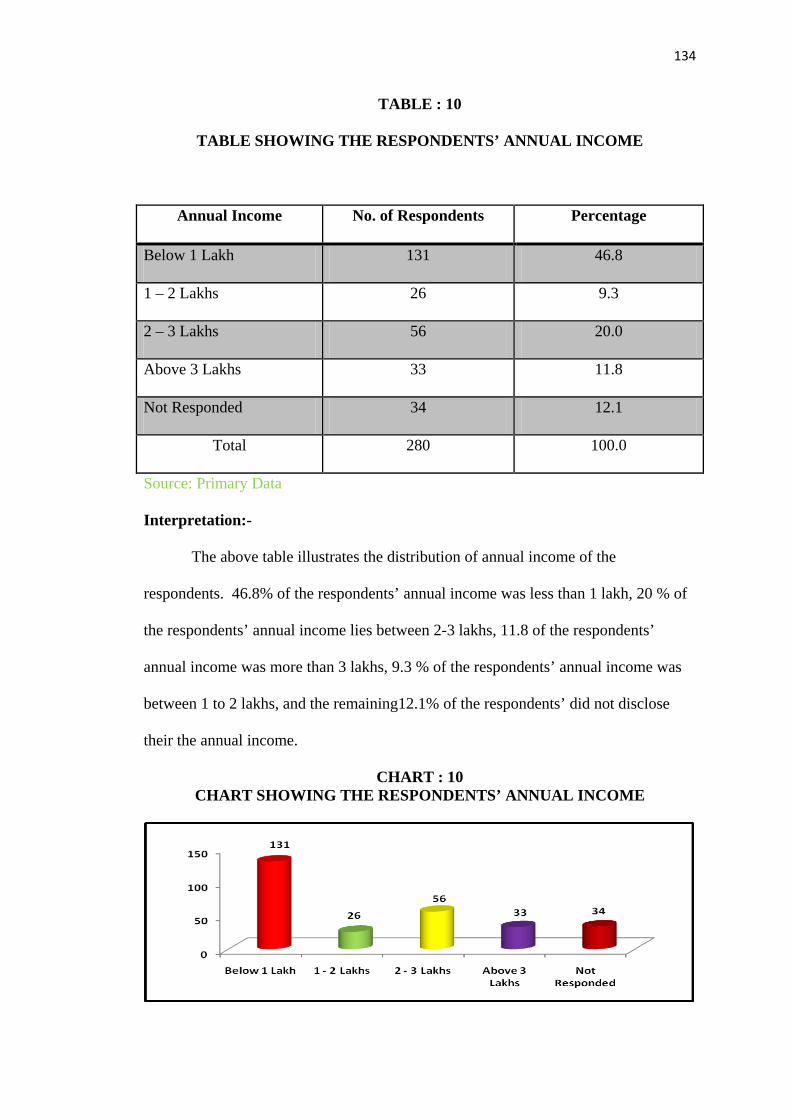
134
TABLE : 10
TABLE SHOWING THE RESPONDENTS’ ANNUAL INCOME
Annual Income No. of Respondents Percentage
Below 1 Lakh 131 46.8
1 – 2 Lakhs 26 9.3
2 – 3 Lakhs 56 20.0
Above 3 Lakhs 33 11.8
Not Responded 34 12.1
Total 280 100.0
Source: Primary Data
Interpretation:-
The above table illustrates the distribution of annual income of the
respondents. 46.8% of the respondents’ annual income was less than 1 lakh, 20 % of
the respondents’ annual income lies between 2-3 lakhs, 11.8 of the respondents’
annual income was more than 3 lakhs, 9.3 % of the respondents’ annual income was
between 1 to 2 lakhs, and the remaining12.1% of the respondents’ did not disclose
their the annual income.
CHART : 10 CHART SHOWING THE RESPONDENTS’ ANNUAL INCOME

135
TABLE : 11
TABLE SHOWING THE RESPONDENTS’ STAY
Stay No. of Respondents Percentage
Own House 148 52.9
Rented House 132 47.1
Total 280 100.0
Source: Primary Data
Interpretation:-
The above table shows the respondents’ stay. It is evident that 52.9% of the
respondents have their own house and 47.1% of them were staying in rented houses.
CHART : 11 CHART SHOWING THE RESPONDENTS’ STAY

136
TABLE : 12
TABLE SHOWING THE VEHICLES OWNED BY THE RESPONDENTS
Type of Vehicle Owned No. of Respondents Percentage
Two Wheeler 153 54.6
Four Wheeler 43 15.4
Both 41 14.6
None 43 15.4
Total 280 100.0
Source: Primary Data
Interpretation: -
The above table displays the vehicles owned by the respondents. 54.6% of the
respondents own two-wheeler, 15.4% of them own four-wheeler, 14.6% have both
two and four-wheelers and 15.4% of the respondents did not own any vehicle.
CHART : 12
CHART SHOWING THE VEHICLES OWNED BY THE RESPONDENTS

137
TABLE : 13
TABLE SHOWING THE CREDIT CARD POSSESSION BY THE RESPONDENTS
Possession of Credit
Card
No. of Respondents Percentage
Yes 98 35.0
No 182 65.0
Total 280 100.0
Source: Primary Data
Interpretation:-
The above table exhibits the possession of credit cards by the respondents.
65% of the respondents do not have any credit card and the remaining 35% of the
respondents have credit cards.
High interest rates, other charges and unnecessary service calls would have
been the various factors to avoid the credit cards.
TABLE : 13 TABLE SHOWING THE CREDIT CARD POSSESSION BY THE
RESPONDENTS
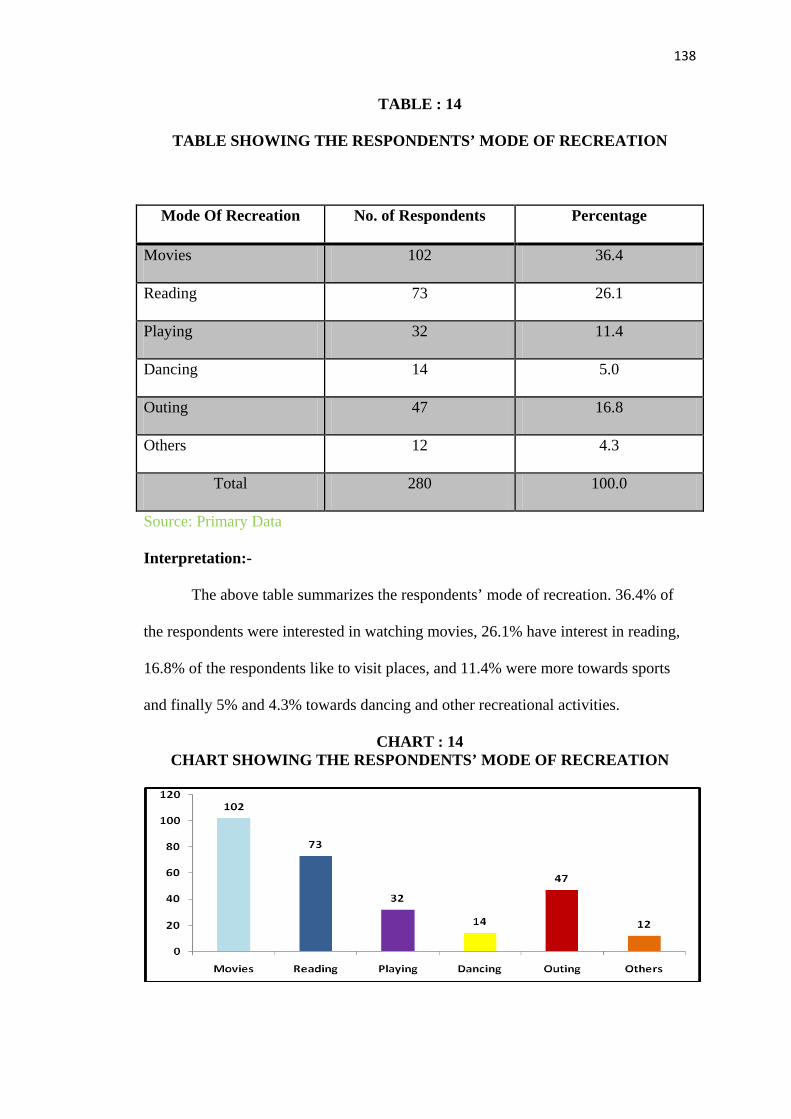
138
TABLE : 14
TABLE SHOWING THE RESPONDENTS’ MODE OF RECREATION
Mode Of Recreation No. of Respondents Percentage
Movies 102 36.4
Reading 73 26.1
Playing 32 11.4
Dancing 14 5.0
Outing 47 16.8
Others 12 4.3
Total 280 100.0
Source: Primary Data
Interpretation:-
The above table summarizes the respondents’ mode of recreation. 36.4% of
the respondents were interested in watching movies, 26.1% have interest in reading,
16.8% of the respondents like to visit places, and 11.4% were more towards sports
and finally 5% and 4.3% towards dancing and other recreational activities.
CHART : 14 CHART SHOWING THE RESPONDENTS’ MODE OF RECREATION

139
TABLE : 15
TABLE SHOWING THE RESPONDENTS’ FREQUENCY OF FOOD INTAKE IN HOTEL
Frequency No. of Respondents Percentage
Once in a Week 57 20.4
Twice in a Week 76 27.1
Once in Two weeks 40 14.3
Once in a Month 57 20.4
Rarely 50 17.9
Total 280 100.0
Source: Primary Data
Interpretation:-
The above table depicts the frequency of food intake in hotels. 27.1% of the
respondents take food in hotels twice a week, 20.4% of the respondents had once in a
week and another 20.4% had once in a month and 17.9% of the respondents used to
take rarely in the hotels and the least 14.3%of the respondents frequency was once in
two weeks.
CHART : 15 CHART SHOWING THE RESPONDENTS’ FREQUENCY
OF FOOD INTAKE IN HOTEL

140
TABLE : 16
TABLE SHOWING THE REASONS FOR OUTSIDE FOOD
Reasons For Outside
Food
No. of Respondents Percentage
Tasty Food 154 55.0
Bachelor 50 17.9
Student 27 9.6
Party 49 17.5
Total 280 100.0
Source: Primary Data
Interpretation:-
The above table analyses the reason to have food in hotels .55% of the
respondents had food in the hotel because of its taste, 17.9% being bachelors, 17.5%
through parties and other functions and 9.6% of the students used to have food in the
hotel.
CHART : 16 CHART SHOWING THE REASONS FOR OUTSIDE FOOD
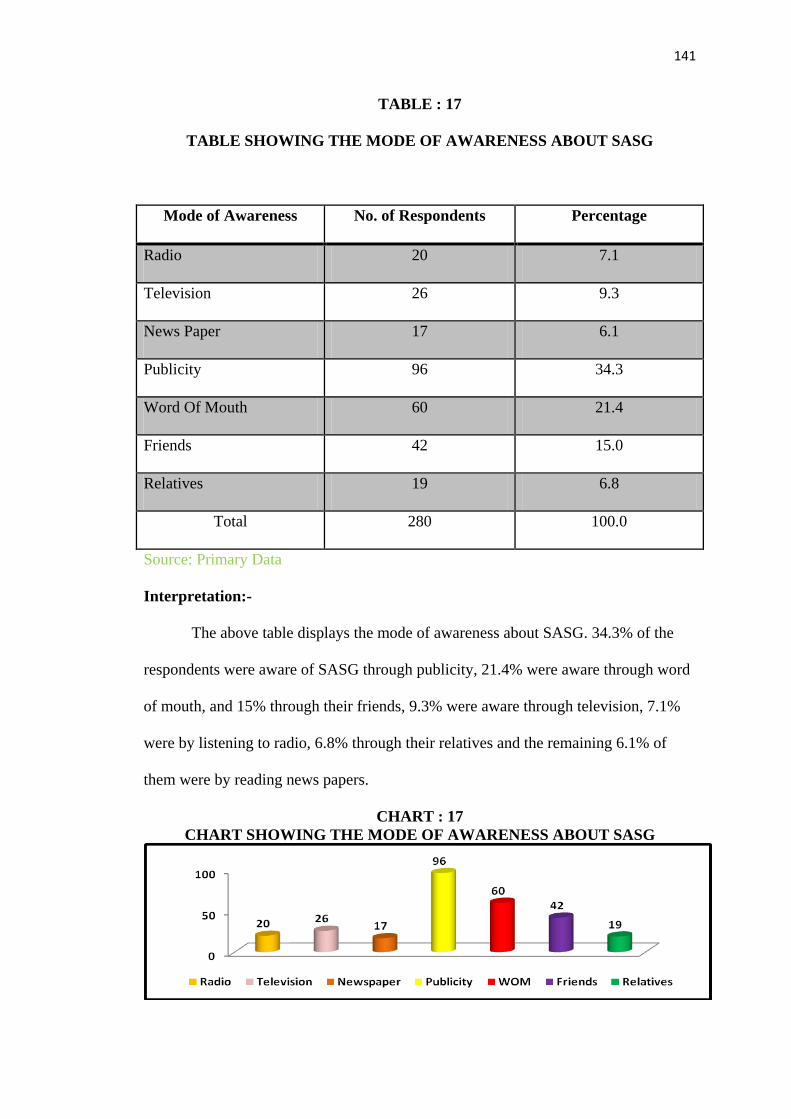
141
TABLE : 17
TABLE SHOWING THE MODE OF AWARENESS ABOUT SASG
Mode of Awareness No. of Respondents Percentage
Radio 20 7.1
Television 26 9.3
News Paper 17 6.1
Publicity 96 34.3
Word Of Mouth 60 21.4
Friends 42 15.0
Relatives 19 6.8
Total 280 100.0
Source: Primary Data
Interpretation:-
The above table displays the mode of awareness about SASG. 34.3% of the
respondents were aware of SASG through publicity, 21.4% were aware through word
of mouth, and 15% through their friends, 9.3% were aware through television, 7.1%
were by listening to radio, 6.8% through their relatives and the remaining 6.1% of
them were by reading news papers.
CHART : 17 CHART SHOWING THE MODE OF AWARENESS ABOUT SASG

142
TABLE : 18
TABLE SHOWING THE MEMBERS INFLUENCING TO VISIT SASG
Members Influencing No. of Respondents Percentage
Spouse 29 10.4
Family 106 37.9
Friends 115 41.1
Colleagues 30 10.7
Total 280 100.0
Source: Primary Data
Interpretation:-
The above table reflects that 41.1% of the respondents were influenced by
their friends to visit the hotel, followed by 37.9% through family members and more
or less equally influenced by colleagues and spouse with 10.7% and 10.4%
respectively.
CHART : 18 CHART SHOWING THE MEMBERS INFLUENCING TO VISIT SASG

143
TABLE : 19
TABLE SHOWING THE RESPONDENTS’ VISIT TO THE HOTEL
Group Accompanying No. of Respondents Percentage
Spouse 35 12.5
Family 154 55.0
Friends 83 29.6
Colleagues 8 2.9
Total 280 100.0
Source: Primary Data
Interpretation:-
The above table shows that the selected respondents were influenced to visit
the hotel by four groups, namely, spouse, family, friends, and colleagues. Among
these four groups, a maximum number of respondents had visited SASG with their
family members, the second group, which accompanies with friends was 29.6%,
12.5% had been with their spouse and finally, and 2.9% had visited with their
colleagues.
CHART : 19 CHART SHOWING THE RESPONDENTS’ VISIT TO THE HOTEL
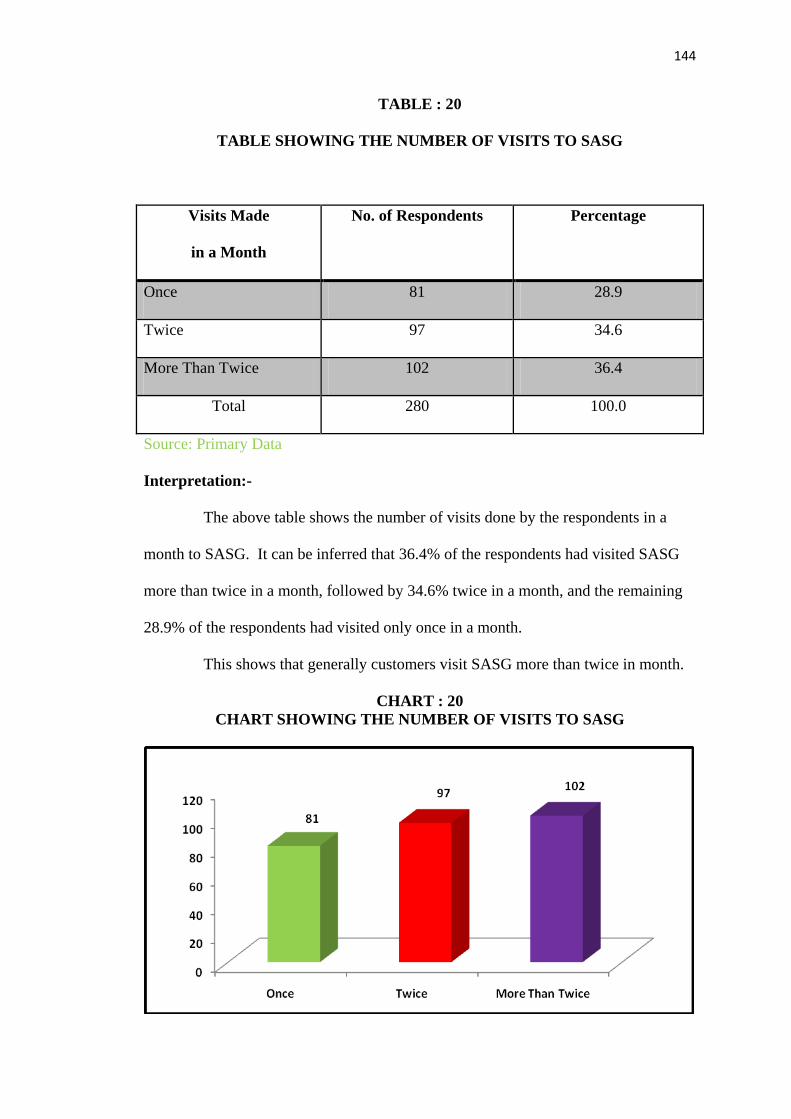
144
TABLE : 20
TABLE SHOWING THE NUMBER OF VISITS TO SASG
Visits Made
in a Month
No. of Respondents Percentage
Once 81 28.9
Twice 97 34.6
More Than Twice 102 36.4
Total 280 100.0
Source: Primary Data
Interpretation:-
The above table shows the number of visits done by the respondents in a
month to SASG. It can be inferred that 36.4% of the respondents had visited SASG
more than twice in a month, followed by 34.6% twice in a month, and the remaining
28.9% of the respondents had visited only once in a month.
This shows that generally customers visit SASG more than twice in month.
CHART : 20 CHART SHOWING THE NUMBER OF VISITS TO SASG

145
TABLE : 21
TABLE SHOWING THE RESPONDENTS’ OPINION TOWARDS THE AVAILABILITY OF THE MENU
Availability of the Menu No. of Respondents Percentage
Yes 194 69.3
No 86 30.7
Total 280 100.0
Source: Primary Data
Interpretation:-
The above table displays the opinion on the availability of the menu items.
69.3% of the respondents had opined that the menu items were available and 30.7% of
the respondents had opined that the menu items were not available
CHART : 21
CHART SHOWING THE RESPONDENTS’ OPINION TOWARDS THE AVAILABILITY OF THE MENU

146
TABLE : 22
TABLE SHOWING THE RESPONDENTS’ AWARENESS TOWARDS SASG BRANCHES
Awareness towards
Branches
No. of Respondents Percentage
Yes 229 81.8
No 51 18.2
Total 280 100.0
Source: Primary Data
Interpretation:-
The above table shows the distribution of the respondent’s awareness
towards the branches of SASG. 81.8% of the respondents were aware of the branches
and 18.2% of the respondents were not aware of the branches of SASG.
CHART : 22
CHART SHOWING THE RESPONDENTS’ AWARENESS TOWARDS SASG BRANCHES

147
TABLE : 23
TABLE SHOWING THE RESPONDENTS’ TIME OF VISIT TO THE HOTEL
Time of Visit No. of Respondents Percentage
Morning 45 16.1
Afternoon 65 23.2
Evening 68 24.3
Night 33 11.8
No Fixed Time 69 24.6
Total 280 100.0
Source: Primary Data
Interpretation:-
The above table exhibits the time of visit by the respondents to SASG. The
table shows that 24.6% of the respondents do not have any fixed time to visit SASG,
24.3% of the respondents prefer to visit in the evening, 23.2% in the afternoon, and
16.1% and 11.89% during the morning and night times.
Thus customers visit the hotel as per their convenience and as and when the
need arises.
CHART : 23 CHART SHOWING THE RESPONDENTS’ TIME OF VISIT TO THE HOTEL
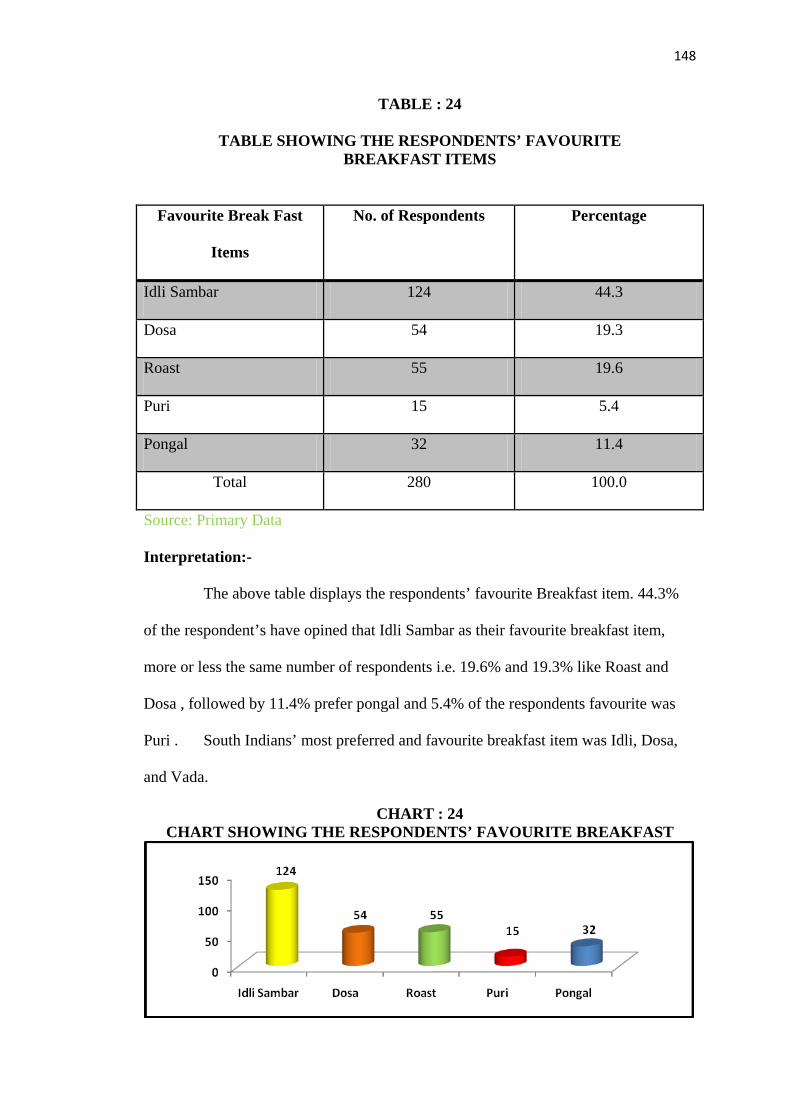
148
TABLE : 24
TABLE SHOWING THE RESPONDENTS’ FAVOURITE BREAKFAST ITEMS
Favourite Break Fast
Items
No. of Respondents Percentage
Idli Sambar 124 44.3
Dosa 54 19.3
Roast 55 19.6
Puri 15 5.4
Pongal 32 11.4
Total 280 100.0
Source: Primary Data
Interpretation:-
The above table displays the respondents’ favourite Breakfast item. 44.3%
of the respondent’s have opined that Idli Sambar as their favourite breakfast item,
more or less the same number of respondents i.e. 19.6% and 19.3% like Roast and
Dosa , followed by 11.4% prefer pongal and 5.4% of the respondents favourite was
Puri . South Indians’ most preferred and favourite breakfast item was Idli, Dosa,
and Vada.
CHART : 24 CHART SHOWING THE RESPONDENTS’ FAVOURITE BREAKFAST

149
TABLE : 25
TABLE SHOWING THE RESPONDENTS’ FAVOURITE MID DAY FOOD ITEMS
Favourite Mid Day Item No. of Respondents Percentage
Meals 116 41.4
Vegetable Biriyani 77 27.5
Curd Rice 24 8.6
Roti 23 8.2
Parotta 40 14.3
Total 280 100.0
Source: Primary Data
Interpretation:-
From the above table it is evident that 41.4% of the respondent’s Favourite
mid-, 27.5% favourite was vegetable biriyani, 14.3% for parotta and closely followed
by 8.6% and 8.2%, prefer curd rice and roti.
CHART : 25 CHART SHOWING THE RESPONDENTS’ FAVOURITE MID DAY FOOD

150
TABLE : 26
TABLE SHOWING THE RESPONDENTS’ FAVOURITE BRANCH
Branches Region Wise No. of Respondents Percentage
Gandhipuram North Zone 95 33.9
Saibaba Colony North Zone 18 6.4
Lakshmi Complex North Zone 25 8.9
Cross Cut Road North Zone 22 7.9
Mettupalayam North Zone 3 1.1
Ramakrishna Hospital North Zone 3 1.1
Raja Street South Zone 23 8.2
Arts College South Zone 65 23.2
Townhall South Zone 11 3.9
Peoples Park South Zone 15 5.4
Total 280 100.0
Source: Primary Data
Interpretation:-
The branches were divided into North zone and South zone. The branches
that come under the North zone were Gandhipuram, Saibaba Colony, Lakshmi
Complex, Cross Cut Road, Mettupalyam, Ramakrishan Hospital and similarly south
zone Have Raja Street, Arts College, Townhall, People Park.
Among the branches of the North Zone, the favourite branch was
Gandhipuram(33.9%) followed by Lakshmi complex(8.9) and in the South Zone the
Arts College(23.2) and followed by Raja Street(8.2) were the favourite branches for
the respondents.